Embed Size (px)
Citation preview
1
SUPPLY CHAIN MANAGEMENT AS A COMPETITIVE
ADVANTAGE IN THE SPANISH GROCERY SECTOR
CRISTINA GIMÉNEZ†
EVA VENTURA†
Universitat Pompeu Fabra and GREL-IET*
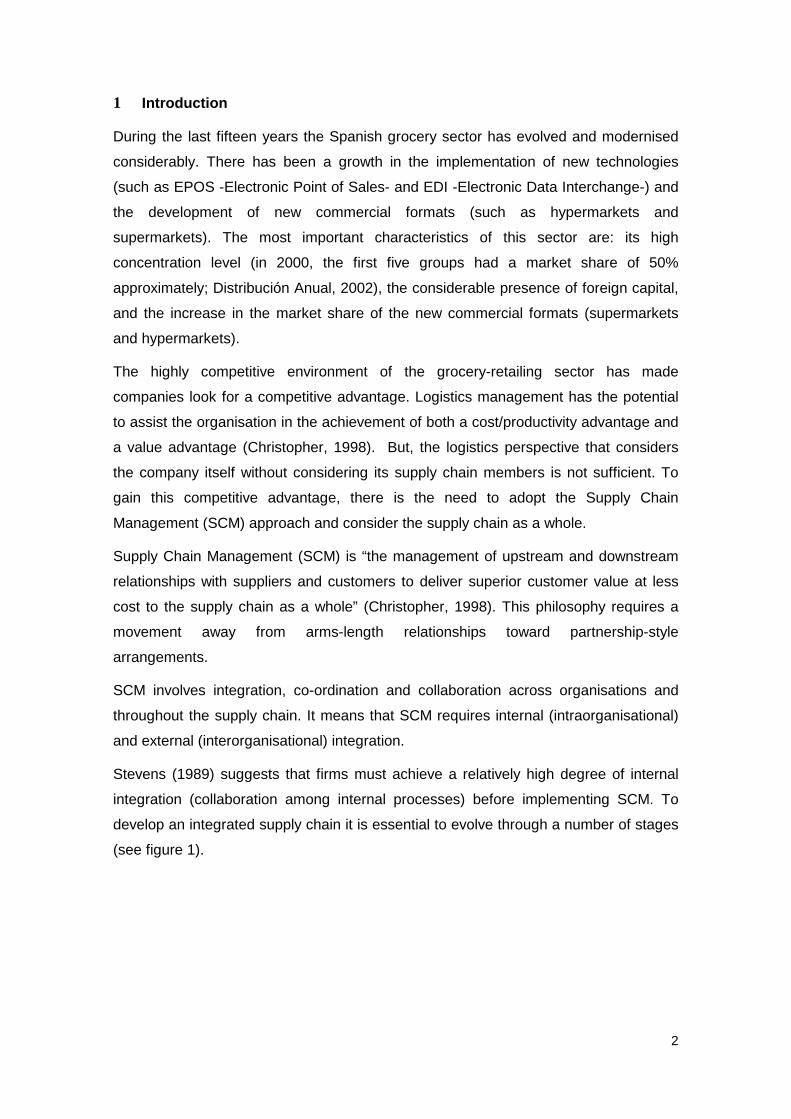
Abstract
Adversarial relationships have long dominated business relationships, butSupply Chain Management (SCM) entails a new perspective. SCMrequires a movement away from arms-length relationships towardpartnership style relations.
SCM involves integration, co-ordination and collaboration acrossorganisations and throughout the supply chain. It means that SCMrequires internal (intraorganisational) and external (interorganisational)integration.
This paper analyses the relationship between internal and externalintegration processes, their effect on firms’ performance and theircontribution to the achievement of a competitive advantage. Performanceimprovements are analysed through costs, stock out and lead timereductions. And, the achievement of a better competitive position ismeasured by comparing the firm’s performance with its competitors’performance. To analyse this, an empirical study has been conducted inthe Spanish grocery sector.
KeywordsSupply Chain Management; Logistics integration processes; Internal and externalintegration; Competitive advantage; Logistics performance
JEL codes: L290,L660,C120,C490
† The authors thank the members of GREL-IET for their comments and suggestions. Eva Ventura acknowledges
financial support from research grants SEC2001-0769 and BEC2000-0983.
* Address for corresponding author: Cristina Giménez Thomsen. Departament d’Economia I Empresa. UPF.
Ramon Trias Fargas, 25-27, 08005 Barcelona, Spain. Phone: 34-935422693. Fax: 34-935421746. E-mail:
2
1 Introduction
During the last fifteen years the Spanish grocery sector has evolved and modernised
considerably. There has been a growth in the implementation of new technologies
(such as EPOS -Electronic Point of Sales- and EDI -Electronic Data Interchange-) and
the development of new commercial formats (such as hypermarkets and
supermarkets). The most important characteristics of this sector are: its high
concentration level (in 2000, the first five groups had a market share of 50%
approximately; Distribución Anual, 2002), the considerable presence of foreign capital,
and the increase in the market share of the new commercial formats (supermarkets
and hypermarkets).
The highly competitive environment of the grocery-retailing sector has made
companies look for a competitive advantage. Logistics management has the potential
to assist the organisation in the achievement of both a cost/productivity advantage and
a value advantage (Christopher, 1998). But, the logistics perspective that considers
the company itself without considering its supply chain members is not sufficient. To
gain this competitive advantage, there is the need to adopt the Supply Chain
Management (SCM) approach and consider the supply chain as a whole.
Supply Chain Management (SCM) is “the management of upstream and downstream
relationships with suppliers and customers to deliver superior customer value at less
cost to the supply chain as a whole” (Christopher, 1998). This philosophy requires a
movement away from arms-length relationships toward partnership-style
arrangements.
SCM involves integration, co-ordination and collaboration across organisations and
throughout the supply chain. It means that SCM requires internal (intraorganisational)
and external (interorganisational) integration.
Stevens (1989) suggests that firms must achieve a relatively high degree of internal
integration (collaboration among internal processes) before implementing SCM. To
develop an integrated supply chain it is essential to evolve through a number of stages
(see figure 1).
3
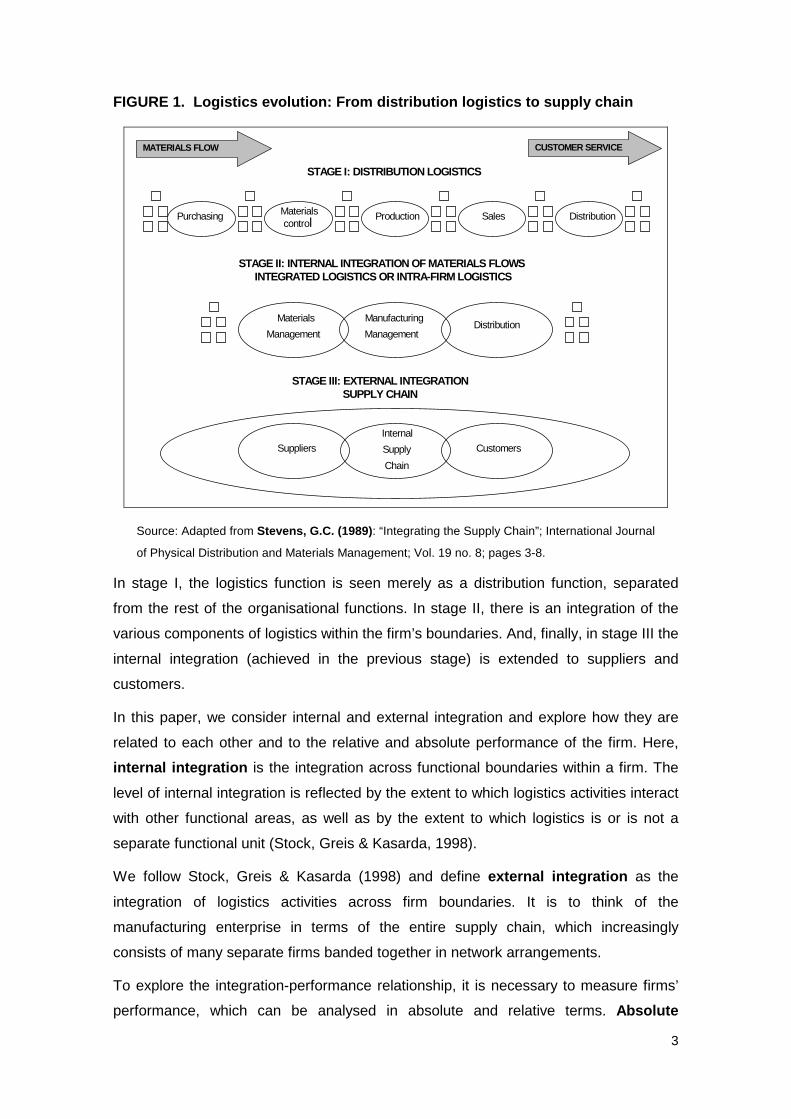
FIGURE 1. Logistics evolution: From distribution logistics to supply chain
CUSTOMER SERVICE
STAGE I: DISTRIBUTION LOGISTICS
Suppliers
Internal
Supply
Chain
Customers
Materials
Management
DistributionSalesProductionMaterialscontrolPurchasing
MATERIALS FLOW
STAGE II: INTERNAL INTEGRATION OF MATERIALS FLOWSINTEGRATED LOGISTICS OR INTRA-FIRM LOGISTICS
STAGE III: EXTERNAL INTEGRATIONSUPPLY CHAIN
Manufacturing
ManagementDistribution
Source: Adapted from Stevens, G.C. (1989): “Integrating the Supply Chain”; International Journal
of Physical Distribution and Materials Management; Vol. 19 no. 8; pages 3-8.
In stage I, the logistics function is seen merely as a distribution function, separated
from the rest of the organisational functions. In stage II, there is an integration of the
various components of logistics within the firm’s boundaries. And, finally, in stage III the
internal integration (achieved in the previous stage) is extended to suppliers and
customers.
In this paper, we consider internal and external integration and explore how they are
related to each other and to the relative and absolute performance of the firm. Here,
internal integration is the integration across functional boundaries within a firm. The
level of internal integration is reflected by the extent to which logistics activities interact
with other functional areas, as well as by the extent to which logistics is or is not a
separate functional unit (Stock, Greis & Kasarda, 1998).
We follow Stock, Greis & Kasarda (1998) and define external integration as the
integration of logistics activities across firm boundaries. It is to think of the
manufacturing enterprise in terms of the entire supply chain, which increasingly
consists of many separate firms banded together in network arrangements.
To explore the integration-performance relationship, it is necessary to measure firms’
performance, which can be analysed in absolute and relative terms. Absolute
4
performance refers to the performance considering the company itself, not taking into
account its competitors’ performance. Costs, stock-outs and lead-time reductions are
some measures of absolute performance. The aim of analysing performance in
absolute terms is to determine which improvements can be achieved by implementing
a logistics integration program.
A firm gains competitive advantage by performing strategically important activities more
cheaply or better than its competitors (Porter, 1985). The contribution of SCM to
gaining a competitive advantage is embedded in the concept of relative performance,
which can be measured by asking the company to compare its performance with that of
its competitors’.
It is necessary to measure performance in absolute and relative terms, because a
logistics integration program can lead to cost reductions, but it may not lead to a better
competitive position.
Many authors claim that Supply Chain Management and information sharing can
substantially involve better supply chain performance (Shapiro, 1984; Scott &
Westbrook, 1991; Byrne & Javad, 1992; Cooper, 1993; Ellram & Cooper, 1993; Gustin,
Stank & Daugherty, 1994; The Global Research Team at Michigan State University,
1995; Christopher, 1998; and Christiansee & Kumar, 2000). But few empirical studies
have been conducted to demonstrate this (Vargas, Cardenas & Mattarranz, 2000, and
Stank, Keller & Daugherty, 2001).
Vargas, Cardenas & Matarranz (2000) analysed the integration activities of leading
Spanish assembly manufacturing firms. Their results showed that Spanish firms rely
more on internal rather than external integration activities as means for achieving
strategic goals. The main conclusion was that logistics integration programs do provide
a competitive and economic advantage, although still at a low potential level. However,
this study has some limitations: First, the simultaneous effect of both levels of
integration was not considered. And, second, the level of internal integration was
determined by variables such as the level of implementation of JIT, TQM (Total Quality
Management) and Kaizen programs, not considering the level of interaction between
functional areas, such as Production and Logistics.
The study of Stank, Keller & Daugherty (2001) is based on the results of a survey
mailed in late 1998 to manufacturers, wholesalers and retailers listed in the Council of
Logistics Management member list. The main conclusions of this study are: (1) internal
and external collaboration are positively correlated, (2) internal collaboration leads to a
better competitive position in some logistics service performance variables (speed,
5
dependability, responsiveness, flexibility and overall customer satisfaction), and (3)
external collaboration does not lead directly to better outcomes in logistics service.
However, this study has three main limitations: (1) Only service elements were
included in the performance construct (any cost element was not included); (2)
performance was only measured in relative terms (absolute performance was not
considered); and (3) a unique external integration level was assigned to each company
(when a company has usually a different level of external integration in each
relationship).
There are other empirical studies that analyse the separated effect of internal or
external integration programs on performance. The studies considering only the
internal integration-performance relationship are Daugherty, Ellinger & Gustin, 1998;
Ellinger, Daugherty & Keller, 2000 and Stank, Daugherty & Ellinger, 2000. And, the
studies analysing only the external integration-performance relationship are:
Daugherty, Sabath & Rogers, 1992; Larson, 1994; Daugherty, Ellinger & Rogers, 1995;
Groves & Valsamakis, 1998; Stank, Crum & Arango, 1999; Stank, Daugherty & Autry,
1999; Ellinger, Taylor & Daugherty, 2000 and Scannell, Vickery & Dröge, 2000.
We plan to contribute to the existing empirical research on the relationship between
SCM and performance by:
1. Analysing performance improvements in absolute and relative terms.
2. Analysing the contribution of both levels of integration (internal and external) to
improving firms’ performance.
3. Including measures of service and cost in the logistics performance constructs.
The paper is organised as follows. Section 2 describes the data, model and statistical
analysis. The results are presented in section 3. And, section 4 concludes. Also, some
details related to the description and previous exploration of the data are gathered in
the Appendix.
2 Data and Model Specification
The research involved an explicative study based on the results of a survey, which was
conducted during the spring-summer of year 2001. The questionnaire was sent to
manufacturers of the Spanish grocery sector. These companies were selected from de
Fomento de la Producción España 25.000 database. We restricted ourselves to the
Manufacturers of the food and perfumery-detergent sectors and chose those
companies with a sales figure in 1999 higher than 30 million euros. Due to the need of
limiting the scope of the study, we focused primarily on the manufacturer-retailer
6
relationships, not considering any other supply chain member or supply chain
relationship within the grocery supply chain (such as third party logistics, wholesalers,
purchasing centres and manufacturers’ suppliers).
The resulting sample had 199 manufacturers. Given the strategic focus of the research,
it was decided to mail questionnaires to the logistics or supply chain executive of each
firm. Early notification of prospective respondents is believed to increase response
rates (Fox, Crask & Kim, 1988). And, accordingly, all companies were telephoned and
asked for permission to mail the questionnaire. From the 199 manufacturers, only one
company refused to participate in the study.
The number of logistics managers who responded to the first mailing was 50. Another
14 responded to a second mailing sent to the 148 managers who had not responded
after four weeks. The total number of responses was 64, which represents a response
rate of 32,3%. Potential participants were asked to provide sensitive and confidential
data about their performance, so the response rate of 32,3% is considered very
satisfactory especially when compared to the response rate of other studies. For
example, Groves & Valsamakis (1998) used data from a survey with a response rate of
15%; Stank, Daugherty & Autry (1999) obtained a 20,2% response rate, and Stank,
Keller & Daugherty (2001) worked with a response rate of 11,5%. Taking into account
sales volumes, we obtained responses from companies that represented 44,06% of the
sample’s sales volume. The characteristics of the companies answering the
questionnaire are shown in table A1 of the Appendix.
We conducted an analysis of non-response bias based on the procedure described in
Armstrong and Overton (1977) and Lambert and Harrington (1990). Responses were
numbered sequentially in the order they were received, and lately responses were
compared with early responses. No noticeable pattern among the variables could be
detected to indicate the existence of a non-response bias. Accordingly, non-response
bias is unlikely to be an issue in interpreting the results of this study.
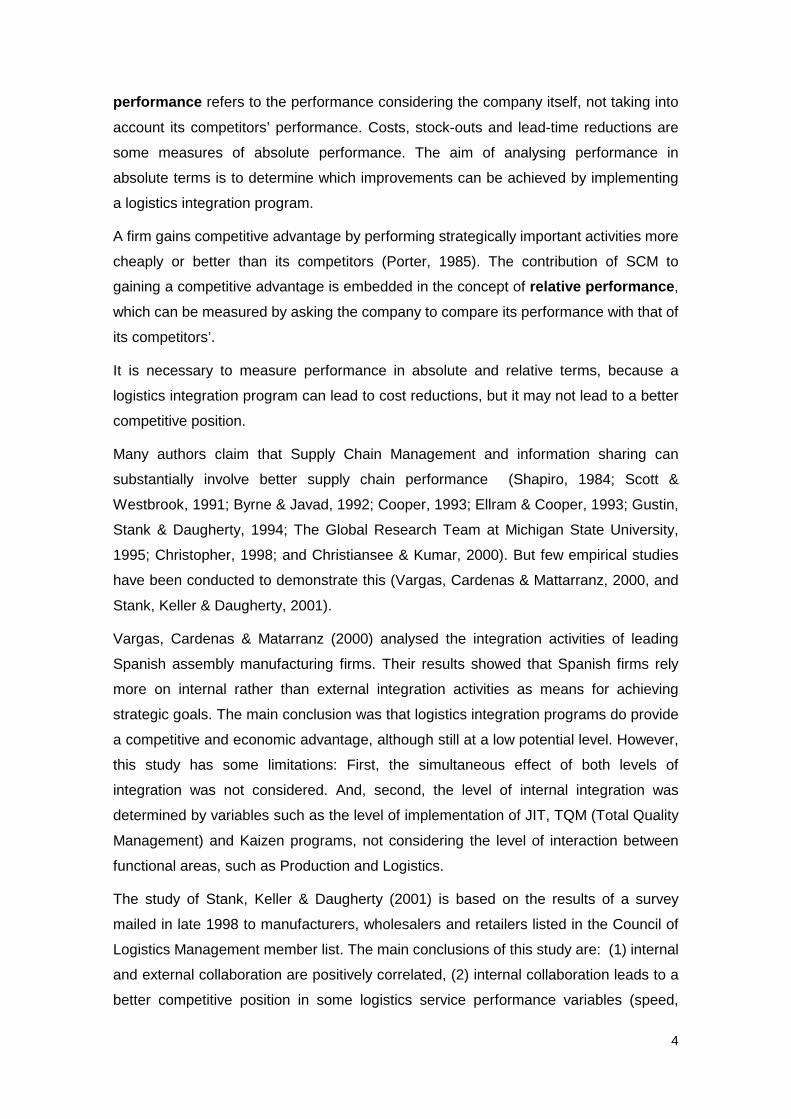
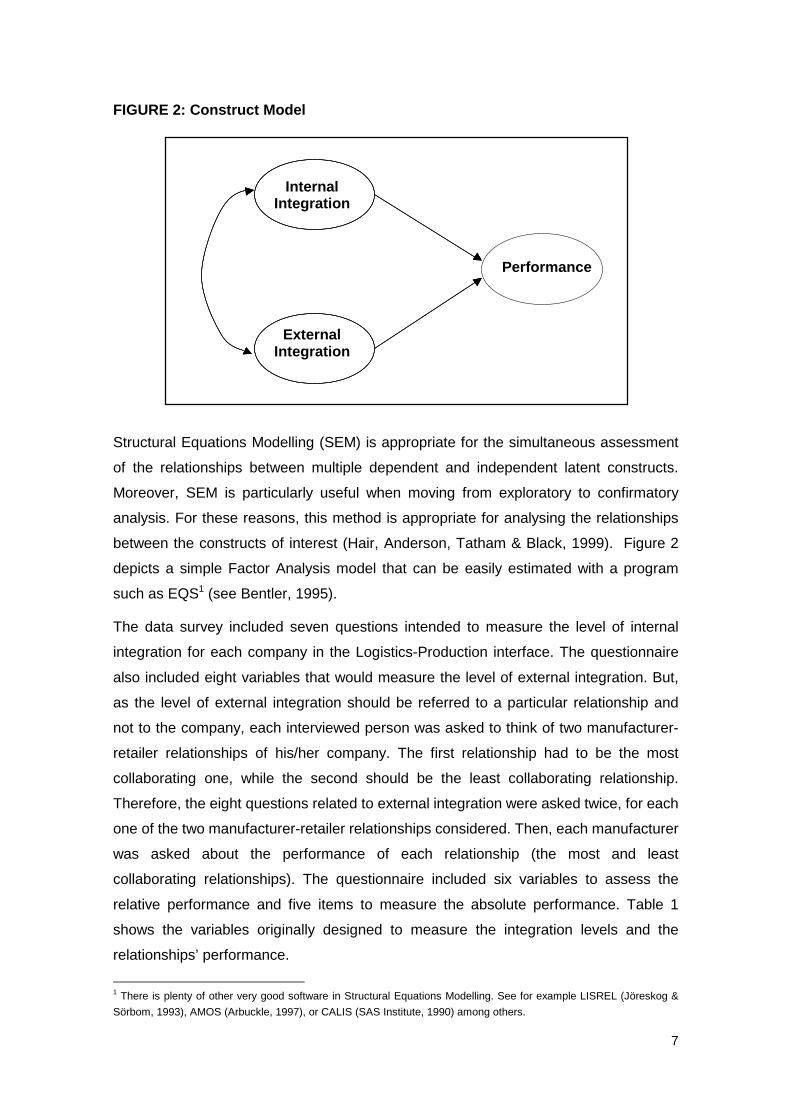
Figure 2 shows the proposed relationship between Internal and External Integration,
and the Performance of the firm, as explained in section 1. Three latent variables or
factors are related in a causal way. Both Internal Integration in the Logistics-
Production interface and External Integration are supposed to affect firm’s
performance (absolute or relative). Also, Internal Integration in the Logistics-
Production interface is supposed to be correlated with External Integration.
7
FIGURE 2: Construct Model
Structural Equations Modelling (SEM) is appropriate for the simultaneous assessment
of the relationships between multiple dependent and independent latent constructs.
Moreover, SEM is particularly useful when moving from exploratory to confirmatory
analysis. For these reasons, this method is appropriate for analysing the relationships
between the constructs of interest (Hair, Anderson, Tatham & Black, 1999). Figure 2
depicts a simple Factor Analysis model that can be easily estimated with a program
such as EQS1 (see Bentler, 1995).
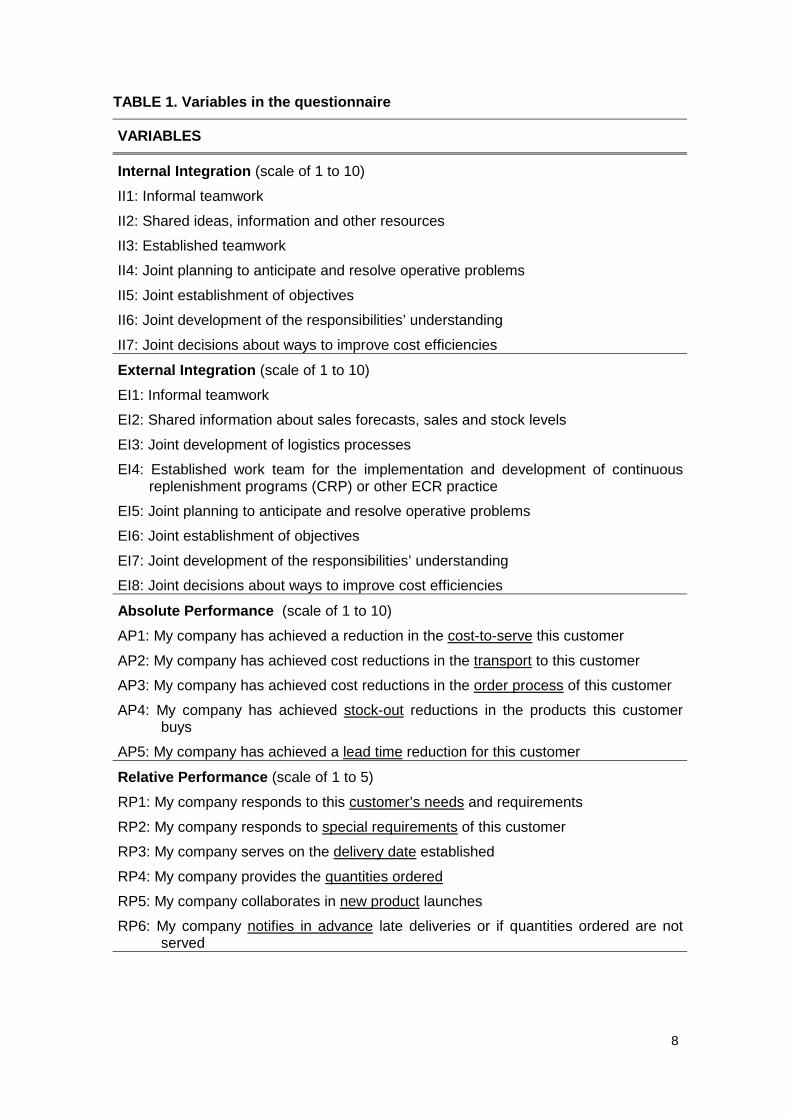
The data survey included seven questions intended to measure the level of internal
integration for each company in the Logistics-Production interface. The questionnaire
also included eight variables that would measure the level of external integration. But,
as the level of external integration should be referred to a particular relationship and
not to the company, each interviewed person was asked to think of two manufacturer-
retailer relationships of his/her company. The first relationship had to be the most
collaborating one, while the second should be the least collaborating relationship.
Therefore, the eight questions related to external integration were asked twice, for each
one of the two manufacturer-retailer relationships considered. Then, each manufacturer
was asked about the performance of each relationship (the most and least
collaborating relationships). The questionnaire included six variables to assess the
relative performance and five items to measure the absolute performance. Table 1
shows the variables originally designed to measure the integration levels and the
relationships’ performance.
1 There is plenty of other very good software in Structural Equations Modelling. See for example LISREL (Jöreskog &
Sörbom, 1993), AMOS (Arbuckle, 1997), or CALIS (SAS Institute, 1990) among others.
ExternalIntegration
InternalIntegration
Performance
8
TABLE 1. Variables in the questionnaire
VARIABLES
Internal Integration (scale of 1 to 10)
II1: Informal teamwork
II2: Shared ideas, information and other resources
II3: Established teamwork
II4: Joint planning to anticipate and resolve operative problems
II5: Joint establishment of objectives
II6: Joint development of the responsibilities’ understanding
II7: Joint decisions about ways to improve cost efficiencies
External Integration (scale of 1 to 10)
EI1: Informal teamwork
EI2: Shared information about sales forecasts, sales and stock levels
EI3: Joint development of logistics processes
EI4: Established work team for the implementation and development of continuousreplenishment programs (CRP) or other ECR practice
EI5: Joint planning to anticipate and resolve operative problems
EI6: Joint establishment of objectives
EI7: Joint development of the responsibilities’ understanding
EI8: Joint decisions about ways to improve cost efficiencies
Absolute Performance (scale of 1 to 10)
AP1: My company has achieved a reduction in the cost-to-serve this customer
AP2: My company has achieved cost reductions in the transport to this customer
AP3: My company has achieved cost reductions in the order process of this customer
AP4: My company has achieved stock-out reductions in the products this customerbuys
AP5: My company has achieved a lead time reduction for this customer
Relative Performance (scale of 1 to 5)
RP1: My company responds to this customer’s needs and requirements
RP2: My company responds to special requirements of this customer
RP3: My company serves on the delivery date established
RP4: My company provides the quantities ordered
RP5: My company collaborates in new product launches
RP6: My company notifies in advance late deliveries or if quantities ordered are notserved
9
We used exploratory and confirmatory factor analysis to validate the measurement part
of our model. As a result, the first proposed measure for Internal Integration (II1) was
not considered satisfactory since the analysis detected that it was related with a
different factor. The sixth question regarding the relative performance (RP6) was also
dropped. Table A2 in the Appendix shows some of the results of the confirmatory
factor analysis on the measurement part of the model.
Our construct model can be expressed in equation form as:
1 2PERFORMANCE = (INTERNAL INTEGRATION) + (EXTERNAL INTEGRATION) + β β ε
The estimation of the model will allow us to test several hypothesis. We can relate
them to the regression coefficients of the equation shown above and to the variance-
covariance matrix of the two factors representing integration.
• Internal Integration affects Performance: For this to be true, the regression
coefficient of Internal Integration, β1, should be positive and statistically
significant.
• External Integration affects Performance: The regression coefficient on
External Integration, β2, should be positive and statistically significant.
• Internal and External Integration are positively related: The covariance
between the Internal and External Integration factors should be positive and
statistically significant.
The next section reports the results of the estimation of the model and the tests of
hypothesis.
3 Results
We estimated two complete structural equations models. In the first one, we studied
the effect of the internal and external integration levels on the relative performance of
the firm. In the second model, we considered the effect of both levels of integration on
its absolute performance.
3.1 Relative performance model
Tables 4 and 5 summarise the estimation results for this model. The estimation is
based on Maximum Likelihood and Normal theory.
We estimated this model twice. The values in columns 2 and 3 of tables 4 and 5 are
based on data arising from the most collaborating relationship. The rest of the columns
were calculated from data obtained from the least collaborating relationship.
10
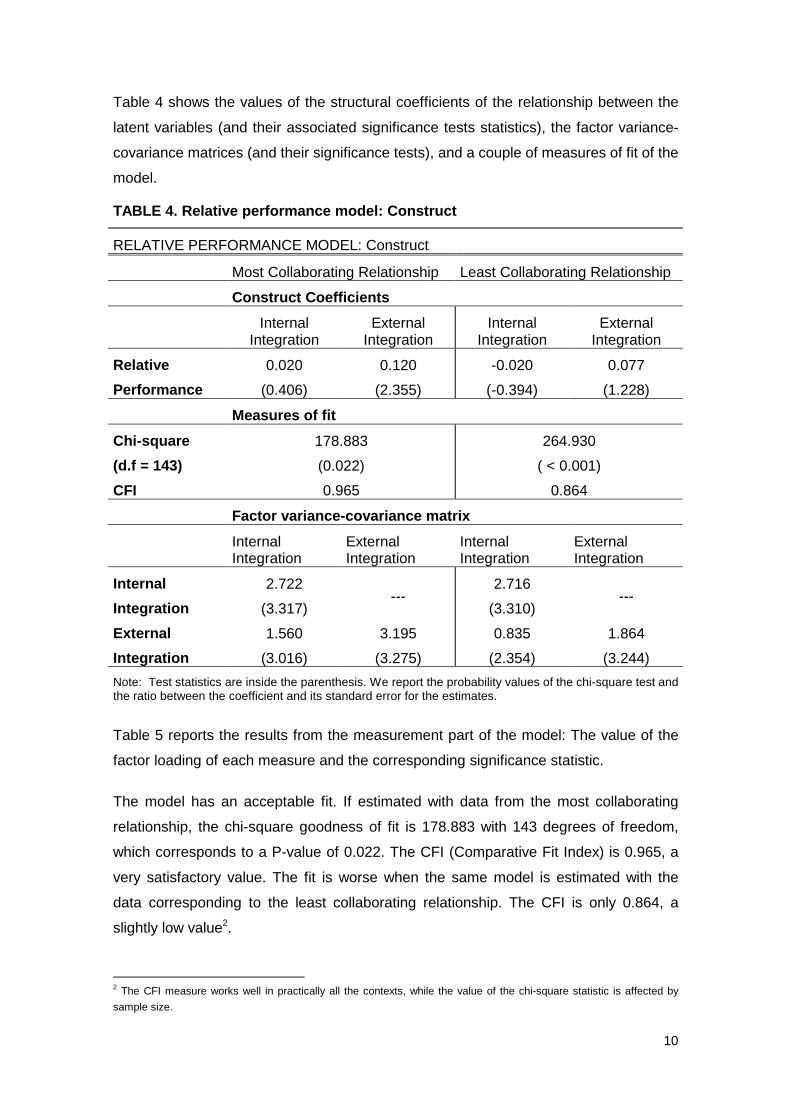
Table 4 shows the values of the structural coefficients of the relationship between the
latent variables (and their associated significance tests statistics), the factor variance-
covariance matrices (and their significance tests), and a couple of measures of fit of the
model.
TABLE 4. Relative performance model: Construct
RELATIVE PERFORMANCE MODEL: Construct
Most Collaborating Relationship Least Collaborating Relationship
Construct Coefficients
InternalIntegration
ExternalIntegration
InternalIntegration
ExternalIntegration
Relative
Performance
0.020
(0.406)
0.120
(2.355)
-0.020
(-0.394)
0.077
(1.228)
Measures of fit
Chi-square
(d.f = 143)
CFI
178.883
(0.022)
0.965
264.930
( < 0.001)
0.864
Factor variance-covariance matrix
InternalIntegration
ExternalIntegration
InternalIntegration
ExternalIntegration
Internal
Integration
2.722
(3.317)---
2.716
(3.310)---
External
Integration
1.560
(3.016)
3.195
(3.275)
0.835
(2.354)
1.864
(3.244)
Note: Test statistics are inside the parenthesis. We report the probability values of the chi-square test andthe ratio between the coefficient and its standard error for the estimates.
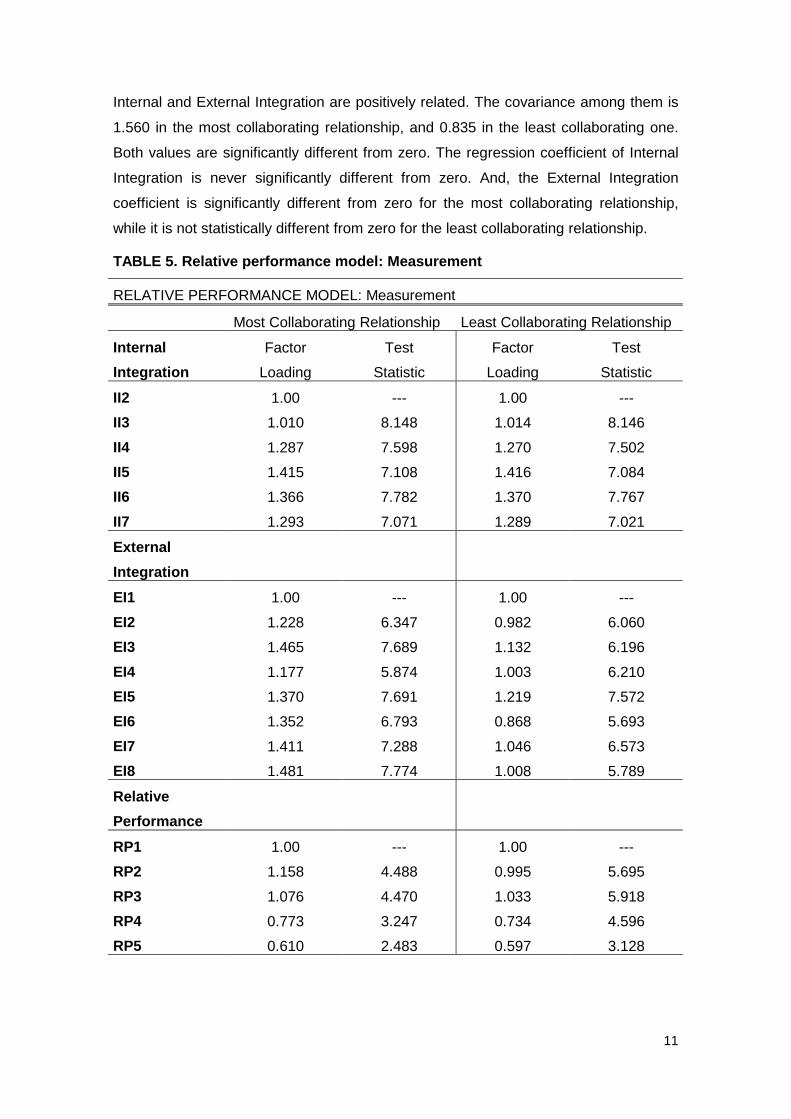
Table 5 reports the results from the measurement part of the model: The value of the
factor loading of each measure and the corresponding significance statistic.
The model has an acceptable fit. If estimated with data from the most collaborating
relationship, the chi-square goodness of fit is 178.883 with 143 degrees of freedom,
which corresponds to a P-value of 0.022. The CFI (Comparative Fit Index) is 0.965, a
very satisfactory value. The fit is worse when the same model is estimated with the
data corresponding to the least collaborating relationship. The CFI is only 0.864, a
slightly low value2.
2 The CFI measure works well in practically all the contexts, while the value of the chi-square statistic is affected by
sample size.
11
Internal and External Integration are positively related. The covariance among them is
1.560 in the most collaborating relationship, and 0.835 in the least collaborating one.
Both values are significantly different from zero. The regression coefficient of Internal
Integration is never significantly different from zero. And, the External Integration
coefficient is significantly different from zero for the most collaborating relationship,
while it is not statistically different from zero for the least collaborating relationship.
TABLE 5. Relative performance model: Measurement
RELATIVE PERFORMANCE MODEL: Measurement
Most Collaborating Relationship Least Collaborating Relationship
Internal
Integration
Factor
Loading
Test
Statistic
Factor
Loading
Test
Statistic
II2 1.00 --- 1.00 ---
II3 1.010 8.148 1.014 8.146
II4 1.287 7.598 1.270 7.502
II5 1.415 7.108 1.416 7.084
II6 1.366 7.782 1.370 7.767
II7 1.293 7.071 1.289 7.021
External
Integration
EI1 1.00 --- 1.00 ---
EI2 1.228 6.347 0.982 6.060
EI3 1.465 7.689 1.132 6.196
EI4 1.177 5.874 1.003 6.210
EI5 1.370 7.691 1.219 7.572
EI6 1.352 6.793 0.868 5.693
EI7 1.411 7.288 1.046 6.573
EI8 1.481 7.774 1.008 5.789
Relative
Performance
RP1 1.00 --- 1.00 ---
RP2 1.158 4.488 0.995 5.695
RP3 1.076 4.470 1.033 5.918
RP4 0.773 3.247 0.734 4.596
RP5 0.610 2.483 0.597 3.128
12
The factor loadings are quite similar for both types of relationships, which further
validates our choice of instruments3. The values are close to one in all cases and all of
them are statistically significant.
3.2 Absolute performance model
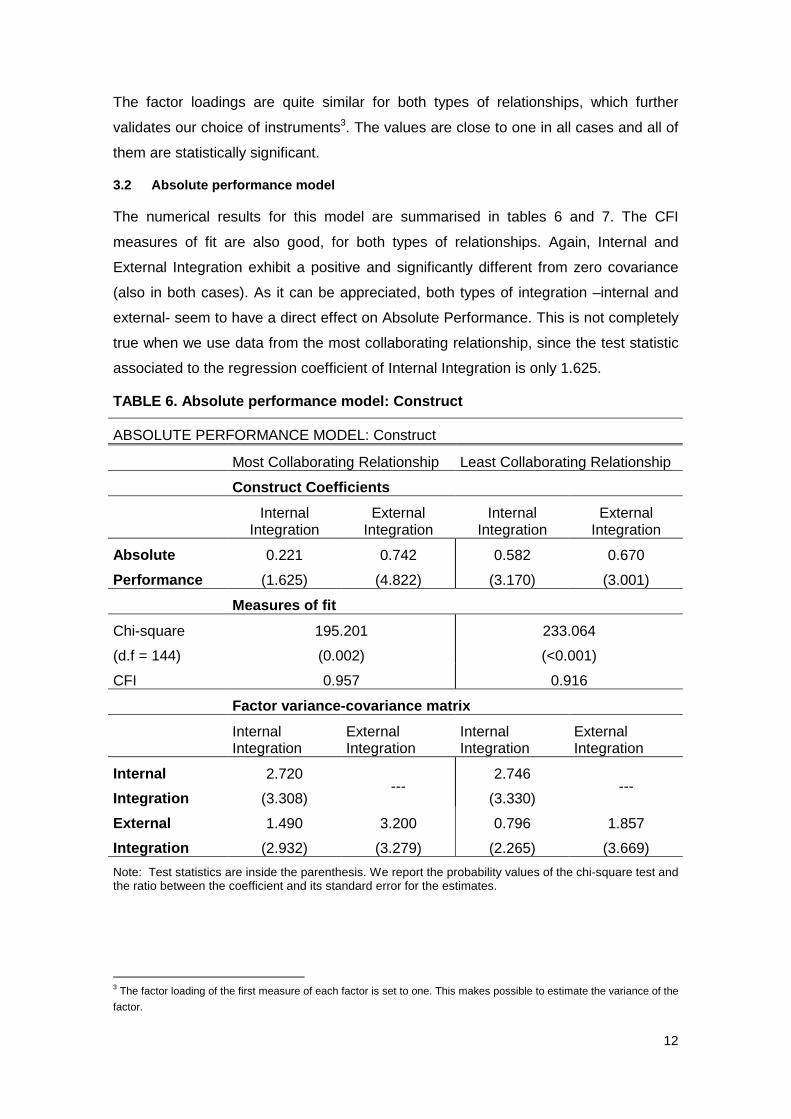
The numerical results for this model are summarised in tables 6 and 7. The CFI
measures of fit are also good, for both types of relationships. Again, Internal and
External Integration exhibit a positive and significantly different from zero covariance
(also in both cases). As it can be appreciated, both types of integration –internal and
external- seem to have a direct effect on Absolute Performance. This is not completely
true when we use data from the most collaborating relationship, since the test statistic
associated to the regression coefficient of Internal Integration is only 1.625.
TABLE 6. Absolute performance model: Construct
ABSOLUTE PERFORMANCE MODEL: Construct
Most Collaborating Relationship Least Collaborating Relationship
Construct Coefficients
InternalIntegration
ExternalIntegration
InternalIntegration
ExternalIntegration
Absolute
Performance
0.221
(1.625)
0.742
(4.822)
0.582
(3.170)
0.670
(3.001)
Measures of fit
Chi-square
(d.f = 144)
CFI
195.201
(0.002)
0.957
233.064
(<0.001)
0.916
Factor variance-covariance matrix
InternalIntegration
ExternalIntegration
InternalIntegration
ExternalIntegration
Internal
Integration
2.720
(3.308)---
2.746
(3.330)---
External
Integration
1.490
(2.932)
3.200
(3.279)
0.796
(2.265)
1.857
(3.669)
Note: Test statistics are inside the parenthesis. We report the probability values of the chi-square test andthe ratio between the coefficient and its standard error for the estimates.
3 The factor loading of the first measure of each factor is set to one. This makes possible to estimate the variance of the
factor.
13
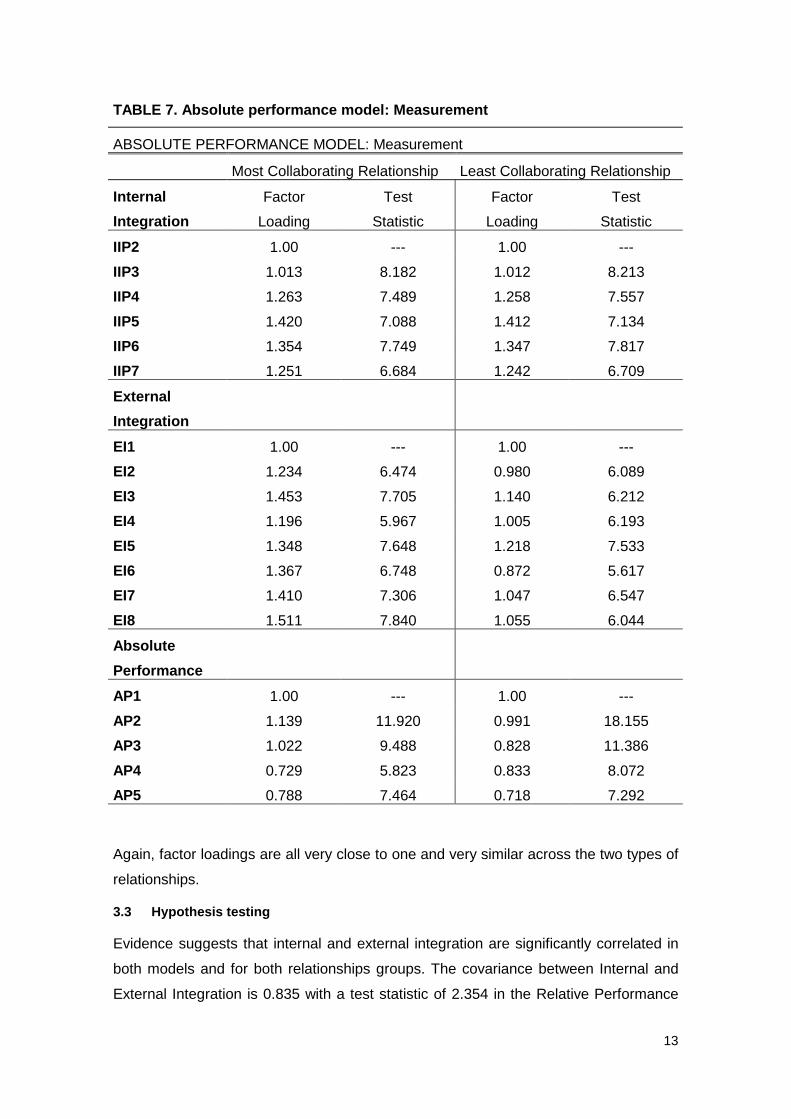
TABLE 7. Absolute performance model: Measurement
ABSOLUTE PERFORMANCE MODEL: Measurement
Most Collaborating Relationship Least Collaborating Relationship
Internal
Integration
Factor
Loading
Test
Statistic
Factor
Loading
Test
Statistic
IIP2 1.00 --- 1.00 ---
IIP3 1.013 8.182 1.012 8.213
IIP4 1.263 7.489 1.258 7.557
IIP5 1.420 7.088 1.412 7.134
IIP6 1.354 7.749 1.347 7.817
IIP7 1.251 6.684 1.242 6.709
External
Integration
EI1 1.00 --- 1.00 ---
EI2 1.234 6.474 0.980 6.089
EI3 1.453 7.705 1.140 6.212
EI4 1.196 5.967 1.005 6.193
EI5 1.348 7.648 1.218 7.533
EI6 1.367 6.748 0.872 5.617
EI7 1.410 7.306 1.047 6.547
EI8 1.511 7.840 1.055 6.044
Absolute
Performance
AP1 1.00 --- 1.00 ---
AP2 1.139 11.920 0.991 18.155
AP3 1.022 9.488 0.828 11.386
AP4 0.729 5.823 0.833 8.072
AP5 0.788 7.464 0.718 7.292
Again, factor loadings are all very close to one and very similar across the two types of
relationships.
3.3 Hypothesis testing
Evidence suggests that internal and external integration are significantly correlated in
both models and for both relationships groups. The covariance between Internal and
External Integration is 0.835 with a test statistic of 2.354 in the Relative Performance
14
case, and 0.796 with a test statistic of 2.265 in the Absolute Performance model. Firms
achieve a relatively high degree of internal integration before implementing SCM.
The structural equation model in table 4 shows that external integration leads to a
better relative performance, but internal integration does not. This model only fits when
there is a high level of external integration (in other words, for the most collaborating
relationship). In the least collaborative relationship, there is not external integration,
and therefore, the model does not fit.
The absolute performance model (see table 6) suggests that the level of external
integration leads to a better absolute performance. This model also shows that the
level of internal integration only leads to a better absolute performance when there is
not a high level of external integration (the internal integration coefficient is only
significant for the least collaborating relationships). However, when the company also
integrates externally, the level of external integration has such an important effect on
performance that it annuls (or reduces) the effect of the internal integration.
4 Conclusions and contributions
There are three generic results on the integration-performance relationship that can be
derived from this analysis, namely:
1. Firms achieve a relatively high degree of internal integration (collaboration
among internal processes) before implementing SCM.
2. When companies achieve a high level of internal integration (stage II in figure
1), this level of integration leads to a better absolute performance. A high level
of collaboration among internal processes contributes to achieving cost, stock-
outs and lead time reductions. However, this internal collaboration does not
lead to gaining a competitive advantage. This could be due to the fact that there
are already many companies that have achieved this stage. In our sample, the
percentage of relationships which had a high level of internal integration was
72,1% (a cluster analysis revealed that 43,4% of the sample relationships were
in stage II and 28,7% in stage III).
3. When companies achieve stage III (internal and external integration), the
external integration level leads to a better absolute and relative performance.
External collaboration among supply chain members contributes to achieving
costs, stock-outs and lead-time reductions, but also to gaining a competitive
advantage. When companies extend the level of internal integration to their
supply chain members, they can perform better than their competitors in the
15
following performance variables: response to customer’s needs and
requirements, response to special requirements, accomplishment of quantities
and delivery dates, and collaboration in new product launches. SCM
contributes to gaining a better competitive position because there are few
companies that have achieved this stage (only 28,7% of the sample’s
relationships were classified in stage III). This might not continue to be true in
the future, when more companies will have implemented SCM. SCM will
become a prerequisite to survive in the highly competitive environment.
With respect to the studies mentioned in the literature review, our results confirm that
internal and external integration are correlated. We have also corroborated that both
levels of integration lead to a better absolute performance. Our study, however, has
contributed to the Logistics Science Knowledge showing that internal integration by
itself is not sufficient to gain a competitive advantage: There is the need to extend this
integration to suppliers and customers.
Our results differ from those obtained by Stank, Keller & Daugherty (2001). They found
that internal collaboration led to a better competitive position, while external
collaboration did not.
Stank, Keller & Daugherty (2001) considered very heterogeneous industries in the
same model, and this could be the reason why they failed to demonstrate that external
integration leads to a better relative performance. The level of SCM development
varies considerably from one sector to another. For example, the automotive industry is
well known as the pioneer in the implementation of SCM practices. We believe that in
the car industry, SCM does not lead to a competitive advantage; it is a prerequisite to
survive, and almost all the companies have implemented it. If Stank, Keller &
Daugherty (2001) had considered different models for different sector structures, they
might have obtained very different results. In fact, Stank, Crum & Arango (1999)
conducted a similar study in the food industry, and they found that interfirm supply
chain co-ordination (external integration) led to a better absolute and relative
performance.
Our study has some limitations. One of them is that our study has not considered other
important members of the grocery supply chain such as grocery retailers, Third Party
Logistics, manufacturers’ suppliers, etc. The study has focused only on the
manufacturer-retailer relationship from the manufacturer point of view. Further research
should focus on other grocery supply chain relationships.
16
Another limitation is that intra-firm co-ordination has been considered only on one
internal relationship: the Production-Logistics interface. Other functions, such as
Purchasing and Marketing should be considered in future research.
We have only considered the effect of inter-firm co-ordination from the perspective of
the provider (as most of the studies do). However, satisfaction with service
performance should have also been assessed from the customer perspective. To
alleviate the concern about the biased performance assessment by providers, future
research should collect data on both sides of the relationship.
Finally, we believe that the contribution of SCM to gaining a competitive advantage is
affected by the level of SCM implementation in the industry. Future research should
apply this study to other sectors in order to consider different sector structures and
different levels of SCM implementation.
17
References
Arbuckle, J. (1997): AMOS User’s Guide Version 3.6. Chicago: Smallwaters Corp.
Armstrong, J.S. & Overton, T.S. (1977): “Estimating non-response bias in mail
surveys”; Journal of Marketing Research; Vol.14 no.3; pages 396- 402.
Bentler, P. M. (1995): EQS Structural Equations Program Manual. Encino, CA:
Multivariate Software, Inc.
Byrne, S.M. & Javad, S. (1992): “Integrated Logistics Information Systems (ILIS):
Competitive advantage or increased cost”; Council of Logistics Management Annual
Conference Proceedings; Oak Brook, Illinois; pages 55-73.
Christiansee, E. & Kumar, K. (2000): “ICT-enabled coordination of dynamic supply
webs”; International Journal of Physical Distribution and Logistics Management; Vol.30
no.3/4; pages 268-285.
Christopher, M. (1998): Logistics and Supply Chain Management: Strategies for
reducing cost and improving service; Financial Times Pitman Publishing.
Cooper, M.C. (1993): “International Supply Chain Management: Implications for the
bottom line”; Proceedings of the Society of Logistics Engineers; Hyattsville, MD:
Society of Logistics Engineers.
Daugherty, P.J.; Ellinger, A.E. & Gustin, C.M. (1998): “Integrated Logistics: The
performance connection”; Council of Logistics Management Annual Conference
Proceedings; Anaheim, California; pages 383-388.
Daugherty, P.J.; Ellinger, A.E. & Rogers, D.S. (1995): “Information accessibility:
Customer responsiveness and enhanced performance”; International Journal of
Physical Distribution and Logistics Management; Vol.25 no.1; pages 4-17.
Daugherty, P.J.; Sabath, R.E. & Rogers, D.S. (1992): “Competitive advantage
through customer responsiveness”; Logistics and Transportation Review; Vol.28 no.3;
pages 257-271.
Distribución Anual (2002): “Anuario de la Distribución 2001”; Vol. 1.
Ellinger, A.; Daugherty, P. & Keller, S. (2000): “The relationship between marketing/
logistics interdepartmental integration and performance in U.S. manufacturing firms: An
empirical study”; Journal of Business Logistics; Vol.21 no.1; pages 1-22.
18
Ellinger, A.; Taylor, J.C. & Daugherty, P.J. (2000): “Programas de reposición
automática y niveles de involucramiento: Su impacto en la performance”; The
International Journal of Logistics Management; Vol.10 no.1; pages 29-40.
Ellram, L.M. & Cooper, M.C. (1993): “The relationship between supply chain
management and Keiretsu”; The International Journal of Logistics Management; Vol.4
no.1; pages 1-12.
Fomento de la Producción (2000): “España 25.000 (DataBase)”; Edition 2000.
Fox, R.; Crask, M. & Kim, J. (1988): “Mail survey response rate: A Metaanalysis of
selected techniques for inducing response”; Public Opinion Quarterly 52; no.1; pages
467-491.
Groves, G. & Valsamakis, V. (1998): “Supplier-customer relationships and company
performance”; The International Journal of Logistics Management; Vol.9 no.2; pages
51-63.
Gustin, C.M.; Stank, T.P. & Daugherty, P.J. (1994): “Computerization: Supporting
integration”; The International Journal of Physical Distribution and Logistics
Management; Vol.24 no.1; pages 11-16.
Hair, J.H.; Anderson, R.E.; Tatham, R.L. & Black, W.C. (1999): Análisis
multivariante; Prentice Hall Iberia; 5ª ed.; Madrid.
Jöreskog, K. G. & Sörbom D. (1993): LISREL 8 User’s Reference Guide , Chicago:
Scientific Software International, Inc.
Lambert, D.M. & Harrington, T.C. (1990): “Measuring nonresponse in customer
service mail surveys”; Journal of Business Logistics; Vol.11 no.2; pages 5-25.
Larson, P.D. (1994): “An empirical study of inter-organizational functional integration
and total costs”; Journal of Business Logistics; Vol.15 no.1; pages 153-169.
Porter, M.E. (1985): Competitive advantage; The Free Press; New York.
SAS Institute Inc. (1990): SAS Technical Report P-200: CALIS and LOGISTIC
Procedures Release 6.04, Cary NC: SAS Institute Inc.
Scannell, T.V.; Vickery, S.K. & Dröge, C.L. (2000): “Upstream supply chain
management and competitive performance in the automotive supply industry”; Journal
of Business Logistics; Vol.21 no.1, pages 23-48.
Scott, C. & Westbrook, R. (1991): “New strategic tools for supply chain management”;
International Journal of Physical Distribution and Materials Management; Vol.21 no.1;
pages 23-33.
19
Shapiro, R.D. (1984): “Get leverage from logistics”; Harvard Business Review; Vol.62
no.3; pages 119-126.
Stank, T.P.; Crum, M. & Arango, M. (1999): “Benefits of inter-firm coordination in food
industry supply chains”; Journal of Business Logistics; Vol.20 no.2; pages 21-41.
Stank, T.P.; Daugherty, P.J. & Autry, C. (1999): “Collaborative planning: Supporting
automatic replenishment programs”; Supply Chain Management; Vol.4 no.2; pages 75-
85.
Stank, T.P.; Daugherty, P.J. & Ellinger A. (2000): “Integración Marketing/Logística y
performance de la empresa”; The International Journal of Logistics Management;
Vol.10 no.1; pages 13-27.
Stank, T.P.; Keller, S. & Daugherty, P. (2001): “Supply chain collaboration & logistical
service performance”; Journal of Business Logistics; Vol.22 no.1; pages 29-48.
Stevens, G.C. (1989): “Integrating the supply chain”; International Journal of Physical
Distribution and Materials Management; Vol.19 no.8; pages 3-8.
Stock, G.N.; Greis, N.P. & Kasarda, J.D. (1998): “Logistics, strategy and structure: A
conceptual framework”; International Journal of Operations and Production
Management; Vol.18 no.1; pages 37-52.
The Global Logistics Team at Michigan State University (1995): World Class
Logistics: The challenge of managing continuous change; Council of Logistics
Management; Oak Brook, Illinois.
Vargas, G.; Cardenas, L. & Matarranz, L. (2000): “Internal and external integration of
assembly manufacturing activities”; International Journal of Operations and Production
Management; Vol.20 no.7; pages 809-822.
20
Appendix
In this appendix we show several tables that illustrate the characteristics of our data
and the quality of the variables used as indicators in our factor model.
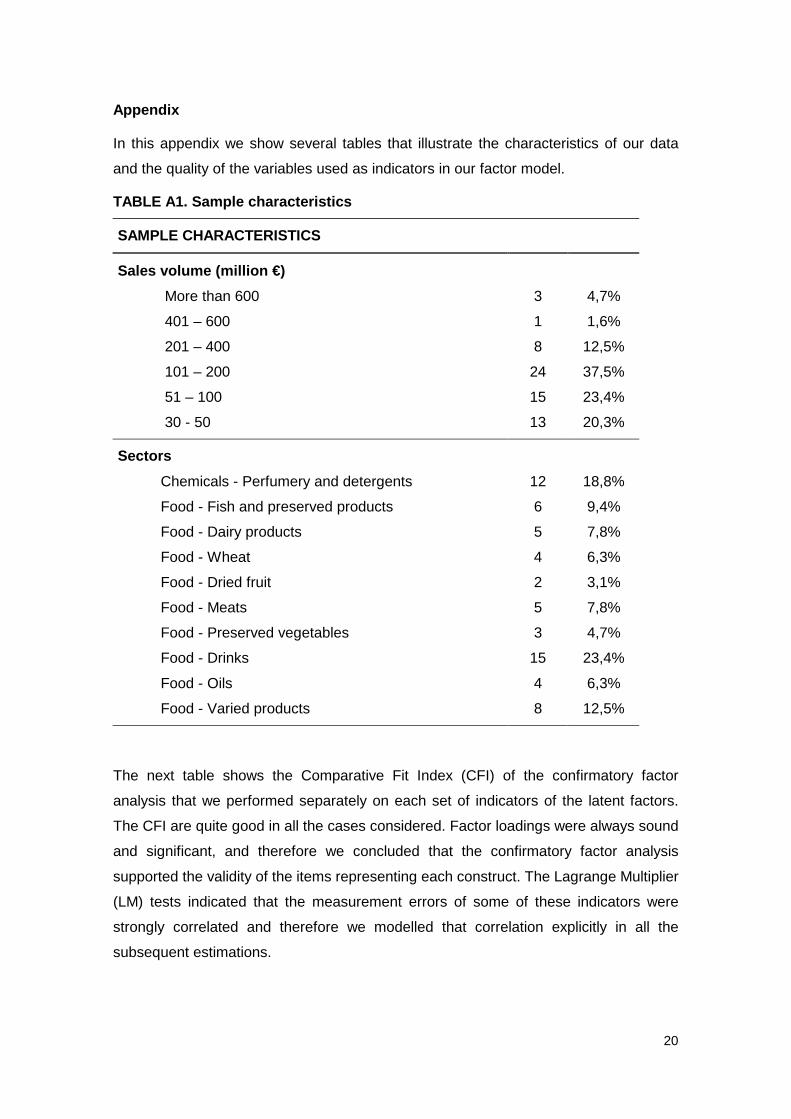
TABLE A1. Sample characteristics
SAMPLE CHARACTERISTICS
Sales volume (million €)
More than 600 3 4,7%
401 – 600 1 1,6%
201 – 400 8 12,5%
101 – 200 24 37,5%
51 – 100 15 23,4%
30 - 50 13 20,3%
Sectors
Chemicals - Perfumery and detergents 12 18,8%
Food - Fish and preserved products 6 9,4%
Food - Dairy products 5 7,8%
Food - Wheat 4 6,3%
Food - Dried fruit 2 3,1%
Food - Meats 5 7,8%
Food - Preserved vegetables 3 4,7%
Food - Drinks 15 23,4%
Food - Oils 4 6,3%
Food - Varied products 8 12,5%
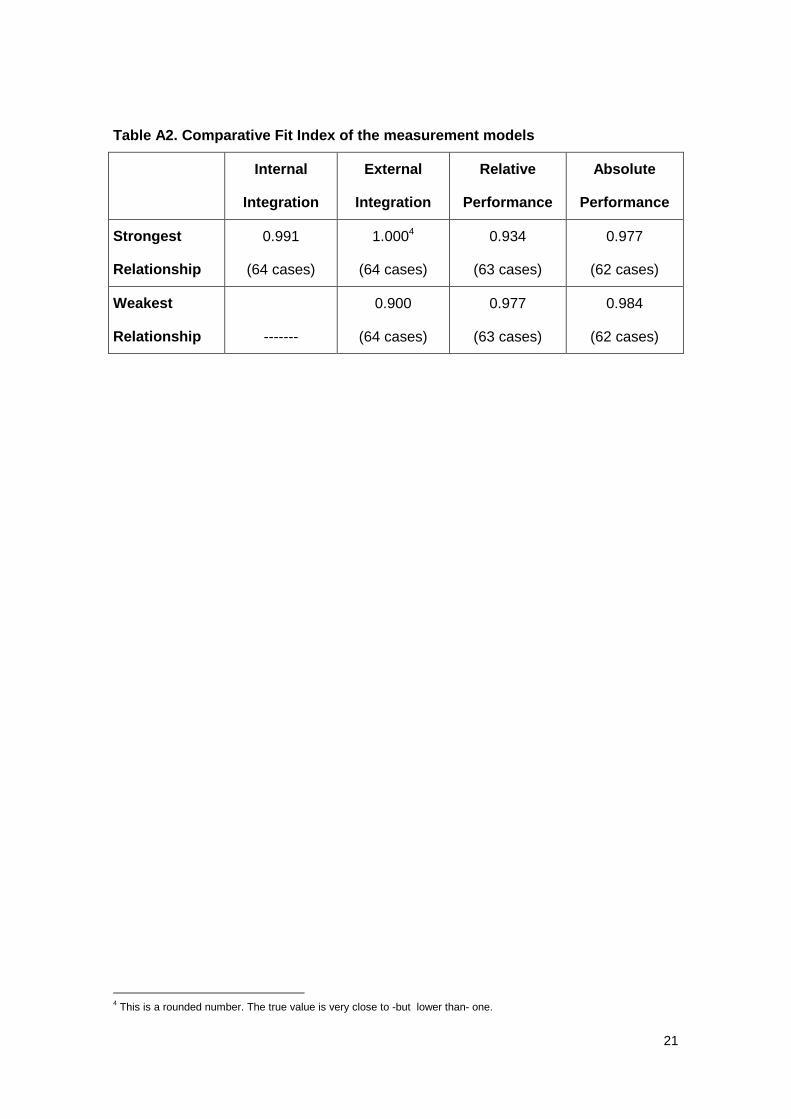
The next table shows the Comparative Fit Index (CFI) of the confirmatory factor
analysis that we performed separately on each set of indicators of the latent factors.
The CFI are quite good in all the cases considered. Factor loadings were always sound
and significant, and therefore we concluded that the confirmatory factor analysis
supported the validity of the items representing each construct. The Lagrange Multiplier
(LM) tests indicated that the measurement errors of some of these indicators were
strongly correlated and therefore we modelled that correlation explicitly in all the
subsequent estimations.
21
Table A2. Comparative Fit Index of the measurement models
Internal
Integration
External
Integration
Relative
Performance
Absolute
Performance
Strongest
Relationship
0.991
(64 cases)
1.0004
(64 cases)
0.934
(63 cases)
0.977
(62 cases)
Weakest
Relationship -------
0.900
(64 cases)
0.977
(63 cases)
0.984
(62 cases)
4 This is a rounded number. The true value is very close to -but lower than- one.