Embed Size (px)
Citation preview

1
Supply Chain Broker Operations: A Network Perspective
Michael Huang, Industrial Engineering and Management Sciences, Northwestern University, [email protected] Tito Homem-de-Mello, Industrial Engineering and Management Sciences, Northwestern University, [email protected] Karen Smilowitz*, Industrial Engineering and Management Sciences, Northwestern University, [email protected] Bill Diegert, Coyote Logistics, [email protected]
* Corresponding author.

2
Supply chain broker operations: a network perspective Michael Huang, Tito Homem-de-Mello, Karen Smilowitz
Northwestern University
Bill Driegert
Coyote Logistics Keywords: case/field study; operations strategy; logistics/distribution; quantitative methods
Abstract
Recent work in social network analysis has examined performance of various
organizations from a network perspective. This paper presents a network analysis of spot-
market broker operations in supply chain management, based on findings from our
empirical study of a specific firm in the industry. By modeling the connections between
the brokers and the vendors they contact, we define metrics that correlate the strategies
for selecting the vendors with profitability, which allows for the identification of
potentially good operating policies. We find that it is not just the number of connections
between brokers and vendors that impact profitability, but also the quality of those
connections. We develop an approach to quantify the quality of connections and
demonstrate the extent to which this approach can not only predict system performance
but also serve as a tool to evaluate the performance of individual brokers.
1. Introduction
Current economic trends, including significant changes in import volumes, fuel prices, and
manufacturing output, have led to dramatic changes in demand for truckload freight

3
transportation and the capacity available to service the freight. Efficient asset management is
critical for both shippers and carriers to remain competitive. In truckload transportation, efficient
operations are characterized by minimum deadhead (the miles a truck must travel empty to the
shipper), and high utilization of drivers and trucks. Asset utilization has far-reaching implications
for supply chains. Highly efficient operations allow shippers to bring their goods to market at
lower cost and carriers to maximize profits, while minimizing the cost of public externalities,
such as air and noise pollution, consumption of fossil fuels, wear and tear on public roads, and
accidents.
There are some 250,000 carriers in North America, ranging from giants like Schneider National
and Wal*Mart’s private fleet to single-owner operators. Some portion of the freight contracted to
and hauled by these carriers occurs on a consistent basis, which results in patterns of empty and
available trucks that can be scheduled by carriers efficiently. However, a significant portion of
shipments are irregular. These are commonly referred to a spot freight or transactional (rather
than contractual) freight. These loads cannot be scheduled far in advance, nor can the resulting
empty trucks be considered more than a day or so in advance of their availability.
If every truck and every load were controlled by a single entity, efficient matching of trucks and
loads could be derived through an optimization procedure, yielding low deadhead to cover all of
the loads while using as few trucks as possible. In reality, no such entity exists; each shipper is
primarily concerned with minimizing the cost of moving freight, and each carrier is primarily
concerned with maximizing profits. A global optimization would additionally be complicated by
the fluidity of the network in that the capacity map is constantly evolving through time. A true
global optimization would have to not only optimize geographically, but also optimize inter-
temporally. Given the very fragmented and generally deregulated nature of this industry, the state

4
of equilibrium includes a level of inefficiency, with excess deadhead and loads that do not move
when shippers wish they would.
Freight brokers, or transportation intermediaries, entered the marketplace following the
deregulation of the industry in the early 1980s. Freight brokers act as middlemen between
shippers and carriers. New technology has continued to advance the capabilities of intermediaries,
beginning with the adoption of fax machines in the 1980s1 and continuing with web-based
matching services in the late 1990s. According to Armstrong & Associates, the third party
logistics industry reached revenues of $122 billion in 2007.2 The industry is highly competitive
and efficient use of resources, including employees who broker loads between carriers and
shippers, is critical for success.
This paper examines third-party broker operations from a firm perspective. In particular, we study
the question of how to best manage resources in a constrained operating environment from the
perspective of a third-party broker. We focus on spot market operations given a fixed number of
loads in need of transport. The resulting problem is to optimize the activities of brokers who work
with carriers to transport the load. In such fragmented industries, operations can be difficult to
analyze because a large portion of the carriers are small and fairly unsophisticated, and as a result,
quality information is difficult to attain or simply unavailable. Pricing data, as an example, is
often never recorded in any form during the process of negotiation. This research would not be
possible without the collaboration of a technology forward partner of sufficient scale willing to
both provide data and develop the systems to capture the data efficiently.
1 Transportation Intermediaries Exchange, http://www.tiexchange.net/locked/introduction.shtml, accessed January 20, 2005. 2 Armstrong & Associates, http://www.3plogistics.com/3PLmarket.htm,accessed February 24, 2009

5
This research is done in collaboration with Coyote Logistics, a third party logistics provider. We
demonstrate the value of field research in operations management through an industry
collaboration which focuses specifically on the collection and analysis of data in supply chain
management to improve operations. Our analysis utilizes past data to find trends that can be
projected to change operating policies. We develop a network analysis methodology which
facilitates the organization of inherently complex data to extract information in a meaningful way.
This methodology is then used to generate operating guidelines. Although the methodology is
based on operations in the truckload freight brokerage industry, the analysis can be extended to
other brokerage industries.
As a foundation for the network methodology, we make use of recent work in social network
analysis, which has examined performance of various organizations. Social network analysis
studies the interdependencies among individuals in a given environment with quantitative
methodologies based on the network structure of the environment. Networks are defined by a set
of nodes, which may represent individuals, and arcs or interconnections between nodes. The arcs
represent various forms of communication and/or collaboration between individuals. Researchers
have developed metrics to evaluate the position of an individual in a network. For example,
centrality measures an individual's connectivity to other nodes throughout the network. In our
case, we develop specific metrics that relate operating policies to profitability in spot-market
broker operations in supply chain management, which allows us to evaluate existing policies and
suggest new polices that can potentially have significant impact especially by accelerating the
“learning curve” of newly hired employees.
Section 1.1 presents a review of related literature in freight brokerage operations, as well as
relevant work in social network analysis. Section 2 introduces the spot-market operating
environment under consideration. Section 3 describes the network analysis methodology in detail.

6
Section 4 discusses data collection and analysis conducted with our industry partner, including
network calibration. Section 5 presents results from an empirical study and includes a discussion
of general managerial insights. Finally, Section 6 presents concluding remarks and proposes
avenues of future research.
1.1 Literature review
1.1.1 Transportation procurement
There is a wide array of relational structures in which shippers may meet carriers and procure
transportation for their loads (Figliozzi 2004). The spectrum varies from vertical hierarchies
(where the carrier is internal to the shipper), to the use of long term contracts, to private
exchanges, to public spot markets.
The bulk of the transportation procurement literature focuses on long term contracts and the
design of related combinatorial auctions. Caplice (1996) studies how the design of an auction can
reduce repositioning costs. Ledyard, Olson, Porter, Swanson and Torma (2002) present the first
such auction at Sears Logistics which reduced procurement costs by 13% over past practices.
Song and Regan (2002) analyze the carriers’ perspective showing via simulation that carriers may
benefit from such auctions. Benefits from economies of scope (advantages from considering
multiple transportation lanes at once) and the ability to easily consider non-price variables (such
as level of service) are investigated in Caplice and Sheffi (2003) and Sheffi (2004).
Considerable less work has focused on spot markets which are characterized by many irregular
short term transactions. Figliozzi (2004) models the spot market as a series of sequential auctions
offered by either a shipper or a set of shippers to a set of carriers. The bidding problem in such

7
auctions is formulated as an equilibrium and decision theory problem. The study investigates the
effect of the auction format, different levels of sophistication for carriers and learning capabilities
of the carrier by constructing a simulation.
Figliozzi’s framework assumes a fixed set of carriers who are notified of each load to be
auctioned. In contrast, our framework assumes that brokers choose the carriers to inform of load
availability.
1.1.2 Social network analysis
Early work in network analysis focuses on sociological aspects. Granovetter (1973) suggests the
use of social networks as a tool to link micro-level interactions to macro-level patterns in
sociology. The author introduces the concept of strength of ties as a combination between several
sociological factors which characterize an interaction and classifies the tie either as strong, weak
or absent. Social networks have perhaps had the largest impact in organizational management in
the investigation of the concept of embeddedness (Granovetter 1985, Uzzi 1996 and Uzzi 1997)
which suggests that social relationships has a sizable influence on the economic performance of
an organization.
Oke, Idiagbon-Oke and Walumbwa (2008) use social network analysis to test hypotheses
regarding relationships between different sources of power and the strength of ties between
network members in an inter-organizational collaboration network for new product development.
Iravani, Kolfal and Van Oyen (2007) use social network analysis in a more operational setting,
mapping a supply chain process as a network. They examine the cross-training of customer sales
representative at inbound call centers. They show that the network-specific metric of the average

8
shortest path length is a robust predictor of effective cross-training structure in work sharing
networks.
Our work distinguishes itself from previous studies where social network analysis is used in an
organizational setting. Based on our observation of freight brokerage activities, we develop a
network analysis focusing on the relationships between the brokers and the external carriers,
rather than on the internal relationships between the brokers. Thus, in a new application of social
network analysis, we examine a network with inter-organizational links and the role of these links
on the performance of brokers within one firm.
2. Problem Description
Third-party brokerage companies such as Coyote Logistics operate similarly in many regards.
The issues addressed in this paper extend beyond the particular case study presented. We describe
the operations of a generic brokerage company, beginning with the introduction of terminology
used throughout the paper.
Broker The role of the broker is to find the optimal vendor for each open job. We assume
that a broker works with a fixed set of vendors but has discretion over which jobs
to offer each vendor. In the context of freight brokerage, a broker tries to find the
best carrier for a shipment. The broker intermediates between the customer who
tendered the job and the vendor who will serve the job. Often, companies
separate brokers who work with customers from brokers who work with vendors.
Our work focuses on brokers who work with vendors.

9
Job A job is a commoditized service requested by a customer and which must be
served by a vendor. Jobs may have to be served at specific locations. In this
paper, the jobs are shipments of goods, but a job could be any commoditized
service from a customer.
Customer The customer is the party for whom the job is being completed. The customer
may be internal or external to the brokerage company. The customer is not an
actor in the network model developed in this paper.
Vendor A vendor is a company that can provide the services required for a job. In the
context of freight brokerage, a vendor would be a trucking company, railroad, or
other shipping company.
Inquiry An inquiry is a request by a broker to a vendor about a specific job. The elements
of an inquiry typically include an assessment of the vendor’s ability and
willingness to serve the job. In the affirmative case, the vendor offers a quote to
the broker for that job. A negotiation over the pricing terms may follow, and, if
both parties are satisfied, a booking results.
Quote The price offered by a vendor to serve a specific job.
Booking A booking is made when an inquiry is successful and a vendor agrees to serve a
job for the negotiated price.
The generation of jobs is external to the analysis in this paper; we assume a fixed set of jobs for
the time period of analysis. In practice, jobs are solicited from customers each day and the set of

10
available jobs is constantly changing throughout the day. The solicitation of jobs from customers
is similar to a vendor inquiry in that it involves an assessment of capability and a negotiation of
pricing terms. The optimal solicitation of jobs from customers given the available capacity is an
area of potential future investigation and application of this research.
The broker’s process of booking loads follows a standard structure and is conveniently
compartmentalized into a sequence of calls to vendors. For simplicity, we refer to any form of
communication as a call, although actual communication can take the form of fax or email as
well. Before each call, the broker must make two decisions – which vendor to call and which jobs
to offer to the vendor. A call to a vendor proceeds as follows: for each job presented to the vendor
by the broker as an inquiry, the vendor either offers a quote for the job or declines. In the course
of the discussion, the broker may present inquiries about additional jobs based on new
information indicating potential compatibility of service. For each job for which the vendor has
offered a quote, the broker negotiates pricing terms by proposing a counter-offer. The negotiation
continues until an agreement is reached or prices are not aligned and both parties are unwilling to
change their positions.
This paper addresses the issue of which vendor(s) a broker should contact regarding jobs, and
also the broader question of whether the broker – and the company, for that matter – has the right
composition of vendors given the set of jobs to serve. We focus on the inquiry step and develop
strategies for prioritizing the call order of vendors and the allocation of jobs to vendors for
inquiry.
In the absence of guidance, brokers independently develop and refine their strategies for
prioritizing vendors and jobs. The tactics employed vary between brokers, but general tactics
include:

11
• Call vendors that are currently seeking similar jobs.
• Call vendors that have expressed interest in similar jobs in the past.
• Call vendors that match characteristics of vendors who have performed similar jobs
in the past.
The development of good strategies is key to the performance of a broker, since a broker with
poor strategy spends much of his/her time contacting vendors that either cannot serve the job or
can only do so for a high price. Therefore, it is important to identify, for any given job, strategies
that relate directly to profitability. In our investigation, we develop a methodology that provides
such a link, based upon an extensive analysis of existing data. In Section 3, we describe in more
detail our model and how the model incorporates the brokers’ strategies.
3. Network Methodology
In this section, we present a network model of the interactions between brokers and vendors for a
given set of jobs. The goal is to analyze how the number and nature of the interactions translate
into profitability for the company. Section 3.1 presents a basic network structure, which is
expanded in Section 3.2 to account for the nature of the interactions, which is a key element of
the analysis. The networks described in this section capture activities over a fixed period of time
for all jobs served during that time across all brokers. The choice of time frame is discussed in
Section 4.
3.1 Basic network definitions

12
The most basic and intuitive network for a set of jobs J is comprised of two sets of nodes NB and
NV, representing brokers and vendors, respectively, and directed arcs from broker nodes to vendor
nodes. The existence of an arc connecting broker i and vendor k indicates that broker i has called
vendor k to make inquires for the jobs in the network. In practice, data are available regarding the
number of calls made from broker i to vendor k; however, data on the specific jobs discussed
during a call are often limited to only those jobs that result in a quote. Obtaining detailed
information on all jobs discussed is extremely time-consuming for the brokers. Given the time-
constrained operating environment, such data collection is not feasible. We discuss the impact of
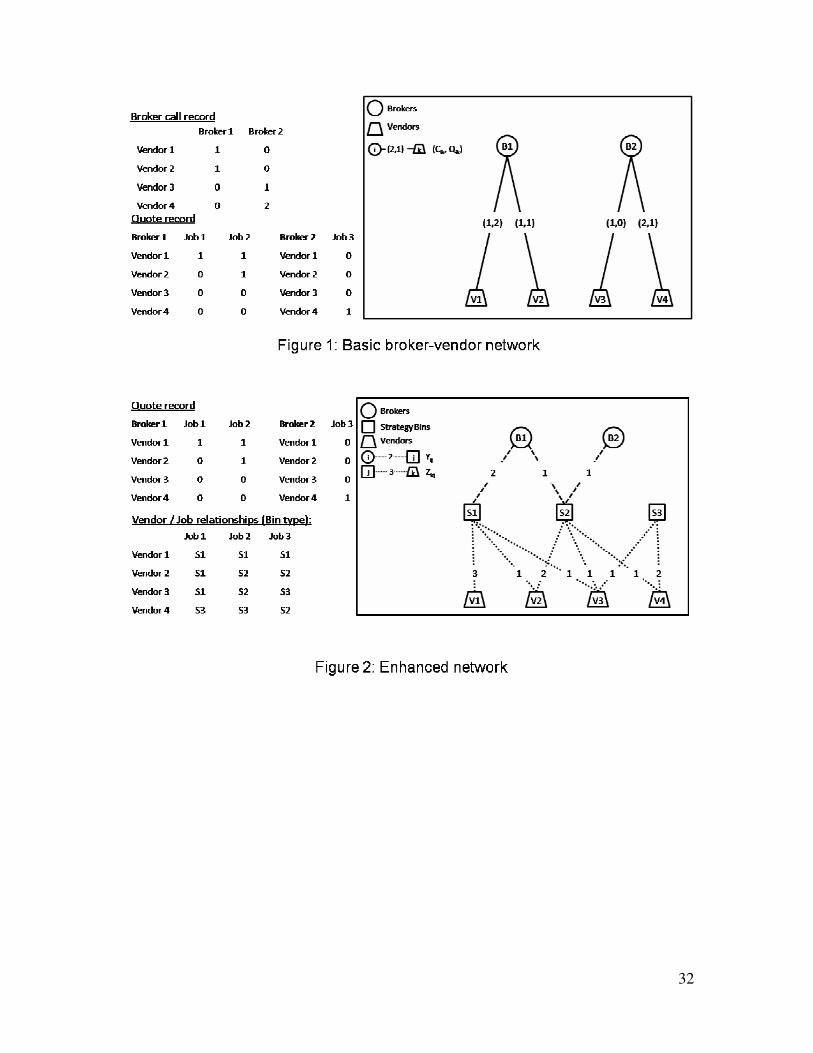
this data limitation in Section 4. Two values are associated with the arcs between brokers and
vendors: Cik represents the number of calls between broker i and vendor k within a period which
includes all calls made for jobs within the time frame, and Qik represents the number of quotes
vendor k has given broker i (possibly zero). Because an arc does not exist unless at least one call
is made, Cik is a positive integer. Since at most one quote is offered for each job, Qik is a non-
negative integer less than or equal to |J|. Note that because a call may elicit multiple (or zero)
quotes, Qik can be larger or smaller than Cik.
Insert Figure 1 here
Figure 1 depicts a small example of a network in which two brokers placed calls to and received
quotes from four vendors for three jobs during the time horizon of analysis. The data records
presented on the left side of the figure are represented in network form on the right side of the
figure. Broker 1 called Vendors 1 and 2, and Broker 2 called Vendors 3 and 4. These calls are
represented by the existence of arcs between the brokers and vendors. The arc values between
brokers and vendors illustrate the number of calls and the quotes received as a result of these
calls.

13
From this network we can construct several metrics. We define the broker contact set Γ(i) as the
set of vendors that are adjacent to broker node i in NB. The broker connectivity metric, κi, is the
cardinality of Γ(i)., denoted as:
)(ii Γ=κ .
Thus, κi measures the number of unique vendors contacted by broker i in NB. Clearly, we have 0 ≤
κi ≤ |NV|.
The broker call metric, Ψi, measures the total number of calls made by broker i and is defined as:
( )∑ Γ∈=Ψ
ik iki C .
The broker quote metric, Θi, measures the total number of quotes made to broker i and is defined
as:
( )∑ Γ∈=Θ
ik iki Q .
Since each vendor can (theoretically) offer quotes for all jobs, we have 0 ≤ Θi ≤ κi |J|. We also
measure the density, θ, of broker i which is the ratio of the two aforementioned metrics:
iii κθ Θ= .
The density metric represents the average number of quotes a broker obtains per vendor
contacted. Theoretically we have 0 ≤ θi ≤ |J|, but in practice θi is much smaller than |J|, since
typically a broker contacts multiple vendors who are suitable only for a subset of the total jobs
that a broker works during the time period. Therefore, the broker is not likely to receive a quote
on every job from every vendor contacted.
3.2 Enhanced network
The network described in Section 3.1 is limited since there is no mechanism to distinguish which
vendors are more apt to serve a job, an essential step towards determining how interactions

14
translate into profit. To address this concern, we first identify candidate conditions for contacting
a particular vendor for a given job, which capture the vendor’s affinity to work with the
brokerage company and the vendor’s capacity to serve the job. These conditions yield the
likelihood that a vendor would offer a quote if contacted by a broker and that the quote would be
desirable to the broker. We consider Boolean conditions; i.e., each condition is either true or
false. Examples of candidate conditions are presented in Section 2, such as calling a vendor
currently seeking similar jobs.
In addition to identifying the candidate conditions, it is important to consider combinations of the
conditions. This allows for a more refined classification of broker-vendor interactions, which in
turn translates into a more accurate quantification of the relationship between those interactions
and profitability. For example, one combination could be “the vendor has served similar jobs
before, but does not have staff/equipment available at the job’s location,” while another could be
“the vendor has staff/equipment available at the job’s location, but has never served similar jobs
before.” The analysis of the data facilitates the determination of condition combinations – which
can be thought of contact strategies – that are more desirable for the company from the
perspective of profitability, thus providing a guide for future interactions.
To represent contact strategies in the network, we add a set of nodes NS, representing strategy
bins. Each strategy bin represents a combination of the candidate conditions, including the null
bin where none of the candidate conditions are satisfied. Since candidate conditions are Boolean,
a total of n conditions would yield 2n strategy bins; for example, five conditions yield 32 bins.
Clearly, even for moderate values of n, the total number of bins can be excessively large. The
number of data points per bin decreases with the number of bins; when the number of bins is too
large, it is not possible to draw meaningful conclusions due to lack of data points for individual
bins. To circumvent the problem, one can tier some of the conditions, grouping conditions that

15
are true only if another one is also true. For example, if conditions A, B and C can be tiered, then
there are four (rather than eight) possible combinations – namely, (i) A is true, (ii) A is false but B
is true, (iii) A and B are false but C is true, and (iv) A, B and C are false. Creating such a tier
system – which, in our case, was natural given the nature of the candidate conditions – can
drastically reduce the number of strategy bins.
Because the list of strategy bins is exhaustive and mutually exclusive, each vendor must match
exactly one strategy bin for each job. We replace the broker-vendor arcs with two new arc sets.
An arc from broker i to bin j is assigned a value Yij representing the number of quotes broker i
received from vendors that matched strategy bin j during the time horizon of analysis. Notice that,
by construction, Yij partitions the number of quotes broker i receives by strategy bin and hence we
must have
( )∑ ∑∈ Γ∈∈∀Θ==SNj
B
ik iikij Ni QY .
An arc connecting vendor k to bin j is assigned a value Zkj representing the number of jobs for
which vendor k matched strategy bin j. For carrier k, Zkj partitions the job set J and thus we have:
V
Nj kj Nk JZS ∈∀=∑ ∈|| .
For a given strategy bin j, the summation of Yij across all brokers can be seen as the number of
quotes captured from that strategy while the summation across all vendors can be seen as the
number of potential quotes from that strategy. It is worthwhile noticing that the enhanced network
is constructed from information pertaining to individual jobs (i.e., the network is job-oriented);
thus, metrics regarding calls are not included, since as discussed earlier job-specific call data are
in general not available.
Insert Figure 2 here
Figure 2 illustrates the enhanced network for the example introduced in Figure 1. Here we
introduce three strategy bins. The data records on the left include the quote record from Figure 1

16
as well as the vendor-job relationships which display which strategy bin each vendor matched for
each job. For a broker i, each time a quote is received from a vendor for a job, the quote
information is cross-referenced in the vendor-job relationship table, so that the quote can be
assigned to a strategy bin. Summing over all quotes yields the value of Yij between the broker and
strategy bin. The value for the arc between vendor k and strategy bin j, Zkj, is calculated by
counting the number of times strategy j appears in the vendor k row of the vendor-job relationship
table.
3.2.1 Offer potential metric
The addition of strategy bins leads to another metric. The offer potential metric ωij, defined for
each broker i and strategy bin j, is the ratio of the number of quotes to the potential number of
quotes of that bin for a specific broker. Formally,
( )∑ Γ∈=
ik kjijij ZYω .
The summation in the denominator is taken over Γ(i), the set of vendors called by the broker.
Note that 0 ≤ ωij ≤ 1. When the vendors are “partitioned” among the brokers; i.e., when the set of
vendors contacted by each broker are mutually disjoint, the offer potential metric quantifies the
success of the broker in mining the potential available from a given strategy.
If vendors are not partitioned among brokers, the offer potential metric retains its meaning, but
may be complicated due to competition between brokers and thus must be looked at in
conjunction with other metrics. For example, suppose there are n brokers, n jobs and n vendors,
and suppose that there is only one strategy bin (in addition to the null bin). If each vendor
matches the strategy for a single distinct job and each broker working on a distinct job calls all
the vendors (and eventually receives a quote), then ωij=1/n for all i. Clearly, this number can be

17
arbitrarily small, even though the brokers achieved the maximum number of quotes in a collective
sense. In such an example, there may be more brokers in the firm than necessary; however, it is
important to note that ωij alone does not convey that information. For example, with a setting
similar to the one just described, assume that there is a single broker who handles all n jobs. If
that broker is an ineffective negotiator and gets only one quote, then again we have ωij=1/n, but
for a different reason. Note that the metric for a broker only shows the percentage of the potential
mined from the strategy but does not say anything about the quality of that strategy. If a strategy
is profitable, a high value of ωij is desirable; however, if the strategy is not profitable, then
achieving a high value of ωij is less desirable. We discuss this issue in Section 3.2.2.
3.2.2 Measuring the quality of the strategies
Recall that the goal is to analyze how the number and nature of the interactions between broker
and vendors translate into profitability for the company. Although the creation of the strategy bins
allows for differentiation between the vendors, the network does not evaluate the benefit of using
a given strategy, in terms of its impact on profit. To rectify this, we associate weights with the
strategy bins, giving higher weight to strategies that are more desirable. The bin weights are
defined as:
jjj EPw = ,
where
Pj = Total profit from jobs served by vendors matching strategy j
Ej = Effort spent by all brokers on using strategy j across all jobs.
The weights account for not only the profit generated by a strategy but also the effort required to
obtain the quotes – a profitable strategy that requires an excessive amount of brokers’ time to

18
contact vendors may be less desirable. It is difficult to measure the value of Ej given the limited
data available. Recall that recorded call information contains limited job-specific information.
Section 4 presents proxies for the value of Ej, which can be constructed from the available data.
With the bins weights, we define new broker metrics: the weighted quote
∑ ∈=Θ S
Nj ijj
w
i Yw
and the weighted total offer potential
∑ ∈=Ω S
Nj ijj
w
i w ω .
As shown in the empirical study presented in Section 5, the weighted metrics are better indicators
of the broker’s performance than the unweighted metrics.
4 Data Collection Methodology
Given our collaboration with Coyote Logistics, we were able to obtain the data needed to
calibrate and test the network analysis methodology introduced in Section 3. We discuss now
some specific steps we have taken to manipulate the data. During the solicitation process, Coyote
Logistics records information about broker activities which is stored in a company database. The
information includes the vendors called over a period of time, the candidate conditions that hold
for a vendor for a particular job, and the vendor assigned to each job, along with the final
negotiated price. Note that the data on candidate conditions allow for the construction of the
strategy bins introduced in Section 3. Quotes made by other vendors for a job may be recorded
but not all quotes are necessarily entered by the brokers. Our study focuses on data collected over
the period of January 1, 2008 to August 28, 2008.

19
4.1 Network decomposition
The Coyote Logistics database is quite comprehensive due to the scale of their operations.
Therefore, to address complications due to the large volume of data, the job set J is partitioned
into smaller sets. Smaller job sets make data collection and metric calculation easier. Note that,
since the enhanced network of Section 3.2 is job-oriented, we can decompose it across jobs. More
specifically, we partition J into subsets Jd which contain all jobs served on the date d. After
partitioning jobs, the information regarding the jobs in Jd is processed to determine metric values
– e.g., the number of quotes a broker received from a specific strategy bin. Once processed, the
arc values and metrics from the disaggregated networks are added to yield the corresponding
information on the original job set J.
Note also that the basic broker-vendor network described in Section 3.1 and the metrics
dependent on them are not decomposable by jobs; thus, the number of calls Cik, the contact set
Γ(i), the connectivity κi, and the unweighted and weighted offer potential metric, ωij and Ωiw must
be recalculated after the data has been re-aggregated based on the initial data.
The separation of the jobs into the days they were served provides the benefit of a natural way to
separate the data for calibration and testing. To avoid a seasonality bias, the jobs that were served
on odd numbered dates from January 1st to August 31st were used for the determination of the bin
weights. Those weights were used with the data from even numbered dates for the analysis.
4.2 Estimation of effort

20
The unweighted metrics can be calculated from the available Coyote database. However, the bin
weightings require a quantification of effort spent on a strategy, Ej. As mentioned in Section 3,
there is no record of which inquiries a broker made during a call to a vendor. In what follows, we
discuss the assumptions, data processing and approximations necessary to estimate Ej, and
introduce two approaches to approximate the effort.
The first proxy, Ej+, uses the assumption that all vendors called during a fixed time frame prior to
the day a job was served receive an inquiry about the job. This is an overestimation as not all jobs
are presented as an inquiry when a broker calls a vendor. We define Ej+ as follows. If vendor k
was called by any broker during the time horizon of analysis, we add the value Zkj to strategy bin
j, representing the number of jobs in bin j matched by vendor k:
( )∑ ∑∈ Γ∈
+= B
Ni ik kjj ZE .
As stated before, Ej+ overestimates the amount of effort exerted. The overestimation can have
large impacts on some strategy bins. If the strategy occurs frequently, to the extent that a broker
could not feasibly call all vendor nor would such effort be necessary, the value of Ej+ will be very
large, driving the weight of the bin to 0.
The second proxy, Ej- , counts the number of quotes received for each bin, and is defined as
∑ ∈
−= B
Ni ijj YE .
This underestimates the amount of effort dedicated to the strategies since Yij represents only calls
that yield a recorded quote; i.e., calls that do not yield a quote and quotes that are not recorded in
the database are absent in the calculation. This effect from the underestimation can be
compounded when a strategy that rarely generates a quote presents desirable profits when quoted;

21
under this proxy for Ej, the weight of these bins will be artificially inflated and the strategy seems
more important than it actually is.
5 Empirical Study
The first part of the empirical study focuses on the evaluation of the network analysis model. In
particular, we assess the ability of the network analysis model to predict profitability as a function
of the network metrics introduced in Section 3. Further, we examine the value of adding and
weighting the strategy bins in the network analysis (i.e., comparing Figures 1 and 2). The second
part of the empirical study uses the network analysis model to provide general managerial
insights for brokerage operations. In particular, we use the model to develop operating policies
and evaluate the performance of brokers.
As mentioned earlier, the network analysis model can aggregate data for any fixed period of time.
The results presented in this section analyze data for jobs that were served on even dates between
August 2nd and August 28th. To avoid disclosing proprietary information, numbers have been
scaled where necessary.
5.1 Model evaluation
In the basic network model, presented in Figure 1, we quantify the activities of each broker i in
NB with the number of calls, Ψi, the number of quotes, Θi, and the connectivity, κi. We compute
from the latter two values the density of broker i, θi. Table 1 presents regression results for these
four metrics against the profitability of the broker for 88 brokers.

22
Insert Table 1 here.
Observation 1: The information in the basic network does not predict profitability well.
The regression results in Table 1 display a weak increasing trend between profitability and the
number of calls a broker performs; that trend is stronger when the number of quotes is the
independent variable. This is to be expected as, if all jobs and vendors were equal, more calls and
more quotes should translate into more bookings and profit. However, the low R-square values
mean that the metrics cannot be used as powerful predictors of profitability.
Somewhat surprising is that the connectively is (albeit poorly) negatively correlated with
profitability, as indicated by the negative sign of the t-statistic. This suggests, along with the
positive correlation of the density metric, that a larger stable of vendors to call is not necessarily
beneficial and that there are brokers who are benefitting from contacting a more selective set of
vendors.
The enhanced network model, presented in Figure 2, introduces strategy bins. These bins are
weighted by dividing the profit yielded from the bin by the effort exerted in utilizing the bin, Ej.
However, as discussed in Section 4, measuring the effort in utilization of a strategy bin is difficult
given available data. Therefore, we use two proxies to estimate the effort: the number of quotes
received from carriers matching a bin for a given job (Ej-), which underestimates the effort, and
the number of potential jobs for which contacted vendors match a bin for a given job (Ej+), which
overestimates the effort. We present our analysis of the two proxies in Table 2.
Insert Table 2 here.
The empirical tests evaluate the extent to which weight estimates potential. The weights are used
in the two strategy metrics – the weighted quote, Θiw, and the weighted offer potential metric, Ωi
w.

23
Table 2 presents the regression results for the two weighted broker metrics under the two
different weights against profitability of the broker for the same 88 brokers.
Observation 2: The profitability of a broker is better predicted by weighting the number of quotes
received than considering the unweighted number of quotes.
The regression results for the two weighted quotes show a sizeable improvement over the results
using an unweighted number of quotes in Table 1 in correlation and significance. This supports
the modeling decision of classifying the jobs into separate strategies.
The two weighted offer potential results show a positive correlation with profit. Like the density
metric, the weighted offer potential metric is to be used in a supporting role in the evaluation of
brokers.
Observation 3: Estimating the effort of utilization of a strategy bin by potential jobs rather than
quotes leads to better predictive ability.
Looking at the two weighted quote rows (since they are the powerful predictors), it is noteworthy
when comparing the two sets of bin weights that estimating effort by potential jobs, E+,
outperformed estimating effort by quotes, E-. This contrasts with the conclusion from Table 1 that
quotes are a better predictor of profit than either calls or connectivity. A possible reason may be
due to the type of errors that the proxies for effort introduce: Deriving the weights from quotes
may artificially inflate the weight of some bins and deriving weights from potential jobs may
punitively drive the weight of some bins to zero. It is possible that having mediocre bins with
high weight is more misleading than ignoring those bins altogether. The weights generated by
measuring effort by the potential jobs are used hereafter.

24
The regression results in this subsection validate the use of the network model to evaluate
profitability. The results demonstrate how the addition of the strategy bins significantly improves
the information regarding broker vendor interactions over what may otherwise be obtained. We
show that we are able to quantify the relationship between broker and vendor interactions with
company profit despite complications that arise from the difficultly in collecting all the desired
data. The results also suggest that the effort proxies provide reasonable approximations given that
the true data can not be feasibly obtained during real-time operations.
5.2 Managerial insights
5.2.1 Operating policies
The network analysis methodology provides valuable insights into the design of operating
policies to optimize broker activities in soliciting offers from vendors. As the analysis in Section
5.1 indicates, brokers are more likely to generate higher profits when they selectively call vendors
based on a combination of job-specific conditions, rather than simply increasing the absolute
number of calls made for a job. The relative weightings of strategy bins provide guidelines for
brokers to select vendors to call for a specific job. Such guidelines may increase profit by
choosing vendors that are better suited for certain jobs.
The network analysis model can also facilitate more strategic decisions. For example, the model
can project the changes in profitability as either the number of brokers or the number of vendors
in the network increases. Rather than simply increasing the absolute number of vendors, by
evaluating the quality of the strategy bins and the current characteristics of jobs solicited, a
company can seek new business from vendors with certain attributes.

25
It is important to note that because the weights of the bins are constructed from data that is
affected by the behavior of the brokers, changes to operating policies may affect the effectiveness
of a strategy. This is true because even within a strategy, not all jobs are equal, and after a certain
threshold, jobs strategies will be less effective than what is suggested by its weight. For this
reason, it is suggested that the network analysis be regenerated periodically so that the weights
may reflect current behavior.
Lastly, the information generated from the network analysis can provide feedback in the
solicitation of jobs. Given the network of available vendors, brokers who work with customers
soliciting jobs can assess the potential profitability of a job in advance of pricing the job. A job
that does not have many vendors that could serve the job effectively should command a lower
price.
5.2.2 Evaluating brokers
The metrics introduced in Section 3 provide a means to evaluate the performance of brokers.
Brokers can be evaluated relative to other brokers within the company, or relative to their own
performance over time. Table 3 presents an analysis of four brokers, classified by their tenure at
the company as of August 2008. Both metrics independent of strategy bins and those dependent
on strategy bin are listed for each broker. Column 1 displays the number of calls made by the
broker during the time horizon of the study, Ψi; column 2 displays the connectivity of the broker,
κi; column 3 displays the number of quotes received, Θi; column 4 lists the density metric, θi;
column 5 displays the weighted offer potential metric, Ωiw; column 6 displays the weighted quote
metric, Θiw; and column 7 displays the profit earned by the broker.

26
Insert Table 3 here.
Brokers A and B were hired only two months before the analysis, and Brokers C and D were
hired two years prior to the study. As expected, the veteran brokers achieved significantly higher
profits. However, a deeper analysis of their metrics provides interesting observations about
performance which can be used to guide new broker training and continual performance review.
Consistent with Observation 1, the profitability of a broker cannot be predicted solely on the
number of calls. For example, Broker B made far more calls than Broker A, yet Broker A has
double the profitability. The same statement can be made in a comparison between Broker C and
Broker D. Also while the relative ranking is preserved, extrapolating the number of quotes proves
to be a weak predictor of profitability in these examples. Conversely, and anecdotally supporting
Observation 2, the weighted number of quotes acts as a reasonable predictor of profit.
By comparing Brokers C and D to Brokers A and B, it would seem that the veterans far
outperform the new hires. The veterans appear to be more selective in their interactions by
vendor, as evidenced by their higher density metric, compared to the new hires. It is thought that
over time the brokers internalize the guidelines suggested in Section 5.2.1 learning over time
which strategies are effective even if strategy bins are not explicitly stated.
Making the guidelines explicit can be valuable in the training of new employees and accelerate
the learning curve of new hires. Estimates from Coyote Logistics suggest that a two-week
acceleration in the learning curve can improve per broker internal rate of return by 11%.
Observation 4: No single metric contains all information about broker performance. It is
important to consider a composite picture of metrics.

27
In addition to training guidelines, a composite of the metrics may be used to obtain additional
insight. Table 4 presents analysis on an additional two brokers which illustrate how the metrics
may be used to generate a better picture to evaluate a broker’s performance than just the use of
profit.
Insert Table 4 here.
Brokers E and F have been with the company 4 and 3 months, respectively. In comparison to the
new hires in Table 3, both brokers show an improvement in profitability echoing the suggestion
that even a small acceleration to the learning curve may have great benefits. A pairwise
comparison between the two supports the observations in the pairwise comparisons in Table 3.
However, if we compare Brokers C and E we notice that Broker E, despite having a slightly
lower weighted quote metric than Broker C, was more profitable. However, Broker E does have a
higher density and weighted offer potential metric. After a little more investigation, it emerges
that among brokers with a comparable weighted quote metric, Broker C has lower density metric,
weighted offer potential metric and profitability. It suggests that Broker C is not capturing the full
potential of the vendors he contacts and that there is room for further improvement in his/her
performance.
Explicit guidelines on which strategies to choose can also be used to improve retention of brokers
who are strong negotiators but are not proficient in choosing vendors to call. Broker F, while
achieving higher profit than the new hires in Table 3, has a relatively low weighted quote metric
compared to his peers. However his weighted offer potential metric is unusually high. This
suggests that while this broker is gleaning the potential that is available, there is not much total
potential available to him/her; the broker is calling vendors which do not match well to the set of
jobs that are available.

28
The anecdotal data in this subsection support our conclusions about the metrics’ predictive
effectiveness from Section 5.1. Furthermore, these examples support the claim that a small
acceleration to a broker’s learning curve can have a large impact; this motivates the use of the
network analysis to design operating policies for a broker’s activity. Additionally, the data
provide a couple of examples that illustrate how a composite of the metrics may be used to
expose circumstances or behavior that may not be detectable when examining only one metric.
6 Conclusions
This paper presents a network analysis model to study business processes for a third-party
intermediary and introduces a series of new performance metrics. The model and metrics are
calibrated and validated with data from industry. The network analysis is then used to design
operating policies to optimize broker activities. Implementation of the policies suggested by the
network analysis is scheduled to begin in spring 2009.
Future research can expand the network analysis to job solicitation operations in which brokers
solicit jobs from customers. The general approach should be valid; however, new strategy bins
will be required, along with new calibration and validation of the model. Additionally, as
mentioned in Section 5, combining models from both the vendor and customer sides of the
business can provide valuable feedback on the type of jobs to solicit and vendors to contact.
References
Albert, R., Barabási, A-L., 2002. Statistical mechanics of complex networks. Reviews of Modern
Physics 74, 47-97. Armstrong & Associates. 2009. U.S. 3PL/Contract logistics market. http://www.3plogistics.com/3PLmarket.htm, accessed on February 24, 2009.

29
Caplice, C., 1996. An optimization based bidding process: A new framework for shipper-carrier relationships. Ph. D. Thesis, School of Engineering, MIT. Caplice, C., 2007. Electronic markets for truckload transportation. Production and Operations
Management 16 (4), 423-436. Caplice, C., Sheffi, Y., 2003. Optimization-based procurement for transportation services. Journal of Business Logistics 24 (2), 109-128. Dorogovtsev, S.N., Mendes, J.F.F., 2002. Evolution of networks, Advances in Physics 51 (4) 1079-1187. Figliozzi, M., 2004. Analysis of spot truckload procurement markets using sequential auctions. Ph D. Thesis, Faculty of Civil and Environmental Engineering, University of Maryland. Granovetter, M., 1973. The strength of weak ties. The American Journal of Sociology 78 (6) 1360-1380. Granovetter, M., 1985. Economic action and social structure: The problem of embeddedness. The
American Journal of Sociology 91 (3), 481-510. Iravani, S.M.R., Kolfal, B., Van Oyen, M.P., 2007. Call-center labor cross-training: It's a small world after all. Management Science 53 (7) 1102-1112. Ledyard, J.O., Olson, M., Porter, D., Swanson, J.A., Torma, D.P., 2002. The first use of a combined-value auction for transportation services. Interfaces 32 (5), 4-12. Lin I.I, Mahmassani, H.S., Jaillet, P., Walton, C.M., 2002. Electronic marketplaces for transportation services: Shipper considerations. Transportation Research Record 1790, 1-9. Oke A., Idiagbon-Oke, M., Walumbwa, F., 2008. The relationship between brokers’ influence, strength of ties and NPD project outcomes in innovation-driven horizontal networks. Journal of
Operations Management 26(5) 571-589. Sheffi, Y., 2004. Combinatorial auctions in the procurement of transportation services. Interfaces
34 (4), 245-252. Song, J., Regan, A., 2002. Combinatorial auctions for transportation service procurement: The carrier perspective. Journal of Transportation Research Board 1833, 40-46. Transportation Intermediaries Exchange. 2005. Introduction. http://www.tiexchange.net/locked/introduction.shtml, accessed on January 20, 2005. Uzzi, B., 1996. The sources and consequences of embeddedness for economic performance of organizations: The network effect. American Sociological Review, 61 (4), 674-698. Uzzi, B., 1997. Social structure and competition in interfirm networks: The paradox of embeddedness. Administrative Science Quarterly, 42(1), 35-67. Uzzi, B. Spiro, J., 2005. Collaboration and creativity: The small world problem. American
Journal of Sociology, 111(2), 447-504.

30
Watts, D.J., Strogatz, S.H., 1998. Collective dynamics of “small world” networks. Nature 393, 440-442.

31
R Square F t-statistic P-value
Calls, Ψi 0.1958 20.943 4.5764 1.58E-05
Quotes, Θi 0.5612 109.99 10.4875 4.71E-17
Connectivity, κi 0.0878 8.280 -2.8776 .00505
Density, θi 0.3422 44.744 6.6891 2.16E-09
Table 1: Profit predictions from initial network
R Square F t-statistic P-value
Weighted Quotes Θiw with E
- 0.6576 165.138 12.8506 1.02E-21
Weighted Quotes Θiw with E
+ 0.7388 243.195 15.5947 8.52E-27
Weighted Offer Potential Ωiw with E
- 0.2148 23.521 4.8498 5.44E-06
Weighted Offer Potential Ωiw with E
+ 0.2025 21.839 4.6732 1.09E-05
Table 2: Profit predictions from enhanced network
Metrics independent of strategy
Strategy dependent
metrics
Tenure Ψi κi Θi θi Ωiw
Θiw
Profit
New Hires
Broker A 2 mon. 3,872 2,150 50 0.023 96.38 536.11 2,537.55
Broker B 2 mon. 5,784 4,026 42 0.010 41.08 205.87 1,142.06
Veteran employees
Broker C 2 years 4,428 1,280 134 0.104 74.89 1,641.28 7,286.74
Broker D 2 years 3,776 304 162 0.532 132.86 2,295.35 14,828.22
Table 3: Broker productivity analysis
Metrics independent of strategy
Strategy dependent
metrics
Tenure Ψi κi Θi θi Ωiw
Θiw
Profit
Broker E 4 mon. 3,972 602 110 0.182 95.78 1,354.51 10,998.03
Broker F 3 mon. 3,850 1,792 90 0.050 122.83 702.27 3,782.18
Table 4: Broker productivity analysis
32


![IBM WebSphere Message Broker · 2019-07-26 · 'WebSphere Message Broker'. WebSphere Message Broker version 7.0 was announced in October 2009,[2] and WebSphere Message Broker version](https://img.pdfslide.us/doc/110x75/5e7b6e58103adf40463de6db/ibm-websphere-message-broker-2019-07-26-websphere-message-broker-websphere.jpg)