Embed Size (px)
Citation preview
Supplementary Welfare Allowance (BASI)
2016 Fraud & Error Survey
Published 24 November 2017
i
Table of Contents
Table of Contents ......................................................................................................................................... i
List of Tables .................................................................................................................................................. ii
1. Summary ................................................................................................................................................ 1
2. Characteristics of the Basic Supplementary Welfare Allowance Scheme ....................... 2
Overview ............................................................................................................................................. 2
Safety net nature of scheme .............................................................................................................. 2
Recoupment of BASI payments from primary social welfare schemes .............................................. 2
3. Methodology ........................................................................................................................................ 3
Survey principles ................................................................................................................................. 3
Survey procedures .............................................................................................................................. 3
Categorisation of results ..................................................................................................................... 4
Outcome metrics ................................................................................................................................ 5
4. Results ..................................................................................................................................................... 6
Cases affected by Fraud and Error ..................................................................................................... 6
Monetary value of Fraud and Error .................................................................................................... 8
Risk analysis ........................................................................................................................................ 9
5. Conclusions and Control Actions ............................................................................................... 10
Conclusions ....................................................................................................................................... 10
Control actions.................................................................................................................................. 10
Annex 1: List of controls in place for BASI ....................................................................................... 11
Annex 2: Detailed risk analysis results .............................................................................................. 12
List of Tables
Table 1 – Estimated rate of Fraud and Error as a percentage of BASI weekly expenditure, by type ...................... 1
Table 3 – BASI Fraud and Error survey outcomes by type, reason, and number of cases affected ........................ 6
Table 4 – BASI Fraud and Error survey outcomes by type, reason, and percentage of cases affected .................. 7
Table 5 –Fraud and Error outcomes by percentage of cases affected with 95% confidence intervals .................. 7
Table 6 –Fraud and Error outcomes by percentage of total weekly spending with 95% confidence intervals ...... 8
Table 7 –Final Fraud and Error by estimated total weekly overpayment with 95% confidence intervals15
........... 8
Table 10 - Fraud and Error by Scheme Category ................................................................................................... 12
Table 11 - Fraud and Error by Sex ......................................................................................................................... 13
Table 12 - Fraud and Error by Dublin versus outside Dublin ................................................................................. 13
Table 13 - Fraud and Error by Age Band ............................................................................................................... 14
Table 14 - Fraud and Error by Adult or Child Dependants .................................................................................... 14
Table 15 - Fraud and Error by Child Dependants .................................................................................................. 15
Table 16 - Fraud and Error by Adult Dependant ................................................................................................... 15
1. Summary
The Department of Employment Affairs and Social Protection (DEASP) undertakes Fraud and Error surveys to establish baseline fraud and error levels for social welfare schemes. The purpose of these surveys is to identify the level of risk associated with particular schemes and business areas, with a view to designing processes and control measures specifically targeted to minimise the level of future risk.
This is the first Fraud and Error survey to be undertaken on the Basic Supplementary Welfare Allowance (BASI), an allowance awarded as part of the overall Supplementary Welfare Allowance Scheme (see section 2 for a detailed description).
In this survey, 1,000 randomly sampled BASI claims in payment in the week of 14-18 November 2016 (the ‘survey sample week’) were reviewed to assess recipients’ compliance with the rules of the scheme.
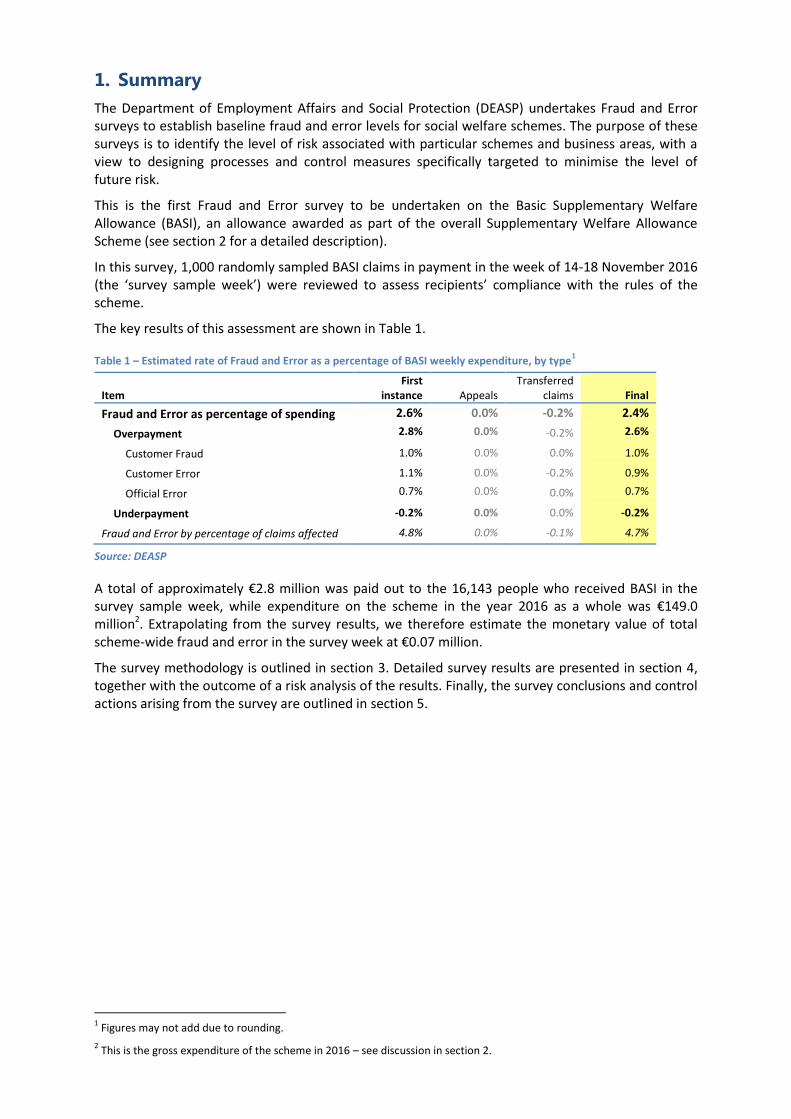
The key results of this assessment are shown in Table 1.
Table 1 – Estimated rate of Fraud and Error as a percentage of BASI weekly expenditure, by type1
Item First
instance Appeals Transferred
claims Final
Fraud and Error as percentage of spending 2.6% 0.0% -0.2% 2.4%
Overpayment 2.8% 0.0% -0.2% 2.6%
Customer Fraud 1.0% 0.0% 0.0% 1.0%
Customer Error 1.1% 0.0% -0.2% 0.9%
Official Error 0.7% 0.0% 0.0% 0.7%
Underpayment -0.2% 0.0% 0.0% -0.2%
Fraud and Error by percentage of claims affected 4.8% 0.0% -0.1% 4.7%
Source: DEASP
A total of approximately €2.8 million was paid out to the 16,143 people who received BASI in the survey sample week, while expenditure on the scheme in the year 2016 as a whole was €149.0 million2. Extrapolating from the survey results, we therefore estimate the monetary value of total scheme-wide fraud and error in the survey week at €0.07 million.
The survey methodology is outlined in section 3. Detailed survey results are presented in section 4, together with the outcome of a risk analysis of the results. Finally, the survey conclusions and control actions arising from the survey are outlined in section 5.
1 Figures may not add due to rounding.
2 This is the gross expenditure of the scheme in 2016 – see discussion in section 2.
2. Characteristics of the Basic Supplementary Welfare Allowance
Scheme
Overview
The Basic Supplementary Welfare Allowance Scheme (BASI) is a weekly allowance paid to people who do not have enough income to meet their needs and those of their families. The allowance may also be paid to people who are awaiting the outcome of a claim, or an appeal, for a primary social welfare payment.
Full details on the operation of the scheme are available at:
http://www.welfare.ie/en/Pages/Basic-Supplementary-Welfare-Allowance.aspx
The operation of the scheme was transferred to the Department in late 2011 from the Health Service Executive (HSE) as part of a restructured Community Welfare Service (CWS). BASI is administered by Designated Persons who are appointed under statute to make claim decisions.
Safety net nature of scheme
Apart from a number of excluded categories, anyone in the State who satisfies a habitual residence condition (HRC) and a means test may qualify for BASI.
The BASI scheme, by virtue of the fact that it is a safety net, has a fluid and diverse customer base. Many recipients are in receipt of support for a short period of time, while others go on and off scheme support at regular intervals. In determining eligibility for BASI a Designated Person is also establishing means and need.
There is a high level of customer engagement as part of the BASI application process, which allows for comprehensive information to be gathered at claim stage.
Recoupment of BASI payments from primary social welfare schemes
Generally, about half of BASI recipients are awaiting the outcome of a decision on a claim or appeal in relation to a primary social welfare payment, such as Jobseeker’s Allowance or Disability Allowance. When this claim is awarded and a back-dated entitlement to the primary payment is established, BASI payments are then recouped from the primary social welfare scheme.
In 2016, some 40 percent of gross BASI expenditure was recouped in this way: gross spending was €149 million, whereas net spending was €89 million. The gross measure of scheme expenditure is used throughout this survey report.
3. Methodology
Survey principles
The Statistics and Business Intelligence Unit of the Department, a part of the Irish Statistical System, oversees the design, sample selection, analysis, and reporting of the Department’s Fraud and Error surveys. The Chief Statistician ensures that these statistics are produced in an objective, transparent and independent manner, in line with the requirements of the Irish Statistical System Code of
Practice3.
In addition, the Department, in agreement with the Comptroller & Auditor General (C&AG), applies the following specific principles to the design and implementation of Fraud & Error surveys:
All cases for inclusion in the survey must be selected randomly from the population of cases in payment at a specific time;
The sample size must be sufficiently large to yield reasonably reliable estimates;
The reviews should be carried out as promptly as possible;
Cases should be tested fully for all possible breaches of regulations;
The monetary values of any changes as a result of the review, together with the monetary value of the sample, should be captured so that the results can be extrapolated to draw conclusions about the estimated value of the loss; and
The results of the survey should be capable of being audited.
Survey procedures
For this survey, the Statistics and Business Intelligence Unit selected a representative stratified random sample4 of 1,000 BASI claims from the 16,143 claims in payment in the survey sample week - 14th -18th November 2016 (‘the Fraud and Error sample’). This sample size was chosen in order to strike a right balance between the statistical power of the survey needed to represent the diverse nature of the scheme, and the resource-intensive nature of the work by Designated Persons5 required for determining the correct benefit entitlements of the selected customers.
Each case selected in the sample was assigned to a Designated Person to conduct a review of the claim. Each claim was reviewed6 for proof of identity, HRC / EU Migrant Status, means correctness, and household composition.
The benefit correctness assessment was completed for all cases regardless of whether the claim was open or closed when the customer was first contacted for the purposes of the survey7.
The base payment rate is the customer’s weekly payment rate in the last week of payment before the customer is first contacted7 by the Department for the purposes of the survey.
The survey payment rate is the correct weekly payment rate as established by this assessment.
3 http://www.isscop.ie/codeofpractice/
4 The stratification variables used were claim category, sex, age band, and county of residence.
5 As noted in section 2, BASI claim decisions are made by Designated Persons appointed under statute for the
determination of the entitlement of a person to supplementary welfare allowance and the amount of any such allowance.
6 If a claim had been awarded and/or reviewed in the three months prior to receipt by the reviewing officer of the claim, a
desk assessment could be undertaken. Details on how to conduct a desk assessment were provided. Notwithstanding this, in order to ensure that a representative sample was interviewed, each Designated Person was required to ensure that a minimum of 50% of all reviews assigned to them were conducted in person. Additional cases had to be selected at random.
7 For those cases where customer contact was not deemed necessary due to award or review of the claim within the
previous three months, the relevant date is taken to be the date on which the review was initiated by the Designated Person.
Claim decisions were reviewed by a Departmental expert group, chaired by the Chief Statistician and including representatives of the Control Division and the BASI policy area, before arriving at a final categorisation.
Categorisation of results8
The primary categorisation for each case is between Fraud and Error and Benefit Correct. This rests on the decision taken on each case according to the survey procedures outlined above.
Cases classified as Fraud and Error may be further categorised in two ways: first, by the type of payment rate change resulting from the review of a case, and second, by the main type of Fraud or Error detected. For completeness, as well as the headline final outcome for each case, we also report on the first instance outcome.
Fraud and Error versus Benefit Correct
Fraud and Error: the customer was receiving a materially incorrect rate of benefit at the time of the survey9.
Benefit Correct: all other cases.
Fraud and Error cases by type of payment rate change9
Overpayment: the base payment rate is higher than the survey payment rate – that is, the customer was previously receiving too high a rate of benefit each week.
Underpayment: the base payment rate is lower than the survey payment rate – that is, the customer was previously receiving too low a rate of benefit each week.
Fraud and Error cases by type of Fraud or Error
Customer Fraud: it appears to the Designated Person that the criteria of section 325(a) of the Social Welfare Consolidation Act 2005 have been met: this means that the customer knowingly gave false or misleading information and/or wilfully concealed information material to their claim10.
Customer Error: the customer received the wrong rate of benefit because the information they provided was not sufficiently complete, timely and/or accurate. However, it does not appear to the Designated Person that the criteria of section 325(a) of the Social Welfare Consolidation Act 2005 have been met.
Official Error: the customer’s benefit has been paid incorrectly due to inaction, delay or a mistaken assessment on the part of the Department’s officials.
8. The definitions here have been aligned with the Fraud and Error methodology developed by the UK Department of Work
and Pensions with oversight from the UK National Audit Office, as much as is consistent with the different legal frameworks, customs and practices in the two jurisdictions. For further details, please see: https://www.gov.uk/government/uploads/system/uploads/attachment_data/file/614512/fraud-and-error-background-and-methodology-2016-17.pdf
9 The focus of the survey reviews is the correctness of the benefit entitlement at the time of the review: Fraud and Error
cases are identified, and Overpayment/Underpayment amounts are recorded, where there is a difference found between the Base Payment Rate (pre-review) and the Survey Payment Rate (at time of review).
All cases where there is no material difference between the Base Payment Rate and Survey Payment Rate are recorded as Benefit Correct. In the course of a claim review of such a case, however, information may come to light which shows that the customer received the wrong rate of benefit at some earlier time in the history of their claim. In other words, a ‘historical’ overpayment or underpayment was found, but the customer was receiving the correct rate of benefit at the time of the survey. Although these cases do not impact on overall Fraud and Error, they are shown explicitly in Table 4 and Table 5, and are also included in our Risk Analysis.
10 For the purposes of this survey, it is not necessary for an overpayment to have been raised against the customer where a
Fraud or Error outcome is recorded.
First instance and final case outcomes
First instance outcome:11 this is the outcome of the first instance decision taken about a case before transfers to other DEASP schemes and successful appeals.
Final outcome11: this is the case outcome after taking account of transfers to other DEASP schemes and successful appeals.
Outcome metrics
The headline outcome metric is the expenditure impact of total Fraud and Error on a final outcome basis. Results are also presented in terms of the proportion of cases affected by Fraud and Error. Finally, the expenditure impact metric is combined with information about actual overpayment recoveries to produce a metric for the net loss to Government arising from Fraud and Error.
Cases affected
The number of cases affected metric is simply a count of all cases categorised as Fraud or Error in a given category12.
The proportion of cases affected metric is the number of cases affected divided by the total sample size12.
Both overpayment and underpayment cases count towards the number of cases affected metric for overall Fraud and Error13.
As well as the overall result, results according to the cases affected metric are also presented for every sub-category of Fraud or Error – that is, by type of rate change; by type of Fraud or Error; and by first instance versus final outcome. Moreover, a further breakdown of each category by principal reason for Fraud or Error outcome is included with these results.
Expenditure impact
The percentage expenditure impact metric is the total net change in payment rates in a given category detected in the survey, divided by the total of all base payment rates of the customers in the survey sample.
The monetary impact metric is the percentage expenditure impact multiplied by the total scheme expenditure for a given period.
Overpayment cases thus increase the overall expenditure impact of Fraud and Error, whereas underpayment cases decrease it. As well as the overall result, results according to the expenditure impact metric are also presented for every sub-category of Fraud or Error – that is, by type of rate change; by type of Fraud or Error; and by first instance versus final outcome.
11
‘First instance’ and ‘Final’ were referred to in previous survey reports as ‘Gross’ and ‘Net’ respectively.
12 This count is reweighted where necessary if differential sampling rates have been used.
13 As detailed in footnote 9, cases with a historical fraud or error but which are Benefit Correct in the Base Payment Week
do not count towards the overall Fraud and Error rate, either in terms of number of cases affected or expenditure impact.
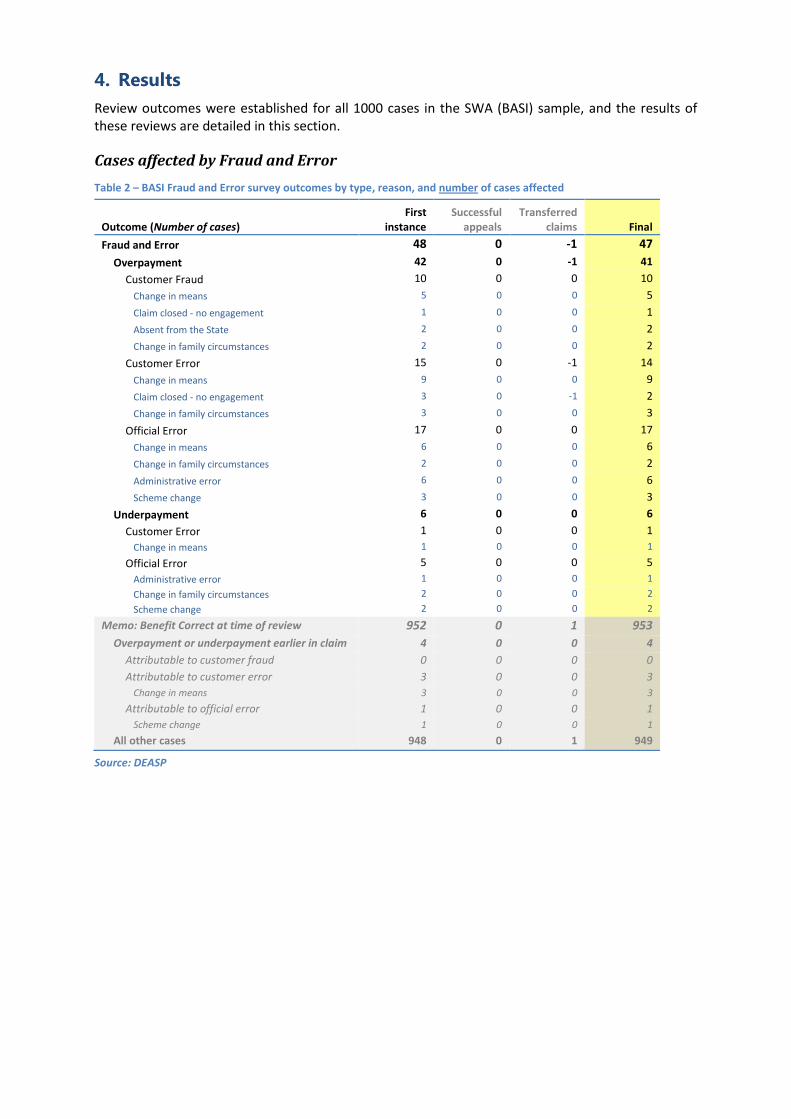
4. Results
Review outcomes were established for all 1000 cases in the SWA (BASI) sample, and the results of these reviews are detailed in this section.
Cases affected by Fraud and Error
Table 2 – BASI Fraud and Error survey outcomes by type, reason, and number of cases affected
Outcome (Number of cases) First
instance Successful
appeals Transferred
claims Final
Fraud and Error 48 0 -1 47
Overpayment 42 0 -1 41
Customer Fraud 10 0 0 10
Change in means 5 0 0 5
Claim closed - no engagement 1 0 0 1
Absent from the State 2 0 0 2
Change in family circumstances 2 0 0 2
Customer Error 15 0 -1 14
Change in means 9 0 0 9
Claim closed - no engagement 3 0 -1 2
Change in family circumstances 3 0 0 3
Official Error 17 0 0 17
Change in means 6 0 0 6
Change in family circumstances 2 0 0 2
Administrative error 6 0 0 6
Scheme change 3 0 0 3
Underpayment 6 0 0 6
Customer Error 1 0 0 1
Change in means 1 0 0 1
Official Error 5 0 0 5
Administrative error 1 0 0 1
Change in family circumstances 2 0 0 2
Scheme change 2 0 0 2
Memo: Benefit Correct at time of review 952 0 1 953
Overpayment or underpayment earlier in claim 4 0 0 4
Attributable to customer fraud 0 0 0 0
Attributable to customer error 3 0 0 3
Change in means 3 0 0 3
Attributable to official error 1 0 0 1
Scheme change 1 0 0 1
All other cases 948 0 1 949
Source: DEASP
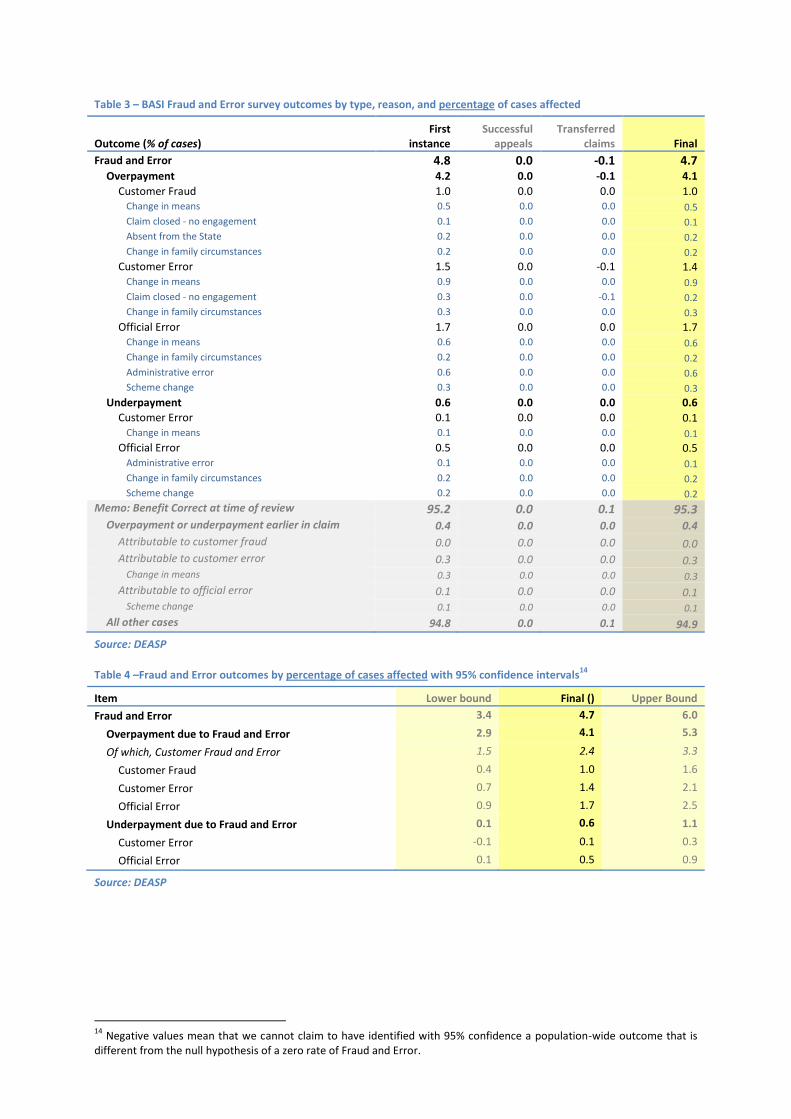
Table 3 – BASI Fraud and Error survey outcomes by type, reason, and percentage of cases affected
Outcome (% of cases) First
instance Successful
appeals Transferred
claims Final
Fraud and Error 4.8 0.0 -0.1 4.7 Overpayment 4.2 0.0 -0.1 4.1
Customer Fraud 1.0 0.0 0.0 1.0 Change in means 0.5 0.0 0.0 0.5
Claim closed - no engagement 0.1 0.0 0.0 0.1
Absent from the State 0.2 0.0 0.0 0.2
Change in family circumstances 0.2 0.0 0.0 0.2
Customer Error 1.5 0.0 -0.1 1.4 Change in means 0.9 0.0 0.0 0.9
Claim closed - no engagement 0.3 0.0 -0.1 0.2
Change in family circumstances 0.3 0.0 0.0 0.3
Official Error 1.7 0.0 0.0 1.7 Change in means 0.6 0.0 0.0 0.6
Change in family circumstances 0.2 0.0 0.0 0.2
Administrative error 0.6 0.0 0.0 0.6
Scheme change 0.3 0.0 0.0 0.3
Underpayment 0.6 0.0 0.0 0.6
Customer Error 0.1 0.0 0.0 0.1 Change in means 0.1 0.0 0.0 0.1
Official Error 0.5 0.0 0.0 0.5 Administrative error 0.1 0.0 0.0 0.1
Change in family circumstances 0.2 0.0 0.0 0.2
Scheme change 0.2 0.0 0.0 0.2
Memo: Benefit Correct at time of review 95.2 0.0 0.1 95.3 Overpayment or underpayment earlier in claim 0.4 0.0 0.0 0.4
Attributable to customer fraud 0.0 0.0 0.0 0.0 Attributable to customer error 0.3 0.0 0.0 0.3
Change in means 0.3 0.0 0.0 0.3
Attributable to official error 0.1 0.0 0.0 0.1 Scheme change 0.1 0.0 0.0 0.1
All other cases 94.8 0.0 0.1 94.9
Source: DEASP
Table 4 –Fraud and Error outcomes by percentage of cases affected with 95% confidence intervals14
Item Lower bound Final () Upper Bound
Fraud and Error 3.4 4.7 6.0
Overpayment due to Fraud and Error 2.9 4.1 5.3
Of which, Customer Fraud and Error 1.5 2.4 3.3
Customer Fraud 0.4 1.0 1.6
Customer Error 0.7 1.4 2.1
Official Error 0.9 1.7 2.5
Underpayment due to Fraud and Error 0.1 0.6 1.1
Customer Error -0.1 0.1 0.3
Official Error 0.1 0.5 0.9
Source: DEASP
14
Negative values mean that we cannot claim to have identified with 95% confidence a population-wide outcome that is different from the null hypothesis of a zero rate of Fraud and Error.
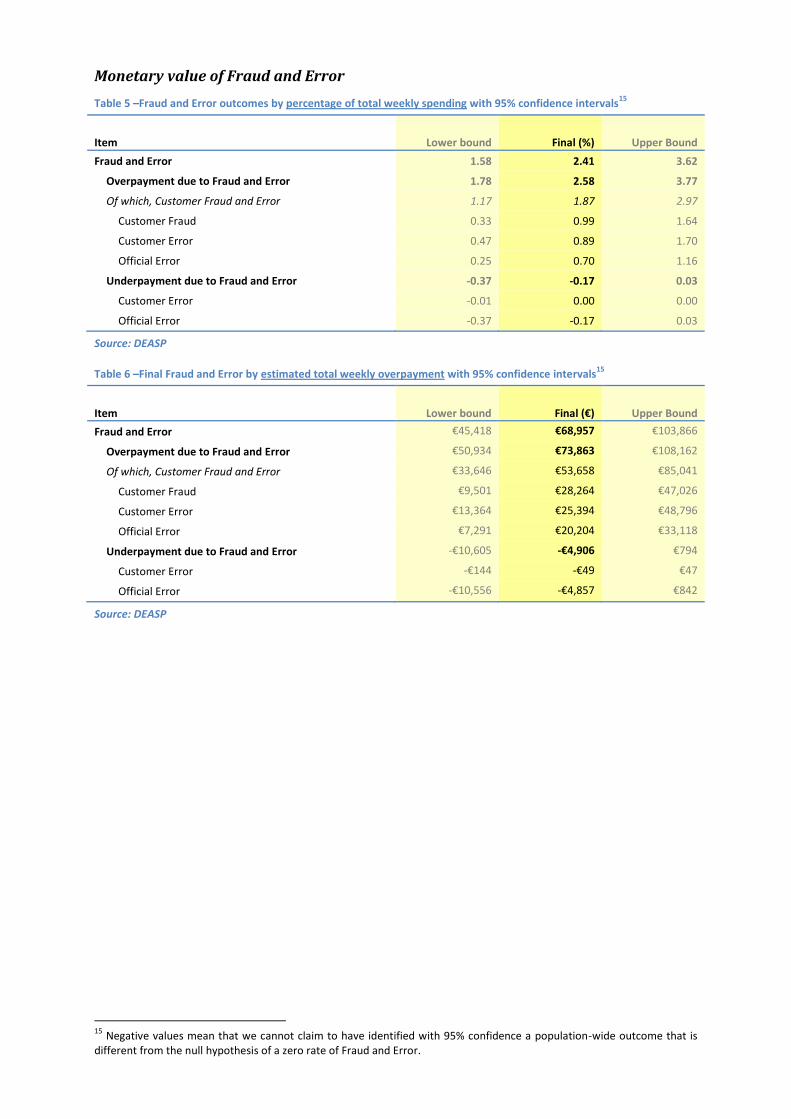
Monetary value of Fraud and Error
Table 5 –Fraud and Error outcomes by percentage of total weekly spending with 95% confidence intervals15
Item Lower bound Final (%) Upper Bound
Fraud and Error 1.58 2.41 3.62
Overpayment due to Fraud and Error 1.78 2.58 3.77
Of which, Customer Fraud and Error 1.17 1.87 2.97
Customer Fraud 0.33 0.99 1.64
Customer Error 0.47 0.89 1.70
Official Error 0.25 0.70 1.16
Underpayment due to Fraud and Error -0.37 -0.17 0.03
Customer Error -0.01 0.00 0.00
Official Error -0.37 -0.17 0.03
Source: DEASP
Table 6 –Final Fraud and Error by estimated total weekly overpayment with 95% confidence intervals15
Item Lower bound Final (€) Upper Bound
Fraud and Error €45,418 €68,957 €103,866
Overpayment due to Fraud and Error €50,934 €73,863 €108,162
Of which, Customer Fraud and Error €33,646 €53,658 €85,041
Customer Fraud €9,501 €28,264 €47,026
Customer Error €13,364 €25,394 €48,796
Official Error €7,291 €20,204 €33,118
Underpayment due to Fraud and Error -€10,605 -€4,906 €794
Customer Error -€144 -€49 €47
Official Error -€10,556 -€4,857 €842
Source: DEASP
15
Negative values mean that we cannot claim to have identified with 95% confidence a population-wide outcome that is different from the null hypothesis of a zero rate of Fraud and Error.
Risk analysis
The sample was divided into two groups: those with and without a recorded Customer Fraud or Error outcome16. Statistical tests were used to identify potential predictor variables for a fraud or error outcome from the administrative data held by the Department for the scheme – specifically, claim category, sex, age band, Dublin / not Dublin address, presence of child or adult dependants. Detailed results of these statistical tests are shown in Annex 2.
One statistically significant relationship was established: the 17% of cases where the customer had an adult dependant were found to be proportionately over twice as likely to show a Customer Fraud or Error outcome as those with no adult dependant.
Statistically significant risk relationships were not found for the other variables tested.
16
All Customer Fraud and Customer Error cases are included here, as are any cases where survey week benefit was found to be correct but where a historical customer fraud or error was detected in the course of the claim review (see footnote 9 on page 6 and Table 2 on page 8).
5. Conclusions and Control Actions
Conclusions
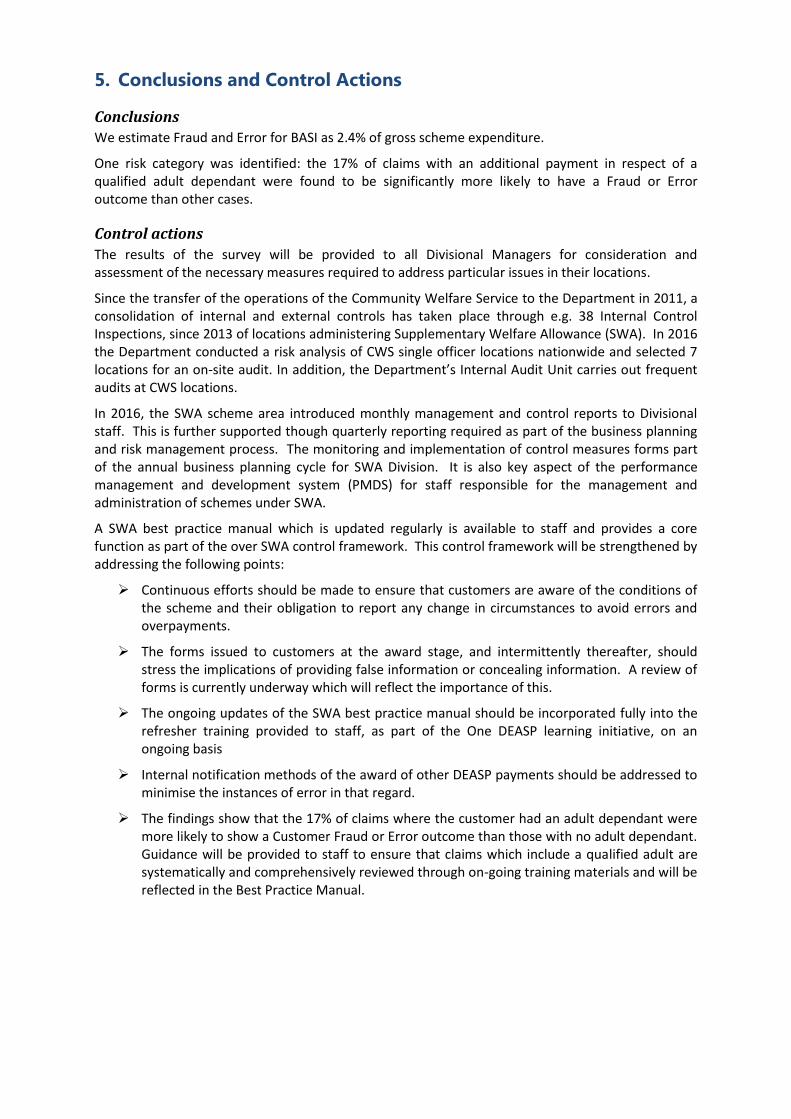
We estimate Fraud and Error for BASI as 2.4% of gross scheme expenditure.
One risk category was identified: the 17% of claims with an additional payment in respect of a qualified adult dependant were found to be significantly more likely to have a Fraud or Error outcome than other cases.
Control actions
The results of the survey will be provided to all Divisional Managers for consideration and assessment of the necessary measures required to address particular issues in their locations.
Since the transfer of the operations of the Community Welfare Service to the Department in 2011, a consolidation of internal and external controls has taken place through e.g. 38 Internal Control Inspections, since 2013 of locations administering Supplementary Welfare Allowance (SWA). In 2016 the Department conducted a risk analysis of CWS single officer locations nationwide and selected 7 locations for an on-site audit. In addition, the Department’s Internal Audit Unit carries out frequent audits at CWS locations.
In 2016, the SWA scheme area introduced monthly management and control reports to Divisional staff. This is further supported though quarterly reporting required as part of the business planning and risk management process. The monitoring and implementation of control measures forms part of the annual business planning cycle for SWA Division. It is also key aspect of the performance management and development system (PMDS) for staff responsible for the management and administration of schemes under SWA.
A SWA best practice manual which is updated regularly is available to staff and provides a core function as part of the over SWA control framework. This control framework will be strengthened by addressing the following points:
Continuous efforts should be made to ensure that customers are aware of the conditions of the scheme and their obligation to report any change in circumstances to avoid errors and overpayments.
The forms issued to customers at the award stage, and intermittently thereafter, should stress the implications of providing false information or concealing information. A review of forms is currently underway which will reflect the importance of this.
The ongoing updates of the SWA best practice manual should be incorporated fully into the refresher training provided to staff, as part of the One DEASP learning initiative, on an ongoing basis
Internal notification methods of the award of other DEASP payments should be addressed to minimise the instances of error in that regard.
The findings show that the 17% of claims where the customer had an adult dependant were more likely to show a Customer Fraud or Error outcome than those with no adult dependant. Guidance will be provided to staff to ensure that claims which include a qualified adult are systematically and comprehensively reviewed through on-going training materials and will be reflected in the Best Practice Manual.
Annex 1: List of controls in place for BASI
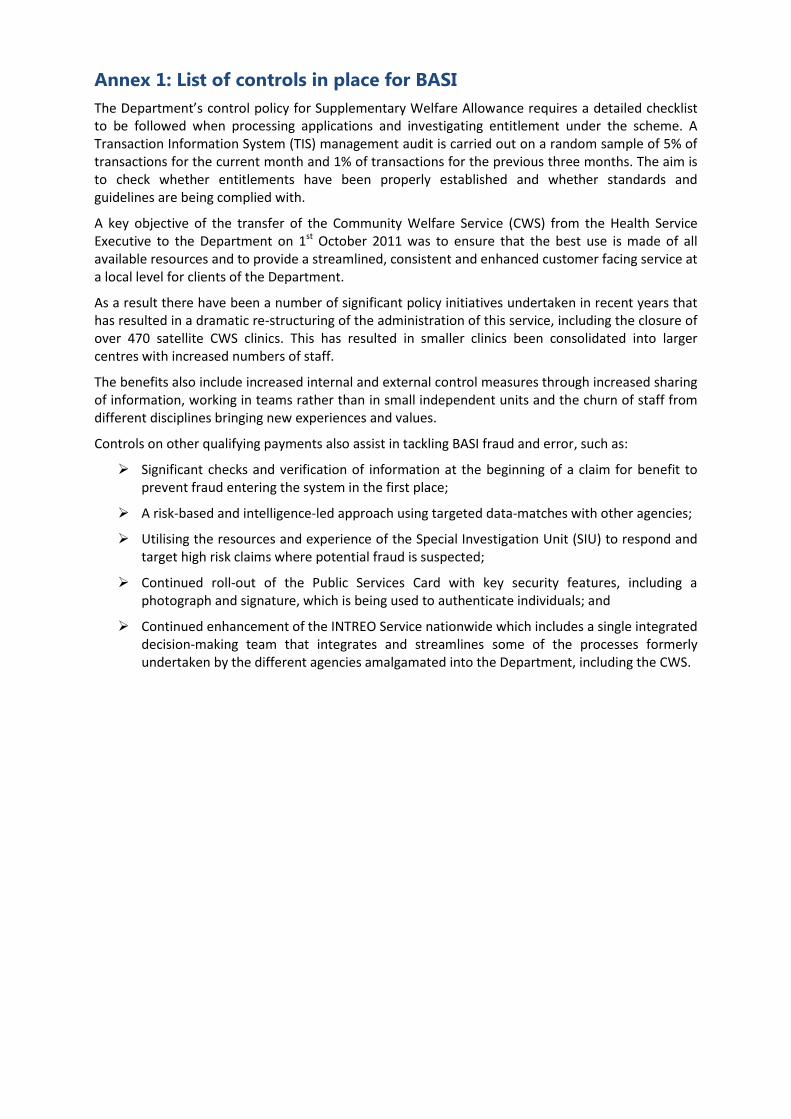
The Department’s control policy for Supplementary Welfare Allowance requires a detailed checklist to be followed when processing applications and investigating entitlement under the scheme. A Transaction Information System (TIS) management audit is carried out on a random sample of 5% of transactions for the current month and 1% of transactions for the previous three months. The aim is to check whether entitlements have been properly established and whether standards and guidelines are being complied with.
A key objective of the transfer of the Community Welfare Service (CWS) from the Health Service Executive to the Department on 1st October 2011 was to ensure that the best use is made of all available resources and to provide a streamlined, consistent and enhanced customer facing service at a local level for clients of the Department.
As a result there have been a number of significant policy initiatives undertaken in recent years that has resulted in a dramatic re-structuring of the administration of this service, including the closure of over 470 satellite CWS clinics. This has resulted in smaller clinics been consolidated into larger centres with increased numbers of staff.
The benefits also include increased internal and external control measures through increased sharing of information, working in teams rather than in small independent units and the churn of staff from different disciplines bringing new experiences and values.
Controls on other qualifying payments also assist in tackling BASI fraud and error, such as:
Significant checks and verification of information at the beginning of a claim for benefit to prevent fraud entering the system in the first place;
A risk-based and intelligence-led approach using targeted data-matches with other agencies;
Utilising the resources and experience of the Special Investigation Unit (SIU) to respond and target high risk claims where potential fraud is suspected;
Continued roll-out of the Public Services Card with key security features, including a photograph and signature, which is being used to authenticate individuals; and
Continued enhancement of the INTREO Service nationwide which includes a single integrated decision-making team that integrates and streamlines some of the processes formerly undertaken by the different agencies amalgamated into the Department, including the CWS.
Annex 2: Detailed risk analysis results
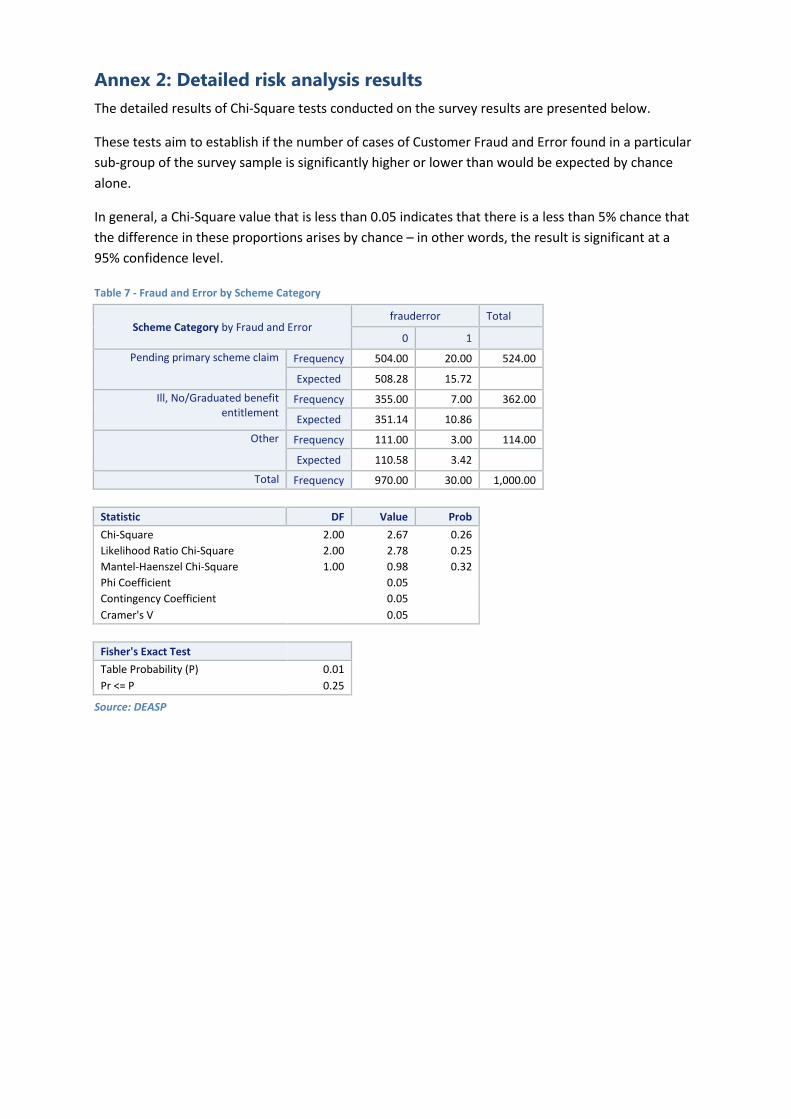
The detailed results of Chi-Square tests conducted on the survey results are presented below.
These tests aim to establish if the number of cases of Customer Fraud and Error found in a particular
sub-group of the survey sample is significantly higher or lower than would be expected by chance
alone.
In general, a Chi-Square value that is less than 0.05 indicates that there is a less than 5% chance that
the difference in these proportions arises by chance – in other words, the result is significant at a
95% confidence level.
Table 7 - Fraud and Error by Scheme Category
Scheme Category by Fraud and Error frauderror Total
0 1
Pending primary scheme claim Frequency 504.00 20.00 524.00
Expected 508.28 15.72
Ill, No/Graduated benefit entitlement
Frequency 355.00 7.00 362.00
Expected 351.14 10.86
Other Frequency 111.00 3.00 114.00
Expected 110.58 3.42
Total Frequency 970.00 30.00 1,000.00
Statistic DF Value Prob
Chi-Square 2.00 2.67 0.26
Likelihood Ratio Chi-Square 2.00 2.78 0.25
Mantel-Haenszel Chi-Square 1.00 0.98 0.32
Phi Coefficient
0.05
Contingency Coefficient
0.05
Cramer's V 0.05
Fisher's Exact Test
Table Probability (P) 0.01
Pr <= P 0.25
Source: DEASP
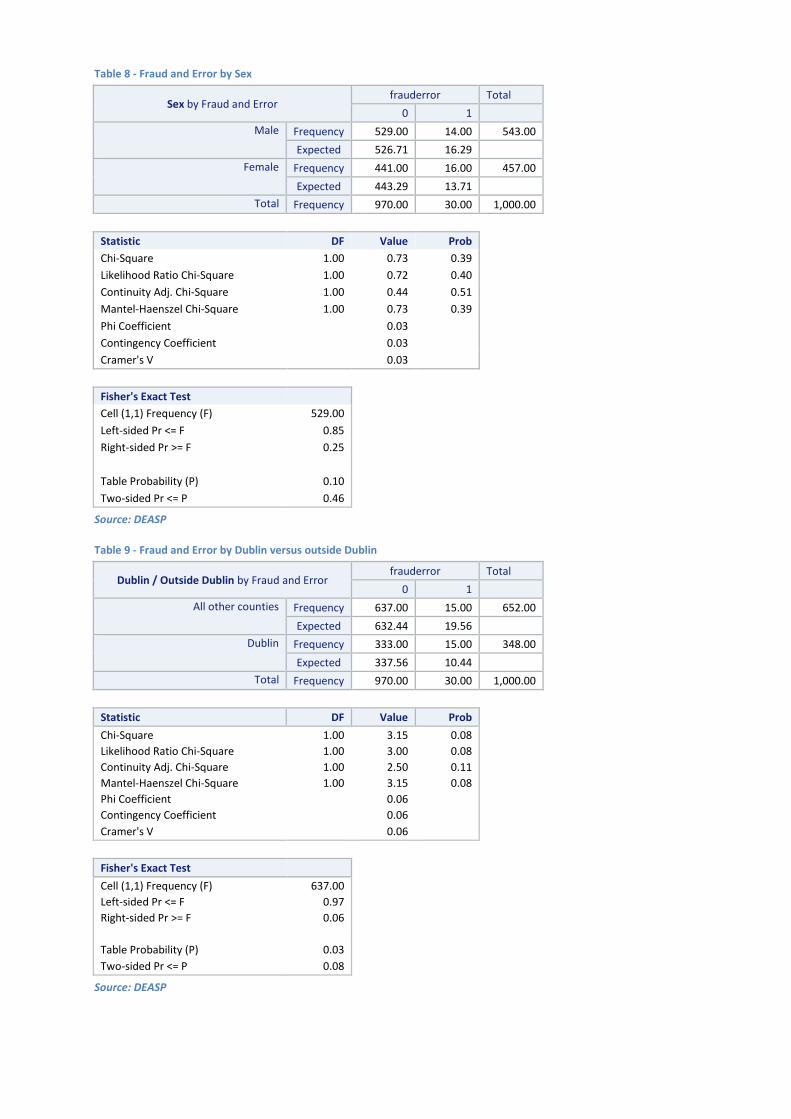
Table 8 - Fraud and Error by Sex
Sex by Fraud and Error frauderror Total
0 1
Male Frequency 529.00 14.00 543.00
Expected 526.71 16.29
Female Frequency 441.00 16.00 457.00
Expected 443.29 13.71
Total Frequency 970.00 30.00 1,000.00
Statistic DF Value Prob
Chi-Square 1.00 0.73 0.39
Likelihood Ratio Chi-Square 1.00 0.72 0.40
Continuity Adj. Chi-Square 1.00 0.44 0.51
Mantel-Haenszel Chi-Square 1.00 0.73 0.39
Phi Coefficient 0.03
Contingency Coefficient 0.03
Cramer's V 0.03
Fisher's Exact Test
Cell (1,1) Frequency (F) 529.00
Left-sided Pr <= F 0.85
Right-sided Pr >= F 0.25
Table Probability (P) 0.10
Two-sided Pr <= P 0.46
Source: DEASP
Table 9 - Fraud and Error by Dublin versus outside Dublin
Dublin / Outside Dublin by Fraud and Error frauderror Total
0 1
All other counties Frequency 637.00 15.00 652.00
Expected 632.44 19.56
Dublin Frequency 333.00 15.00 348.00
Expected 337.56 10.44
Total Frequency 970.00 30.00 1,000.00
Statistic DF Value Prob
Chi-Square 1.00 3.15 0.08
Likelihood Ratio Chi-Square 1.00 3.00 0.08
Continuity Adj. Chi-Square 1.00 2.50 0.11
Mantel-Haenszel Chi-Square 1.00 3.15 0.08
Phi Coefficient
0.06
Contingency Coefficient
0.06
Cramer's V 0.06
Fisher's Exact Test
Cell (1,1) Frequency (F) 637.00
Left-sided Pr <= F 0.97
Right-sided Pr >= F 0.06
Table Probability (P) 0.03
Two-sided Pr <= P 0.08
Source: DEASP
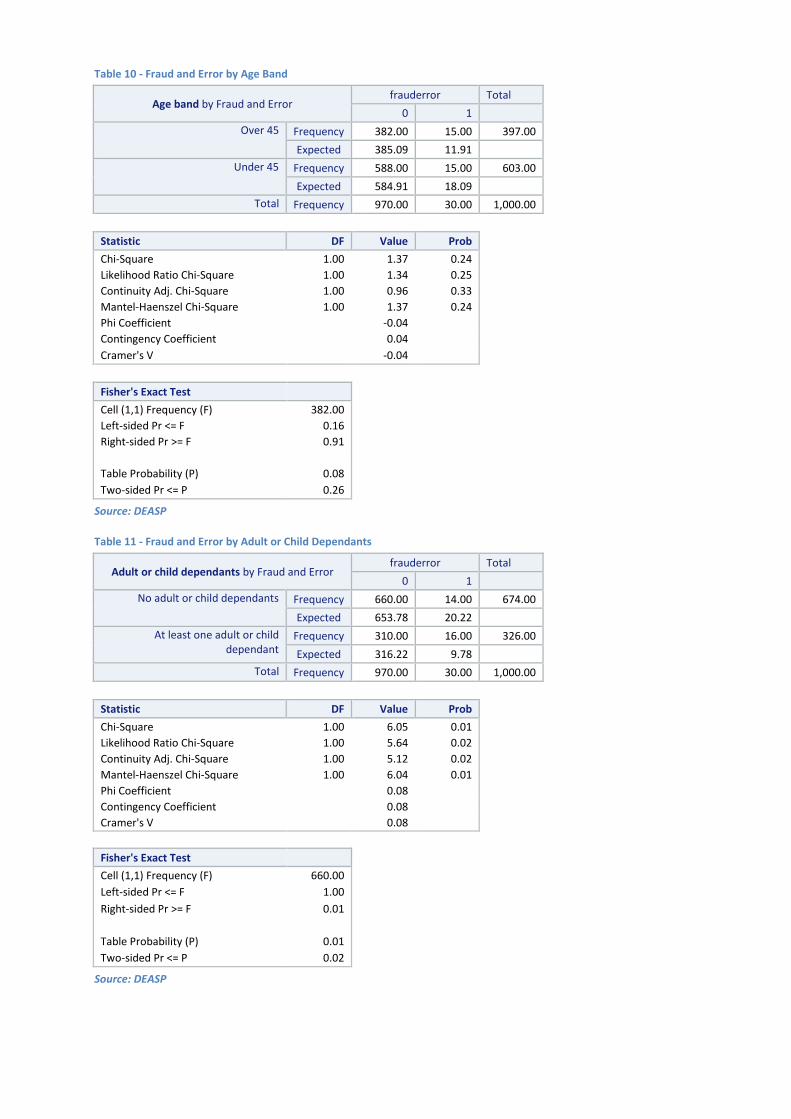
Table 10 - Fraud and Error by Age Band
Age band by Fraud and Error frauderror Total
0 1
Over 45 Frequency 382.00 15.00 397.00
Expected 385.09 11.91
Under 45 Frequency 588.00 15.00 603.00
Expected 584.91 18.09
Total Frequency 970.00 30.00 1,000.00
Statistic DF Value Prob
Chi-Square 1.00 1.37 0.24
Likelihood Ratio Chi-Square 1.00 1.34 0.25
Continuity Adj. Chi-Square 1.00 0.96 0.33
Mantel-Haenszel Chi-Square 1.00 1.37 0.24
Phi Coefficient
-0.04
Contingency Coefficient
0.04
Cramer's V -0.04
Fisher's Exact Test
Cell (1,1) Frequency (F) 382.00
Left-sided Pr <= F 0.16
Right-sided Pr >= F 0.91
Table Probability (P) 0.08
Two-sided Pr <= P 0.26
Source: DEASP
Table 11 - Fraud and Error by Adult or Child Dependants
Adult or child dependants by Fraud and Error frauderror Total
0 1
No adult or child dependants Frequency 660.00 14.00 674.00
Expected 653.78 20.22
At least one adult or child dependant
Frequency 310.00 16.00 326.00
Expected 316.22 9.78
Total Frequency 970.00 30.00 1,000.00
Statistic DF Value Prob
Chi-Square 1.00 6.05 0.01
Likelihood Ratio Chi-Square 1.00 5.64 0.02
Continuity Adj. Chi-Square 1.00 5.12 0.02
Mantel-Haenszel Chi-Square 1.00 6.04 0.01
Phi Coefficient
0.08
Contingency Coefficient
0.08
Cramer's V 0.08
Fisher's Exact Test
Cell (1,1) Frequency (F) 660.00
Left-sided Pr <= F 1.00
Right-sided Pr >= F 0.01
Table Probability (P) 0.01
Two-sided Pr <= P 0.02
Source: DEASP
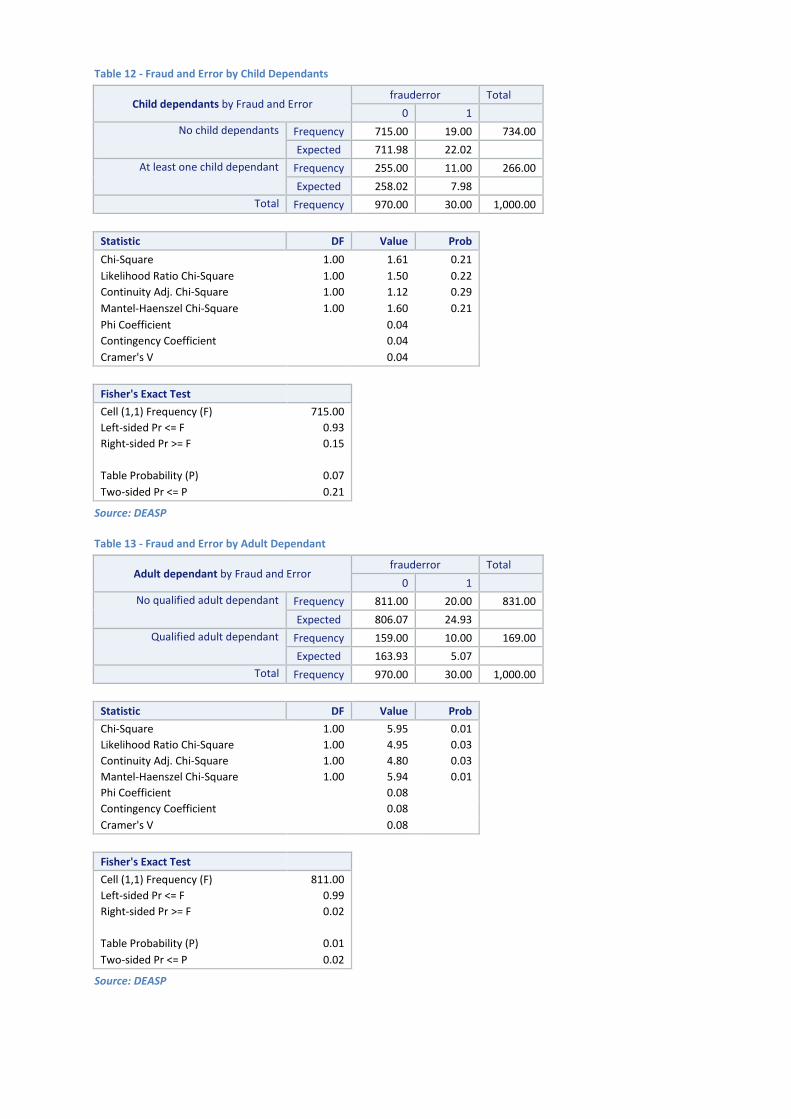
Table 12 - Fraud and Error by Child Dependants
Child dependants by Fraud and Error frauderror Total
0 1
No child dependants Frequency 715.00 19.00 734.00
Expected 711.98 22.02
At least one child dependant Frequency 255.00 11.00 266.00
Expected 258.02 7.98
Total Frequency 970.00 30.00 1,000.00
Statistic DF Value Prob
Chi-Square 1.00 1.61 0.21
Likelihood Ratio Chi-Square 1.00 1.50 0.22
Continuity Adj. Chi-Square 1.00 1.12 0.29
Mantel-Haenszel Chi-Square 1.00 1.60 0.21
Phi Coefficient
0.04
Contingency Coefficient
0.04
Cramer's V 0.04
Fisher's Exact Test
Cell (1,1) Frequency (F) 715.00
Left-sided Pr <= F 0.93
Right-sided Pr >= F 0.15
Table Probability (P) 0.07
Two-sided Pr <= P 0.21
Source: DEASP
Table 13 - Fraud and Error by Adult Dependant
Adult dependant by Fraud and Error frauderror Total
0 1
No qualified adult dependant Frequency 811.00 20.00 831.00
Expected 806.07 24.93
Qualified adult dependant Frequency 159.00 10.00 169.00
Expected 163.93 5.07
Total Frequency 970.00 30.00 1,000.00
Statistic DF Value Prob
Chi-Square 1.00 5.95 0.01
Likelihood Ratio Chi-Square 1.00 4.95 0.03
Continuity Adj. Chi-Square 1.00 4.80 0.03
Mantel-Haenszel Chi-Square 1.00 5.94 0.01
Phi Coefficient
0.08
Contingency Coefficient
0.08
Cramer's V 0.08
Fisher's Exact Test
Cell (1,1) Frequency (F) 811.00
Left-sided Pr <= F 0.99
Right-sided Pr >= F 0.02
Table Probability (P) 0.01
Two-sided Pr <= P 0.02
Source: DEASP