Embed Size (px)
Citation preview
Supplementary Table 1. Fatty acid composition of diets (expressed as % of total FA)
Saturated Diet 8.8 6.4 31.7 0.7 6.1 24.4 17.9 0.2 0.5 0.5 53.4 25.0
MUFA-Rich Diet 0.1 0.7 8.7 0.8 3.1 66.4 15.9 0.4 0.5 0.5 13.0 67.4
18:1 18:2 20:5 22:6 Total Total12:0 14:0 16:0 16:1 18:0 (n-9) (n-6) 20:0 (n-3) (n-3) SFA MUFA
Supplementary Table 2. Primers used for quantitative Real Time PCR (qPCR)
Gene Accession # Forward Primer Reverse Primer
stearoyl-CoA Desaturase 1 (SCD1) NM_009127 5'-ccggagaccccttagatcga-3' 5'-tagcctgtaaaagatttctgcaaacc-3'
acetyl-CoA Carboxylase 1 (ACC1) NM_133360 5'-tggacagactgatcgcagagaaag-3' 5'-tggagagccccacacaca-3'
cholesterol 7- hydroxylase (Cyp71) NM_007824 5'-agcaactaaacaacctgccagtacta-3' 5'-gtccggatattcaaggatgca-3'
3-hydroxy-3-methylglutaryl-CoA synthase 1 (HMGC syn) NM_145942 5'-gccgtgaactgggtcgaa-3' 5'-gcatatatagcaatgtctcctgcaa-3'
ATP binding cassette transporter G5 (ABCG5) NM_ 031884 5Õ-tggccctgctcagca-3Õ 5Õ-atttttaaaggaatgggcatctctt-3Õ
mitochondrial glycerol-3-phosphate acyltransferase NM_008149 5'-agcaagtcctgcgctatcat-3' 5'-ctcgtgtgggtgattgtgac-3'
fatty acid synthase (FAS) NM_007988.3 5'-gctgcggaaacttcaggaaat-3' 5'-agagacgtgtcactcctggactt-3'
interleukin 1-beta (IL-1) NM_008361 5'-gtcacaagaaaccatggcacat-3' 5'-gcccatcagaggcaagga-3'
interleukin 6 (IL-6) NM_031168.1 5'-ctgcaagagacttccatccagtt-3' 5'-agggaaggccgtggttgt-3'
monocyte chemotactic protein 1 (MCP-1) NM_011333.3 5'-ttcctccaccaccatgca-3' 5'-ccagccggcaactgtga-3'
inducible nitric oxide synthase (iNOS) NM_010927.2 5'-gcagctgggctgtaccaaa-3' 5'-agcgtttcgggatctgaat-3'
interferon-induced with tetratricopeptide repeats 1 (Garg-16) NM_008331.2 5'-aggctggagtgtgctgagat-3' 5'-tctggatttaaccggacagc-3'
(C-X-C motif) ligand 10 (IP-10) NM_021274.1 5'-ccagccgtggtcacatcag-3' 5'-acctccacatagcttacagtacag-3'
GAPDH NM_008084 5'-tgtgtccgtcgtggatctga-3' 5'-cctgcttcaccaccttcttgat-3'
cyclolphilin M60456 5'-tggagagcaccaagacagaca-3' 5'-tgccggagtcgacaatgat-3'
Online Data Supplement Brown et al Role of SCD1 in Atherosclerosis
1
Online Data Supplement Brown et al Role of SCD1 in Atherosclerosis
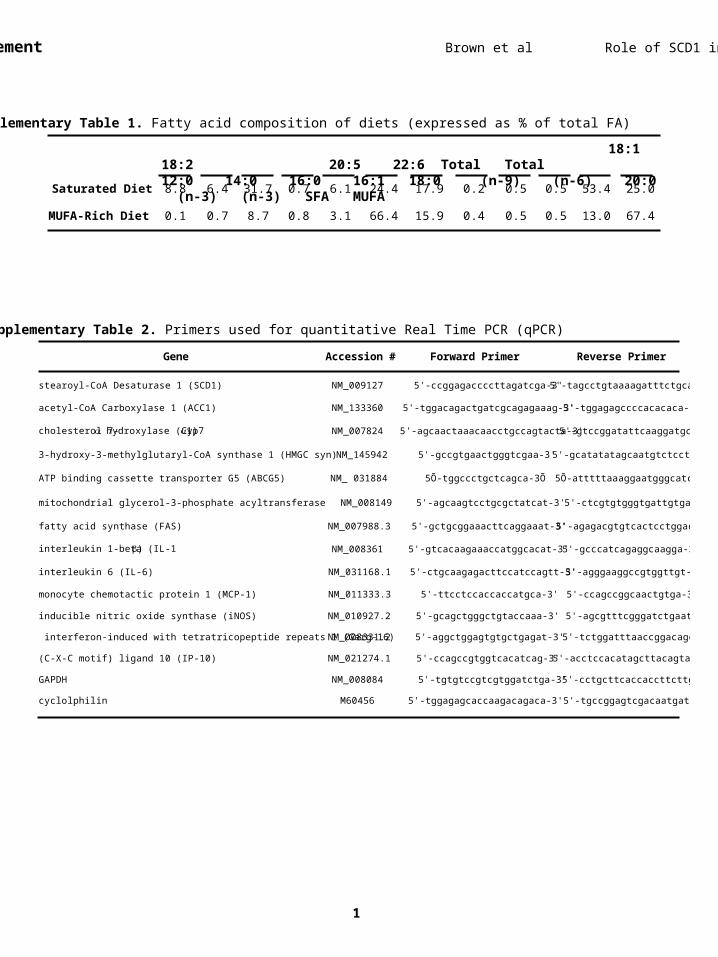
Supplemental Figure 1. Verhoeff-van Giesen stained sections of proximal aortae from LDLr -/-, ApoB100/100 mice fed diets enriched in 0.1% (w/w) cholesterol and saturated fat for 20 weeks in conjunction with biweekly injections (25 mg/kg) of either a non-targeting control ASO (left panels) or an ASO targeting the knockdown of SCD (right panels).
Control ASO SCD1 ASO
2
0
500
1000
1500
2000
1 2
0
25
50
75
100
125
1 2
A B SFA MUFA Diet Diet
Control ASO
SCD1 ASO T
G (
mg
/g p
rote
in)
CE
(m
g/g
pro
tein
)
FC
(m
g/g
pro
tein
)
PL
(m
g/g
pro
tein
)
a
C
0
2
4
6
8
TG TC CE FC PL
0
25
50
75
SaturatedDiet
MUFA-Rich Diet
MU
FA
(%
)
S
FA
(%
)
0
25
50
75
SaturatedDiet
MUFA-Rich Diet
Cholesteryl Ester Triglyceride Phospholipid
c
Sec
reti
on
Ra
te ( g
/ m
in /
g li
ver )
D
0
25
50
75
100
SaturatedDiet
MUFA-Rich Diet
0
25
50
75
SaturatedDiet
MUFA-Rich Diet
0
25
50
75
100
SaturatedDiet
MUFA-Rich Diet
0
25
50
75
100
SaturatedDiet
MUFA-Rich Diet
a
c
b
a
c
a
b
b ba a
a a
bd
ac
ab b
bc c a ab
SFA MUFA Diet Diet
EFAS ACC1 mGPAT
mR
NA
Le
vels
(A
U)
synthaseHMG-CoA Cyp71 ABCG5
FControl ASO SCD1 ASO
SCD1
SREBP1c
ACC1/2
p-AMPK
ACAT2
ABCG5
0
10
20
30
40
1 20
50
100
150
200
1 20
50
100
150
200
1 2
0
25
50
75
100
125
1 20
25
50
75
100
125
1 2
0
25
50
75
100
125
1 20
50100150200250300
1 20
25
50
75
100
125
1 2 SFA MUFA Diet Diet
SFA MUFA Diet Diet
bb
b
aa a
a
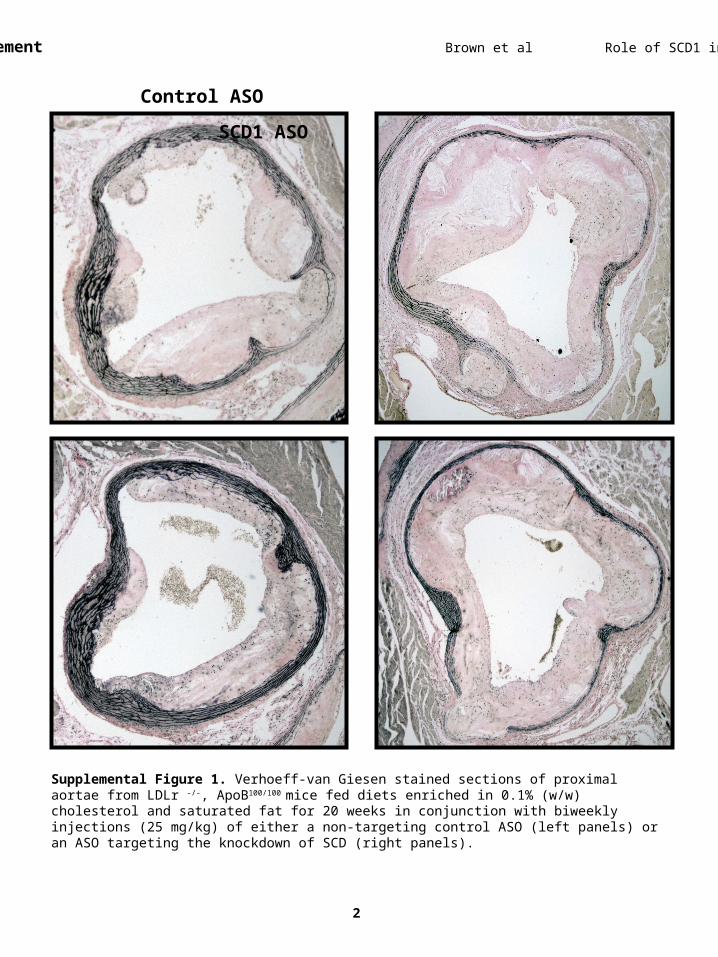
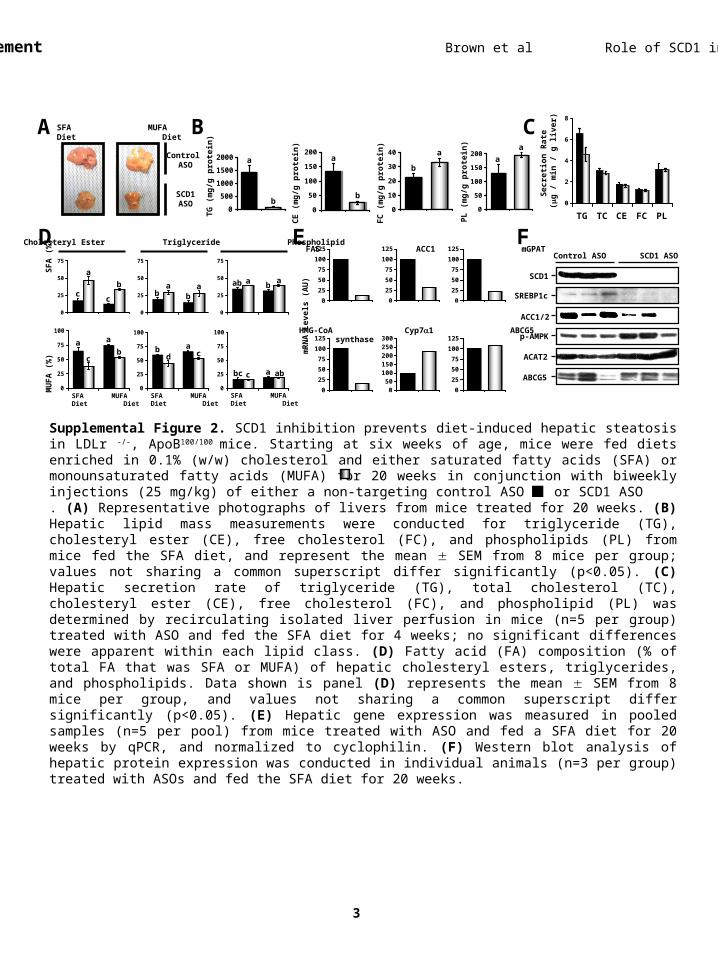
Supplemental Figure 2. SCD1 inhibition prevents diet-induced hepatic steatosis in LDLr -/-, ApoB100/100 mice. Starting at six weeks of age, mice were fed diets enriched in 0.1% (w/w) cholesterol and either saturated fatty acids (SFA) or monounsaturated fatty acids (MUFA) for 20 weeks in conjunction with biweekly injections (25 mg/kg) of either a non-targeting control ASO or SCD1 ASO . (A) Representative photographs of livers from mice treated for 20 weeks. (B) Hepatic lipid mass measurements were conducted for triglyceride (TG), cholesteryl ester (CE), free cholesterol (FC), and phospholipids (PL) from mice fed the SFA diet, and represent the mean SEM from 8 mice per group; values not sharing a common superscript differ significantly (p<0.05). (C) Hepatic secretion rate of triglyceride (TG), total cholesterol (TC), cholesteryl ester (CE), free cholesterol (FC), and phospholipid (PL) was determined by recirculating isolated liver perfusion in mice (n=5 per group) treated with ASO and fed the SFA diet for 4 weeks; no significant differences were apparent within each lipid class. (D) Fatty acid (FA) composition (% of total FA that was SFA or MUFA) of hepatic cholesteryl esters, triglycerides, and phospholipids. Data shown is panel (D) represents the mean SEM from 8 mice per group, and values not sharing a common superscript differ significantly (p<0.05). (E) Hepatic gene expression was measured in pooled samples (n=5 per pool) from mice treated with ASO and fed a SFA diet for 20 weeks by qPCR, and normalized to cyclophilin. (F) Western blot analysis of hepatic protein expression was conducted in individual animals (n=3 per group) treated with ASOs and fed the SFA diet for 20 weeks.
Online Data Supplement Brown et al Role of SCD1 in Atherosclerosis
3