Embed Size (px)
Citation preview
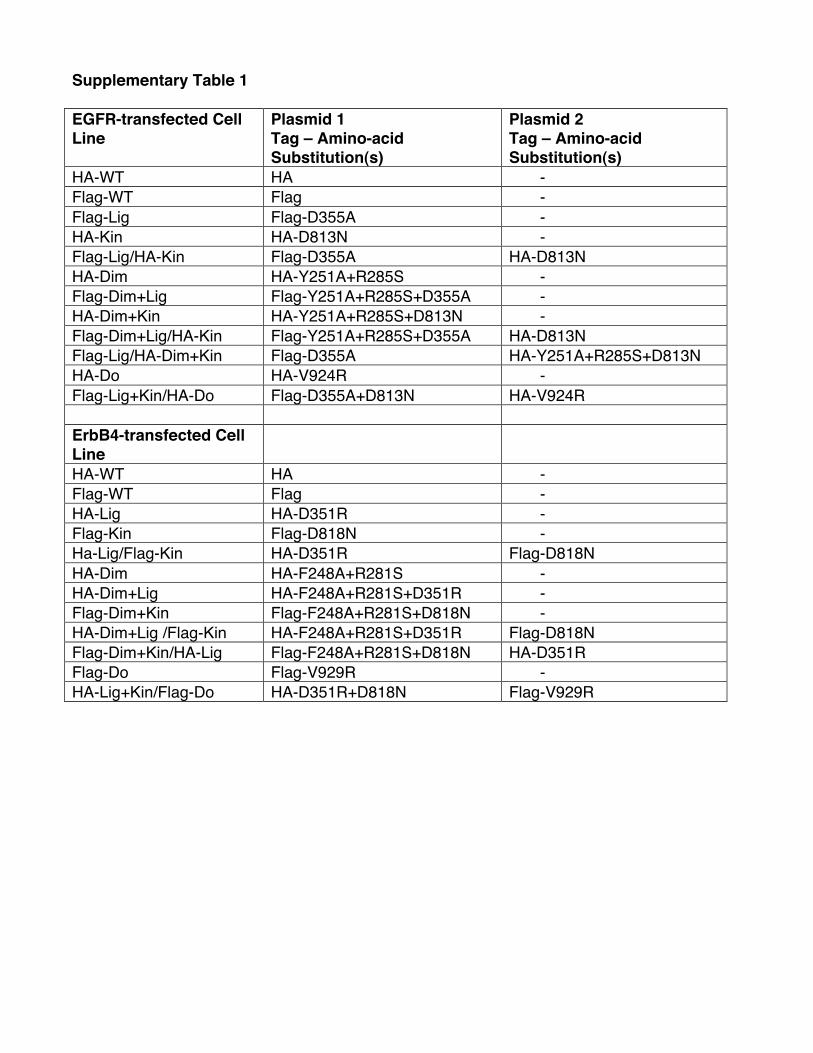
Supplementary Table 1 EGFR-transfected Cell Line
Plasmid 1 Tag – Amino-acid Substitution(s)
Plasmid 2 Tag – Amino-acid Substitution(s)
HA-WT HA - Flag-WT Flag - Flag-Lig Flag-D355A - HA-Kin HA-D813N - Flag-Lig/HA-Kin Flag-D355A HA-D813N HA-Dim HA-Y251A+R285S - Flag-Dim+Lig Flag-Y251A+R285S+D355A - HA-Dim+Kin HA-Y251A+R285S+D813N - Flag-Dim+Lig/HA-Kin Flag-Y251A+R285S+D355A HA-D813N Flag-Lig/HA-Dim+Kin Flag-D355A HA-Y251A+R285S+D813N HA-Do HA-V924R - Flag-Lig+Kin/HA-Do Flag-D355A+D813N HA-V924R ErbB4-transfected Cell Line
HA-WT HA - Flag-WT Flag - HA-Lig HA-D351R - Flag-Kin Flag-D818N - Ha-Lig/Flag-Kin HA-D351R Flag-D818N HA-Dim HA-F248A+R281S - HA-Dim+Lig HA-F248A+R281S+D351R - Flag-Dim+Kin Flag-F248A+R281S+D818N - HA-Dim+Lig /Flag-Kin HA-F248A+R281S+D351R Flag-D818N Flag-Dim+Kin/HA-Lig Flag-F248A+R281S+D818N HA-D351R Flag-Do Flag-V929R - HA-Lig+Kin/Flag-Do HA-D351R+D818N Flag-V929R
2
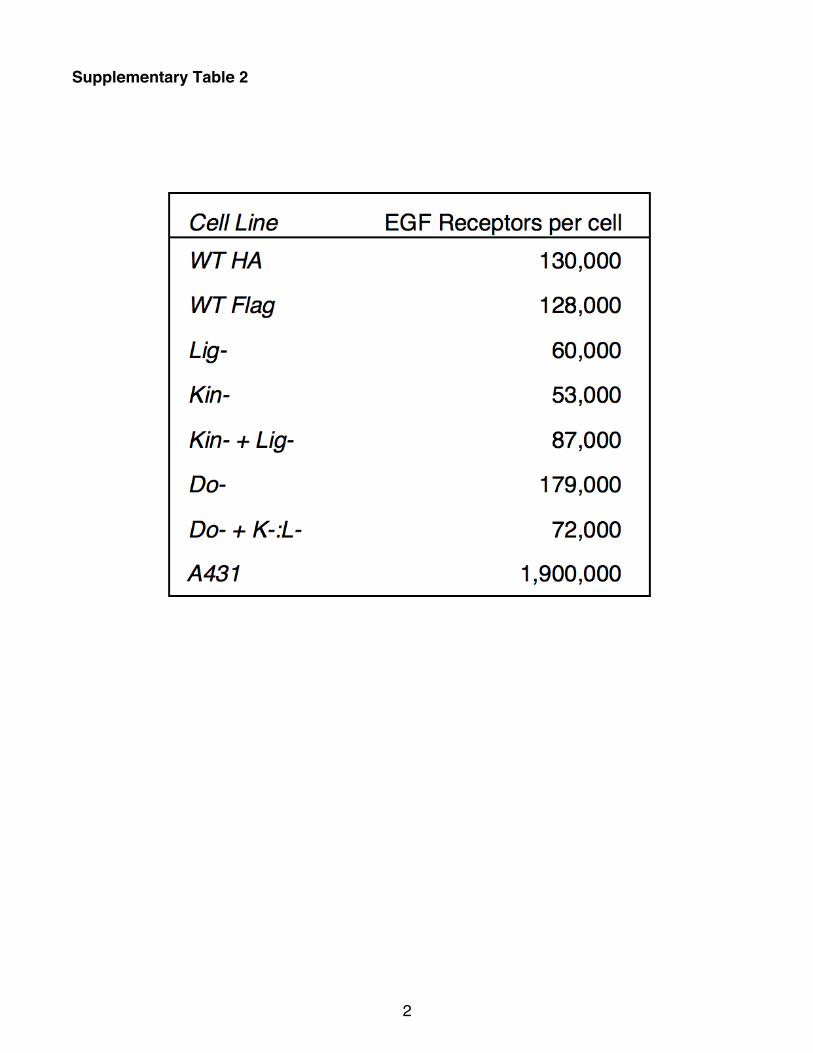
Supplementary Table 2
3
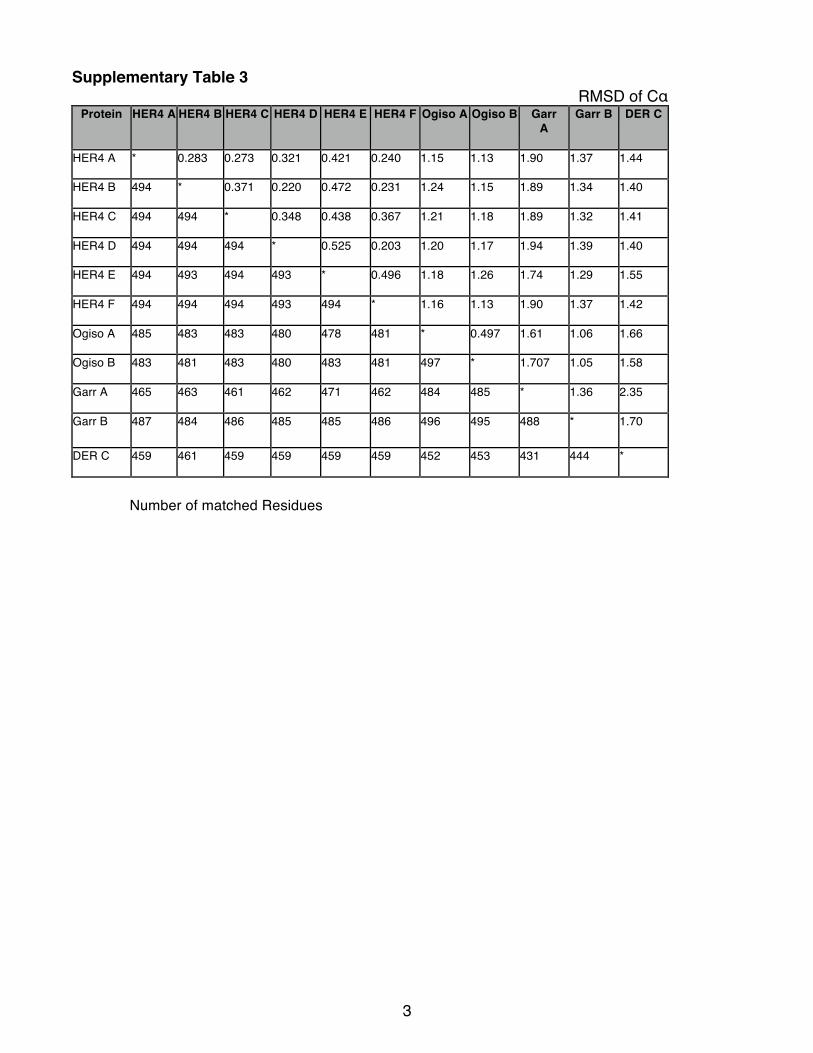
Supplementary Table 3 RMSD of Cα
Protein HER4 A HER4 B HER4 C HER4 D HER4 E HER4 F Ogiso A Ogiso B Garr A
Garr B DER C
HER4 A * 0.283 0.273 0.321 0.421 0.240 1.15 1.13 1.90 1.37 1.44
HER4 B 494 * 0.371 0.220 0.472 0.231 1.24 1.15 1.89 1.34 1.40
HER4 C 494 494 * 0.348 0.438 0.367 1.21 1.18 1.89 1.32 1.41
HER4 D 494 494 494 * 0.525 0.203 1.20 1.17 1.94 1.39 1.40
HER4 E 494 493 494 493 * 0.496 1.18 1.26 1.74 1.29 1.55
HER4 F 494 494 494 493 494 * 1.16 1.13 1.90 1.37 1.42
Ogiso A 485 483 483 480 478 481 * 0.497 1.61 1.06 1.66
Ogiso B 483 481 483 480 483 481 497 * 1.707 1.05 1.58
Garr A 465 463 461 462 471 462 484 485 * 1.36 2.35
Garr B 487 484 486 485 485 486 496 495 488 * 1.70
DER C 459 461 459 459 459 459 452 453 431 444 *
Number of matched Residues
4
Supplemental Figure Legends
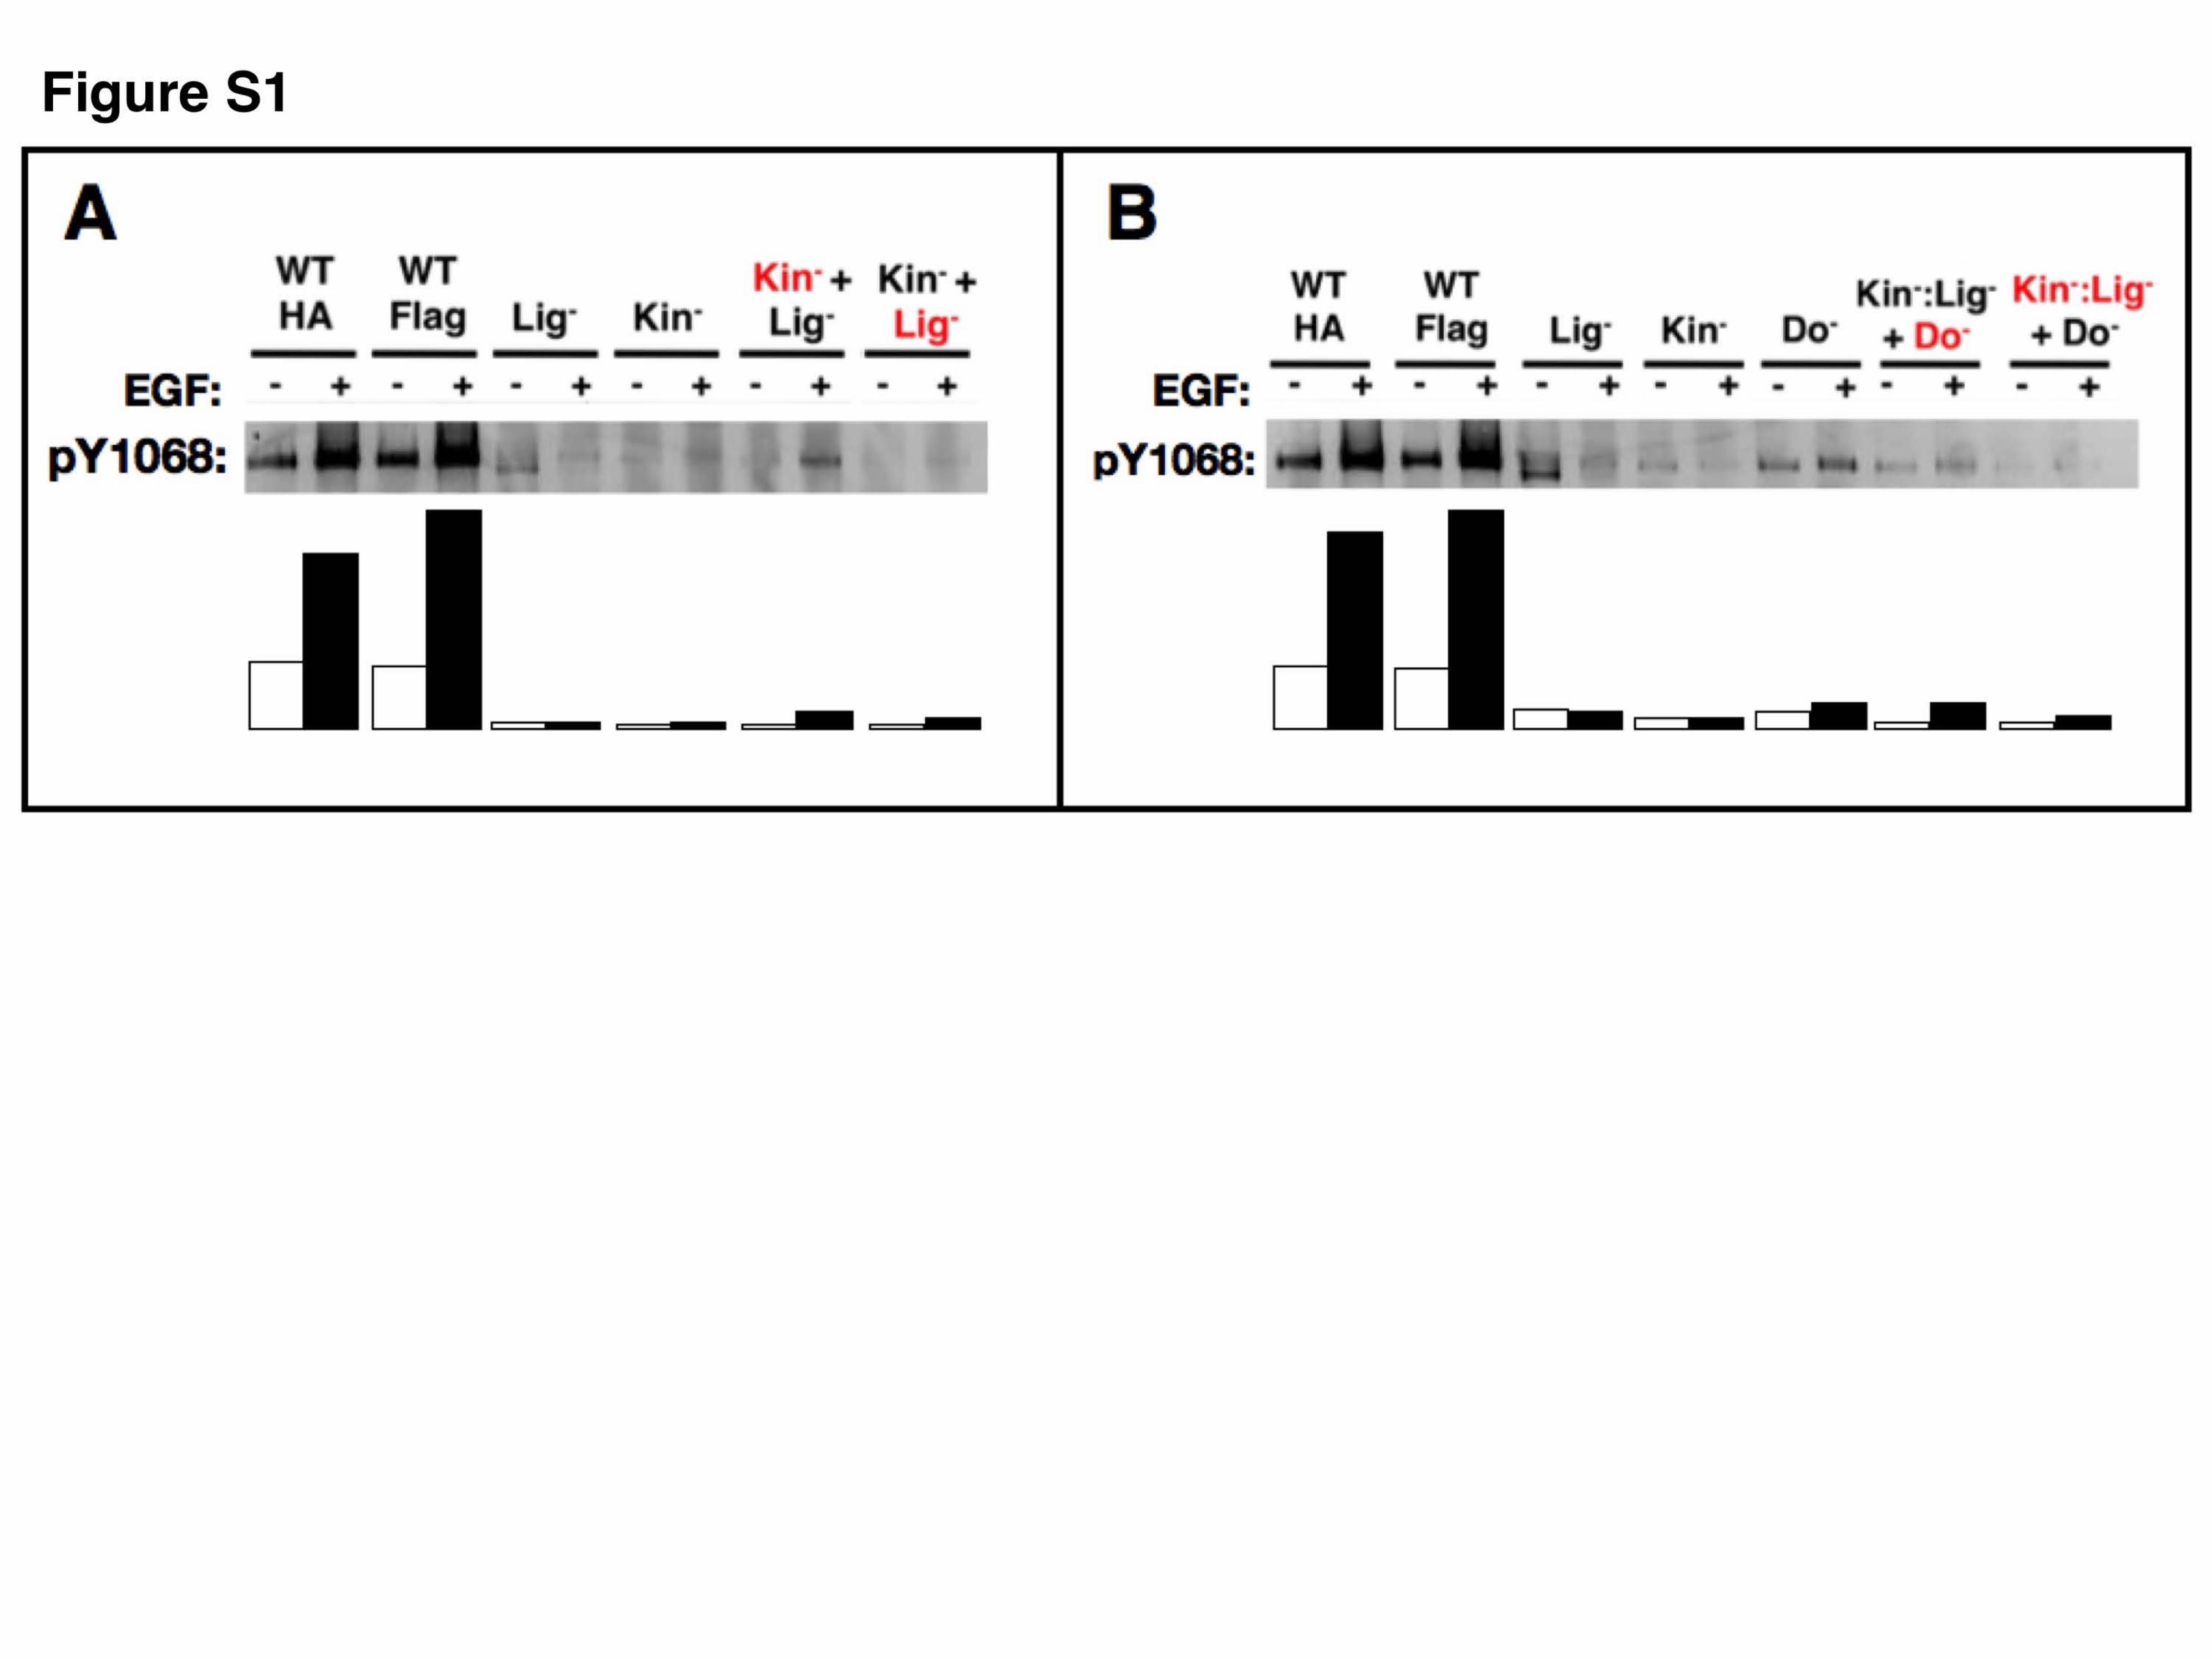
Figure S1. Anti-EGFR pY1068 Western blots of EGFR immunoprecipitated from EGFR-
transfected cell lines. Cell lines and labeling as described for Figure 1B.
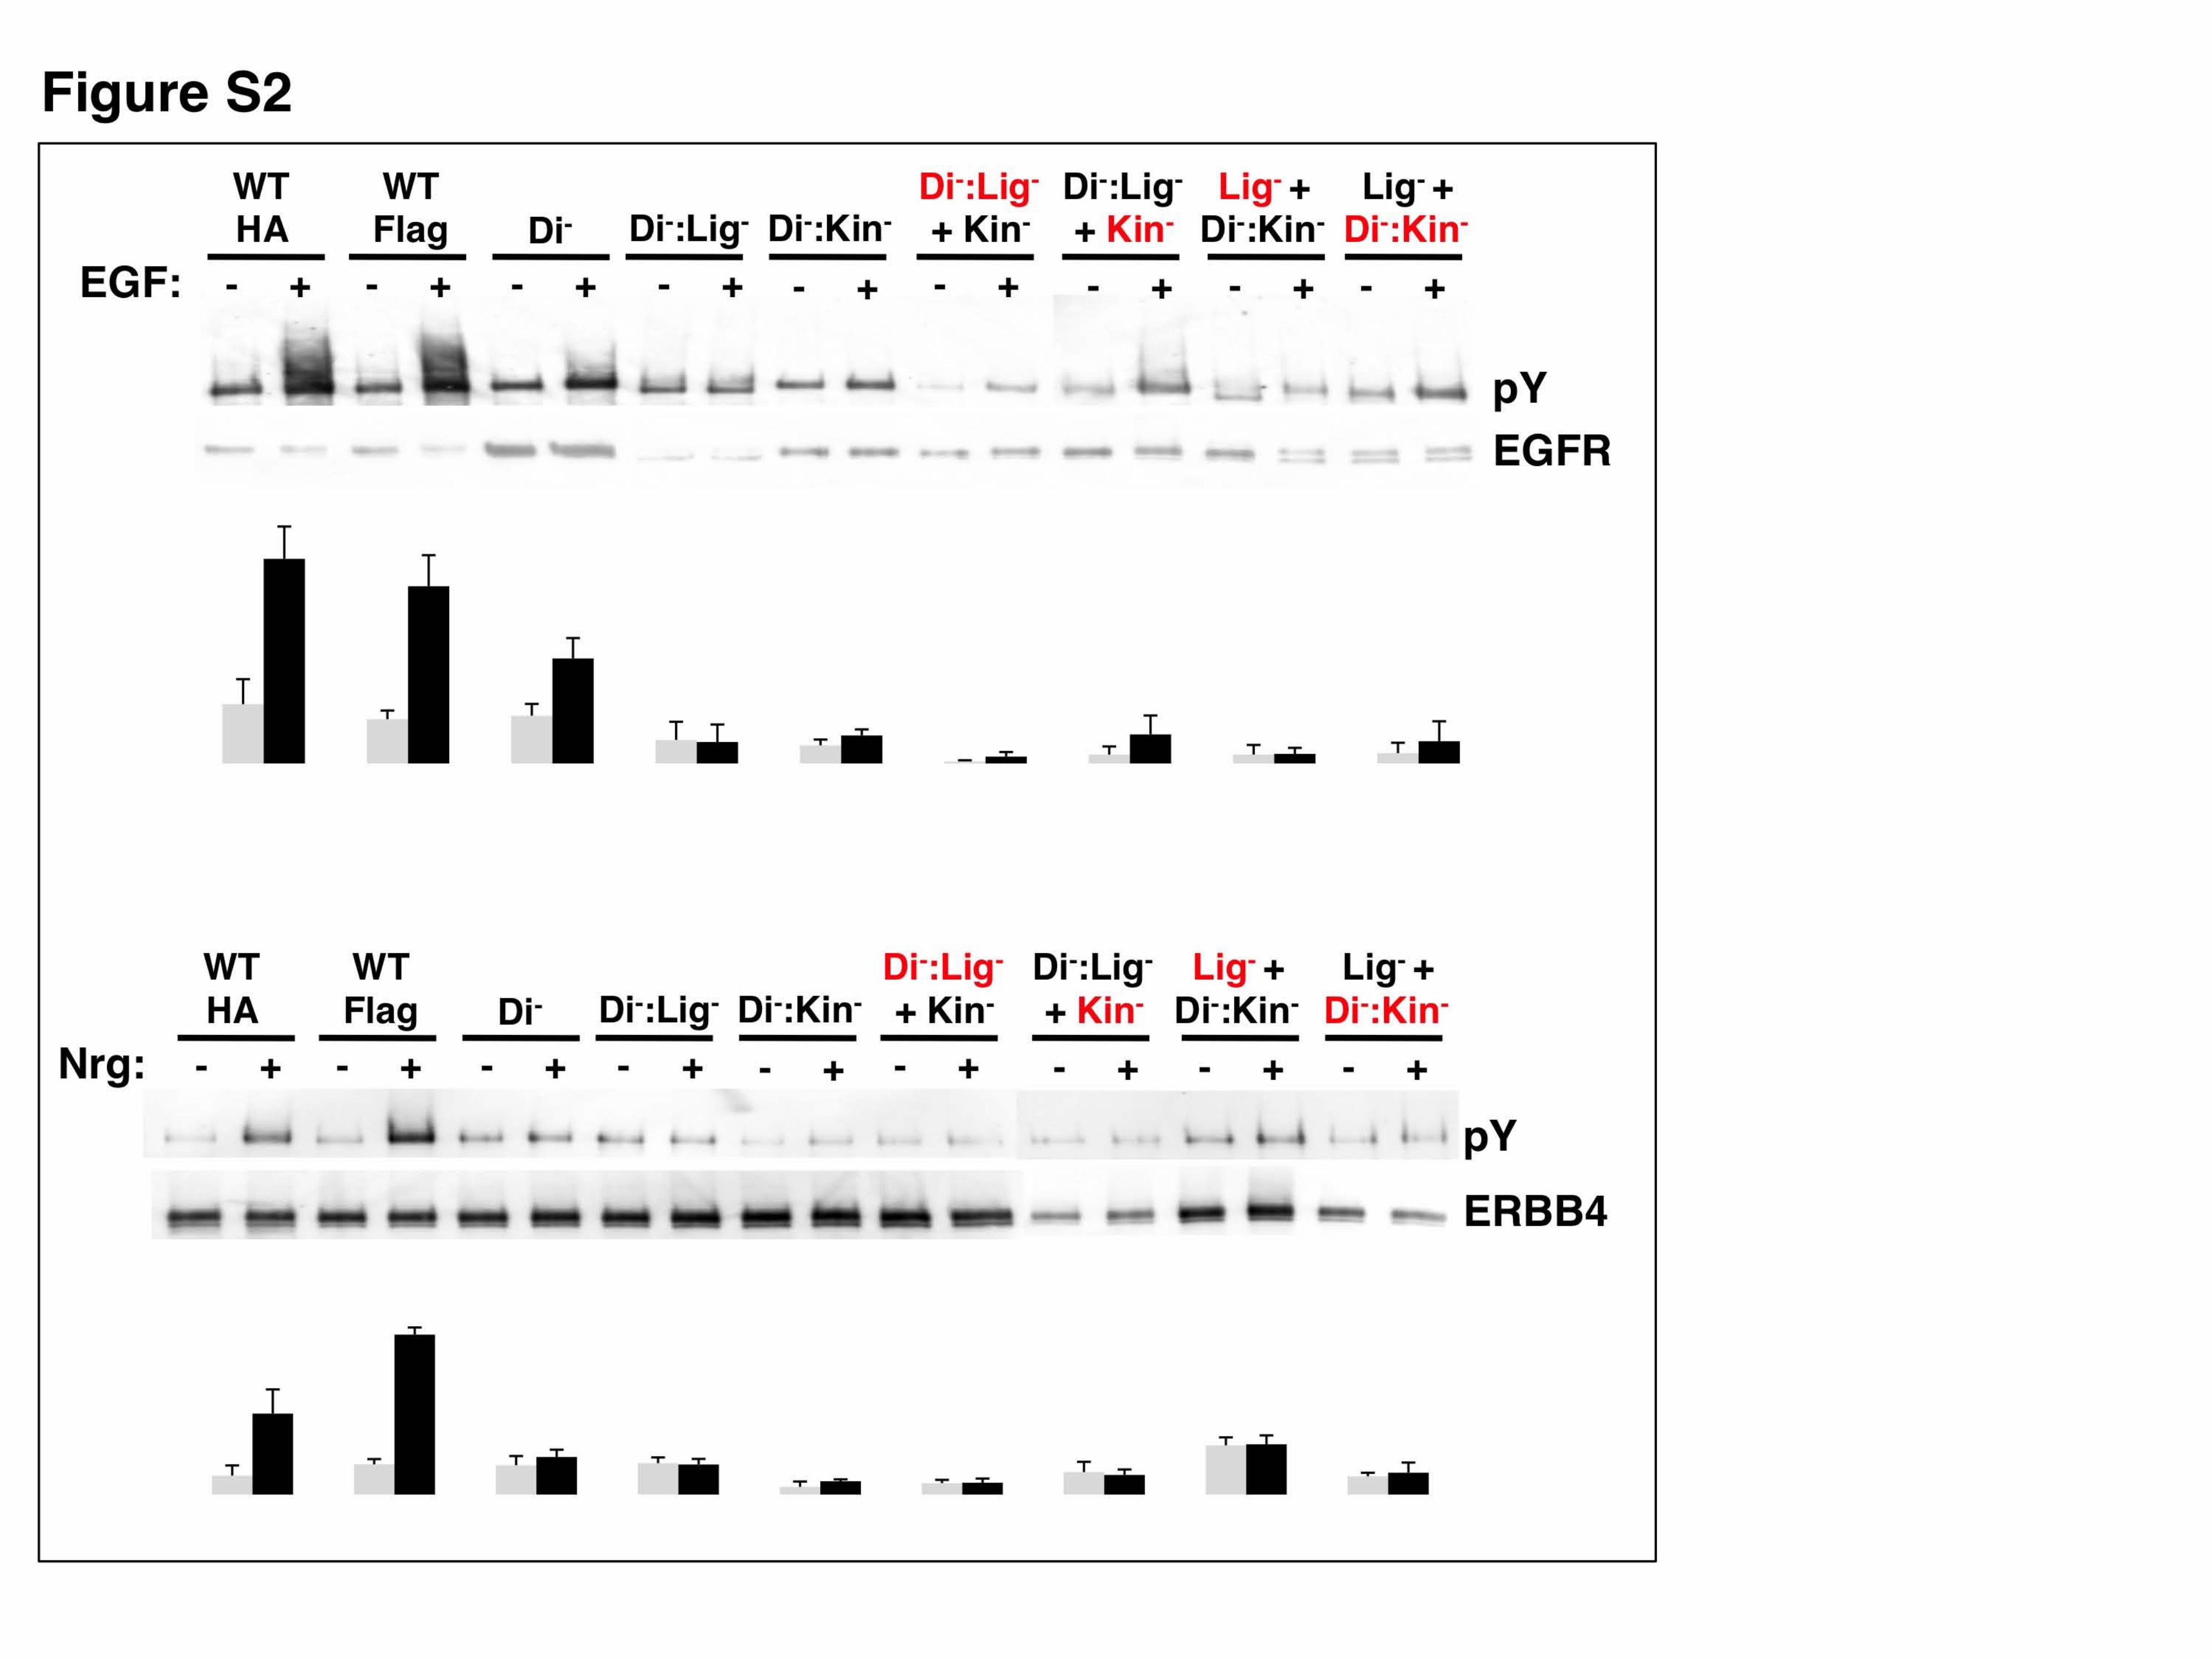
Figure S2. Antiphosphotyrosine and anti-ErbB Western blots of immunoprecipitated full-length
EGFR (top) and ErbB4 (bottom) tagged and bearing the same mutations as in Figure 1 except
that a dimerization-arm (Di-) mutation has been added as a double mutation with the kinase-
deficient (Di-:Kin-) and ligand-targeting (Di-:Lig-) mutations. Bar graphs represent quantitation of
bands from at least 3 independent experiments. The dimerization arm mutation of EGFR failed
to eliminate ligand-driven activation completely, and the residual activation in the Di-:Lig- plus
Kin- transfected cells cannot be interpreted as independent of dimerization arm-mediated
interactions in this case.
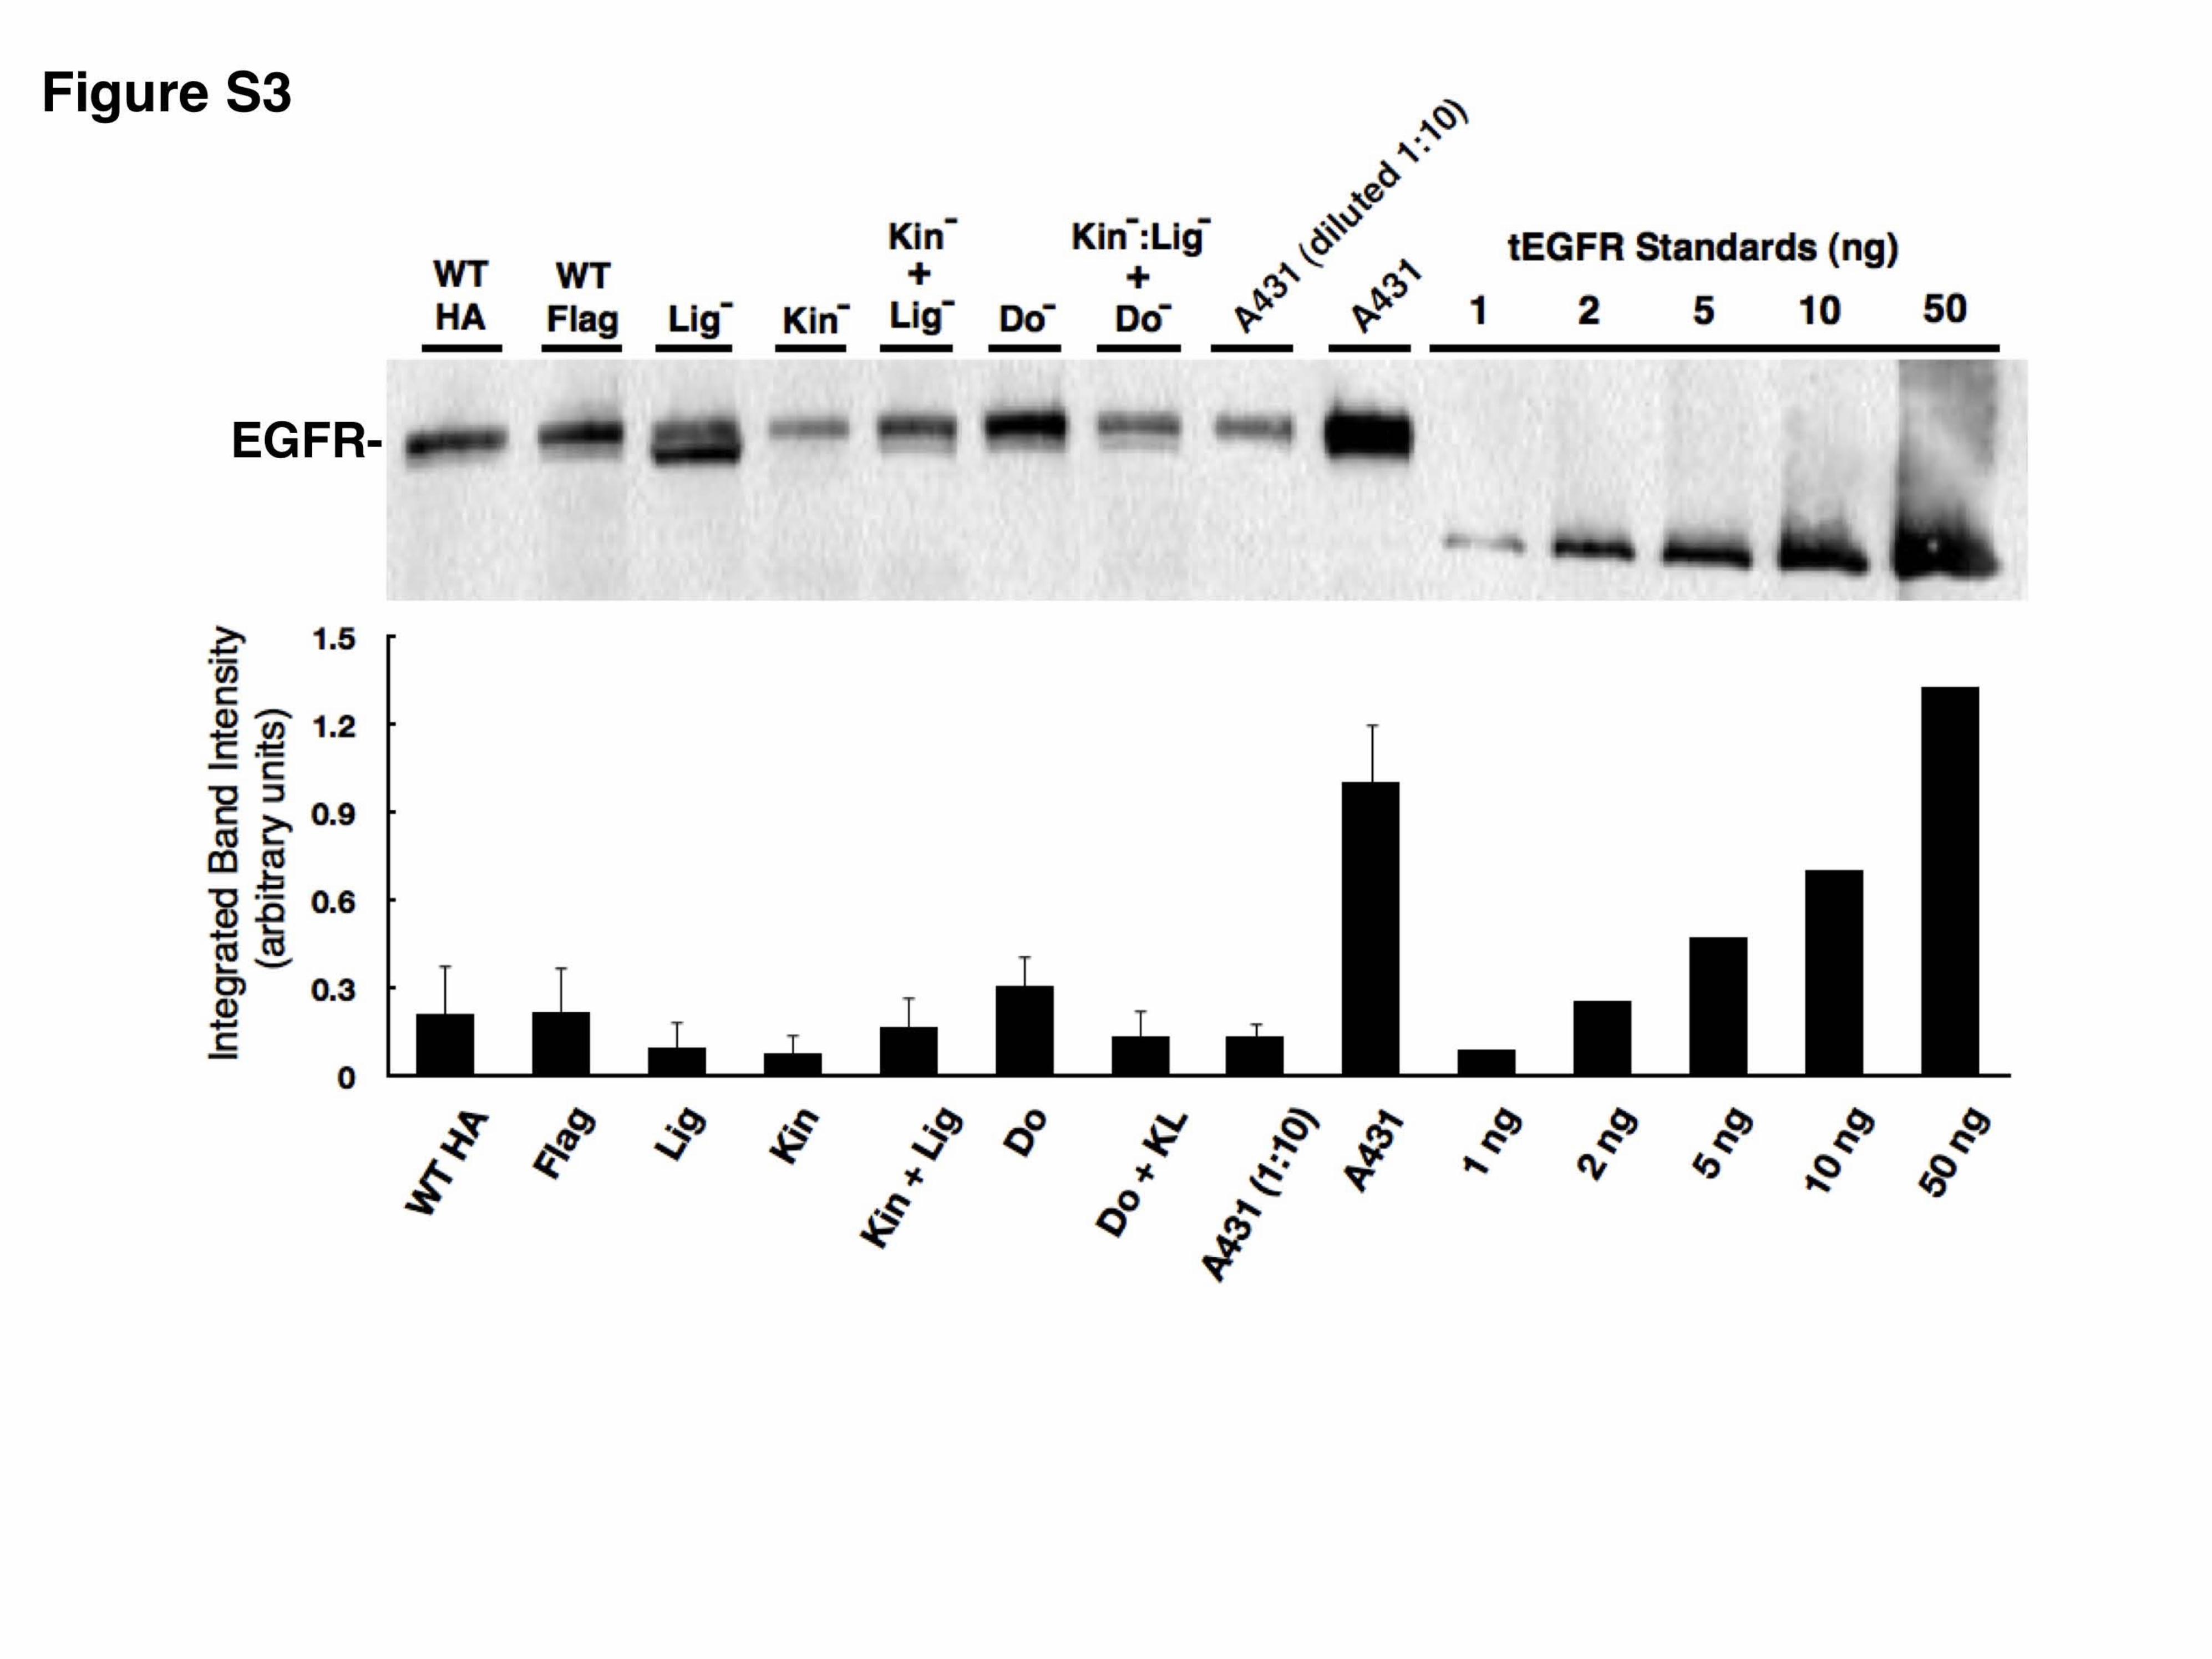
Figure S3. Anti-EGFR Western blots of lysates from known numbers of the EGFR-transfected
cells used in cell-based assays as well as A431 cells. Cell lines are labeled as in Figure 1.
Known amounts of purified, truncated EGFR were loaded as standards (right 5 lanes).
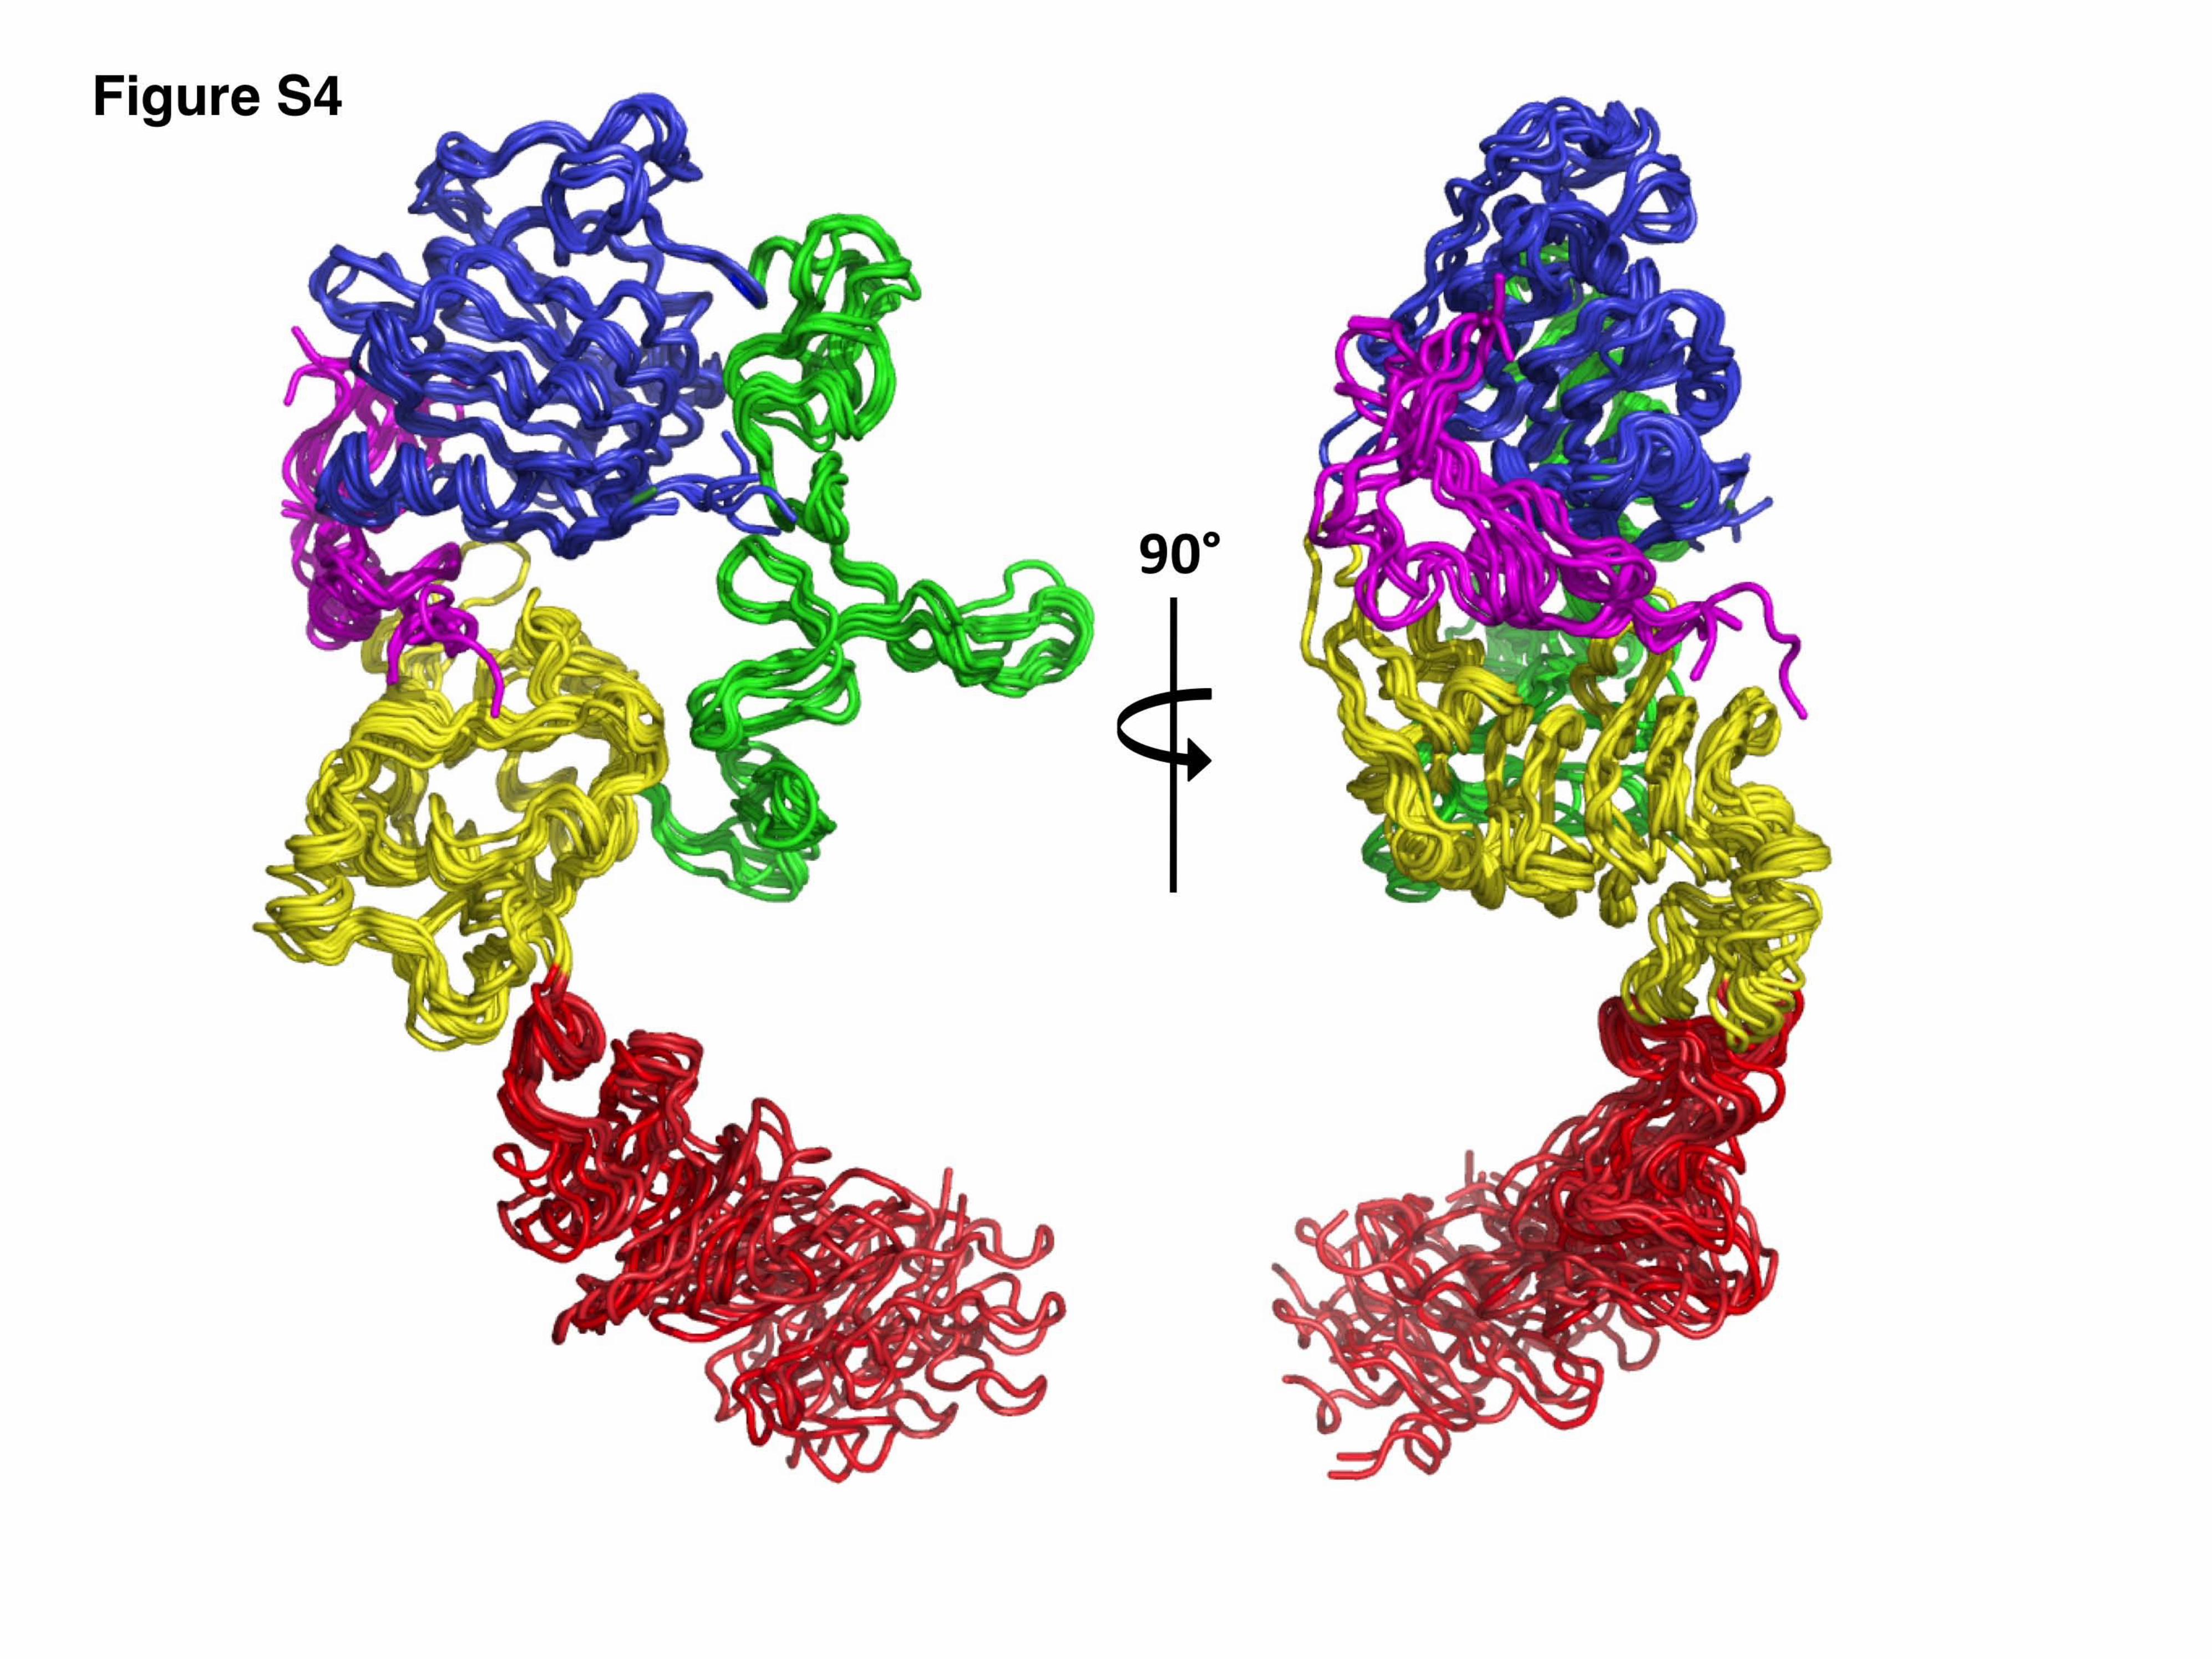
Figure S4. Orthogonal views of worm diagrams of all structures of EGFR/ErbB ectodomains
with high-affinity ligand bound following superposition of domains I, II, and III are shown.
Superposed ErbBs include the six independent sErbB4:Nrg1β subunits reported here, the re-
refined EGFR:EGF subunits (1), the tEGFR:TGFα subunits (2), and the high-affinity Drosophila
EGFR:Spitz subunit (3).
5
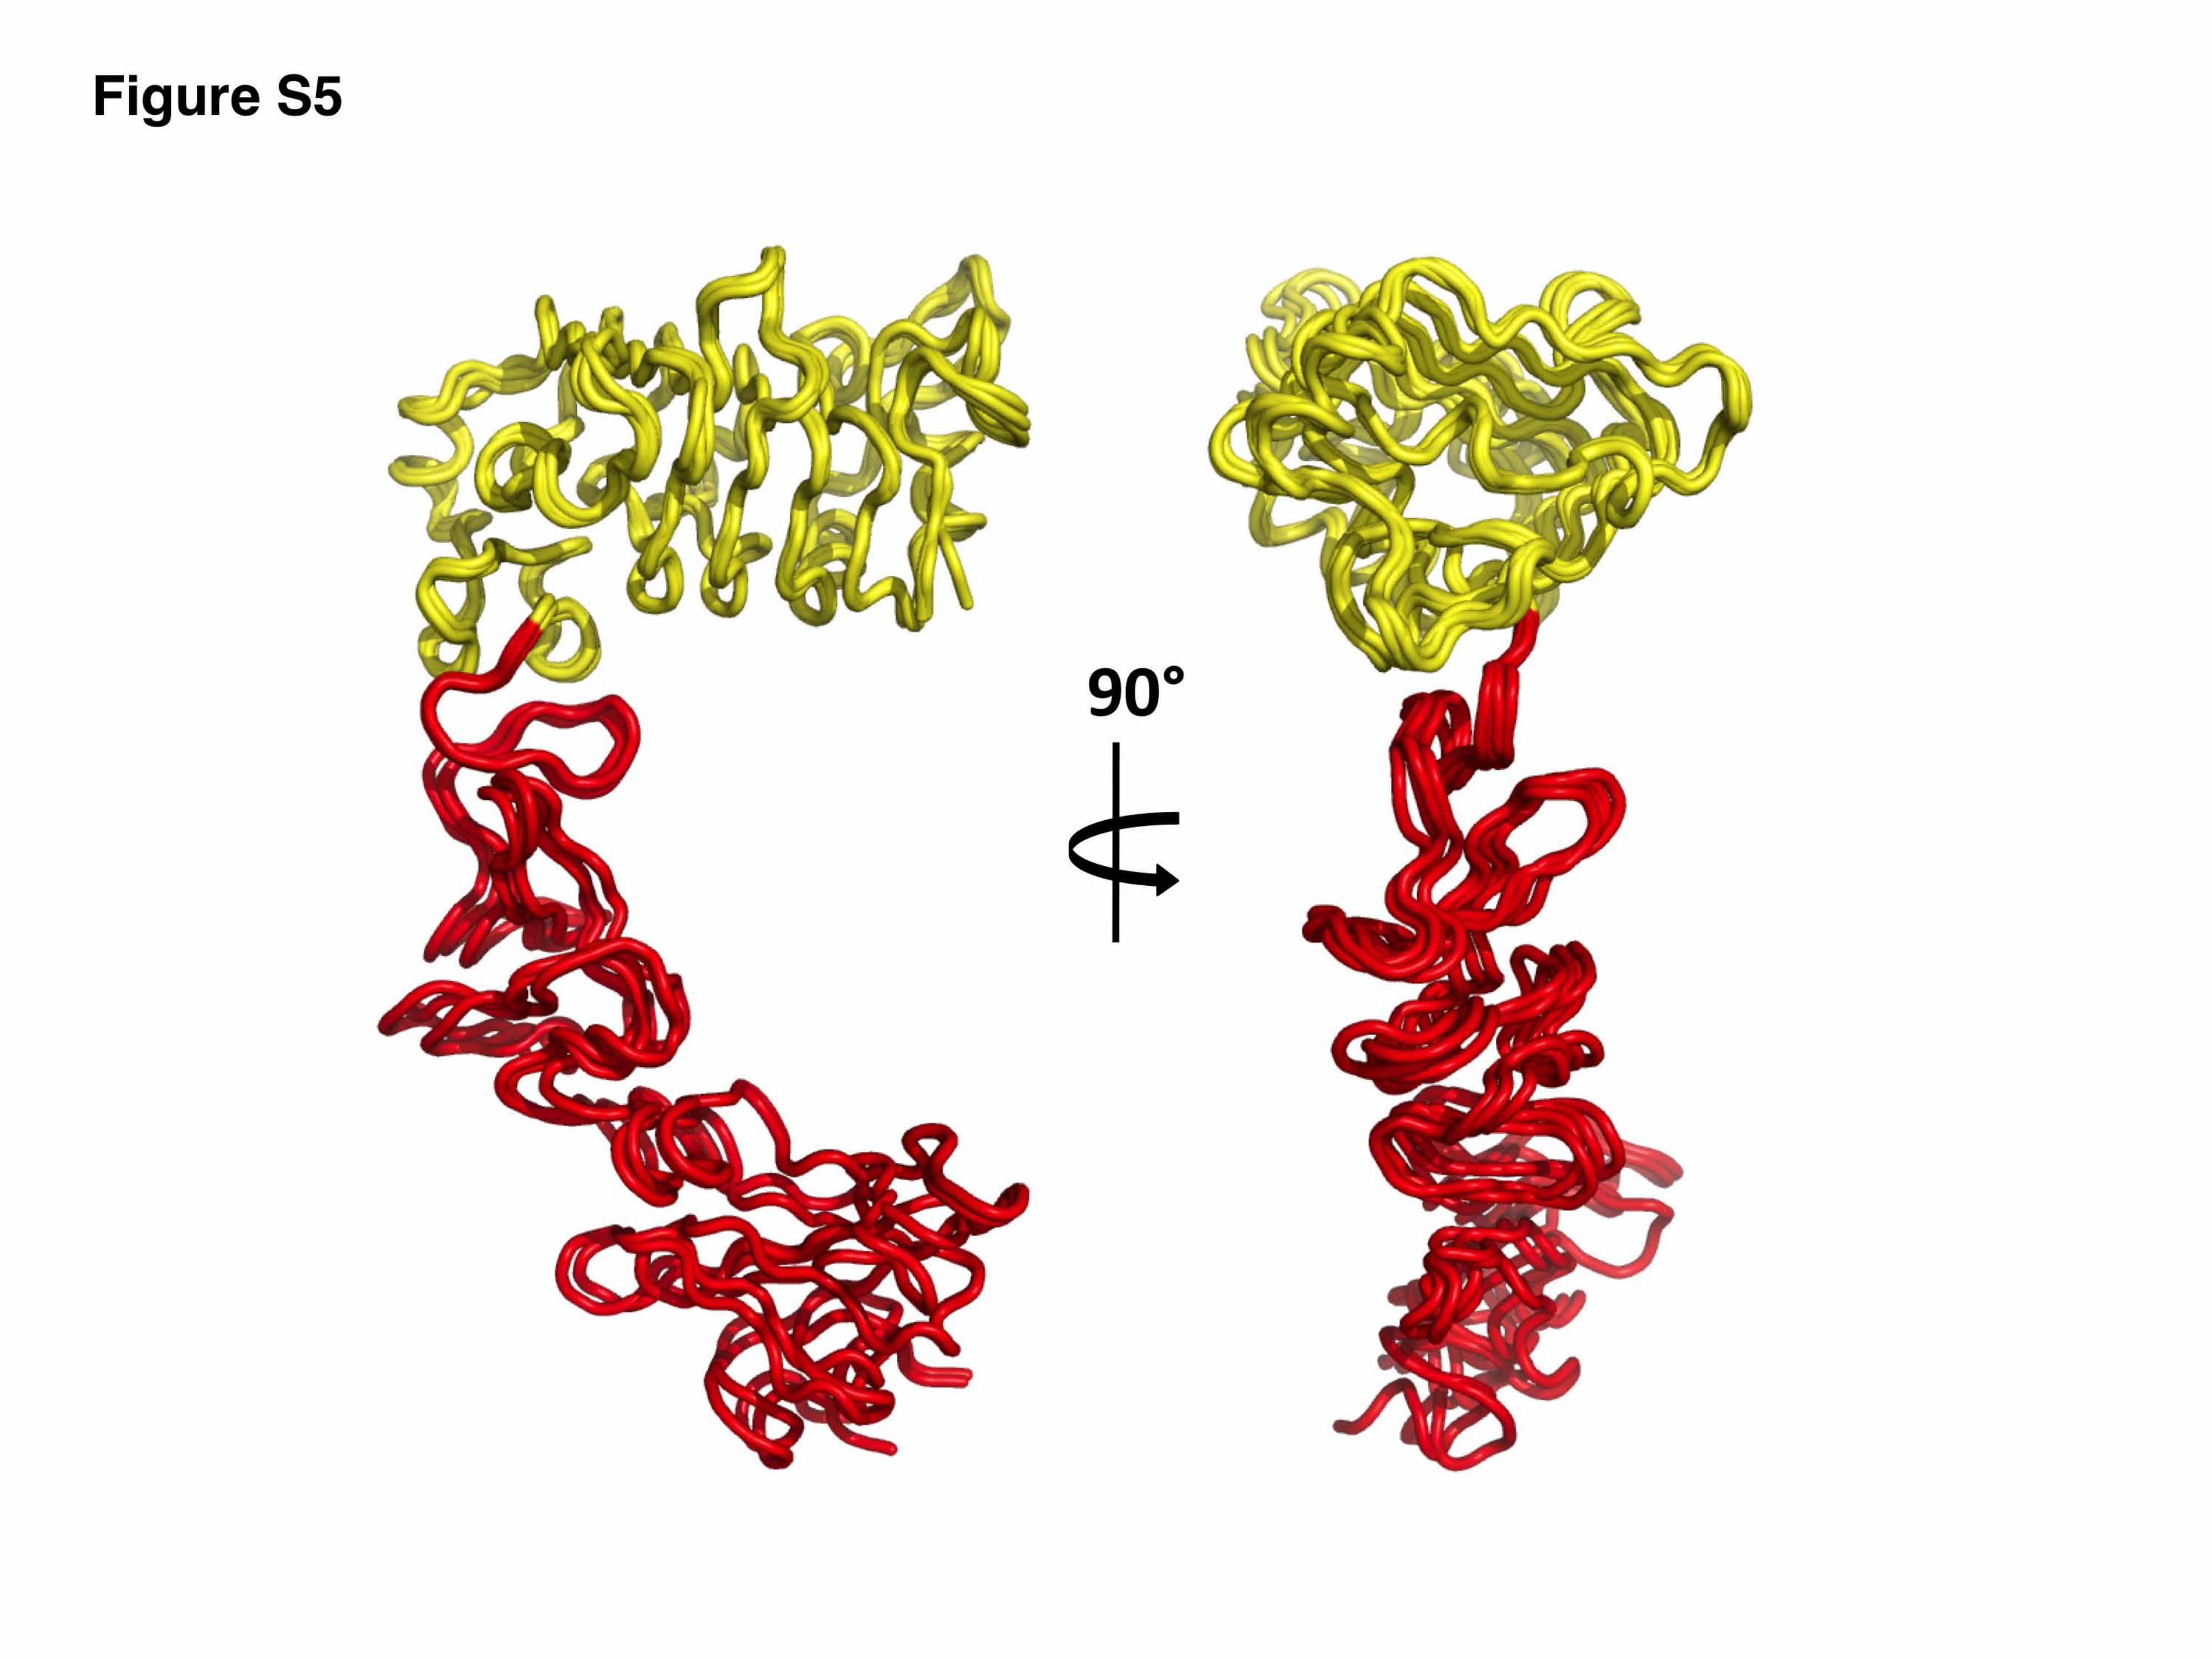
Figure S5. Alignment of Domain III/IV regions of EGFR. Orthogonal view of worm diagrams of
domains III and IV of EGFR from both subunits of the EGFR:EGF complex (1), a low-pH
tethered form of EGFR (4), and EGFR from a complex of EGFR and the Cetuximab Fab (5).
Only domain III (yellow) was used in the superposition, but the positions of domain IV (red) are
very similar.
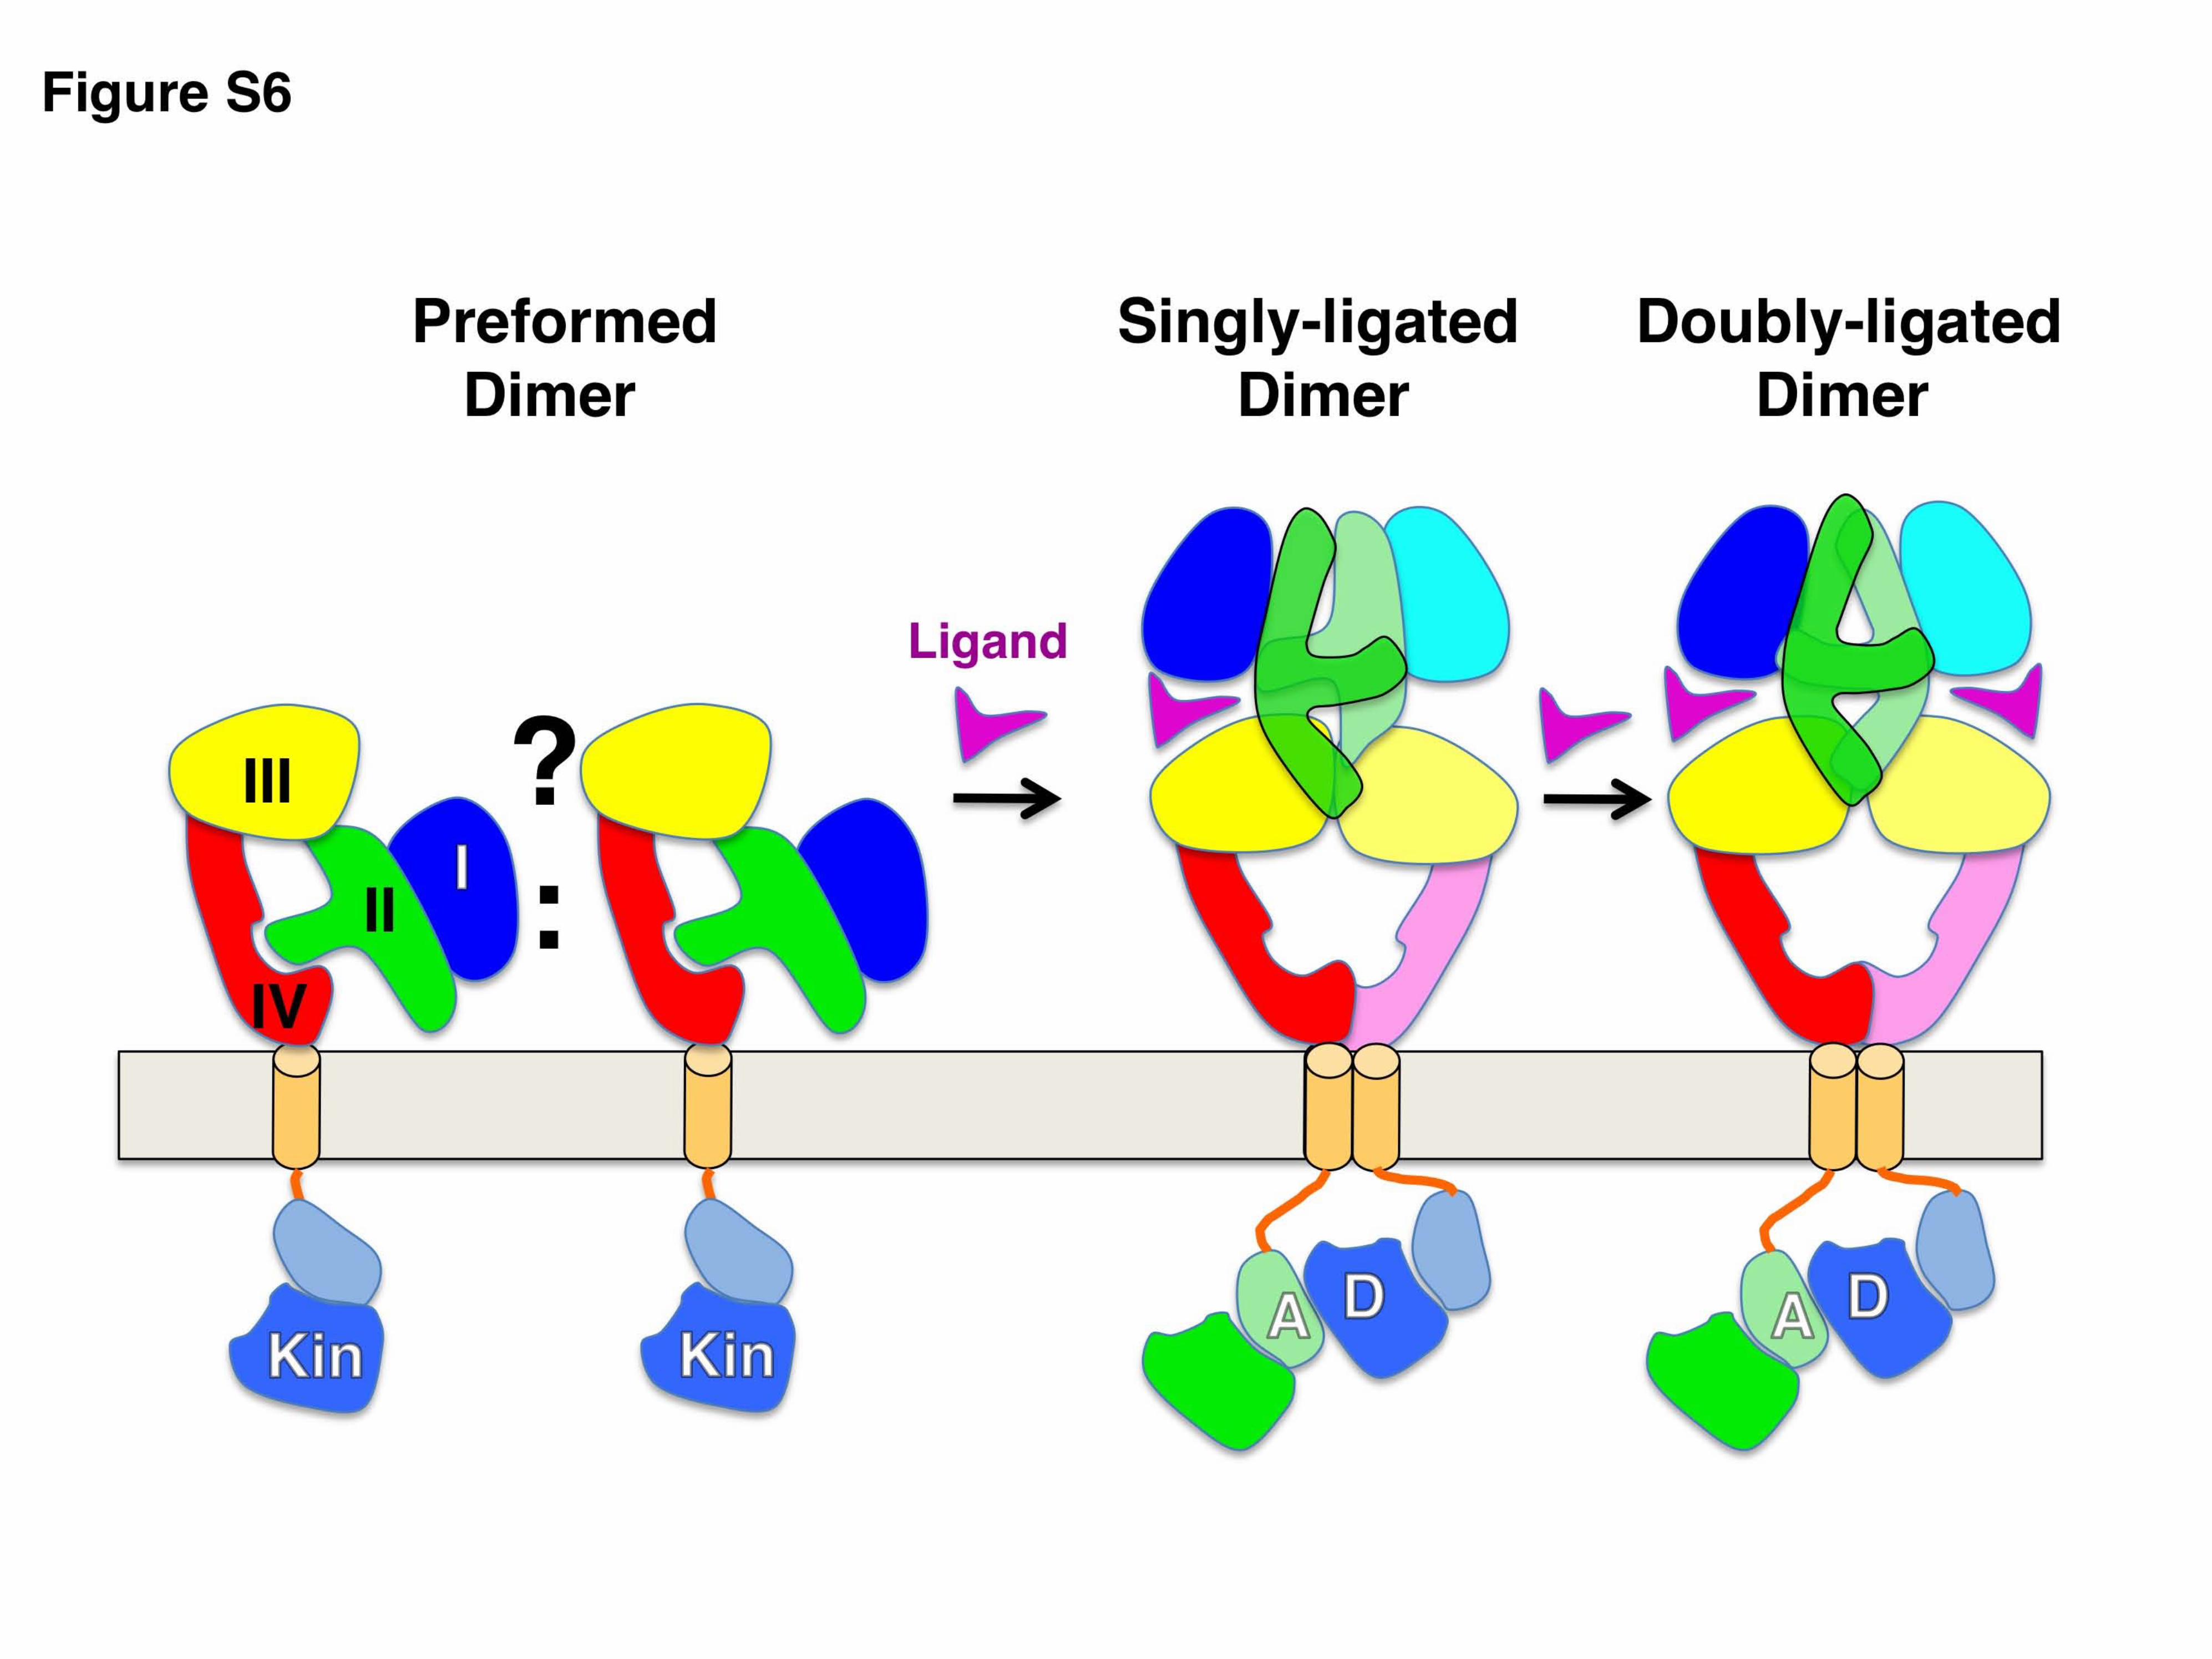
Figure S6. Schematic diagram of ErbB dimer states. An inactive “preformed” dimer of EGFR,
whose conformation is not known and may or may not adopt a tethered state, is able to bind a
single ligand to form an active, asymmetric singly-ligated receptor dimer (middle panel). This
asymmetric dimer has a liganded subunit with a bent domain II conformation and an
unliganded subunit with a straight conformation shown in lighter hues. ErbB2/HER2 is ideally
configured to serve as the unliganded partner in this dimer. The right panel shows a
symmetric, doubly-ligated receptor dimer.
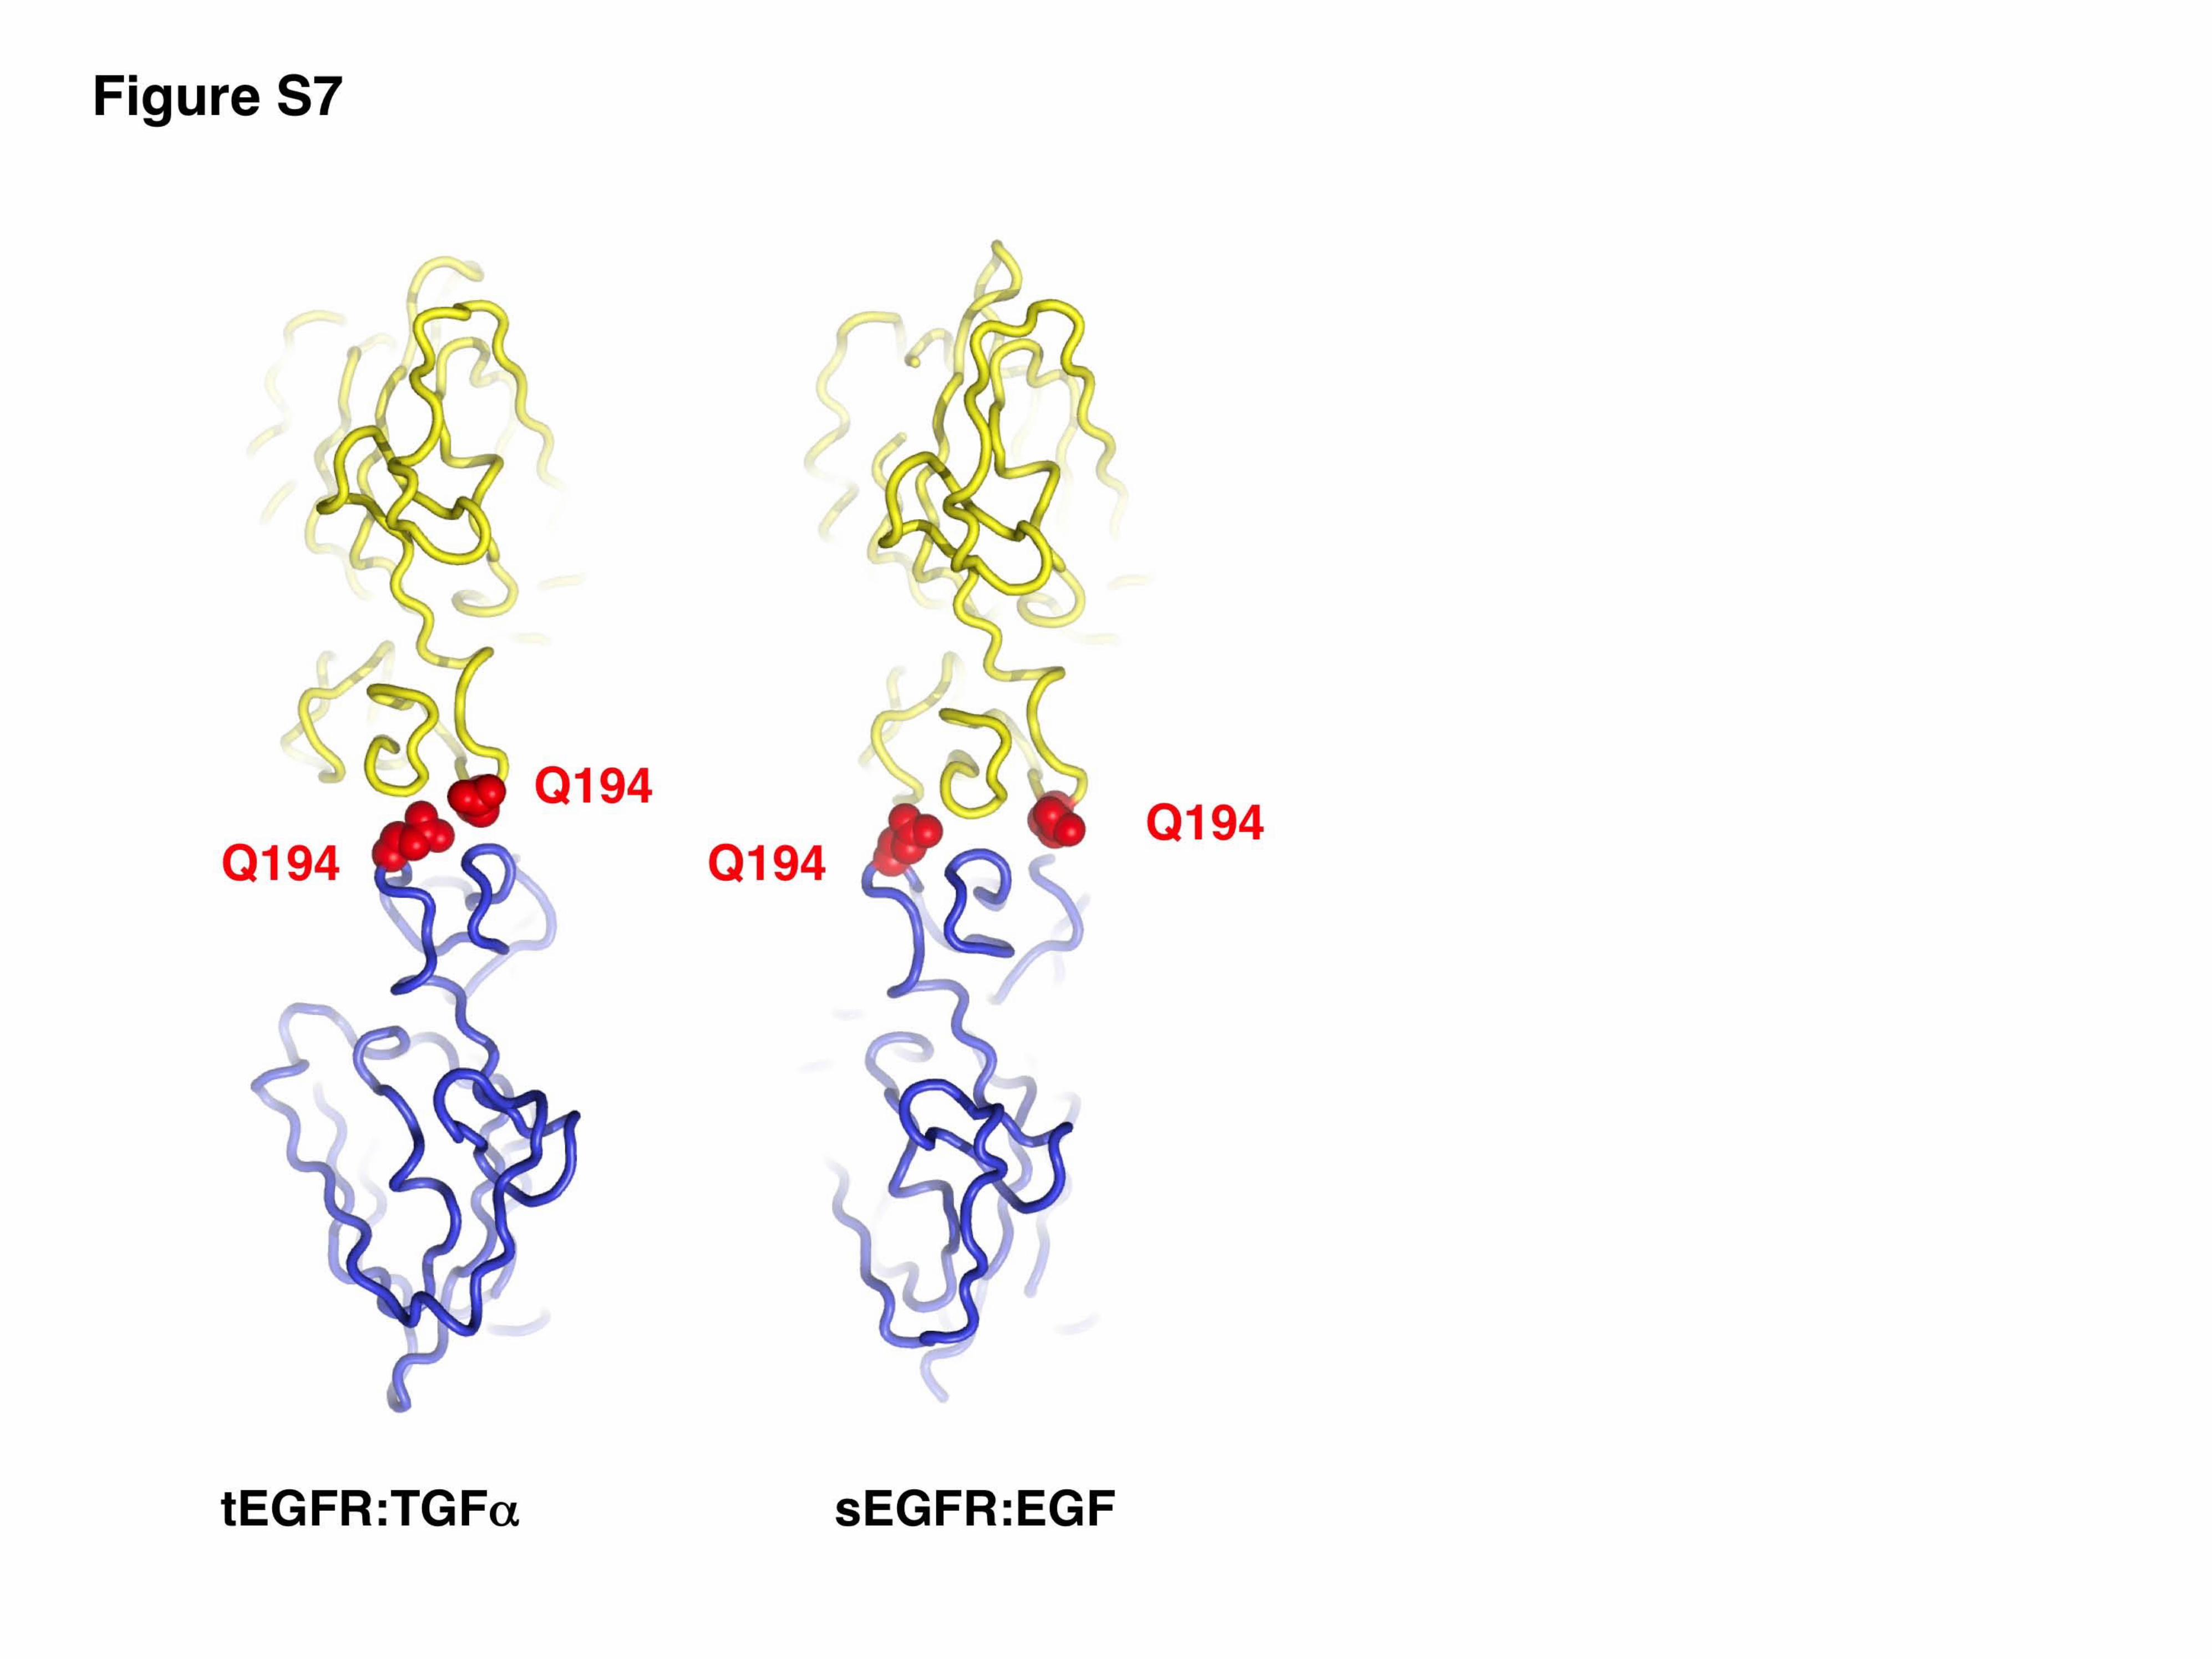
Figure S7. Glutamine 194 participates differently in tEGFR:TGFα vs. sErbB4:Nrg1β and
EGFR:EGF dimers. Worm diagrams of the “top” view of EGFR:ligand dimers, similar to the
view in the bottom panels of Figure 4, in which one EGFR subunit is colored yellow and the
other blue. The tEGFR:TGFα dimer (2) is on the left and the EGFR:EGF dimer is on the right
(1, 6). The side chain of Q194 from each subunit is shown in red spheres.
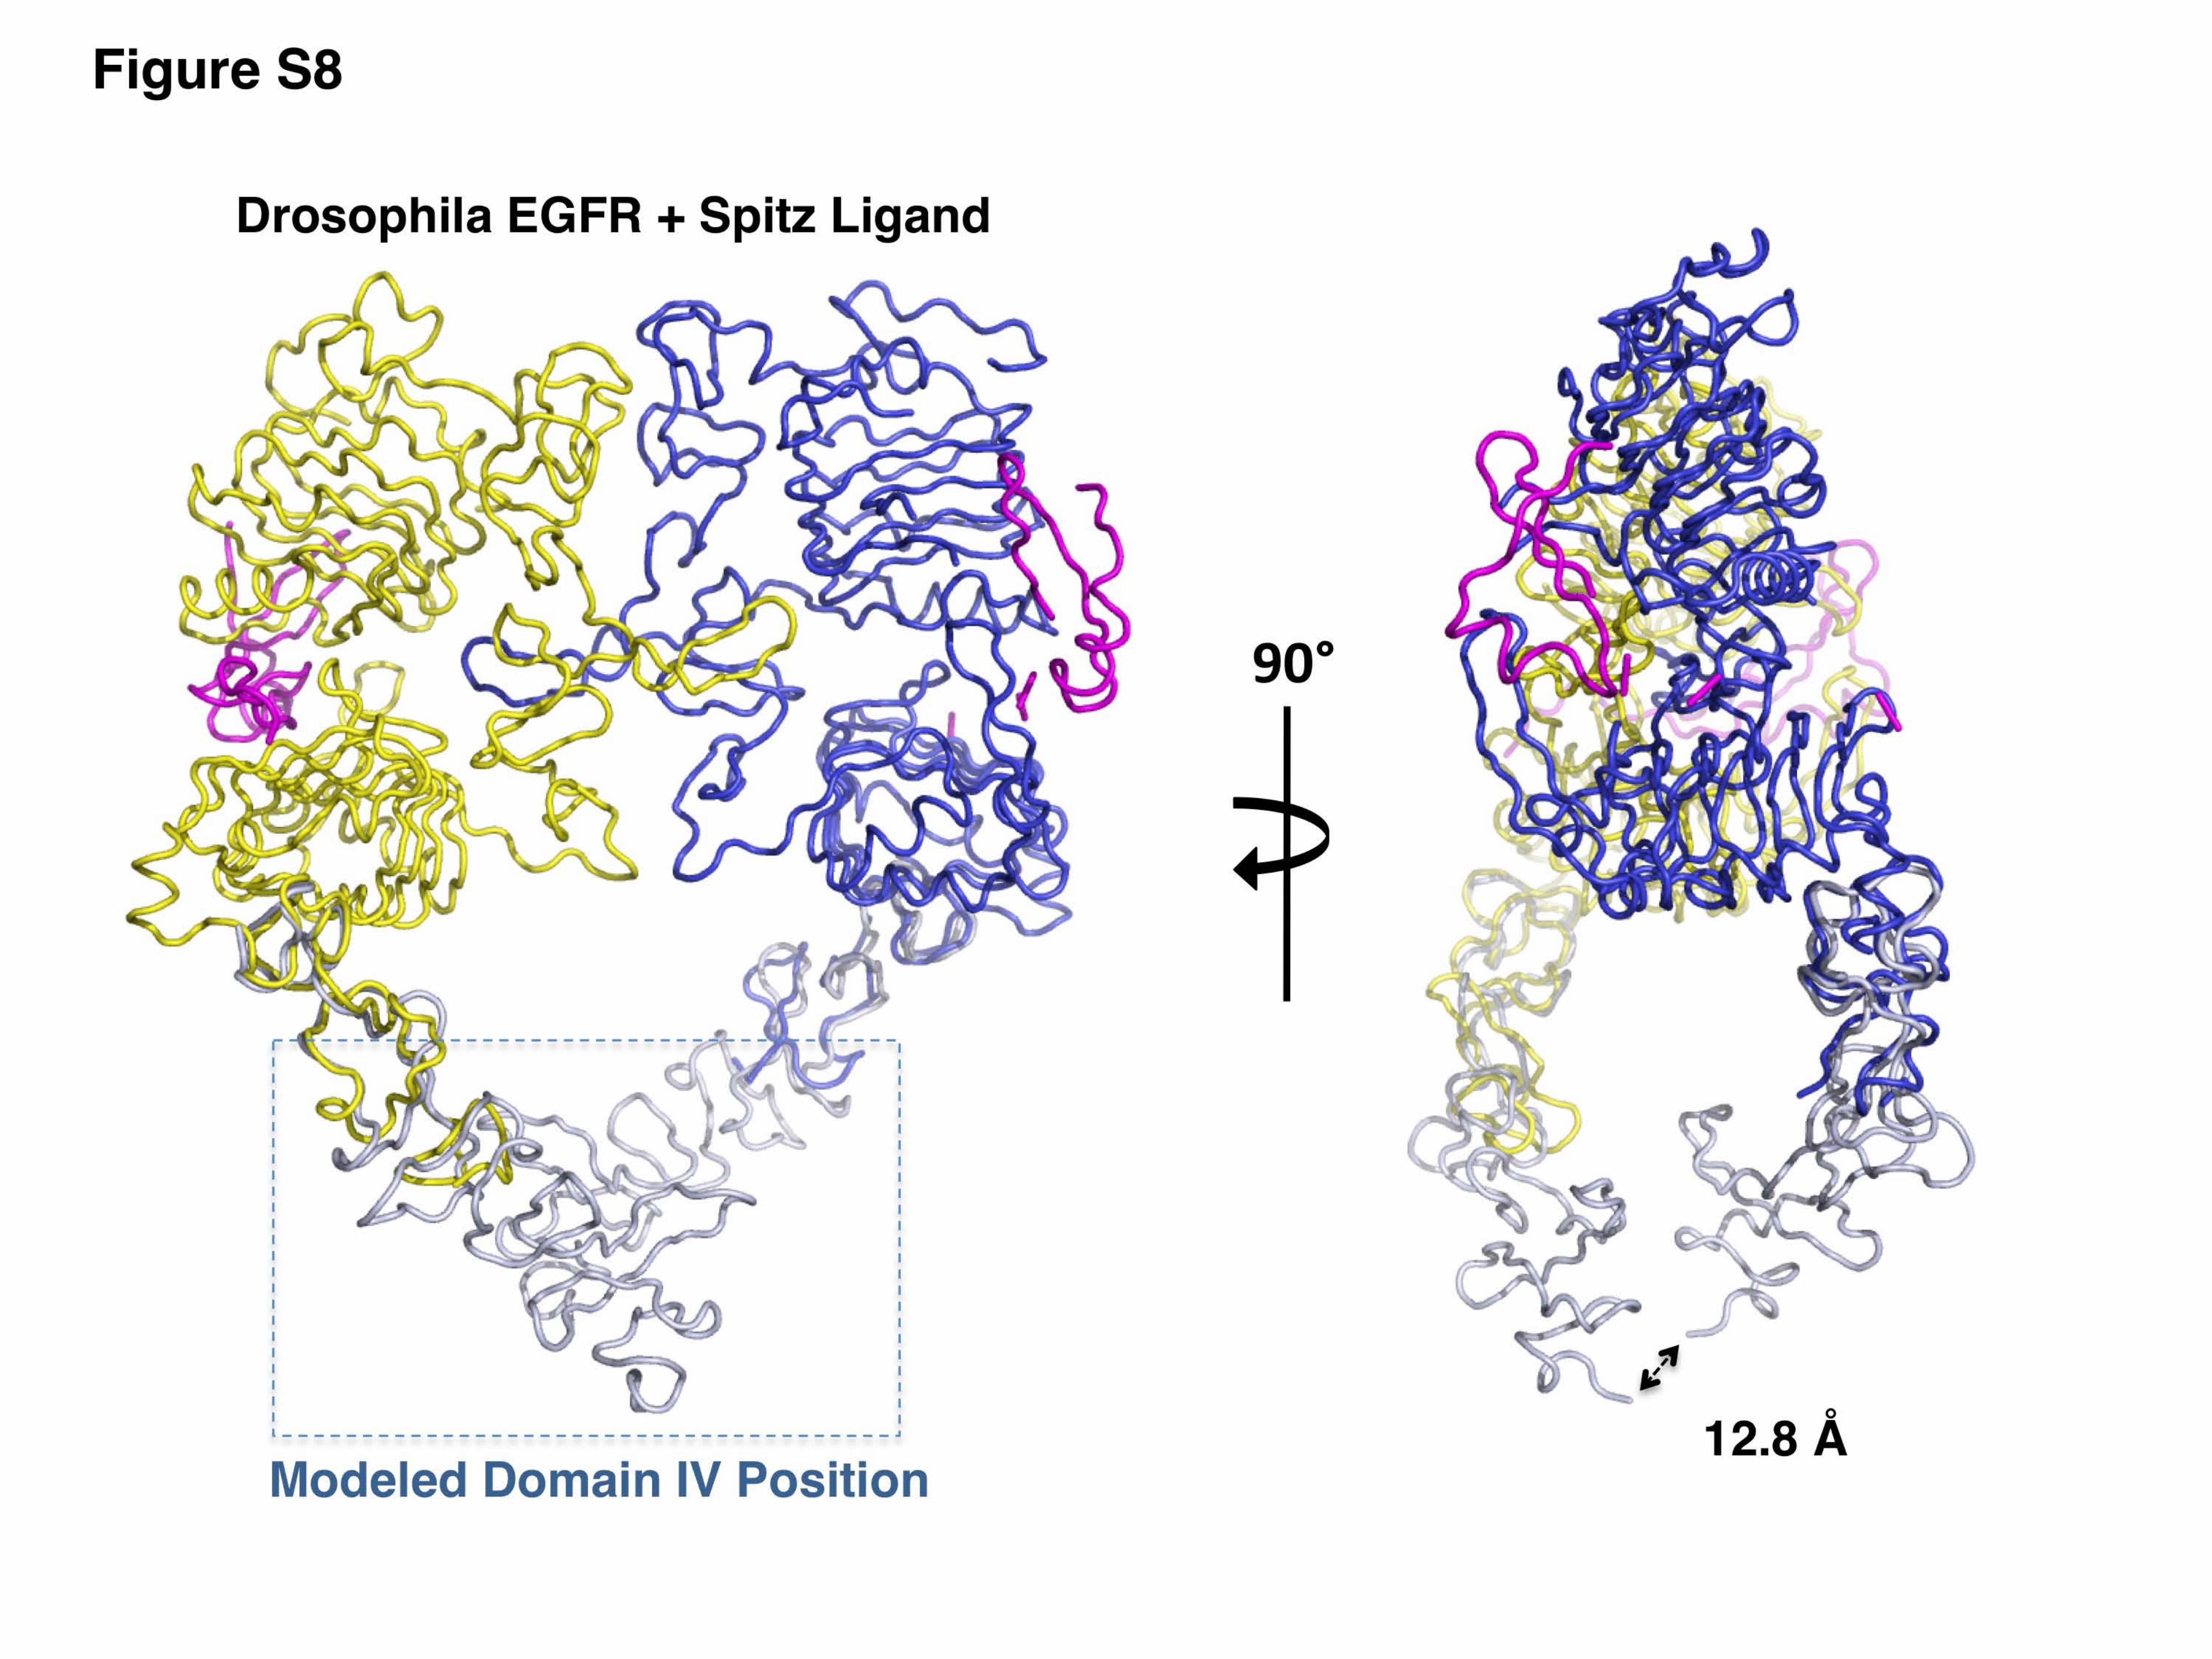
Figure S8. The position of domain IV region in the asymmetric Drosophila EGFR:Spitz dimer.
The positions of the C-terminal regions of domain IV were modeled on each subunit of the
asymmetric Drosophila EGFR:Spitz dimer by superimposing domain IV from the EGFR:EGF
dimer (1) on the homologous regions of domain IV present in the Drosophila EGFR:Spitz dimer
(3). The Drosophila EGFR subunit with a high-affinity Spitz bound is colored yellow, the
6
subunit with a low-affinity Spitz bound is blue, Spitz is magenta, and the modeled domain IV
positions are light blue. The distance between the C-termini of the modeled domain IV regions
is 12.8 Å, which compares to 8.0 Å in the EGFR:EGF dimer (1).
References 1. Lu C, et al. (2010) Structural evidence for loose linkage between ligand binding and
kinase activation in the epidermal growth factor receptor. Mol Cell Biol 30(22):5432-5443.
2. Garrett TP, et al. (2002) Crystal structure of a truncated epidermal growth factor receptor extracellular domain bound to transforming growth factor alpha. Cell 110(6):763-773.
3. Alvarado D, Klein DE, & Lemmon MA (2010) Structural basis for negative cooperativity in growth factor binding to an EGF receptor. Cell 142(4):568-579.
4. Ferguson KM, et al. (2003) EGF activates its receptor by removing interactions that autoinhibit ectodomain dimerization. Mol Cell 11(2):507-517.
5. Li S, et al. (2005) Structural basis for inhibition of the epidermal growth factor receptor by cetuximab. Cancer Cell 7(4):301-311.
6. Ogiso H, et al. (2002) Crystal structure of the complex of human epidermal growth factor and receptor extracellular domains. Cell 110(6):775-787.