Embed Size (px)
Citation preview
© 2016 American Medical Association. All rights reserved.
Supplementary Online Content
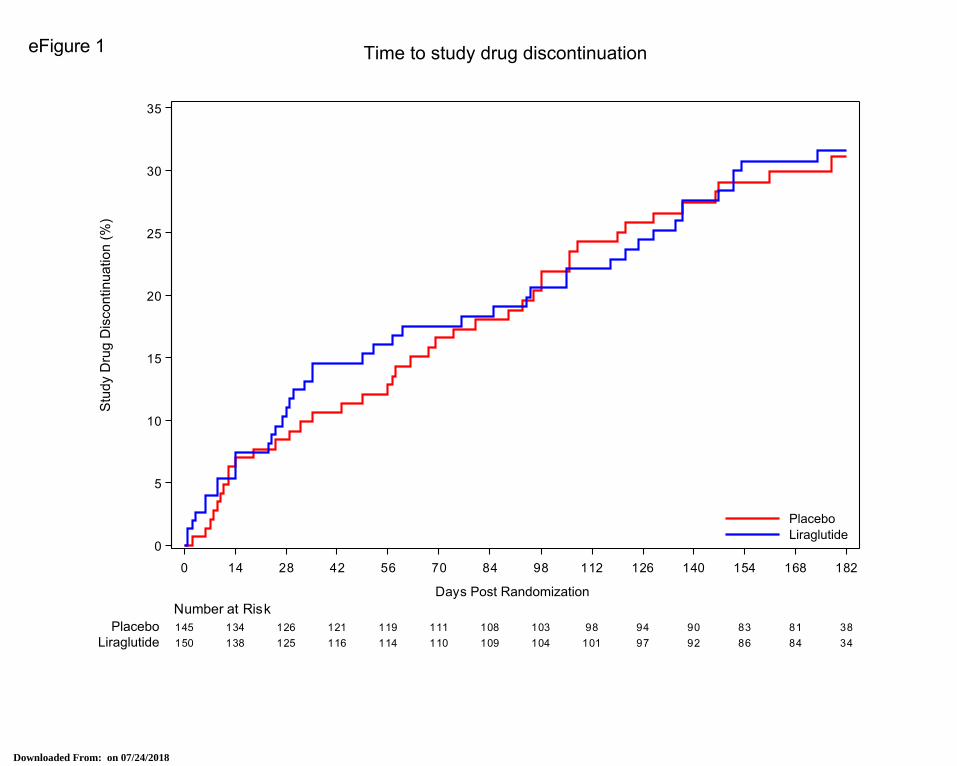
Margulies KB, Hernandez AF, Redfield MM, et al; for the NHLBI Heart Failure Clinical Research Network. Effects of Liraglutide on Clinical Stability Among Patients With Advanced Heart Failure With Reduced Ejection Fraction: A Randomized Clinical Trial. JAMA. doi:10.1001/jama.2016.10260 Lists of the clinical sites and principal investigators participating in the National Heart, Lung, and Blood Institute (NHLBI) Heart Failure Clinical Research Network eFigure 1. Time to study drug discontinuation
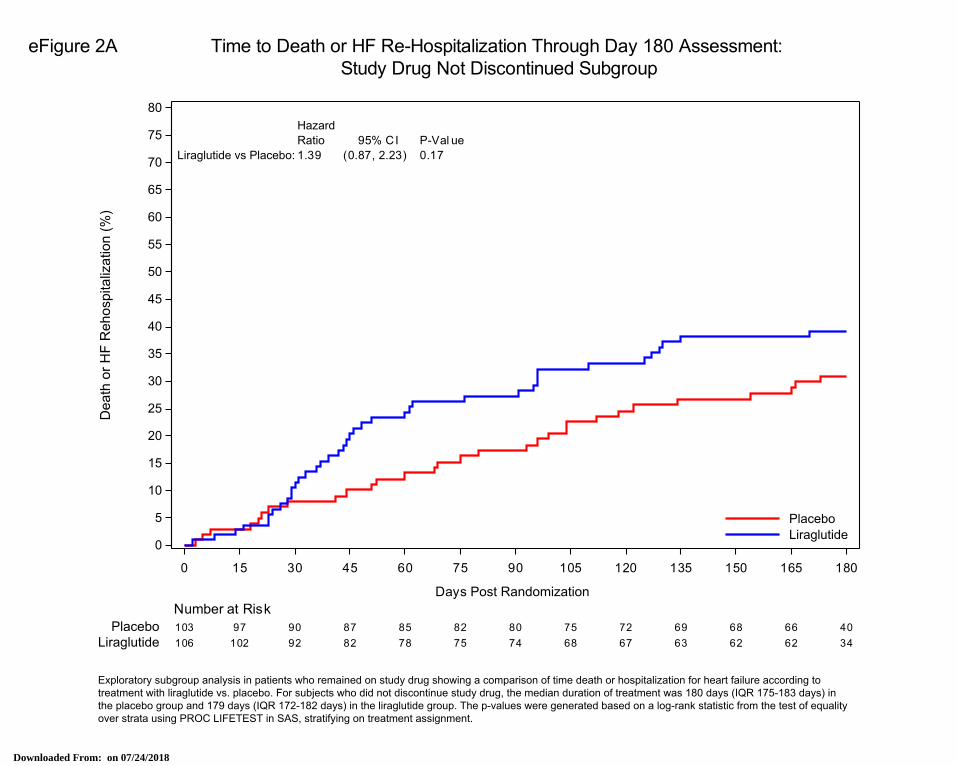
eFigure 2A. Time to death or HF re-hospitalization through day 180 assessment: study drug not discontinued subgroup
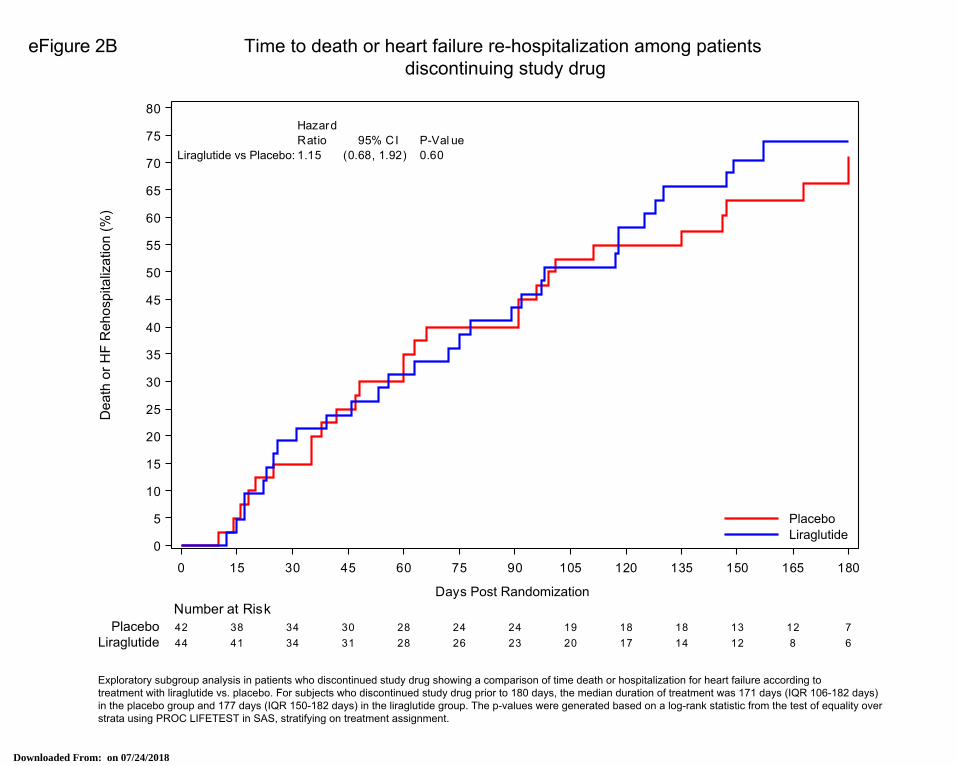
eFigure 2B. Time to death or heart failure re-hospitalization among patients discontinuing study drug eTable 1. Sensitivity analysis to account for clustering of responses by site
eTable 2. Diabetes subgroup analysis: baseline data
eTable 3. Diabetes subgroup analysis: responses to treatment
eTable 4. Investigator-reported safety events
This supplementary material has been provided by the authors to give readers additional information about their work.
Downloaded From: on 07/24/2018
HFN Member Clinical Centers: Boston VA Healthcare System: N. Lakdawala, S. Ly, J-M. Do;
Brigham and Women’s Hospital: M. Givertz, S. Anello, K. Brooks; Christiana Care Health Services: M.
Saltzberg, J. Willis, A. Herman; Cleveland Clinic Foundation: W. Tang, R. Starling, T. Fonk, C. Geither;
Duke University Medical Center: M. Felker, P. Adams, A. Mbugua, T. Wall; Emory University Hospital:
A. Smith, G. Snell, T. Dickson, T. Burns, C. Bosier; George E. Wahlen VA Medical Center: J. Stehlik, J.
Gibbs, J. Kirk; Johns Hopkins Hospital: S. Russell, A. Bacher; Lancaster General Hospital: T. Nossuli, S.
Pointer, H. Testa; Massachusetts General Hospital: M. Semigran, D. Cocca-Spofford, K. Verkouw; Mayo
Clinic: M. Redfield, J. Gatzke, S-Y. Cho; MetroHealth System: M. Dunlap, J. Nichols, P. Leo; Michael E.
DeBakey VA Medical Center: A. Deswal, A. Chee, F. Kamil, K. Zihlman; Northwestern Memorial
Hospital: S. Shah, J. Corona-Cox, H. Mkrdichian; Saint Louis University Hospital: P. Hauptman, M.
Lesko, E. Weber; Southeastern Regional Medical Center: M. Echols, L. Phillips, N. McNeill; Temple
University Hospital: R. Alvarez, F. McGonagle; Thomas Jefferson University Hospital: P. Mather, D.
Whellan, M. Fox, B. Gallagher, S. Heckard; Tufts Medical Center: M. Kiernan, M. Konstam, A.
Cronkright, G. Jamieson, R. O’Kelly; University Hospitals Case Medical Center: G. Oliveira, M.
Scheutzow, T. Semenec; University of Pennsylvania Health System: K. Margulies, T. Cappola, C.
Damon, C. Olt. F. Pickering; University of Utah Hospitals and Clinics: J. Stehlik, J. Gibbs, M. Johnson;
University of Vermont Medical Center: M. LeWinter, M. Rowen, M. Roth; Washington University
School of Medicine: G. Ewald, D. Mann, D. Whitehead, J. Flanagan, K. Bult, P. Grow.
FIGHT Data and Safety Monitoring Board: D. Vaughan (Chair), E. Rose, J. Berg, B. Greenberg, J.
Johnson, K. Davis Kennedy, J. Parrillo, M. Penn, M. Johnson, R. Agarwal, J. Ambrose, M. Powers
FIGHT Protocol Review Committee: W. Abraham (Chair), J. Berg, J. Cai, D. McNamara, D. Vaughan,
R. Virmani, J. Parrillo, E. Rose, R. Agarwal, M. Powers
Biomarker Core Lab: University of Vermont: R. Tracy
Echo Core Lab: Duke University Medical Center: F. Alenezi, A. DeVore, H-K. Kim
Coordinating Center: Duke Clinical Research Institute: A. Hernandez, E. Velazquez, M.A. Sellers, P.
Monds, T. Atwood, K. Hwang, T. Haddock
NHLBI Representatives: P. Desvigne-Nickens, K. Cooper- Arnold, M. Shah
Downloaded From: on 07/24/2018
Downloaded From: on 07/24/2018
Downloaded From: on 07/24/2018
Downloaded From: on 07/24/2018
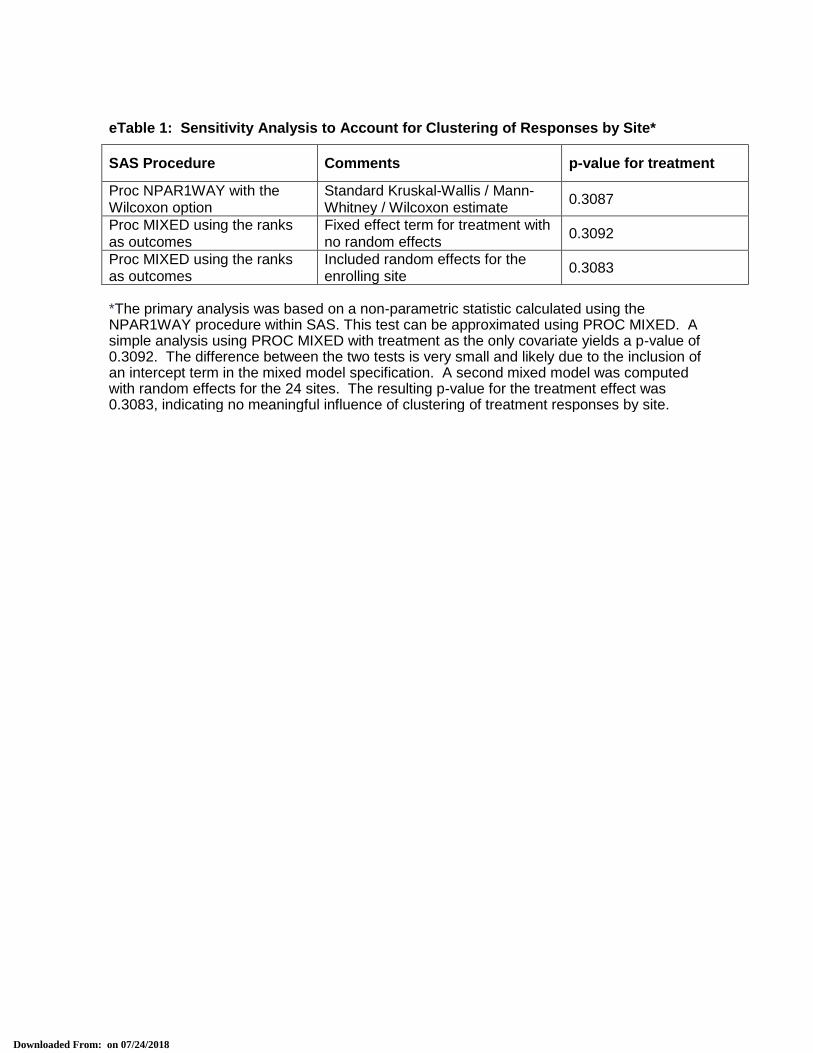
eTable 1: Sensitivity Analysis to Account for Clustering of Responses by Site*
SAS Procedure Comments p-value for treatment
Proc NPAR1WAY with the Wilcoxon option
Standard Kruskal-Wallis / Mann-Whitney / Wilcoxon estimate
0.3087
Proc MIXED using the ranks as outcomes
Fixed effect term for treatment with no random effects
0.3092
Proc MIXED using the ranks as outcomes
Included random effects for the enrolling site
0.3083
*The primary analysis was based on a non-parametric statistic calculated using the NPAR1WAY procedure within SAS. This test can be approximated using PROC MIXED. A simple analysis using PROC MIXED with treatment as the only covariate yields a p-value of 0.3092. The difference between the two tests is very small and likely due to the inclusion of an intercept term in the mixed model specification. A second mixed model was computed with random effects for the 24 sites. The resulting p-value for the treatment effect was 0.3083, indicating no meaningful influence of clustering of treatment responses by site.
Downloaded From: on 07/24/2018
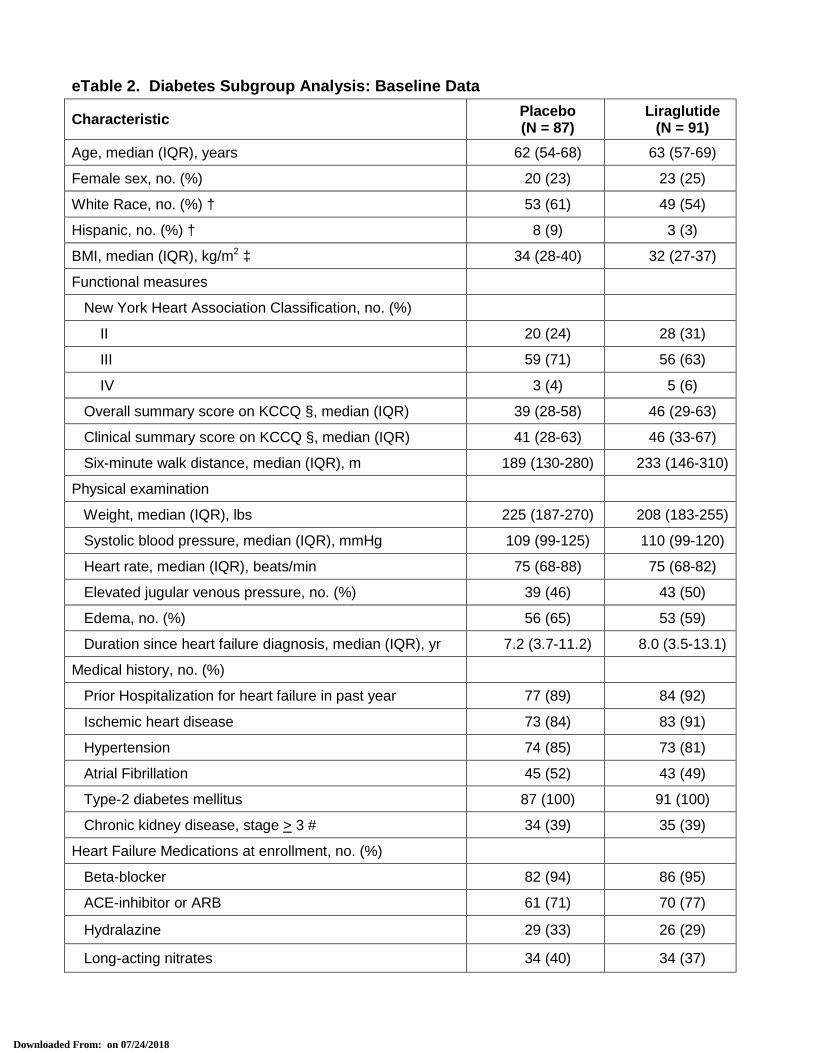
eTable 2. Diabetes Subgroup Analysis: Baseline Data
Characteristic Placebo (N = 87)
Liraglutide (N = 91)
Age, median (IQR), years 62 (54-68) 63 (57-69)
Female sex, no. (%) 20 (23) 23 (25)
White Race, no. (%) † 53 (61) 49 (54)
Hispanic, no. (%) † 8 (9) 3 (3)
BMI, median (IQR), kg/m2 ‡ 34 (28-40) 32 (27-37)
Functional measures
New York Heart Association Classification, no. (%)
II 20 (24) 28 (31)
III 59 (71) 56 (63)
IV 3 (4) 5 (6)
Overall summary score on KCCQ §, median (IQR) 39 (28-58) 46 (29-63)
Clinical summary score on KCCQ §, median (IQR) 41 (28-63) 46 (33-67)
Six-minute walk distance, median (IQR), m 189 (130-280) 233 (146-310)
Physical examination
Weight, median (IQR), lbs 225 (187-270) 208 (183-255)
Systolic blood pressure, median (IQR), mmHg 109 (99-125) 110 (99-120)
Heart rate, median (IQR), beats/min 75 (68-88) 75 (68-82)
Elevated jugular venous pressure, no. (%) 39 (46) 43 (50)
Edema, no. (%) 56 (65) 53 (59)
Duration since heart failure diagnosis, median (IQR), yr 7.2 (3.7-11.2) 8.0 (3.5-13.1)
Medical history, no. (%)
Prior Hospitalization for heart failure in past year 77 (89) 84 (92)
Ischemic heart disease 73 (84) 83 (91)
Hypertension 74 (85) 73 (81)
Atrial Fibrillation 45 (52) 43 (49)
Type-2 diabetes mellitus 87 (100) 91 (100)
Chronic kidney disease, stage > 3 # 34 (39) 35 (39)
Heart Failure Medications at enrollment, no. (%)
Beta-blocker 82 (94) 86 (95)
ACE-inhibitor or ARB 61 (71) 70 (77)
Hydralazine 29 (33) 26 (29)
Long-acting nitrates 34 (40) 34 (37)
Downloaded From: on 07/24/2018
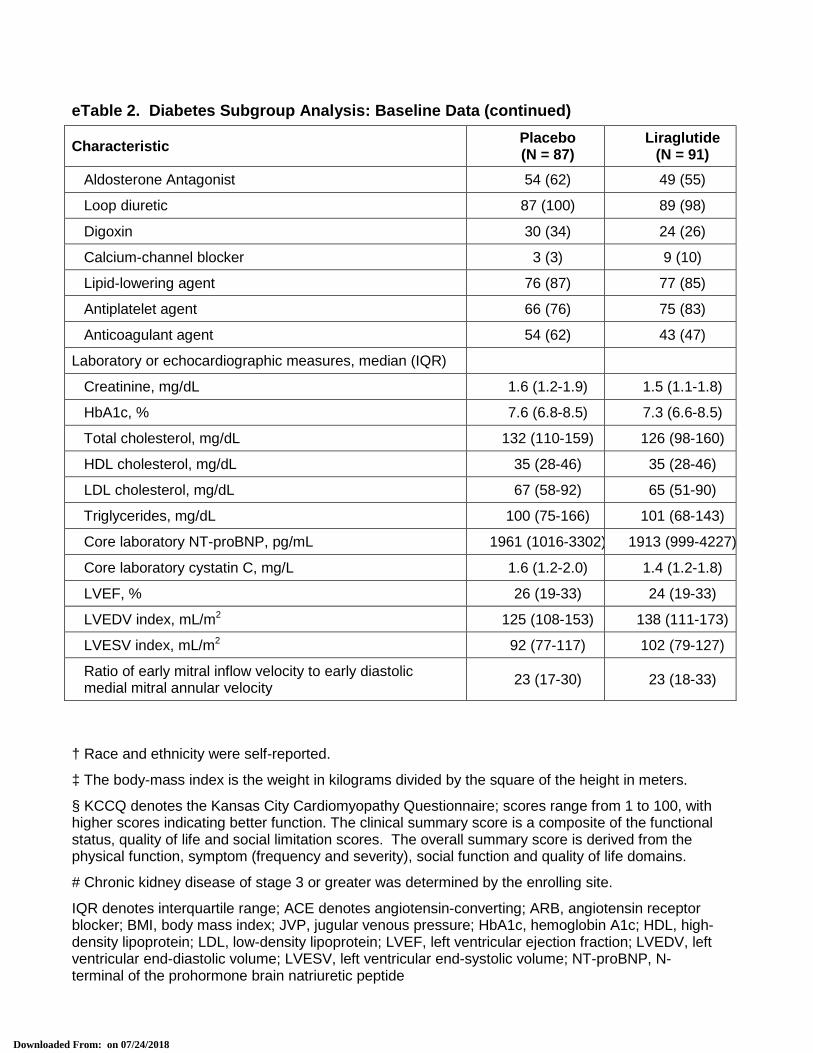
† Race and ethnicity were self-reported.
‡ The body-mass index is the weight in kilograms divided by the square of the height in meters.
§ KCCQ denotes the Kansas City Cardiomyopathy Questionnaire; scores range from 1 to 100, with higher scores indicating better function. The clinical summary score is a composite of the functional status, quality of life and social limitation scores. The overall summary score is derived from the physical function, symptom (frequency and severity), social function and quality of life domains.
# Chronic kidney disease of stage 3 or greater was determined by the enrolling site.
IQR denotes interquartile range; ACE denotes angiotensin-converting; ARB, angiotensin receptor blocker; BMI, body mass index; JVP, jugular venous pressure; HbA1c, hemoglobin A1c; HDL, high-density lipoprotein; LDL, low-density lipoprotein; LVEF, left ventricular ejection fraction; LVEDV, left ventricular end-diastolic volume; LVESV, left ventricular end-systolic volume; NT-proBNP, N-terminal of the prohormone brain natriuretic peptide
eTable 2. Diabetes Subgroup Analysis: Baseline Data (continued)
Characteristic Placebo (N = 87)
Liraglutide (N = 91)
Aldosterone Antagonist 54 (62) 49 (55)
Loop diuretic 87 (100) 89 (98)
Digoxin 30 (34) 24 (26)
Calcium-channel blocker 3 (3) 9 (10)
Lipid-lowering agent 76 (87) 77 (85)
Antiplatelet agent 66 (76) 75 (83)
Anticoagulant agent 54 (62) 43 (47)
Laboratory or echocardiographic measures, median (IQR)
Creatinine, mg/dL 1.6 (1.2-1.9) 1.5 (1.1-1.8)
HbA1c, % 7.6 (6.8-8.5) 7.3 (6.6-8.5)
Total cholesterol, mg/dL 132 (110-159) 126 (98-160)
HDL cholesterol, mg/dL 35 (28-46) 35 (28-46)
LDL cholesterol, mg/dL 67 (58-92) 65 (51-90)
Triglycerides, mg/dL 100 (75-166) 101 (68-143)
Core laboratory NT-proBNP, pg/mL 1961 (1016-3302) 1913 (999-4227)
Core laboratory cystatin C, mg/L 1.6 (1.2-2.0) 1.4 (1.2-1.8)
LVEF, % 26 (19-33) 24 (19-33)
LVEDV index, mL/m2 125 (108-153) 138 (111-173)
LVESV index, mL/m2 92 (77-117) 102 (79-127)
Ratio of early mitral inflow velocity to early diastolic medial mitral annular velocity
23 (17-30) 23 (18-33)
Downloaded From: on 07/24/2018
1
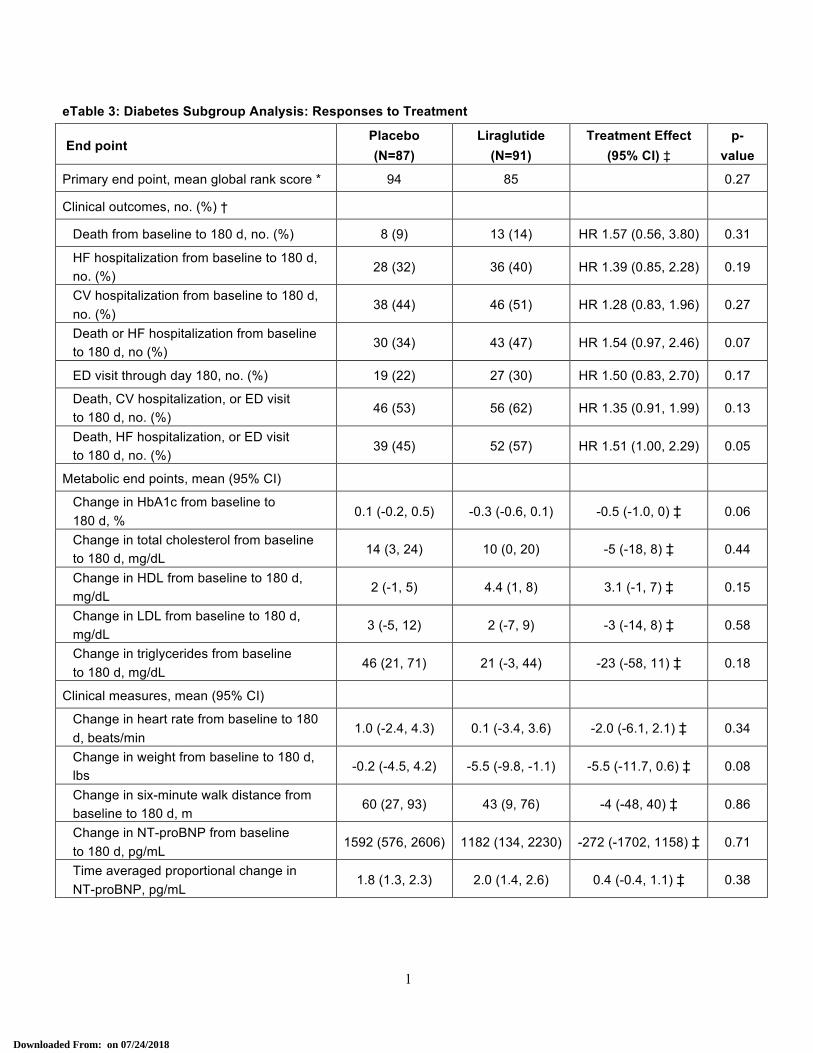
eTable 3: Diabetes Subgroup Analysis: Responses to Treatment
End point Placebo (N=87)
Liraglutide (N=91)
Treatment Effect (95% CI) ‡
p-value
Primary end point, mean global rank score * 94 85 0.27
Clinical outcomes, no. (%) †
Death from baseline to 180 d, no. (%) 8 (9) 13 (14) HR 1.57 (0.56, 3.80) 0.31
HF hospitalization from baseline to 180 d, no. (%)
28 (32) 36 (40) HR 1.39 (0.85, 2.28) 0.19
CV hospitalization from baseline to 180 d, no. (%)
38 (44) 46 (51) HR 1.28 (0.83, 1.96) 0.27
Death or HF hospitalization from baseline to 180 d, no (%)
30 (34) 43 (47) HR 1.54 (0.97, 2.46) 0.07
ED visit through day 180, no. (%) 19 (22) 27 (30) HR 1.50 (0.83, 2.70) 0.17
Death, CV hospitalization, or ED visit to 180 d, no. (%)
46 (53) 56 (62) HR 1.35 (0.91, 1.99) 0.13
Death, HF hospitalization, or ED visit to 180 d, no. (%)
39 (45) 52 (57) HR 1.51 (1.00, 2.29) 0.05
Metabolic end points, mean (95% CI)
Change in HbA1c from baseline to 180 d, %
0.1 (-0.2, 0.5) -0.3 (-0.6, 0.1) -0.5 (-1.0, 0) ‡ 0.06
Change in total cholesterol from baseline to 180 d, mg/dL
14 (3, 24) 10 (0, 20) -5 (-18, 8) ‡ 0.44
Change in HDL from baseline to 180 d, mg/dL
2 (-1, 5) 4.4 (1, 8) 3.1 (-1, 7) ‡ 0.15
Change in LDL from baseline to 180 d, mg/dL
3 (-5, 12) 2 (-7, 9) -3 (-14, 8) ‡ 0.58
Change in triglycerides from baseline to 180 d, mg/dL
46 (21, 71) 21 (-3, 44) -23 (-58, 11) ‡ 0.18
Clinical measures, mean (95% CI)
Change in heart rate from baseline to 180 d, beats/min
1.0 (-2.4, 4.3) 0.1 (-3.4, 3.6) -2.0 (-6.1, 2.1) ‡ 0.34
Change in weight from baseline to 180 d, lbs
-0.2 (-4.5, 4.2) -5.5 (-9.8, -1.1) -5.5 (-11.7, 0.6) ‡ 0.08
Change in six-minute walk distance from baseline to 180 d, m
60 (27, 93) 43 (9, 76) -4 (-48, 40) ‡ 0.86
Change in NT-proBNP from baseline to 180 d, pg/mL
1592 (576, 2606) 1182 (134, 2230) -272 (-1702, 1158) ‡ 0.71
Time averaged proportional change in NT-proBNP, pg/mL
1.8 (1.3, 2.3) 2.0 (1.4, 2.6) 0.4 (-0.4, 1.1) ‡ 0.38
Downloaded From: on 07/24/2018
2
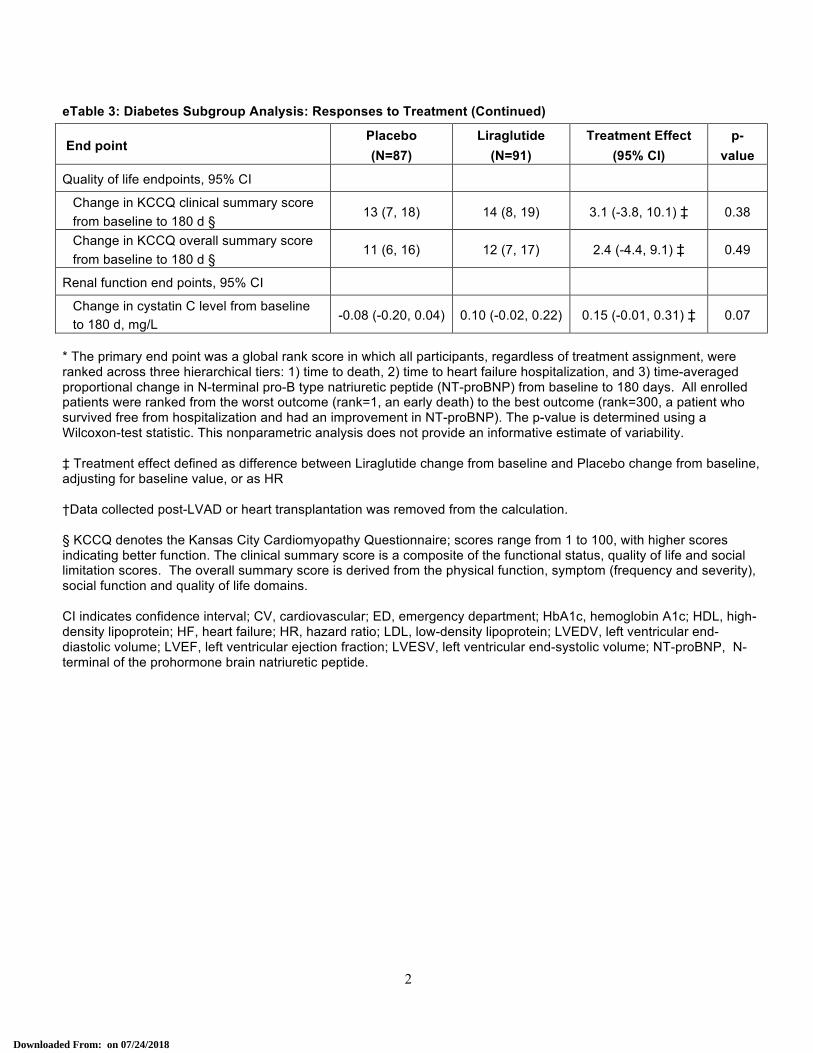
eTable 3: Diabetes Subgroup Analysis: Responses to Treatment (Continued)
End point Placebo (N=87)
Liraglutide (N=91)
Treatment Effect (95% CI)
p-value
Quality of life endpoints, 95% CI
Change in KCCQ clinical summary score from baseline to 180 d §
13 (7, 18) 14 (8, 19) 3.1 (-3.8, 10.1) ‡ 0.38
Change in KCCQ overall summary score from baseline to 180 d §
11 (6, 16) 12 (7, 17) 2.4 (-4.4, 9.1) ‡ 0.49
Renal function end points, 95% CI
Change in cystatin C level from baseline to 180 d, mg/L
-0.08 (-0.20, 0.04) 0.10 (-0.02, 0.22) 0.15 (-0.01, 0.31) ‡ 0.07
* The primary end point was a global rank score in which all participants, regardless of treatment assignment, were ranked across three hierarchical tiers: 1) time to death, 2) time to heart failure hospitalization, and 3) time-averaged proportional change in N-terminal pro-B type natriuretic peptide (NT-proBNP) from baseline to 180 days. All enrolled patients were ranked from the worst outcome (rank=1, an early death) to the best outcome (rank=300, a patient who survived free from hospitalization and had an improvement in NT-proBNP). The p-value is determined using a Wilcoxon-test statistic. This nonparametric analysis does not provide an informative estimate of variability. ‡ Treatment effect defined as difference between Liraglutide change from baseline and Placebo change from baseline, adjusting for baseline value, or as HR †Data collected post-LVAD or heart transplantation was removed from the calculation. § KCCQ denotes the Kansas City Cardiomyopathy Questionnaire; scores range from 1 to 100, with higher scores indicating better function. The clinical summary score is a composite of the functional status, quality of life and social limitation scores. The overall summary score is derived from the physical function, symptom (frequency and severity), social function and quality of life domains. CI indicates confidence interval; CV, cardiovascular; ED, emergency department; HbA1c, hemoglobin A1c; HDL, high-density lipoprotein; HF, heart failure; HR, hazard ratio; LDL, low-density lipoprotein; LVEDV, left ventricular end-diastolic volume; LVEF, left ventricular ejection fraction; LVESV, left ventricular end-systolic volume; NT-proBNP, N-terminal of the prohormone brain natriuretic peptide.
Downloaded From: on 07/24/2018
1
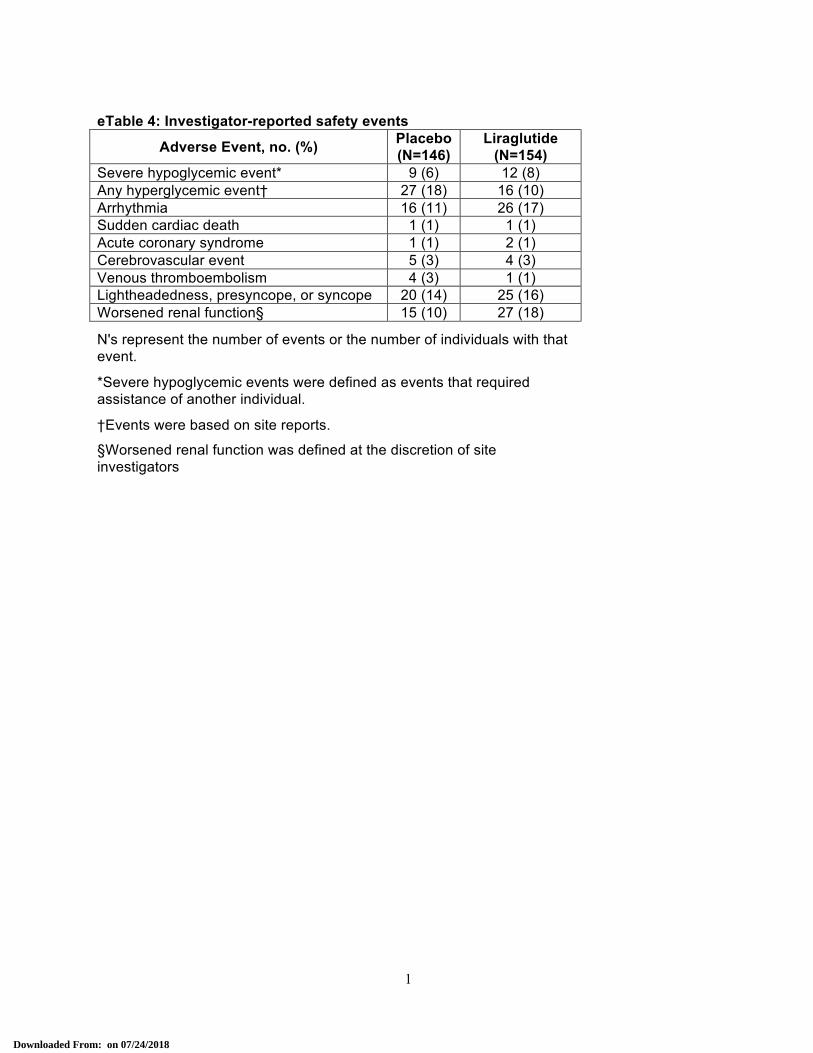
eTable 4: Investigator-reported safety events
Adverse Event, no. (%) Placebo (N=146)
Liraglutide (N=154)
Severe hypoglycemic event* 9 (6) 12 (8) Any hyperglycemic event† 27 (18) 16 (10) Arrhythmia 16 (11) 26 (17) Sudden cardiac death 1 (1) 1 (1) Acute coronary syndrome 1 (1) 2 (1) Cerebrovascular event 5 (3) 4 (3) Venous thromboembolism 4 (3) 1 (1) Lightheadedness, presyncope, or syncope 20 (14) 25 (16) Worsened renal function§ 15 (10) 27 (18)
N's represent the number of events or the number of individuals with that event.
*Severe hypoglycemic events were defined as events that required assistance of another individual.
†Events were based on site reports.
§Worsened renal function was defined at the discretion of site investigators
Downloaded From: on 07/24/2018

![Proc] Proc] Data Modell / Model Kategorie / Category ...€¦ · Proc] Proc] Data Modell / Model Kategorie / Category Energieeffizienzklasse Energieverbrauch (kWh / h / annum) Energy](https://img.pdfslide.us/doc/110x75/5ead02c5c9995c41470efc29/proc-proc-data-modell-model-kategorie-category-proc-proc-data-modell.jpg)