Embed Size (px)
Citation preview
Supplementary Methods
Cytospin and cell staining
Cells were sorted based on their surface marker expression, cytospun in PBS at 1000
rpm onto glass slides and stained with Hema 3 stain set (Fisher diagnostics) to identify
cellular morphology.1
Ly6Chi monocyte stimulation
Sorted Ly6Chi monocytes from WT and Nlrp6-/- mice were cultured in complete RPMI
with 10% FBS, penicillin/streptomycin and glutamine and stimulated with 20µM
rosiglitazone (Cayman Chemicals). After 24-hour incubation at 37°C, supernatant was
collected and cytokines measured by ELISA.
Gene Chip analysis
LP cells were isolated from WT or Nlrp6-/- mice at day 10 of AOM/2%DSS. Ly6Chi
monocytes were sorted on a FACS AriaIII (University of Michigan). RNA from sorted
cells was extracted using the RNeasy Micro Kit (Qiagen), and contaminated DNA was
removed using a DNA-free kit (Ambion). cDNA was prepared from 10 ng total RNA using
the NuGen WT-Pico V2 kit (Ovation PicoSL WTA System V2 P/N 3312). Biotinylated
single-stranded cDNA was then prepared from 3µg cDNA (Encore Biotin Module;
catalog nos. 4200-12, 4200-60, and 4200-A01). Single-stranded cDNA was then
fragmented, and 3.7 µg cDNA was hybridized for 20 h at 48 °C on Mouse Gene ST 2.1
strip arrays using the Affymetrix Gene Atlas System (software version 1.0.4.267). Arrays
were scanned using the same system. Expression values were calculated using a robust
multiarray average (RMA). RMA was calculated using the oligo package of bioconductor
in R (Version 2.15.1; www.R-project.org). Ratios were generated using normalized raw
expression values and then log2 transformed. Functional analyses of gene expression
changes were performed using Ingenuity Pathways Analysis (IPA) 8.0 (Ingenuity
Systems; http://www.ingenuity.com). The analysis considered all genes from the data set
that were associated with biologic functions in the Ingenuity Pathways Knowledge Base.2
Heat map of hierarchical clustering of the genes from cytokine/chemokine pathways,
based on IPA was generated. The microarray data are available in the Gene Expression
Omnibus (GEO) database (http://www.ncbi.nlm.nih.gov/gds) under the accession
number GSE79631.
Supplementary Figure Legends
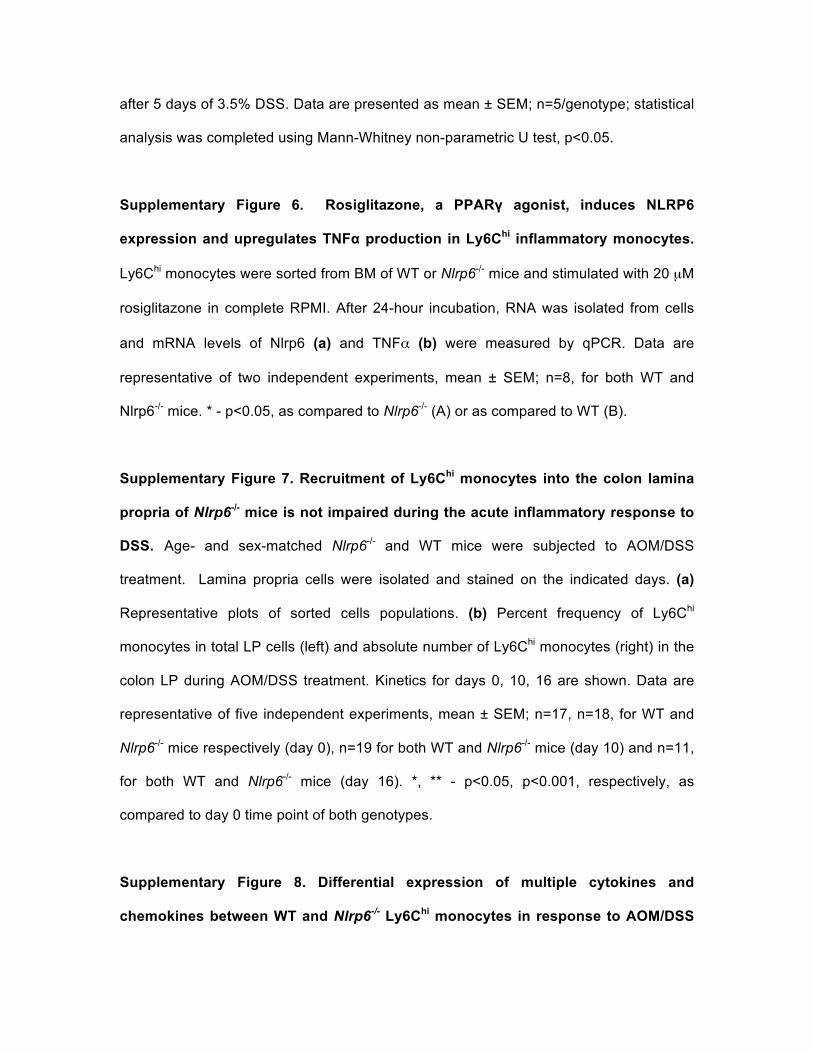
Supplementary Figure 1. NLRP6 is induced in lamina propria Ly6Chi monocytes
during DSS induced inflammation. WT and Nlrp6-/- mice were subjected to 3.5% DSS
in drinking water for 5 days. On day 5 mice were sacrificed. NLRP6 expression was
measured in (a) total LP cells and (b) CD3+B220-CD11b- T cells, CD3-B220+CD11b- B
cells, CD3-CD11b+Ly6ChiLy6G- monocytes and CD3-CD11b+Ly6CintLy6G+ neutrophils
within the LP by qPCR. Data are presented as mean ± SEM; n=5/genotype; statistical
analysis was completed using Mann-Whitney non-parametric U test, p<0.05.
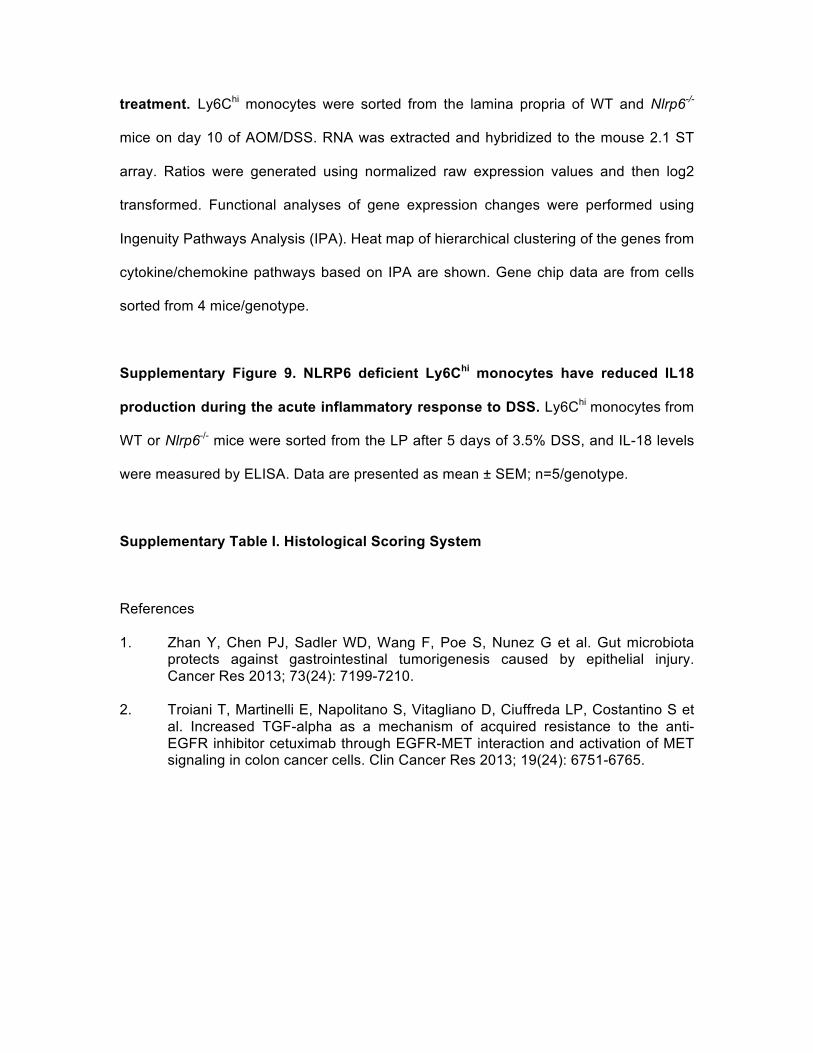
Supplementary Figure 2. Ly6Chi inflammatory monocytes are CCR2+, which is
required for protection against DSS-induced mortality in Nlrp6-/- mice. (a) Adoptive
transfer of GFP+ Ly6Chi monocytes at day 3.5 of 3.5% DSS results in infiltration of donor
cells into the LP of recipient Nlrp6-/- mice. (b) Representative plots of Ly6C versus Ly6G
staining of CD3- CD11b+ LP cells (left) and percent CCR2+ cells within Ly6Chi monocytes
in the LP of DSS-treated WT and Nlrp6-/- mice (right). Staining for CCR2 in splenocytes
isolated from Ccr2-/- mice as a negative control (far right). (c) Percent weight change of
WT, Nlrp6-/-, and Nlrp6-/- mice adoptively transferred with WT or Ccr2-/- Ly6Chi monocytes
with 3.5% DSS on days 0-7. (d) Kaplan–Meyer survival curves of mice treated with 7
days of 3.5% DSS. n=5 for WT and Nlrp6-/- + WT Ly6Chi monocytes groups, n=8 for
Nlrp6-/- and Nlrp6-/- + Ccr2-/- Ly6Chi monocytes groups. **, p<0.01, between Nlrp6-/- and
Nlrp6-/- + Ccr2-/- Ly6Chi monocytes groups as compared to Nlrp6-/- + WT Ly6Chi
monocytes group.
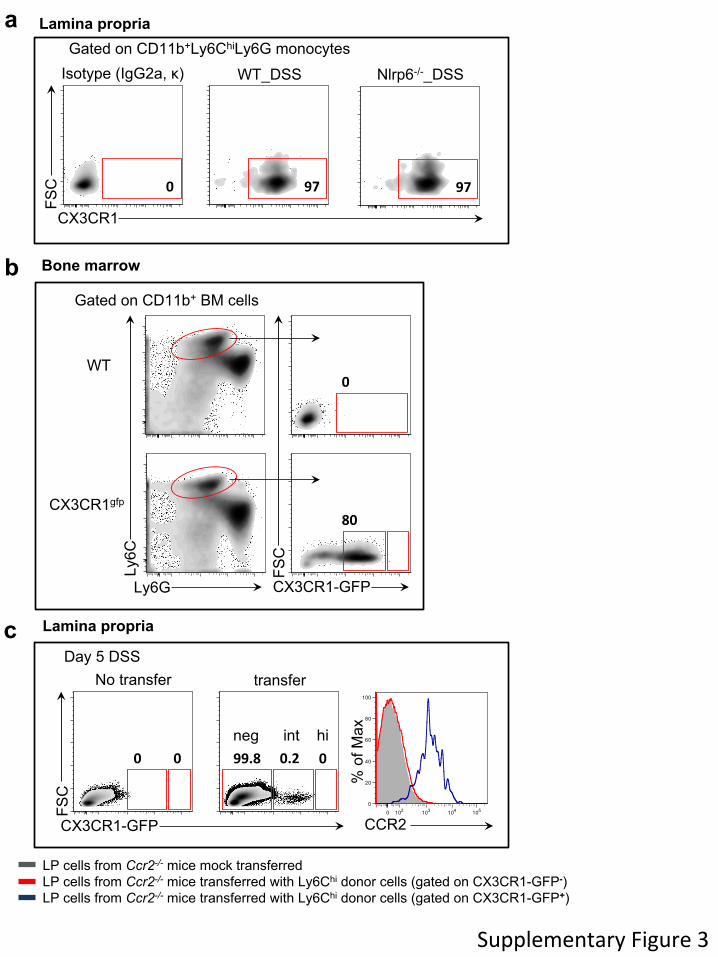
Supplementary Figure 3. Adoptively transferred Ly6Chi inflammatory monocytes
infiltrate the lamina propria and are CX3CR1int. (a) Age- and sex-matched Nlrp6-/- and
WT mice were treated 3.5% DSS for 5 days. On day 5, mice were sacrificed and
composition of lamina propria cells analyzed. Representative plots of CX3CR1
expressing Ly6Chi monocytes in DSS-treated WT and Nlrp6-/- mice in which 97% of LP-
infiltrating inflammatory monocytes are CX3CR1+ in both WT and Nlrp6-/- mice. n=5 for
each group of mice. (b) CX3CR1 staining of Ly6Chi inflammatory monocytes sorted from
the bone marrow of CX3CR1gfp donor mice and adoptively transferred into Ccr2-/-
recipient mice on day 3.5 of 3.5% DSS. (c) FACs analysis of LP cells isolated from DSS-
treated Ccr2-/- recipient mice adoptively transferred with Ly6Chi CX3CR1gfp monocytes.
CX3CR1-GFP expression in LP cells from DSS-treated Ccr2-/- recipient that were mock-
transferred (left) or adoptively transferred with Ly6Chi CX3CR1gfp cells (middle).
Histogram (right) showing CCR2 expression of CX3CR1-GFP- and CX3CR1-GFP+ cells
isolated from the designated Ccr2-/- recipient mice. CCR2+ cells are donor-derived.
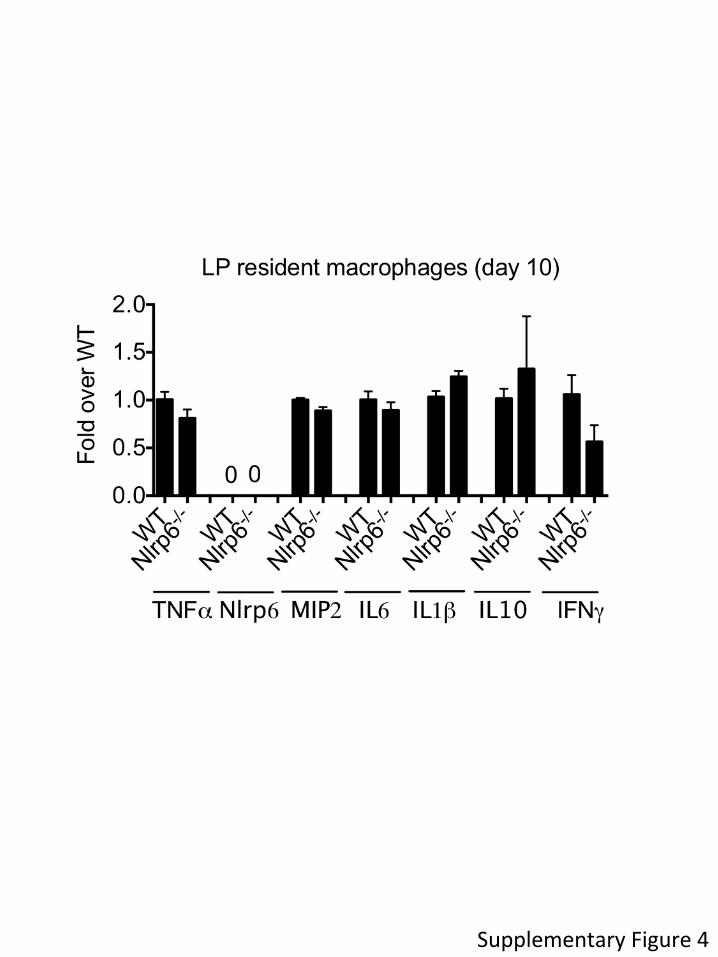
Supplementary Figure 4. LP resident macrophages do not exhibit impaired TNFα
production. Resident LP macrophages (CD11b+Ly6Clow/-F4/80highLy6G-) were sorted
from the LP of WT or Nlrp6-/- mice at day 10 of AOM/DSS as cells and gene induction
was measured by qPCR. Data are representative of three independent experiments,
mean ± SEM; n=14, for both WT and Nlrp6-/- mice. * - p<0.05, as compared to WT.
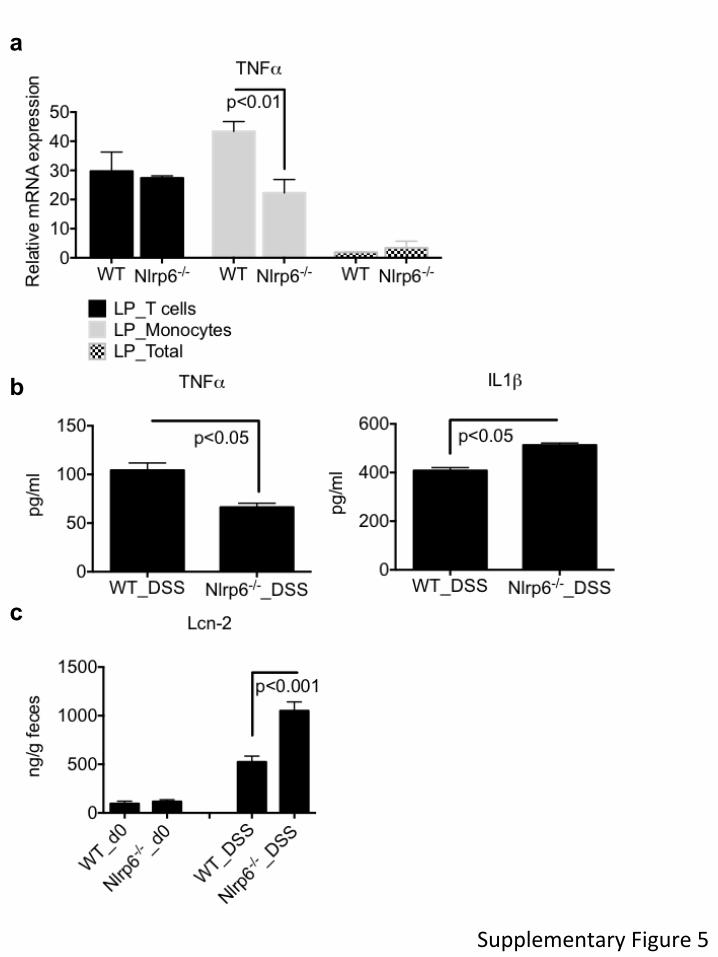
Supplementary Figure 5. NLRP6-/- Ly6Chi monocytes have impaired TNFα
production in response to DSS-induced epithelial injury. (a) Induction of TNFα in T
cells, Ly6Chi monocytes and total LP isolated from WT and Nlrp6-/- mice after 5 days of
3.5% DSS as measured by qPCR. (b) Ly6Chi monocytes from WT or Nlrp6-/- mice were
sorted from the LP after 5 days of 3.5% DSS and production of TNFα and IL1β was
measured by ELISA. (c) Fecal lipocalin-2 levels were measured by ELISA before and
after 5 days of 3.5% DSS. Data are presented as mean ± SEM; n=5/genotype; statistical
analysis was completed using Mann-Whitney non-parametric U test, p<0.05.
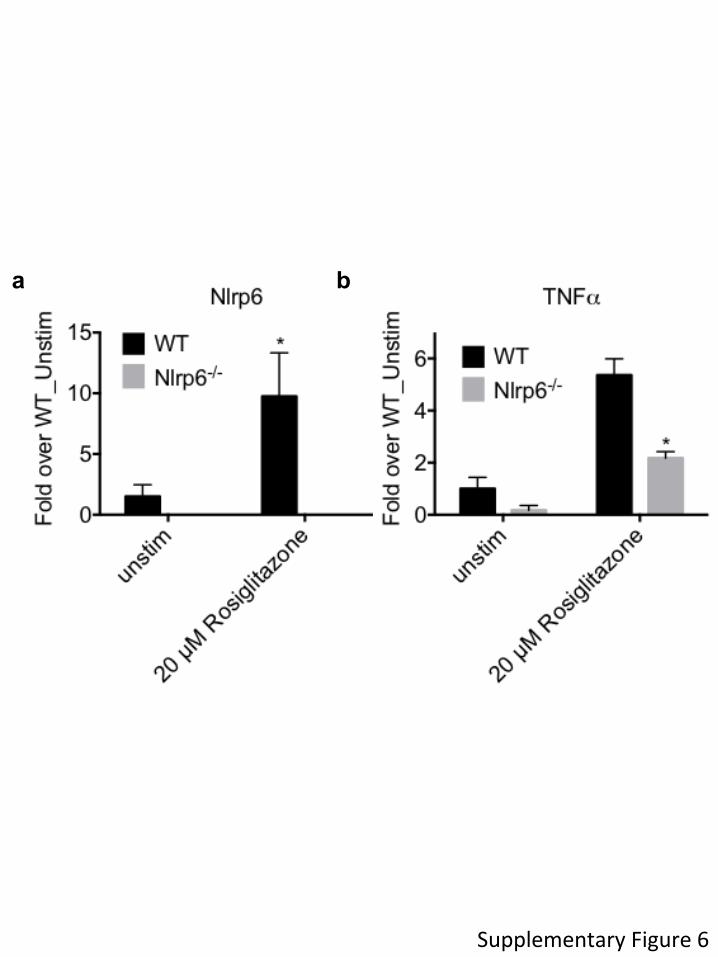
Supplementary Figure 6. Rosiglitazone, a PPARγ agonist, induces NLRP6
expression and upregulates TNFα production in Ly6Chi inflammatory monocytes.
Ly6Chi monocytes were sorted from BM of WT or Nlrp6-/- mice and stimulated with 20 µM
rosiglitazone in complete RPMI. After 24-hour incubation, RNA was isolated from cells
and mRNA levels of Nlrp6 (a) and TNFα (b) were measured by qPCR. Data are
representative of two independent experiments, mean ± SEM; n=8, for both WT and
Nlrp6-/- mice. * - p<0.05, as compared to Nlrp6-/- (A) or as compared to WT (B).
Supplementary Figure 7. Recruitment of Ly6Chi monocytes into the colon lamina
propria of Nlrp6-/- mice is not impaired during the acute inflammatory response to
DSS. Age- and sex-matched Nlrp6-/- and WT mice were subjected to AOM/DSS
treatment. Lamina propria cells were isolated and stained on the indicated days. (a)
Representative plots of sorted cells populations. (b) Percent frequency of Ly6Chi
monocytes in total LP cells (left) and absolute number of Ly6Chi monocytes (right) in the
colon LP during AOM/DSS treatment. Kinetics for days 0, 10, 16 are shown. Data are
representative of five independent experiments, mean ± SEM; n=17, n=18, for WT and
Nlrp6-/- mice respectively (day 0), n=19 for both WT and Nlrp6-/- mice (day 10) and n=11,
for both WT and Nlrp6-/- mice (day 16). *, ** - p<0.05, p<0.001, respectively, as
compared to day 0 time point of both genotypes.
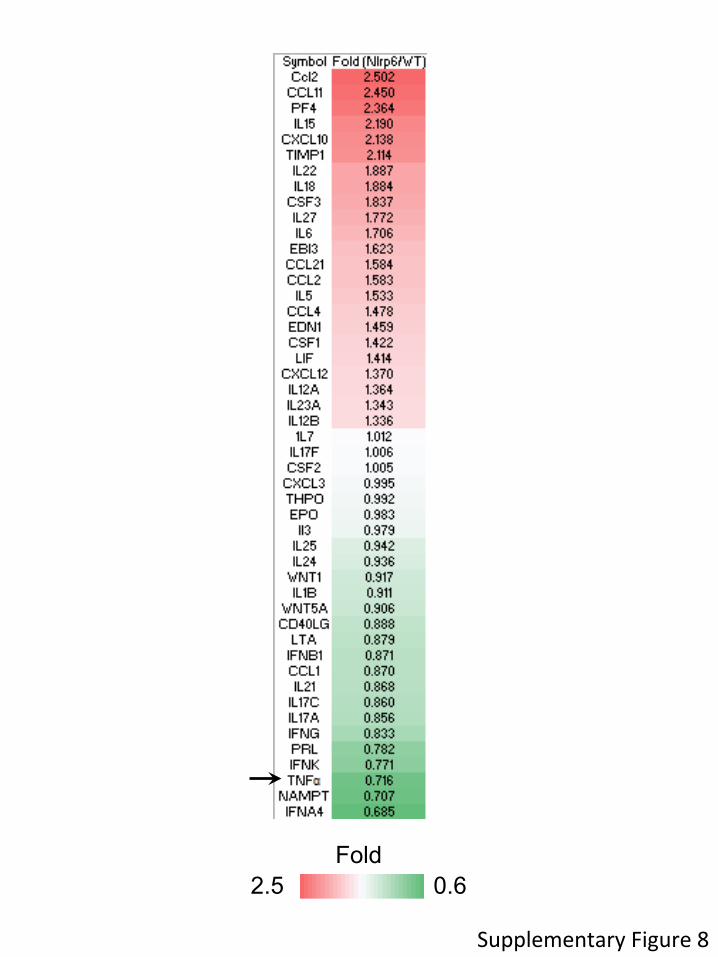
Supplementary Figure 8. Differential expression of multiple cytokines and
chemokines between WT and Nlrp6-/- Ly6Chi monocytes in response to AOM/DSS
treatment. Ly6Chi monocytes were sorted from the lamina propria of WT and Nlrp6-/-
mice on day 10 of AOM/DSS. RNA was extracted and hybridized to the mouse 2.1 ST
array. Ratios were generated using normalized raw expression values and then log2
transformed. Functional analyses of gene expression changes were performed using
Ingenuity Pathways Analysis (IPA). Heat map of hierarchical clustering of the genes from
cytokine/chemokine pathways based on IPA are shown. Gene chip data are from cells
sorted from 4 mice/genotype.
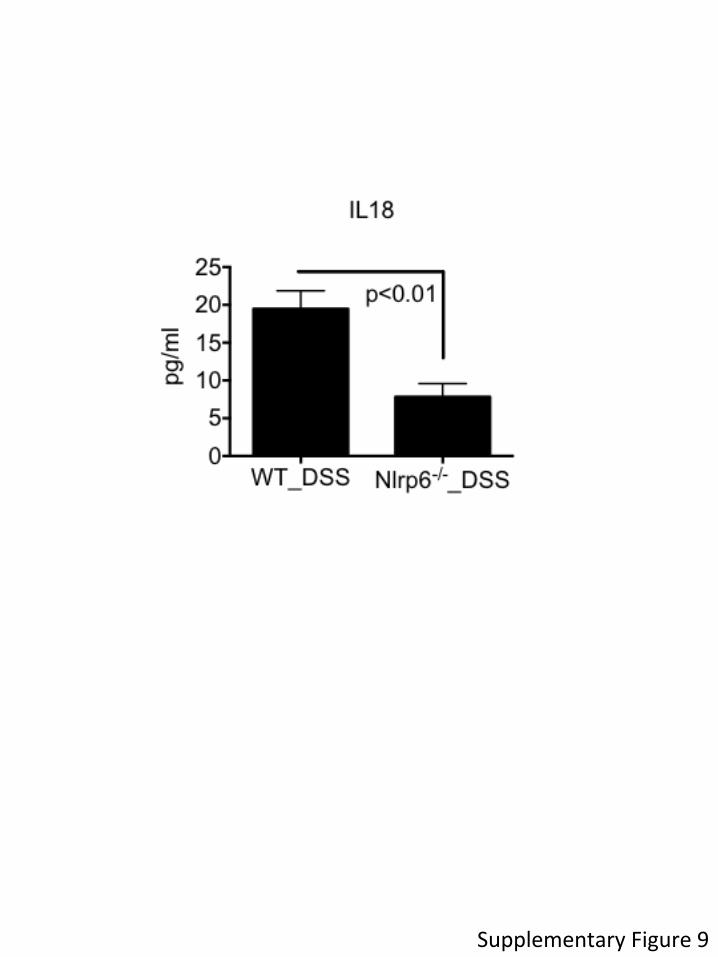
Supplementary Figure 9. NLRP6 deficient Ly6Chi monocytes have reduced IL18
production during the acute inflammatory response to DSS. Ly6Chi monocytes from
WT or Nlrp6-/- mice were sorted from the LP after 5 days of 3.5% DSS, and IL-18 levels
were measured by ELISA. Data are presented as mean ± SEM; n=5/genotype.
Supplementary Table I. Histological Scoring System
References
1. Zhan Y, Chen PJ, Sadler WD, Wang F, Poe S, Nunez G et al. Gut microbiota protects against gastrointestinal tumorigenesis caused by epithelial injury. Cancer Res 2013; 73(24): 7199-7210.
2. Troiani T, Martinelli E, Napolitano S, Vitagliano D, Ciuffreda LP, Costantino S et
al. Increased TGF-alpha as a mechanism of acquired resistance to the anti-EGFR inhibitor cetuximab through EGFR-MET interaction and activation of MET signaling in colon cancer cells. Clin Cancer Res 2013; 19(24): 6751-6765.
SupplementaryFigure1
a b
Ly6G
Ly6C
Gated on CD11b+ LP cells
WT_DSS Nlrp6-/-_DSS
3.9 3.1
3.1 2.2
FSC
CCR2
97.1 97.4
Gated on Ly6Chi LP Monocytes
WT_DSS Nlrp6-/-_DSS CCR2-/- cells
0.8
FSC
GFP
0.2
Nlrp6-/-_DSS LP + transferred GFP+ Ly6Chi monocytes
SupplementaryFigure2
a
c d
b
SupplementaryFigure3
a
b
c
Gated on CD11b+ BM cells
Bone marrow
Ly6C
CX3CR1-GFP
FSC
Ly6G
WT
CX3CR1gfp !"#
"#
Day 5 DSS
CX3CR1-GFP
FSC
"# "#
int hi "$%# "#
No transfer transfer
Lamina propria
neg &&$!#
CCR2
% o
f Max
LP cells from Ccr2-/- mice mock transferred LP cells from Ccr2-/- mice transferred with Ly6Chi donor cells (gated on CX3CR1-GFP-) LP cells from Ccr2-/- mice transferred with Ly6Chi donor cells (gated on CX3CR1-GFP+)
FSC
Isotype (IgG2a, !)
"#
CX3CR1
&'#&'#
WT_DSS Nlrp6-/-_DSS
Gated on CD11b+Ly6ChiLy6G monocytes
Lamina propria
0 102 103 104 1050
20
40
60
80
100
SupplementaryFigure4
SupplementaryFigure5
a
b
c
A B
SupplementaryFigure6
a b

Neutrophils CD3-CD11b+Ly6G+Ly6Cint Monocytes CD3-CD11b+F4/80intLy6G-Ly6Chi
105
104
103
102
0
105
104
103
102
0
105
104
103
102
0
105
104
103
102
0
Ly6C
Ly6G
Gated CD11b+ Wild type Nlrp6-/-
1.2 4.7 0.7 3.1
Lamina Propria
0.6 0.5 0.4 0.4
Wright stain sorted populations, 400x
Neutrophils Monocytes Day 0
Day 10
SupplementaryFigure7
a
b
SupplementaryFigure8
Fold 2.5 0.6
SupplementaryFigure9
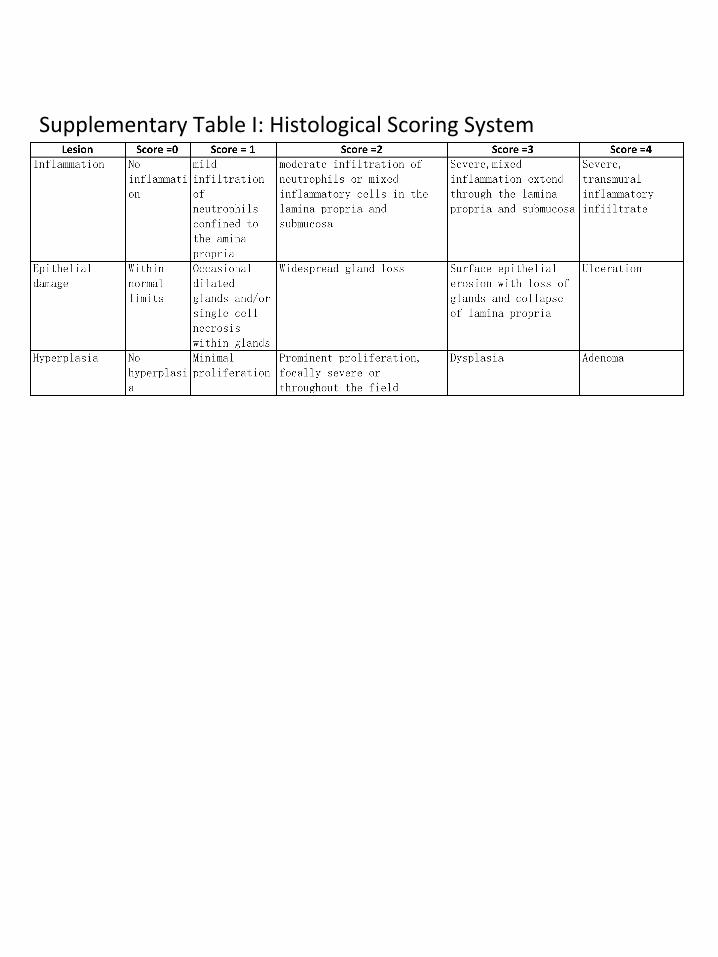
SupplementaryTableI:HistologicalScoringSystem