Embed Size (px)
Citation preview

www.sciencemag.org/content/348/6231/235/suppl/DC1
Supplementary Materials for
Common variants spanning PLK4 are associated with mitotic-origin aneuploidy in human embryos
Rajiv C. McCoy,* Zachary Demko,* Allison Ryan, Milena Banjevic, Matthew Hill, Styrmir Sigurjonsson, Matthew Rabinowitz, Hunter B. Fraser, Dmitri A. Petrov*
*Corresponding author. E-mail: [email protected] (R.C.M.); [email protected] (D.A.P.);
[email protected] (Z.D.)
Published 10 April 2015, Science 348, 235 (2015) DOI: 10.1126/science.aaa3337
This PDF file includes:
Materials and Methods Supplementary Text Figs. S1 to S5 Table S1 References (27–47)
Other Supplementary Materials for this manuscript include the following: (available at www.sciencemag.org/content/348/6231/235/suppl/DC1)
Table S2: Aneuploidy calls for blastomeres and trophectoderm biopsies Table S3: Genome-wide association study summary statistics

2
Materials and Methods
This research was reviewed by the Stanford University Research Compliance Office as part of the Human
Research Protection Program on 10/27/2014. The research was deemed to not meet the Federal definition
of human subjects research, and thus exempted from IRB review. This determination was based on the
facts that 1) the work involved no intervention or interaction with study subjects, 2) researchers did
not obtain or receive individually identifiable private information, and 3) the data or specimens were
collected for purposes other than the current research, the identifiers for the data or specimens were
replaced with a code, and the research team was prohibited from obtaining the key to the code. Natera,
Inc. also received an IRB exemption for this retrospective examination of the de-identified prenatal
genetic screening data in a review conducted by Ethical & Independent Review Services on 6/14/2013,
who determined that the work did not constitute human subjects research.
With the exception of Figures 1 A, B and 2E, all figures were generated within the R statistical
computing environment. Figure 1B was produced using eulerAPE (27), while Figure 2E was generated
with the qqman (28) package. Figures 1 C, D and Figure 3 were generated with the ggplot2 package (29).
Sampling and Genotyping
After fertilization, single cells were biopsied from separate embryos on day 3, according to the standard
protocols of each IVF clinic. Samples were then shipped overnight to the Natera laboratory for PGS. To
minimize contamination, blastomeres were sequentially washed in three drops of hypotonic buffer (5.6
mg/ml KCl, 6 mg/ml bovine serum albumin). DNA was extracted with PKB (Arcturus PicoPure Lysis
Buffer, 50 mM DTT) at 56�C for 1 hour and 95�C for 10 minutes before amplification using a modified
Multiple Displacement Amplification (MDA) kit (GE Healthcare) at 30�C for 2.5 hours then 65�C for
15 minutes. Parental DNA samples were acquired from blood draws or MasterAmp buccal tissue swabs
(Epicentre) and were extracted using the DNeasy Blood and Tissue kit (Qiagen). Parent and embryo
sample DNA was then genotyped on the Illumina HumanCytoSNP-12 BeadChip. For parent samples,
genotyping calls were performed using the standard Infinium II protocol (www.illumina.com) with
BeadStudio software.
3
Screening for Aneuploidy
Ploidy status of each chromosome of each blastomere was inferred using the Parental Support algo-
rithm, which was previously described and extensively validated by Johnson et al. (6), who demonstrated
that both false-positive and false-negative rates were not statistically different than the ‘gold standard’
method of metaphase karyotyping. Briefly, noisy genotype data from blastomeres is overcome by fo-
cusing on informative SNPs (based on parent genotypes) and combining data over large chromosomal
windows. This approach also generates confidence scores which were shown to correlate with rates of
false-detection (6). To improve detection accuracy, we masked all chromosome calls with confidence
scores <80%, as well as removing all blastomeres containing �5 low-confidence calls (779 blastomeres
did not meet this quality standard). We additionally removed the 1,734 detected cases of whole-genome
nullisomy, which are indistinguishable from artifacts of failed amplification.
Discovery Phase
In preparation for association testing, we first used KING (version 1.4) (30) to select a random set of
unrelated individuals (no individuals of first or second degree relatedness), thereby removing duplicate
samples which were otherwise common due to patients undergoing multiple cycles of IVF. We then
used PLINK (version 1.90b1g) (31) to perform a sex check, remove all SNPs with less than 95% call
rate, then remove samples with less than 95% genotyping efficiency in accordance with GWAS quality
control standards (32). As further quality control and to reduce the multiple-testing burden, we removed
SNPs with a frequency of 1% in our sample. Final quality-filtered sample sizes for mothers and fathers
used for subsequent association testing were therefore slightly different. A total of 240,990 SNPs passed
quality-control filtering and were used for genome-wide association tests of aneuploidy risk.
We first distinguished sets of blastomeres with different forms of aneuploidy under the hypothesis
that errors arising during maternal meiosis would have different underlying genetic architecture than
those of post-zygotic mitotic origin. We did not attempt to assign all cases of aneuploidy to these alter-
native error classes, but instead selected subsets of aneuploid blastomeres that could be assigned to one
or the other with high confidence.

4
In the case of maternal meiotic error, we designated as cases all maternal trisomies where homologs
from both maternal grandparents were observed at any chromosomal position in the blastomere (Fig.
1A). Such aneuploidies should be unambiguously meiotic in origin, as post-zygotic errors in the absence
of meiotic errors cannot produce this outcome (33). Most maternal meiotic errors are thought to arise
via non-disjunction, the failure of homologous chromosomes or sister chromatids to separate, resulting
in maternal chromosome loss in one daughter cell and corresponding maternal chromosome gain in the
other daughter cell (1). Because errors of meiotic origin increase with maternal age, we included age as
a covariate in this association test.
Because zygotic genome activation does not occur until the 4–8 cell stage (7), we hypothesized
that variation in maternal gene products deposited in oocytes could help explain variation in mitotic
origin aneuploidy in day 3 blastomeres. However, it is conceivable that paternal genotype could also
affect aneuploidy risk, as the centrosome, the microtubule organizing center that controls cell division, is
inherited via the sperm (34). Post-zygotic errors in mitosis are expected to affect maternal and paternal
chromosomes approximately equally. However, as previous studies have demonstrated that errors in
male meiosis are rare ( 5% abnormal sperm (8)), we conservatively identified a set of blastomeres
with putative mitotic error as those with any aneuploidy affecting the paternal copy of any chromosome.
This set of aneuploidies includes paternal monosomy, paternal trisomy, and paternal uniparental disomy,
even when these errors co-occur with other forms of aneuploidy. A large proportion of post-zygotic
errors are thought to arise via a mechanism termed anaphase lag, which refers to the delayed movement
of a chromatid toward the spindle pole (9). This can result in chromosome loss in one daughter cell
without a corresponding chromosome gain in the other daughter cell (35). Anaphase lag can occur when
microtubules emanating from multiple spindle poles attach to a single kinetochore (11). Such ‘merotelic’
attachments are more common in the presence of extra centrosomes and other centrosome abnormalities.
Supporting the accuracy of our classification scheme, no association was observed between the incidence
of putative mitotic origin aneuploidies aneuploidies and maternal age.
For both the maternal meiotic and post-zygotic error classes, we defined the response variable by
assigning all blastomeres in that aneuploid set as cases and all other blastomeres as controls for each IVF

5
cycle. We repeated this classification for all 2,362 unrelated mothers in the data set. These case-control
data were then fit in MATLAB (version 7.12.0) using a generalized linear model assuming a binomial
error distribution with a logit link function. Upon observing evidence of over-dispersion, we refit the
model without fixing the dispersion parameter at 1 (i.e., quasi-binomial). To test for any additional peaks
masked by the strongest peak, we refit the model while including genotype at rs2305957 (again encoded
as the number of alternative alleles at this locus) as a linear covariate. No additional variants achieved
genome-wide significance in this second-order analysis.
As mild genomic inflation was observed for the mitotic error association test (� = 1.059), we
adjusted all P -values using the genomic control approach (36), resulting in a corrected P -value of
5.99⇥ 10�15 for rs2305957 (the most significant genotyped SNP). This approach corrects for inflated
P -values on the basis of the distribution of test statistics obtained from putative unassociated loci (36).
In order to estimate the effect size of genotype on overall aneuploidy in units of maternal age, we fit
a line to the plot of proportion of aneuploid blastomeres versus maternal age, for maternal age �35 years
(Fig. S5), weighting the regression by the square root of the total samples per age category to account
for measurement error. We then compared the slope of this line to the difference in the proportion of
aneuploid embryos between the two homozygous maternal genotype classes at SNP rs2305957.
Robustness and Statistical Validation
To exclude population stratification as a possible source of spurious association (and potentially identify
population-specific associations), we used principal components analysis to infer ancestry of patients in
our sample. We first extracted the set of overlapping SNPs between the 11 HapMap population samples
and our sample genotypes. We re-encoded genotypes as 0, 1, or 2 to reflect the number of alternative
alleles carried by each individual at each SNP. We randomly downsampled the data to 20,000 SNPs,
then performed PCA on the HapMap populations to define the principal component axes. For each
patient in our sample, we then calculated principal component scores on these predefined axes. We
grouped patients that fell within the ranges of European or East Asian reference samples on the first
three principal components, performing the previous association test on these subsamples of 1,332 and

6
259 patients, respectively. We additionally repeated the test while using the top 10 principle components
of the genotype matrix as linear covariates, finding that this did not affect the mitotic error association.
For the validation step, which was performed using data as of March 2014, we selected all new
cases since the initial database pull in September 2013, compiling both the genotype data and generating
embryonic aneuploidy data using the Parental Support algorithm (6). We then combined the genotype
data of this new set with the genotype data of the unrelated individuals used in the discovery stage,
again using KING (30) to extract a new set of unrelated individuals. The new cases (Npatients = 34,
Nembryos = 283) were then selected from this set to ensure that duplicate or related individuals were not
present across or within the discovery and validation samples.
We used a generalized linear model to test for differences in the number of embryos contributed for
trophectoderm biopsy screening by mothers with different genotypes at the associated locus. We encoded
genotype as the number of alternative alleles at the SNP rs2305957, thereby testing for an additive effect.
As maternal age is also associated with the number of tested trophectoderm biopsies, we controlled for
this effect by including a second-order polynomial effect of maternal age, such that the model had the
form: Y = �0 + �1(Age) + �2(Age)2 + �3(Alt. allele count). The model assumed a Poisson error
distribution, modelling overdispersion by not fixing the dispersion parameter (i.e., quasi-Poisson). We
note that sampling criteria were not standardized across clinics, which likely adds noise to our test, but
should not bias the results.
Annotation
As initial genotyping was performed using the ⇠300K SNP Illumina Cyto-12 chip, genotypes were
relatively sparsely distributed throughout the genome. We therefore refined the association signal by
performing genotype imputation. We first selected the 1,332 unrelated individuals falling within the
range of the first three principal components of HapMap samples from populations of European ancestry.
Using BEAGLE (version 4.r1230) (37), we imputed untyped markers based on a European reference
panel from the 1,000 Genomes Project (14). We then repeated the association tests as before, but using
both genotyped (square plotting symbols in Fig. 2E) and imputed sample genotypes (circular plotting

7
symbols in Fig. 2E), thereby allowing us to define the extent of the associated haplotype.
We used the program SNAP (38) to identify variants in strong linkage disequilibrium with the most
significant genotyped SNP (rs2305957), then retrieved functional annotations for this list of SNPs using
SNPnexus (39). SNP effect predictions were performed using SIFT (40) and PolyPhen2 (41), but we
note that these approaches have known biases against SNPs for which the reference genome carries the
derived allele (42).
To better understand the evolutionary history of the associated locus, we evaluated the allelic state of
rs2305957 and the two coding SNPs in PLK4 (rs3811740 and rs17012739) in chimpanzee and ancient
hominin genomes aligned to the human reference genome. In each case, Neanderthal (23, 43, 44) and
Denisovan (45) individuals carried the ancestral (i.e. shared with chimpanzee) allele at the corresponding
orthologous positions.
Supplementary Text
Associations with Alternative Phenotypes
By initially limiting the phenotype to blastomeres with aneuploidies affecting paternal chromosomes,
we identified a subset of aneuploidies that are very likely to have been generated during post-zygotic
cell divisions. As previously mentioned, however, errors affecting paternal chromosomes commonly
co-occur with other forms of aneuploidy, especially in the case of paternal chromosome loss. We were
therefore interested in whether other phenotypes characteristic of post-zygotic errors, namely complex
aneuploidies involving chromosome losses, were also associated with the same genotype. Upon testing
for association with alternative phenotypes (Table S1), we found that the initial association was driven by
aneuploidies that include a paternal chromosome loss (� = 0.237, SE = 0.0285, P = 6.76⇥ 10�17),
but not those including paternal chromosome gains upon excluding co-occurring cases of chromosome
loss (� = 0.0198, SE = 0.0639, P = 0.757). Because mitotic errors are equally likely to affect ma-
ternal chromosomes, we hypothesized that the association might also be observed for these aneuploidies
despite the additional noise due to the prevalence of maternal meiotic error. As the initial association

8
was predominantly driven by chromosome losses, we restricted the phenotype to maternal chromosome
loss. Testing for an association of the rs2305957 genotype with maternal chromosome loss for 19,576
blastomeres, after removing all blastomeres with at least one paternal chromosome loss (rather than in-
cluding these as controls), showed a significant association in the same direction as the initial association
(� = 0.0783, SE = 0.0314, P = 0.0128), providing validation of the association result.

9
Figure S1: Manhattan and QQ plots depicting P-values of association tests of each genotyped SNP versus therate of aneuploidy resulting in putative maternal meiotic error (trisomies where both maternal parental homologswere determined to be present at a given genomic position). P-values are corrected using the genomic controlmethod (46). Results for association with maternal genotype are given in panels A-B, while results for associationwith paternal genotype (a control set with approximately the same ethnic composition as the set of female patients)are given in panels C-D. For the Manhattan plots (A & C), the red lines represent a standard genome-wide cut-offof 5⇥ 10�8, while the grey dotted lines represent a less stringent P-value of 1⇥ 10�6. The QQ plots (B & D)depict the distributions of P-values observed versus those expected under the null. The grey shaded regions indicateprobability bounds.
10
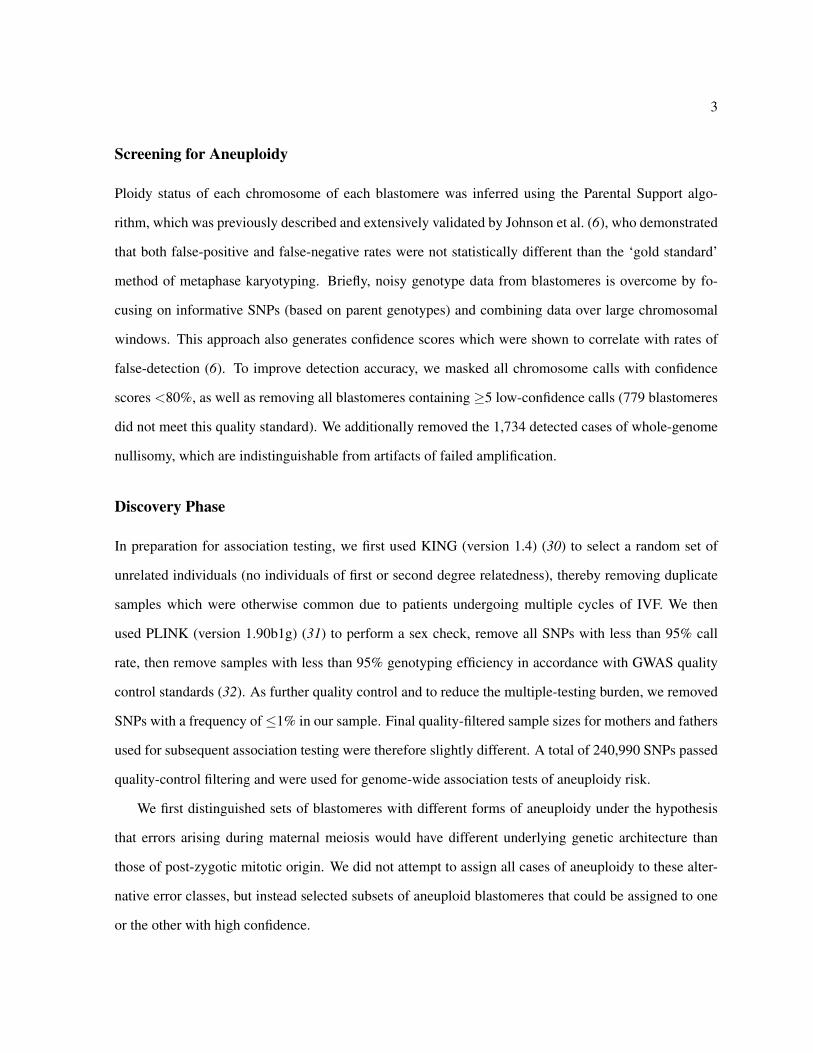
Figure S2: Frequency of alleles at SNP rs2305957 among 1000 Genomes Phase 3 populations. This figure wasgenerated using the Geography of Genetic Variants Browser v0.2 (http://www.popgen.uchicago.edu/ggv).

11
Figure S3: The first two principal components of the genotype matrix of all unrelated mothers in the sample.Principal components were first defined using the entire HapMap dataset of eleven worldwide populations (47),then client principal component scores were computed according to these predefined axes. The red and green setsof points represent mothers of East Asian and European ancestry, respectively. The ranges used to define thesesubsamples were based on the CHB, CHD, and JPT HapMap reference populations in the case of the East Asianset, and the CEU and TSI HapMap populations in the case of the European set. These ancestry-specific subsampleswere used to correct for potential population structure (Table 1, lower panel).

12
Figure S4: Logistic regression coefficient estimates (�) for association of SNP genotype at rs2305957 with ane-uploidy affecting any paternal chromosome copy (paternal monosomy, paternal trisomy, or paternal uniparentaldisomy). Cases were stratified by total number of aneuploid chromosomes (all other blastomeres are consideredas controls). This demonstrates that the previously reported association is mostly driven by complex aneuploidiesaffecting � 4 chromosomes.
0.0
0.2
0.4
0 5 10 15 20Aneuploid chromosomes
Coe
ffici
ent (
± S
E)

13
Figure S5: The proportion of aneuploid blastomeres, stratified by maternal age. Beginning at age 35, the propor-tion of aneuploid blastomeres increases approximately linearly, with a 3.4% increase in the rate of aneuploidy peryear. The difference in rates of aneuploidy between the two respective homozygous genotype classes at rs2305957is therefore equivalent to the average effect of ⇠1.8 years of age during this timespan. Error bars indicate standarderrors of the proportions.
20 25 30 35 40 45
0.4
0.6
0.8
1.0
Maternal age
Pro
p. a
neup
loid
bla
stom
eres
y = 0.0340 * x - 0.608

14Ta
ble
S1:A
ssoc
iatio
nof
SNP
rs23
0595
7w
ithal
tern
ativ
ean
eupl
oid
phen
otyp
es.T
heSN
Pw
asor
igin
ally
iden
tified
via
itsas
soci
atio
nw
ithan
eupl
oi-
dies
affe
ctin
gpa
tern
alch
rom
osom
eco
pies
(Tab
le1)
.By
test
ing
asso
ciat
ion
with
diff
eren
tcla
sses
ofan
eupl
oidy
,we
refin
eth
eth
eso
urce
ofth
esi
gnal
,w
hich
ispr
imar
ilydr
iven
byco
mpl
exan
eupl
oidi
esw
ithco
-occ
urrin
gm
ater
nala
ndpa
tern
alch
rom
osom
elo
sses
asw
ella
snu
lliso
mie
s.B
last
omer
esm
eetin
gth
eex
clus
ion
crite
riaw
ere
nott
reat
edas
case
sor
cont
rols
,but
mas
ked
from
the
data
set.
Fora
neup
loid
clas
ses
that
incl
ude
erro
rsof
mei
otic
orig
in,w
ein
clud
eda
quad
ratic
term
toco
ntro
lfor
the
effe
ctof
mat
erna
lage
.
Phen
otyp
eM
odel
�SE
OR
(95%
CI)
P
Any
aneu
ploi
dylogit(Y
)=
�0+
�1(A
ge)
+�2(A
ge)
2+
�3(A
lt.allelecount)
+✏
0.139
0.0271
1.14
9(1
.090
–1.2
12)
3.05⇥
10�7
Min
oran
eupl
oidy
(1–2
chro
ms.
affe
cted
)logit(Y
)=
�0+
�1(A
ge)
+�2(A
ge)
2+
�3(A
lt.allelecount)
+✏
0.0431
0.0303
1.04
4(0
.984
–1.1
08)
0.15
4ex
clud
e�
3ch
rom
osom
esaf
fect
ed
Com
plex
aneu
ploi
dy(�
3ch
rom
s.af
fect
ed)
logit(Y
)=
�0+
�1(A
ge)
+�2(A
ge)
2+
�3(A
lt.allelecount)
+✏
0.234
0.0329
1.26
3(1
.184
–1.3
47)
1.72⇥
10�12
excl
ude
1–2
chro
mos
omes
affe
cted
Pate
rnal
chro
mos
ome
gain
logit(Y
)=
�0+
�1(A
lt.allelecount)
+✏
0.0946
0.0398
1.09
9(1
.017
–1.1
88)
0.01
76
Pate
rnal
chro
mos
ome
gain
logit(Y
)=
�0+
�1(A
lt.allelecount)
+✏
0.0198
0.0639
1.02
0(0
.900
–1.1
56)
0.75
7ex
clud
ech
rom
osom
elo
ss
Mat
erna
lchr
omos
ome
gain
logit(Y
)=
�0+
�1(A
ge)
+�2(A
ge)
2+
�3(A
lt.allelecount)
+✏
0.0271
0.0306
1.02
7(0
.968
–1.0
91)
0.37
5
Pate
rnal
chro
mos
ome
loss
logit(Y
)=
�0+
�1(A
lt.allelecount)
+✏
0.237
0.0285
1.26
7(1
.199
–1.3
40)
6.76⇥
10�17
Pate
rnal
chro
mos
ome
loss
;logit(Y
)=
�0+
�1(A
lt.allelecount)
+✏
0.195
0.0414
1.21
5(1
.120
–1.3
17)
2.69⇥
10�6
excl
ude
mat
erna
lchr
omos
ome
loss
Mat
erna
lchr
omos
ome
loss
logit(Y
)=
�0+
�1(A
ge)
+�2(A
ge)
2+
�3(A
lt.allelecount)
+✏
0.141
0.0261
1.15
2(1
.094
–1.2
12)
6.71⇥
10�8
Mat
erna
lchr
omos
ome
loss
;logit(Y
)=
�0+
�1(A
ge)
+�2(A
ge)
2+
�3(A
lt.allelecount)
+✏
0.0783
0.0314
1.08
1(1
.017
–1.1
50)
0.01
28ex
clud
epa
tern
alch
rom
osom
elo
ss
Nul
lisom
ylogit(Y
)=
�0+
�1(A
ge)
+�2(A
ge)
2+
�3(A
lt.allelecount)
+✏
0.269
0.0374
1.30
9(1
.216
–1.4
08)
8.42⇥
10�13
Nul
lisom
y;ex
clud
em
onos
omie
slogit(Y
)=
�0+
�1(A
ge)
+�2(A
ge)
2+
�3(A
lt.allelecount)
+✏
0.00757
0.101
1.00
8(0
.826
–1.2
29)
0.94
0
Pate
rnal
&m
ater
nalc
hrom
osom
elo
sslogit(Y
)=
�0+
�1(A
ge)
+�2(A
ge)
2+
�3(A
lt.allelecount)
+✏
0.258
0.0357
1.29
4(1
.207
–1.3
88)
7.36⇥
10�13
Nul
lisom
y&
pate
rnal
chro
mos
ome
loss
logit(Y
)=
�0+
�1(A
ge)
+�2(A
ge)
2+
�3(A
lt.allelecount)
+✏
0.312
0.0417
1.36
6(1
.259
–1.4
83)
1.06⇥
10�13
&m
ater
nalc
hrom
osom
elo
ss

REFERENCES AND NOTES 1. T. Hassold, P. Hunt, To err (meiotically) is human: The genesis of human aneuploidy.
Nat. Rev. Genet. 2, 280–291 (2001). Medline doi:10.1038/35066065
2. L. Voullaire, H. Slater, R. Williamson, L. Wilton, Chromosome analysis of blastomeres from human embryos by using comparative genomic hybridization. Hum. Genet. 106, 210–217 (2000). Medline doi:10.1007/s004390051030
3. D. Wells, J. D. Delhanty, Comprehensive chromosomal analysis of human preimplantation embryos using whole genome amplification and single cell comparative genomic hybridization. Mol. Hum. Reprod. 6, 1055–1062 (2000). Medline doi:10.1093/molehr/6.11.1055
4. J. D. Delhanty, J. C. Harper, A. Ao, A. H. Handyside, R. M. Winston, Multicolour FISH detects frequent chromosomal mosaicism and chaotic division in normal preimplantation embryos from fertile patients. Hum. Genet. 99, 755–760 (1997). Medline doi:10.1007/s004390050443
5. Materials and methods are available as supplementary materials on Science Online.
6. D. S. Johnson, G. Gemelos, J. Baner, A. Ryan, C. Cinnioglu, M. Banjevic, R. Ross, M. Alper, B. Barrett, J. Frederick, D. Potter, B. Behr, M. Rabinowitz, Preclinical validation of a microarray method for full molecular karyotyping of blastomeres in a 24-h protocol. Hum. Reprod. 25, 1066–1075 (2010). Medline doi:10.1093/humrep/dep452
7. W. Tadros, H. D. Lipshitz, The maternal-to-zygotic transition: A play in two acts. Development 136, 3033–3042 (2009). Medline doi:10.1242/dev.033183
8. C. Templado, F. Vidal, A. Estop, Aneuploidy in human spermatozoa. Cytogenet. Genome Res. 133, 91–99 (2011). Medline doi:10.1159/000323795
9. E. Coonen, J. G. Derhaag, J. C. Dumoulin, L. C. van Wissen, M. Bras, M. Janssen, J. L. Evers, J. P. Geraedts, Anaphase lagging mainly explains chromosomal mosaicism in human preimplantation embryos. Hum. Reprod. 19, 316–324 (2004). Medline doi:10.1093/humrep/deh077
10. D. D. Daphnis, J. D. Delhanty, S. Jerkovic, J. Geyer, I. Craft, J. C. Harper, Detailed FISH analysis of day 5 human embryos reveals the mechanisms leading to mosaic aneuploidy. Hum. Reprod. 20, 129–137 (2005). Medline doi:10.1093/humrep/deh554
11. J. Gregan, S. Polakova, L. Zhang, I. M. Tolić-Nørrelykke, D. Cimini, Merotelic kinetochore attachment: Causes and effects. Trends Cell Biol. 21, 374–381 (2011). Medline doi:10.1016/j.tcb.2011.01.003
12. N. J. Ganem, S. A. Godinho, D. Pellman, A mechanism linking extra centrosomes to chromosomal instability. Nature 460, 278–282 (2009). Medline doi:10.1038/nature08136

13. A. J. Holland, D. W. Cleveland, Boveri revisited: Chromosomal instability, aneuploidy and tumorigenesis. Nat. Rev. Mol. Cell Biol. 10, 478–487 (2009). Medline doi:10.1038/nrm2718
14. G. R. Abecasis, D. Altshuler, A. Auton, L. D. Brooks, R. M. Durbin, R. A. Gibbs, M. E. Hurles, G. A. McVean; 1000 Genomes Project Consortium, A map of human genome variation from population-scale sequencing. Nature 467, 1061–1073 (2010). Medline
15. M. Vega, A. Breborowicz, E. L. Moshier, P. G. McGovern, M. D. Keltz, Blastulation rates decline in a linear fashion from euploid to aneuploid embryos with single versus multiple chromosomal errors. Fertil. Steril. 102, 394–398 (2014). Medline doi:10.1016/j.fertnstert.2014.04.026
16. R. Habedanck, Y.-D. Stierhof, C. J. Wilkinson, E. A. Nigg, The Polo kinase Plk4 functions in centriole duplication. Nat. Cell Biol. 7, 1140–1146 (2005). Medline doi:10.1038/ncb1320
17. M. Bettencourt-Dias, A. Rodrigues-Martins, L. Carpenter, M. Riparbelli, L. Lehmann, M. K. Gatt, N. Carmo, F. Balloux, G. Callaini, D. M. Glover, SAK/PLK4 is required for centriole duplication and flagella development. Curr. Biol. 15, 2199–2207 (2005). Medline doi:10.1016/j.cub.2005.11.042
18. P. A. Coelho, L. Bury, B. Sharif, M. G. Riparbelli, J. Fu, G. Callaini, D. M. Glover, M. Zernicka-Goetz, Spindle formation in the mouse embryo requires Plk4 in the absence of centrioles. Dev. Cell 27, 586–597 (2013). Medline doi:10.1016/j.devcel.2013.09.029
19. E. N. Fırat-Karalar, T. Stearns, The centriole duplication cycle. Philos. Trans. R. Soc. London Ser. B 369, 20130460 (2014). Medline doi:10.1098/rstb.2013.0460
20. M. A. Ko, C. O. Rosario, J. W. Hudson, S. Kulkarni, A. Pollett, J. W. Dennis, C. J. Swallow, Plk4 haploinsufficiency causes mitotic infidelity and carcinogenesis. Nat. Genet. 37, 883–888 (2005). Medline doi:10.1038/ng1605
21. C. O. Rosario, M. A. Ko, Y. Z. Haffani, R. A. Gladdy, J. Paderova, A. Pollett, J. A. Squire, J. W. Dennis, C. J. Swallow, Plk4 is required for cytokinesis and maintenance of chromosomal stability. Proc. Natl. Acad. Sci. U.S.A. 107, 6888–6893 (2010). Medline doi:10.1073/pnas.0910941107
22. J. E. Sillibourne, M. Bornens, Polo-like kinase 4: The odd one out of the family. Cell Div. 5, 25 (2010). Medline doi:10.1186/1747-1028-5-25
23. R. E. Green, J. Krause, A. W. Briggs, T. Maricic, U. Stenzel, M. Kircher, N. Patterson, H. Li, W. Zhai, M. H. Fritz, N. F. Hansen, E. Y. Durand, A. S. Malaspinas, J. D. Jensen, T. Marques-Bonet, C. Alkan, K. Prüfer, M. Meyer, H. A. Burbano, J. M. Good, R. Schultz, A. Aximu-Petri, A. Butthof, B. Höber, B. Höffner, M. Siegemund, A. Weihmann, C. Nusbaum, E. S. Lander, C. Russ, N. Novod, J. Affourtit, M. Egholm, C. Verna, P. Rudan, D. Brajkovic, Z. Kucan, I. Gusic, V. B. Doronichev, L. V. Golovanova, C. Lalueza-Fox, M. de la Rasilla, J. Fortea, A. Rosas, R. W. Schmitz, P. L. Johnson, E. E. Eichler, D. Falush, E. Birney, J. C. Mullikin, M. Slatkin, R. Nielsen, J. Kelso, M. Lachmann, D. Reich,

S. Pääbo, A draft sequence of the Neandertal genome. Science 328, 710–722 (2010). Medline doi:10.1126/science.1188021
24. R. D. Alexander, K. M. Noonan, in Evolutionary Biology and Human Social Organization, N. A. Chagnon, W. G. Irons, Eds. (Duxbury Press, North Scituate, MA, 1979), pp. 436–453.
25. R. T. Scott Jr., K. M. Upham, E. J. Forman, K. H. Hong, K. L. Scott, D. Taylor, X. Tao, N. R. Treff, Blastocyst biopsy with comprehensive chromosome screening and fresh embryo transfer significantly increases in vitro fertilization implantation and delivery rates: A randomized controlled trial. Fertil. Steril. 100, 697–703 (2013). Medline doi:10.1016/j.fertnstert.2013.04.035
26. A. J. Wilcox, C. R. Weinberg, J. F. O’Connor, D. D. Baird, J. P. Schlatterer, R. E. Canfield, E. G. Armstrong, B. C. Nisula, Incidence of early loss of pregnancy. N. Engl. J. Med. 319, 189–194 (1988). Medline doi:10.1056/NEJM198807283190401
27. L. Micallef, P. Rodgers, eulerAPE: Drawing area-proportional 3-Venn diagrams using ellipses. PLOS ONE 9, e101717 (2014). Medline doi:10.1371/journal.pone.0101717
28. S. D. Turner, qqman: an R package for visualizing GWAS results using Q-Q and manhattan plots. bioRxiv, available at http://biorxiv.org/content/early/2014/05/14/005165.
29. H. Wickham, ggplot2: Elegant Graphics for Data Analysis (Springer, New York, 2009).
30. A. Manichaikul, J. C. Mychaleckyj, S. S. Rich, K. Daly, M. Sale, W. M. Chen, Robust relationship inference in genome-wide association studies. Bioinformatics 26, 2867–2873 (2010). Medline doi:10.1093/bioinformatics/btq559
31. S. Purcell, B. Neale, K. Todd-Brown, L. Thomas, M. A. Ferreira, D. Bender, J. Maller, P. Sklar, P. I. de Bakker, M. J. Daly, P. C. Sham, PLINK: A tool set for whole-genome association and population-based linkage analyses. Am. J. Hum. Genet. 81, 559–575 (2007). Medline doi:10.1086/519795
32. S. Turner, L. L. Armstrong, Y. Bradford, C. S. Carlson, D. C. Crawford, A. T. Crenshaw, M. de Andrade, K. F. Doheny, J. L. Haines, G. Hayes, G. Jarvik, L. Jiang, I. J. Kullo, R. Li, H. Ling, T. A. Manolio, M. Matsumoto, C. A. McCarty, A. N. McDavid, D. B. Mirel, J. E. Paschall, E. W. Pugh, L. V. Rasmussen, R. A. Wilke, R. L. Zuvich, M. D. Ritchie, Quality control procedures for genome-wide association studies. Curr. Protoc. Hum. Genet. 68, 1–19 (2011). Medline
33. M. Rabinowitz, A. Ryan, G. Gemelos, M. Hill, J. Baner, C. Cinnioglu, M. Banjevic, D. Potter, D. A. Petrov, Z. Demko, Origins and rates of aneuploidy in human blastomeres. Fertil. Steril. 97, 395–401 (2012). Medline doi:10.1016/j.fertnstert.2011.11.034
34. C. Simerly, G. J. Wu, S. Zoran, T. Ord, R. Rawlins, J. Jones, C. Navara, M. Gerrity, J. Rinehart, Z. Binor, R. Asch, G. Schatten, The paternal inheritance of the centrosome, the cell’s microtubule-organizing center, in humans, and the

implications for infertility. Nat. Med. 1, 47–52 (1995). Medline doi:10.1038/nm0195-47
35. E. Mantikou, K. M. Wong, S. Repping, S. Mastenbroek, Molecular origin of mitotic aneuploidies in preimplantation embryos. Biochim. Biophys. Acta 1822, 1921–1930 (2012). Medline doi:10.1016/j.bbadis.2012.06.013
36. B. Devlin, K. Roeder, Genomic control for association studies. Biometrics 55, 997–1004 (1999). Medline doi:10.1111/j.0006-341X.1999.00997.x
37. B. N. Howie, P. Donnelly, J. Marchini, A flexible and accurate genotype imputation method for the next generation of genome-wide association studies. PLOS Genet. 5, e1000529 (2009). Medline doi:10.1371/journal.pgen.1000529
38. A. D. Johnson, R. E. Handsaker, S. L. Pulit, M. M. Nizzari, C. J. O’Donnell, P. I. de Bakker, SNAP: A web-based tool for identification and annotation of proxy SNPs using HapMap. Bioinformatics 24, 2938–2939 (2008). Medline doi:10.1093/bioinformatics/btn564
39. C. Chelala, A. Khan, N. R. Lemoine, SNPnexus: A web database for functional annotation of newly discovered and public domain single nucleotide polymorphisms. Bioinformatics 25, 655–661 (2009). Medline doi:10.1093/bioinformatics/btn653
40. P. Kumar, S. Henikoff, P. C. Ng, Predicting the effects of coding non-synonymous variants on protein function using the SIFT algorithm. Nat. Protoc. 4, 1073–1081 (2009). Medline doi:10.1038/nprot.2009.86
41. I. A. Adzhubei, S. Schmidt, L. Peshkin, V. E. Ramensky, A. Gerasimova, P. Bork, A. S. Kondrashov, S. R. Sunyaev, A method and server for predicting damaging missense mutations. Nat. Methods 7, 248–249 (2010). Medline doi:10.1038/nmeth0410-248
42. Y. B. Simons, M. C. Turchin, J. K. Pritchard, G. Sella, The deleterious mutation load is insensitive to recent population history. Nat. Genet. 46, 220–224 (2014). Medline doi:10.1038/ng.2896
43. S. Castellano, G. Parra, F. A. Sánchez-Quinto, F. Racimo, M. Kuhlwilm, M. Kircher, S. Sawyer, Q. Fu, A. Heinze, B. Nickel, J. Dabney, M. Siebauer, L. White, H. A. Burbano, G. Renaud, U. Stenzel, C. Lalueza-Fox, M. de la Rasilla, A. Rosas, P. Rudan, D. Brajković, Ž. Kucan, I. Gušic, M. V. Shunkov, A. P. Derevianko, B. Viola, M. Meyer, J. Kelso, A. M. Andrés, S. Pääbo, Patterns of coding variation in the complete exomes of three Neandertals. Proc. Natl. Acad. Sci. U.S.A. 111, 6666–6671 (2014). Medline doi:10.1073/pnas.1405138111
44. K. Prüfer, F. Racimo, N. Patterson, F. Jay, S. Sankararaman, S. Sawyer, A. Heinze, G. Renaud, P. H. Sudmant, C. de Filippo, H. Li, S. Mallick, M. Dannemann, Q. Fu, M. Kircher, M. Kuhlwilm, M. Lachmann, M. Meyer, M. Ongyerth, M. Siebauer, C. Theunert, A. Tandon, P. Moorjani, J. Pickrell, J. C. Mullikin, S. H. Vohr, R. E. Green, I. Hellmann, P. L. Johnson, H. Blanche, H. Cann, J. O. Kitzman, J. Shendure, E. E. Eichler, E. S. Lein, T. E. Bakken, L. V. Golovanova, V. B. Doronichev, M. V. Shunkov, A. P. Derevianko, B. Viola, M. Slatkin, D.

Reich, J. Kelso, S. Pääbo, The complete genome sequence of a Neanderthal from the Altai Mountains. Nature 505, 43–49 (2014). Medline
45. M. Meyer, M. Kircher, M. T. Gansauge, H. Li, F. Racimo, S. Mallick, J. G. Schraiber, F. Jay, K. Prüfer, C. de Filippo, P. H. Sudmant, C. Alkan, Q. Fu, R. Do, N. Rohland, A. Tandon, M. Siebauer, R. E. Green, K. Bryc, A. W. Briggs, U. Stenzel, J. Dabney, J. Shendure, J. Kitzman, M. F. Hammer, M. V. Shunkov, A. P. Derevianko, N. Patterson, A. M. Andrés, E. E. Eichler, M. Slatkin, D. Reich, J. Kelso, S. Pääbo, A high-coverage genome sequence from an archaic Denisovan individual. Science 338, 222–226 (2012). Medline
46. B. Devlin, K. Roeder, L. Wasserman, Genomic control, a new approach to genetic-based association studies. Theor. Popul. Biol. 60, 155–166 (2001). Medline doi:10.1006/tpbi.2001.1542
47. D. M. Altshuler, R. A. Gibbs, L. Peltonen, D. M. Altshuler, R. A. Gibbs, L. Peltonen, E. Dermitzakis, S. F. Schaffner, F. Yu, L. Peltonen, E. Dermitzakis, P. E. Bonnen, D. M. Altshuler, R. A. Gibbs, P. I. de Bakker, P. Deloukas, S. B. Gabriel, R. Gwilliam, S. Hunt, M. Inouye, X. Jia, A. Palotie, M. Parkin, P. Whittaker, F. Yu, K. Chang, A. Hawes, L. R. Lewis, Y. Ren, D. Wheeler, R. A. Gibbs, D. M. Muzny, C. Barnes, K. Darvishi, M. Hurles, J. M. Korn, K. Kristiansson, C. Lee, S. A. McCarrol, J. Nemesh, E. Dermitzakis, A. Keinan, S. B. Montgomery, S. Pollack, A. L. Price, N. Soranzo, P. E. Bonnen, R. A. Gibbs, C. Gonzaga-Jauregui, A. Keinan, A. L. Price, F. Yu, V. Anttila, W. Brodeur, M. J. Daly, S. Leslie, G. McVean, L. Moutsianas, H. Nguyen, S. F. Schaffner, Q. Zhang, M. J. Ghori, R. McGinnis, W. McLaren, S. Pollack, A. L. Price, S. F. Schaffner, F. Takeuchi, S. R. Grossman, I. Shlyakhter, E. B. Hostetter, P. C. Sabeti, C. A. Adebamowo, M. W. Foster, D. R. Gordon, J. Licinio, M. C. Manca, P. A. Marshall, I. Matsuda, D. Ngare, V. O. Wang, D. Reddy, C. N. Rotimi, C. D. Royal, R. R. Sharp, C. Zeng, L. D. Brooks, J. E. McEwen; International HapMap 3 Consortium, Integrating common and rare genetic variation in diverse human populations. Nature 467, 52–58 (2010). Medline doi:10.1038/nature09298