Embed Size (px)
Citation preview
www.sciencetranslationalmedicine.org/cgi/content/full/7/289/289ra86/DC1
Supplementary Materials for
SLC7A11 expression is associated with seizures and predicts poor
survival in patients with malignant glioma
Stephanie M. Robert, Susan C. Buckingham, Susan L. Campbell, Stefanie Robel,
Kenneth T. Holt, Toyin Ogunrinu-Babarinde, Paula P. Warren, David M. White,
Meredith A. Reid, Jenny M. Eschbacher, Michael E. Berens, Adrienne C. Lahti,
Louis B. Nabors, Harald Sontheimer*
*Corresponding author. E-mail: [email protected]
Published 27 May 2015, Sci. Transl. Med. 7, 289ra86 (2015)
DOI: 10.1126/scitranslmed.aaa8103
This PDF file includes:
Materials and Methods
Fig. S1. SLC7A11 expression is increased in the tumor edge.
Fig. S2. SLC7A11 expression is stable in the PDX-GBM xenoline glioma model.
Fig. S3. Medium from SXC-expressing gliospheres causes intracellular Ca2+
increases in neurons.
Fig. S4. SXC-mediated glutamate release causes neuronal death by glutamate
receptor overstimulation.
Fig. S5. SXC-expressing tumors induce peritumoral neuronal cell loss.
Fig. S6. Contralateral brain has abundant NeuN+ neurons and GFAP+ astrocytes.
Fig. S7. Intracranially injected astrocytes do not cause neuronal cell loss or
change in SXC expression of surrounding tissue.
Fig. S8. SXC-expressing gliomas proliferate faster and are more invasive.
Fig. S9. SXC-expressing gliomas demonstrate an invasive phenotype.
Fig. S10. Peritumoral neurons have similar action potential thresholds to neurons
in sham-injected control cortex.
Fig. S11. SXC is variably expressed in different grades of glioma.
Fig. S12. MRS detection of glutamate is reproducible and shows rebound peak
after SAS administration.
Fig. S13. EEG traces from glioma patients show abnormal activity.
Table S1. Demographic and clinical data for patients in MRS clinical trial.
Legend for movie S1
References (57–61)

Other Supplementary Material for this manuscript includes the following:
(available at www.sciencetranslationalmedicine.org/cgi/content/full/7/289/289ra86/DC1)
Table S2 (Microsoft Excel format). Original data and exact P values.
Movie S1 (.mp4 format). Seizures induced by SXC-expressing tumors are
apparent on video monitoring.
Drugs
All chemicals and drugs were obtained from Sigma Aldrich unless otherwise specified. (S)-4-carboxyphenylglycine ((S)-4-CPG) was obtained from Tocris Bioscience. Drugs were used at the following concentrations: (S)-4-CPG (0.5 mM), sulfasalazine (0.5 mM), MK-801 (1 µM CoCulture; 10 µM Ca2+ imaging), CNQX (10 µM).
Animals
All animal procedures were approved and performed in accordance with the ethical guidelines set by the UAB Institutional Animal Care and Use Committee (IACUC). Mice were maintained in groups of 5 in a specific pathogen-free (SPF) barrier facility in 12 h light/dark cycles. Male C.B.17 scid mice 8-12 wks old were used for intracranial tumor implantation. Male athymic nude mice aged 6-8 wks were used for flank injections for maintenance and propagation of the PDX-GBM xenografts. The UAB Brain Tumor Tissue Core Facility initially provided human xenoline tissue with approval of the UAB IACUC (APN #100908862).
Maintenance and preparation of patient-derived xenograft tumors
As previously described (23), primary glioma tissue was maintained by serial passage in mouse flanks. 14-18 d after injection, tumors were harvested and mechanically dissociated. Cells were passed through a 40 µm filter and maintained in short-term culture (< 3 wks) as “gliospheres” in Neurobasal-A-medium, supplemented with 10 mg/ml FGF, 10 mg/ml EGF, 260 mM L-glutamine, 2% B-27 Supplement w/o Vitamin A (Invitrogen), 250 µM/ml amphotericin, and 50mg/ml gentamycin (Fisher), and incubated in 10% CO2 at 37°C. Medium was changed daily for 2 d, then weekly. Gliospheres were maintained in vitro for 5-7 d before intracranial injection. For in vitro experiments, cells were dissociated with Accutase (Sigma-Aldrich), counted, and plated. For monolayer culture experiments, dissociated cells were maintained for 1-2 d in DMEM-F12 medium (Invitrogen), supplemented with 7% fetal bovine serum (Hyclone).
Maintenance and preparation of cortical neurons
Cortical neurons were harvested from E18 Sprague Dawley rats from timed-pregnant females. Cortical neurons were harvested, plated on glass coverslips coated with poly-l-lysine, and cultured in Neurobasal medium (Invitrogen) with 2% B-27 Supplement (Invitrogen), 2.5 µl/ml L-glutamine (Invitrogen), 1% Penicillin (Invitrogen), and 1% Streptomycin (Invitrogen) for 7-10 d before use.
Western Blot
Western blotting was performed as previously described (50) with modifications. 15 µg of protein/sample was run on a 4-20% gradient precast SDS-polyacrylamide gel (Bio-Rad), then placed in blocking buffer (10% nonfat dried milk, Tris-buffered saline, and 0.1% Tween-20 (TBS-T) for 1 h at RT. Blots were incubated with primary antibodies [goat anti-SLC7A11 (1:1000; Abcam; ab60171), rabbit anti-CD98 (1:200; Santa Cruz Biotechnology; catalog # sc-9160), mouse anti-glyceraldehyde-3-phosphate dehydrogenase (1:5000; Abcam; catalog # ab8245)] in blocking buffer overnight at 4°C, washed in TBS-T, and incubated with secondary antibodies [rabbit anti-goat (catalog # sc-2922), goat anti-rabbit (catalog # sc-2054), and goat anti-mouse (catalog # sc-2055); 1:1500; Santa Cruz Biotechnology]. Blots were developed using Supersignal West Fempto (Thermo Scientific) or Luminol Reagent (Santa Cruz Biotechnology)
and imaged on an Eastman Kodak Image Station 4000MM. SLC7A11 immunoreactivity was normalized to GAPDH. Each Western blot was repeated at least 3 times.
Immunocytochemistry
Single cells from dissociated gliospheres were grown 2-3 d on glass coverslips, and immunocytochemistry was performed as previously described (50). Cells were washed, fixed 10 min in 4% PFA, blocked 30 min at RT in PBS containing 10% normal donkey serum and 0.3% Triton X-100, and incubated in primary goat anti-SLC7A11 antibody (1:250; Abcam; catalog # ab60171)] overnight at 4°C. Cells were then incubated with secondary antibody [donkey anti-goat, Alexa Fluor 546 (1:500; Invitrogen; catalog # A11056), or Phalloidin, Alexa Fluor 488 (1:50; Invitrogen; catalog # A123793000)] for 120 min at RT, washed and mounted on glass slides (Fisher Scientific) using Fluoromount (Sigma), then viewed on an Olympus Fluoview FV1000 laser-scanning microscope (Olympus), equipped with 4 diode lasers (405, 473, 559, 635 nm).
Immunohistochemistry
For chromogenic and H&E staining, 15 µm fixed paraffin-embedded brain sections were mounted on glass slides and dried overnight at 55°C. Tissue was deparaffinized using Citrisolv (Fisher) 15 min, isopropanol 3 x 5min, and diH2O. For chromogenic staining, slides were steamed in citrate buffer (1.8 mM citric acid, 8.2 mM sodium citrate) 20 min, then rinsed in diH2O and PBS. Tissues were quenched 10 min in 3% H2O2 10 and rinsed. Slides were incubated in 5% donkey serum, with 0.3% Triton X-100 for 30 min at RT, then incubated in primary antibody [goat anti-SLC7A11 (3.75 µg/ml; Abcam; catalog # ab111822)] overnight at 4°C in a humidity chamber. Slides were washed and incubated with secondary antibody [donkey anti-goat (1:400; Jackson ImmunoResearch; catalog # 705035003)] for 1 h at RT, washed again before incubating for 10 min in biotin tyramide (1:400; PerkinElmer Life Sciences; catalog # PC0152-0197) followed by 30 min in Avidin-Biotin Complex mixture (Vector Laboratories; catalog # PK-6100), then 2x5 min in diH2O. Slides were covered with dilute 3,3’Diaminobenzidine (DAB)-metal concentrate (1:10; Vector; catalog # SK-4105) for 5-7 min, then immediately washed in diH2O, counterstained with hematoxylin, and cover-slipped using Cytoseal60 (Fisher). For patient biopsy tissue, 3 tissue slides from each patient were stained, and 3 ROI were randomly imaged using a light microscope with a color camera. All images were analyzed for SLC7A11 staining and quantified as previously described (57) using ImageJ and normalized to total tissue area.
For H&E staining, deparaffinized slides were washed in Citrisolv (Fisher), denatured using ethanol (100%/95%), washed in diH2O, placed in hematoxylin for 2 min and washed in diH2O. Slides were rinsed in HCl and ammonia H2O, washed in diH2O, and placed into eosin solution for 30 s. Slides were rehydrated in 95% followed by 100% ethanol for 2 min each. Finally, slides were exposed to xylene for 2x2 min and cover-slipped with Cytoseal60.
Electron Microscopy
Tumor-implanted animals were perfused with PBS followed by 2.5% glutaraldehyde with 4% PFA in 0.1 M sodium cacodylate (Caco) buffer, pH 7.4. The brain was removed and sectioned into 500 µM slices. Tissue punches of tumor and non-tumor areas were fixed overnight at 4°C, then washed in 0.1M Caco buffer, pH 7.4, followed by immersion in 1% osmium diluted in 0.1M Caco buffer, pH 7.4, for 50 min at RT while rotating in the dark. Punches were then washed 4 X
in 0.2M Caco buffer, pH 7.4, and dehydrated in 50%, 80%, and 95% acetone for 5 min each before washing in 100% acetone. Punches were equilibrated for embedding in a solution containing equal parts of 100% acetone and Epon 812-containing accelerator while rotating ON at RT. Punches were then embedded in 100% Epon 812-containing accelerator at 60-70°C ON. A Tecnai T12 120kV Transmission Electron Microscope (FEI) was used to image ultrathin-cut sections.
Proliferation
Proliferation was measured as previously described (12), with modifications. Briefly, after dissociation with Accutase, 1x10⁵ cells were counted and maintained in 12-well plates, as spheres in Neurobasal-A-medium, as described above. Cell numbers were determined using a Coulter-Counter Cell Sizer (Beckman-Coulter) on Days 0, 2, and 3. Each individual experiment was repeated 3 separate times per condition, and each included 3 technical replicates.
Calcium Imaging
Cortical neurons were loaded with the Ca2+-sensitive dye Fura-2 acetoxymethyl ester Leakage Resistan (Teflabs) using 20% w/v pluronic acid in DMSO (Invitrogen) for 30 min at 37°C in neurobasal medium, then washed twice and allowed to recover for 30 min at 37°C. Coverslips were mounted in an imaging/perfusion chamber. Glioma-conditioned medium, was bath applied with or without inhibitors to 2.0 x 10⁶ gliospheres incubated for 24 h in 10 ml medium. Neurons were imaged with a CoolSNAP HQ2CCD camera (Photometics) mounted on a Carl Zeiss Axiovert 200 inverted microscope. Imaging Workbench (INDEC BioSystems) with 2x2 binning was used for imaging and analysis.
Glutamate Uptake
For glutamate uptake, buffer containing (in mM): 125 choline chloride, 1.75 KCl, 2.0 CaCl2, 1.25 KH2PO4, 23 triethylammonium bicarbonate, 10 glucose, 1.0 MgSO4, was warmed to 37°C and saturated with 5% CO2/ 95% O2. Cells were washed, then incubated in buffer for 5 min at 37°C. Buffer containing 2 µCi/ml 3H-glutamate and 100 µM glutamate was added for 5 min. Cells were washed twice in ice-cold PBS, then lysed with 0.3 N NaOH at 37°C for 30 min. 3H activity was measured using a liquid scintillation counter (Beckman Instruments).
Co-culture
Co-culture experiments were done as previously described (33), with modification. Dissociated gliospheres on 0.4 µm-pore transwell filters were added to wells containing cortical neurons plated as a monolayer. 48 h later, filters were removed, and neurons were stained with 1 µM calcein AM and 2 µM ethidium homodimer (EthD-1), and quantified using a Live/Dead kit (Molecular Probes) per manufacturer’s directions, as previously described (58). A Leica fluorescence microscope was used and 2 coverslips/condition were imaged for each experiment. 5 regions of interest (ROI) were randomly chosen per coverslip. Live neurons, identified as cells with green fluorescence, were quantified. Investigator was blinded to identity of images until analysis was complete.
Voltage-sensitive Optical Recordings
Voltage-sensitive dye experiments were conducted using the voltage-sensitive fluorescent dye N-[3-(triethylammonium)propyl]-4-[4-(p-diethylaminophenyl)butadienyl]pyridinium dibromide (RH 414). Cortical slices were stained with 30 µM RH 414 for at least 60 min at RT and placed
in the optical recording chamber (Axiovert 135TV, Zeiss). Slices were continuously perfused with recording saline at a rate of 4 ml/min for at least 30 min before recording to wash out excess dye. A bipolar stimulating electrode was positioned adjacent to the tumor mass. Activity was evoked with single shocks 20–100 µA in amplitude, 100 µs in duration. The intensity eliciting the first response was designated as threshold response. A hexagonal photodiode array containing 464 diodes (Neuroplex, Red Shirt Imaging) detected activity-dependent fluorescence changes. Optical signals are represented as changes in fluorescence with stimulation divided by resting fluorescence (∆F/F, where F is the fluorescence measured in the absence of stimulation and ∆F is the change in fluorescence after stimulation). Pseudocolor images were generated to visualize spatiotemporal patterns of activity in the slice.
Electrophysiology
To analyze the voltage “sag” due to the inward rectifier cationic current, IH , we evoked a -100 pA hyperpolarizing current step, and the amplitude of the voltage bump was measured as a the difference between the peak negative deflection and the stable voltage level reached during the hyperpolarizing current step (59). Individual action potential parameters were analyzed on traces evoked by a +200 pA current step. The action potential parameters analyzed were: AP amplitude, AP halfwidth and AP afterhyperpolarization (AHP). AP amplitude was measured as the voltage difference between the threshold and the absolute value reached at the peak. AHP amplitude was calculated as the voltage difference between the threshold and the negative AHP peak. AP width was measured at half AP amplitude.
Surgical Procedures
Human glioma cells were implanted into male, 6-12 wk immunodeficient C.B.17 scid mice. Animals were anesthetized with 2-5% isoflurane, after which a midline scalp incision and a 0.5 mm burr hole 1.0 - 2.0 mm lateral and 0.5 – 1.0 mm posterior to bregma was made. Patient-derived xenograft tumor cells (1.5 x 10⁵, cells of GBM22, GBM1066, GBM14, or GBM39) were injected at a depth of 1.0 – 2.0 mm.
For EEG experiments, animals were anesthetized and maintained with 2.5% isoflurane. Six small holes were drilled through the skull, bilaterally, 2, 4, and 6 mm posterior to the bregma, and 2, 4, and 2 mm lateral to midline, respectively (dental drill, 1.0 mm bit). Three 1.6 mm stainless steel screws (Small Parts, Inc.) were screwed halfway into alternate holes. An EEG electrode unit (Plastics One, Inc.; 2 lead wires, ground wire, cut to 1.5 mm) was inserted into the remaining three holes. Lead wires were placed bilaterally over each hemisphere. Dental acrylic was then applied to cement the electrode to the skull and the scalp closed with skin glue (3M Vetbond).
In Vitro EEG/Video Recording
One week after electrode placement, mice were individually housed in monitoring cages. EEG data were acquired using Biopac Systems amplifiers (Biopac EEG100C) and AcqKnowlege 4.2 EEG Acquisition and Reader Software (BIOPAC Systems, Inc.). Cages were equipped with IR Digital Color CCD cameras (Digimerge Technologies) to video record each animal concurrent with EEG monitoring. The video recordings were reviewed using security system hardware and software (L20WD800 Series, Lorex Technology, Inc.). Events of 12-15 Hz and ≥ 5x baseline amplitude were flagged for further analysis. EEG abnormalities were matched chronologically with the video to confirm seizures. Animals were recorded until moribund and euthanized.
Human EEG Protocol
The EEG was recorded with whole-scalp coverage using the standard International Federation of Clinical Neurophysiology (IFCN) 10/20 system of electrode placement. Additional electrodes were placed at FT9 and FT10, along with 2 electrooculography (EOG) channels. One channel was used for electrocardiography, primarily for removal of cardiac-related artifacts.
Proton Magnetic Resonance Spectroscopy 1H-MRS data were analyzed using jMRUI version 5.0 (60). Hankel-Lanczos singular values decomposition filter was used to remove the residual water peak. Spectra were quantified in the time domain by the AMARES (advanced method for accurate, robust, and efficient spectral fitting) algorithm (61). The model consisted of peaks for N-acetylaspartate (NAA), creatine (Cr), choline (Cho), and the C4 resonance of glutamate (Glx). Prior knowledge for Glx was derived from a phantom solution of glutamate in buffer. NAA, Cho, and Glx were quantified with respect to Cr. As an estimate of uncertainty, Cramer-Rao lower bounds (CRLB) were calculated for each peak. Ratios with CRLB greater than 30% were excluded from further analyses, as predetermined.
Supplementary Figures
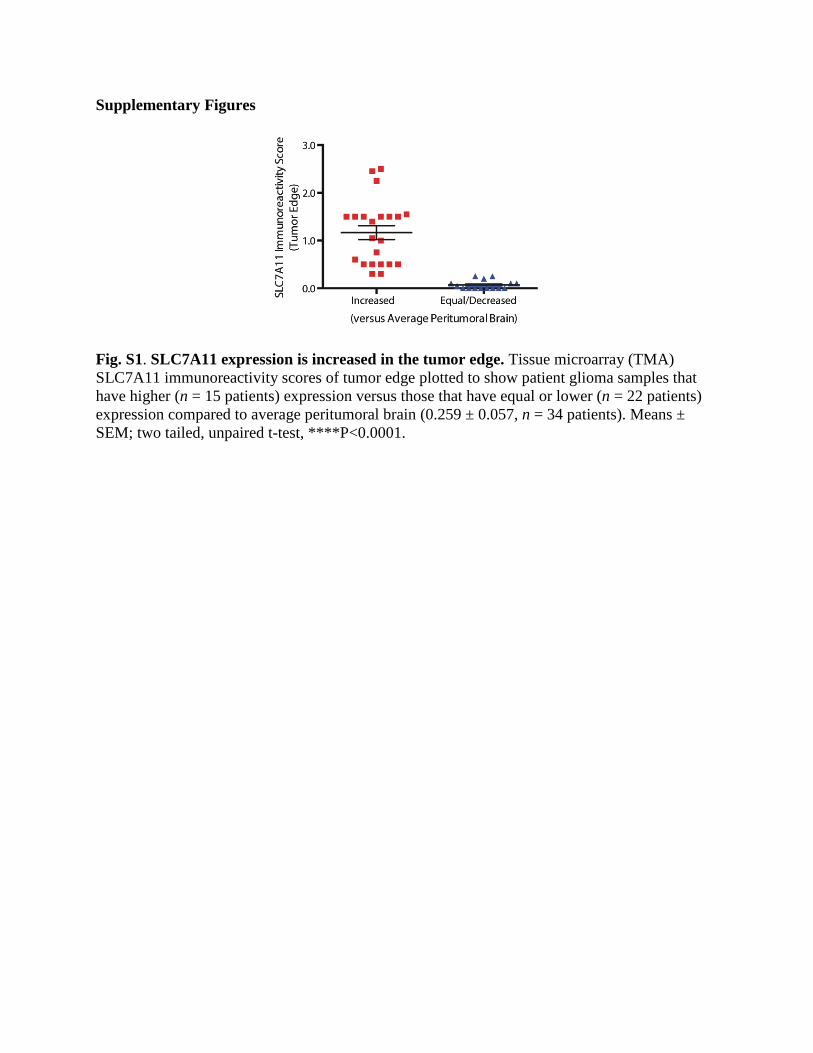
Fig. S1. SLC7A11 expression is increased in the tumor edge. Tissue microarray (TMA) SLC7A11 immunoreactivity scores of tumor edge plotted to show patient glioma samples that have higher (n = 15 patients) expression versus those that have equal or lower (n = 22 patients) expression compared to average peritumoral brain (0.259 ± 0.057, n = 34 patients). Means ± SEM; two tailed, unpaired t-test, ****P<0.0001.
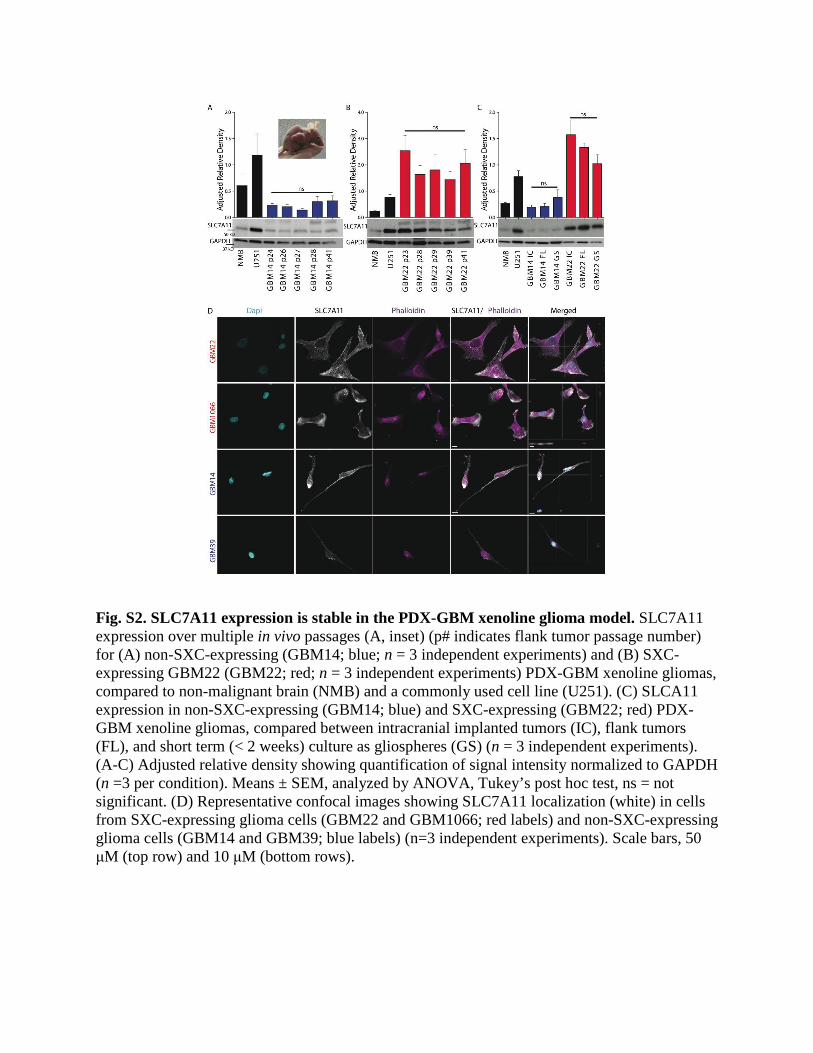
Fig. S2. SLC7A11 expression is stable in the PDX-GBM xenoline glioma model. SLC7A11 expression over multiple in vivo passages (A, inset) (p# indicates flank tumor passage number) for (A) non-SXC-expressing (GBM14; blue; n = 3 independent experiments) and (B) SXC-expressing GBM22 (GBM22; red; n = 3 independent experiments) PDX-GBM xenoline gliomas, compared to non-malignant brain (NMB) and a commonly used cell line (U251). (C) SLCA11 expression in non-SXC-expressing (GBM14; blue) and SXC-expressing (GBM22; red) PDX-GBM xenoline gliomas, compared between intracranial implanted tumors (IC), flank tumors (FL), and short term (< 2 weeks) culture as gliospheres (GS) (n = 3 independent experiments). (A-C) Adjusted relative density showing quantification of signal intensity normalized to GAPDH (n =3 per condition). Means ± SEM, analyzed by ANOVA, Tukey’s post hoc test, ns = not significant. (D) Representative confocal images showing SLC7A11 localization (white) in cells from SXC-expressing glioma cells (GBM22 and GBM1066; red labels) and non-SXC-expressing glioma cells (GBM14 and GBM39; blue labels) (n=3 independent experiments). Scale bars, 50 µM (top row) and 10 µM (bottom rows).
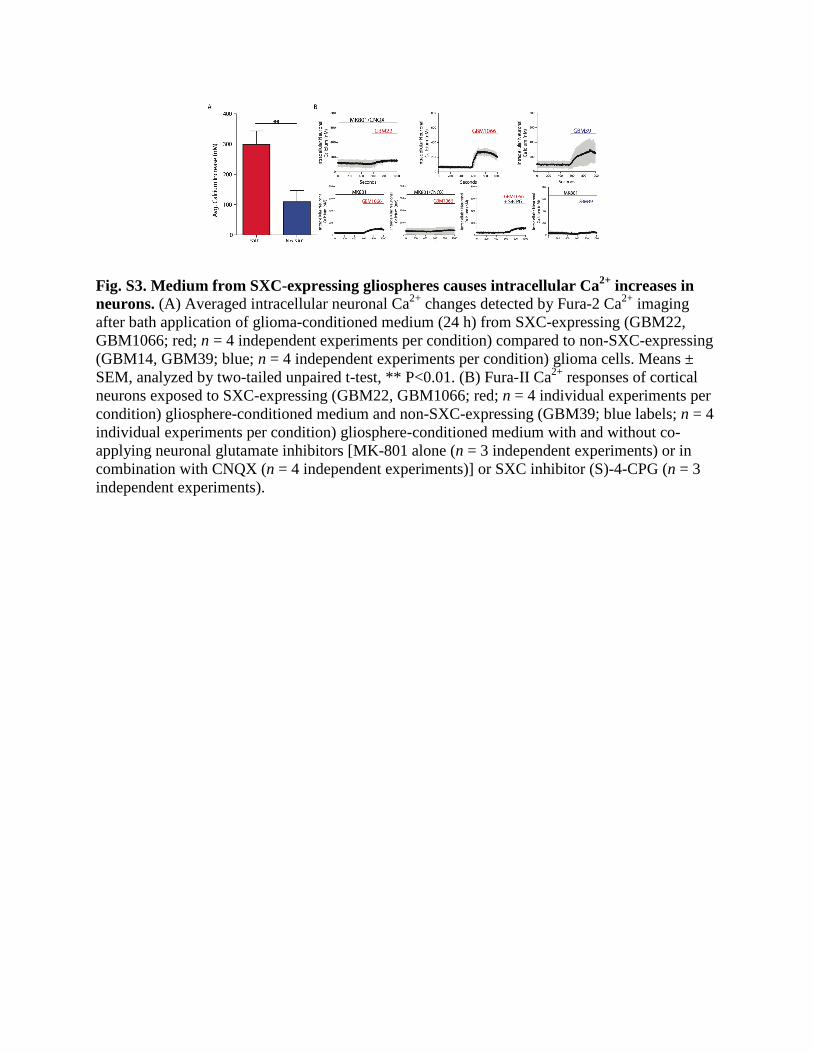
Fig. S3. Medium from SXC-expressing gliospheres causes intracellular Ca2+ increases in neurons. (A) Averaged intracellular neuronal Ca2+ changes detected by Fura-2 Ca2+ imaging after bath application of glioma-conditioned medium (24 h) from SXC-expressing (GBM22, GBM1066; red; n = 4 independent experiments per condition) compared to non-SXC-expressing (GBM14, GBM39; blue; n = 4 independent experiments per condition) glioma cells. Means ± SEM, analyzed by two-tailed unpaired t-test, ** P<0.01. (B) Fura-II Ca2+ responses of cortical neurons exposed to SXC-expressing (GBM22, GBM1066; red; n = 4 individual experiments per condition) gliosphere-conditioned medium and non-SXC-expressing (GBM39; blue labels; n = 4 individual experiments per condition) gliosphere-conditioned medium with and without co-applying neuronal glutamate inhibitors [MK-801 alone (n = 3 independent experiments) or in combination with CNQX (n = 4 independent experiments)] or SXC inhibitor (S)-4-CPG (n = 3 independent experiments).
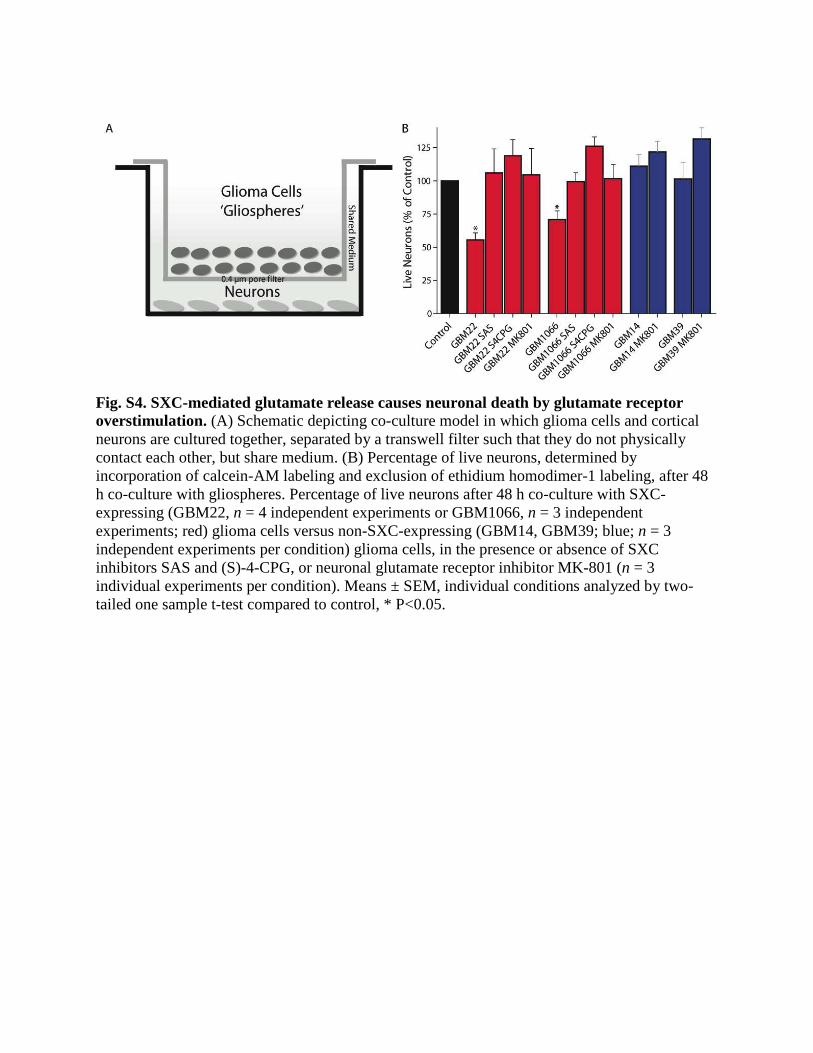
Fig. S4. SXC-mediated glutamate release causes neuronal death by glutamate receptor overstimulation. (A) Schematic depicting co-culture model in which glioma cells and cortical neurons are cultured together, separated by a transwell filter such that they do not physically contact each other, but share medium. (B) Percentage of live neurons, determined by incorporation of calcein-AM labeling and exclusion of ethidium homodimer-1 labeling, after 48 h co-culture with gliospheres. Percentage of live neurons after 48 h co-culture with SXC-expressing (GBM22, n = 4 independent experiments or GBM1066, n = 3 independent experiments; red) glioma cells versus non-SXC-expressing (GBM14, GBM39; blue; n = 3 independent experiments per condition) glioma cells, in the presence or absence of SXC inhibitors SAS and (S)-4-CPG, or neuronal glutamate receptor inhibitor MK-801 (n = 3 individual experiments per condition). Means ± SEM, individual conditions analyzed by two-tailed one sample t-test compared to control, * P<0.05.
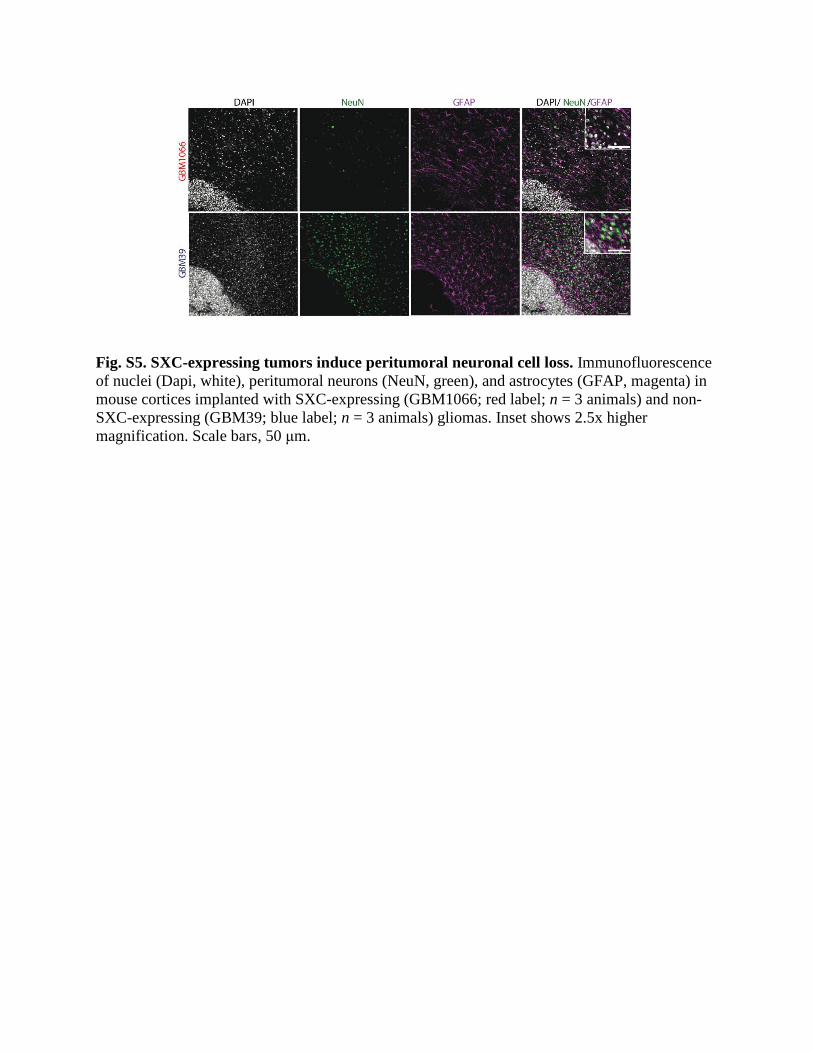
Fig. S5. SXC-expressing tumors induce peritumoral neuronal cell loss. Immunofluorescence of nuclei (Dapi, white), peritumoral neurons (NeuN, green), and astrocytes (GFAP, magenta) in mouse cortices implanted with SXC-expressing (GBM1066; red label; n = 3 animals) and non-SXC-expressing (GBM39; blue label; n = 3 animals) gliomas. Inset shows 2.5x higher magnification. Scale bars, 50 µm.
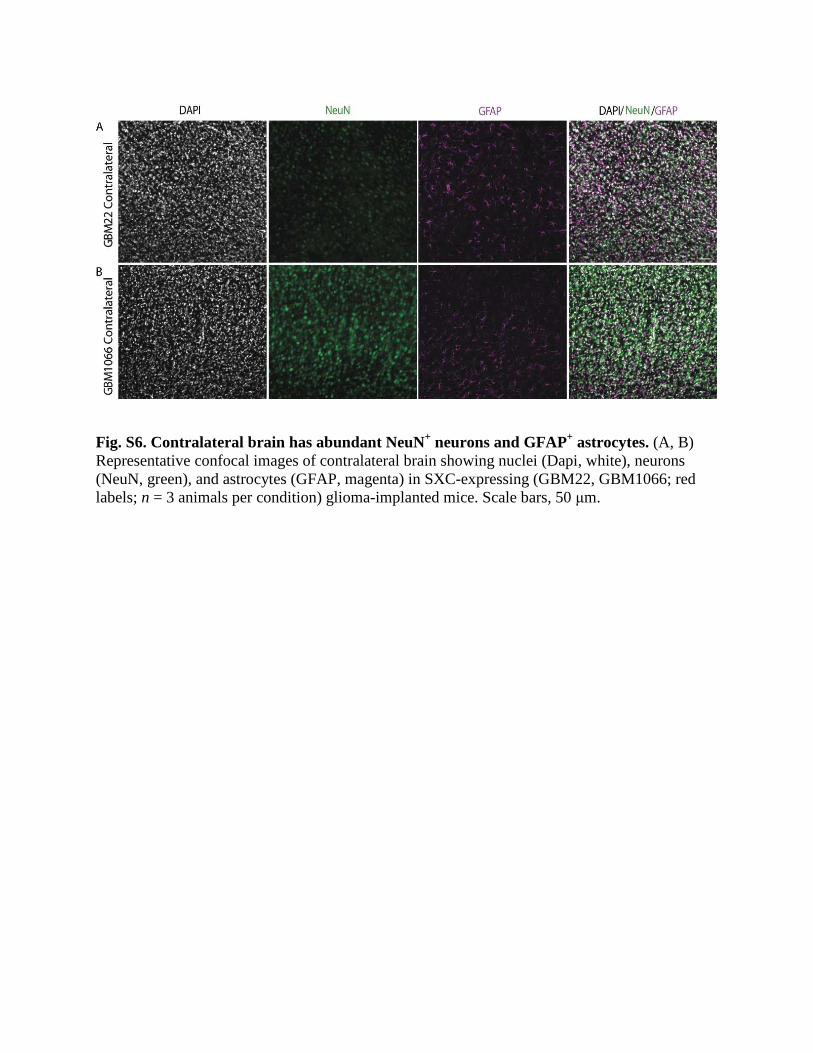
Fig. S6. Contralateral brain has abundant NeuN+ neurons and GFAP+ astrocytes. (A, B) Representative confocal images of contralateral brain showing nuclei (Dapi, white), neurons (NeuN, green), and astrocytes (GFAP, magenta) in SXC-expressing (GBM22, GBM1066; red labels; n = 3 animals per condition) glioma-implanted mice. Scale bars, 50 µm.
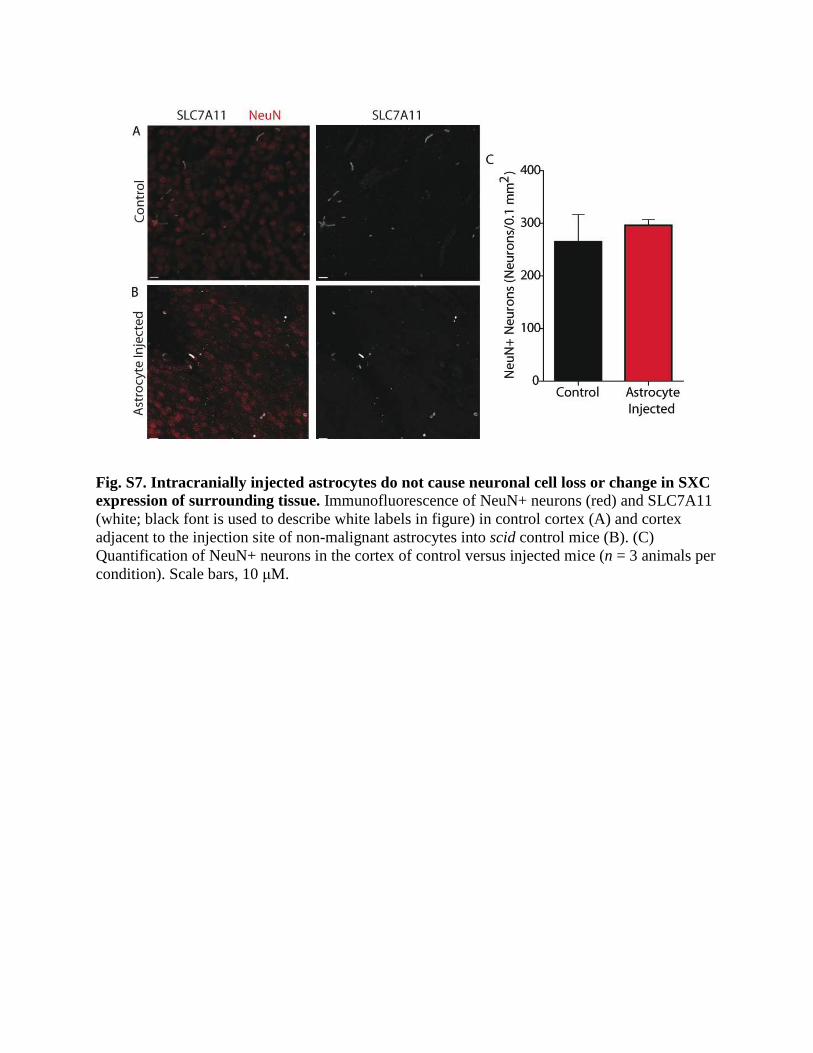
Fig. S7. Intracranially injected astrocytes do not cause neuronal cell loss or change in SXC expression of surrounding tissue. Immunofluorescence of NeuN+ neurons (red) and SLC7A11 (white; black font is used to describe white labels in figure) in control cortex (A) and cortex adjacent to the injection site of non-malignant astrocytes into scid control mice (B). (C) Quantification of NeuN+ neurons in the cortex of control versus injected mice (n = 3 animals per condition). Scale bars, 10 µM.
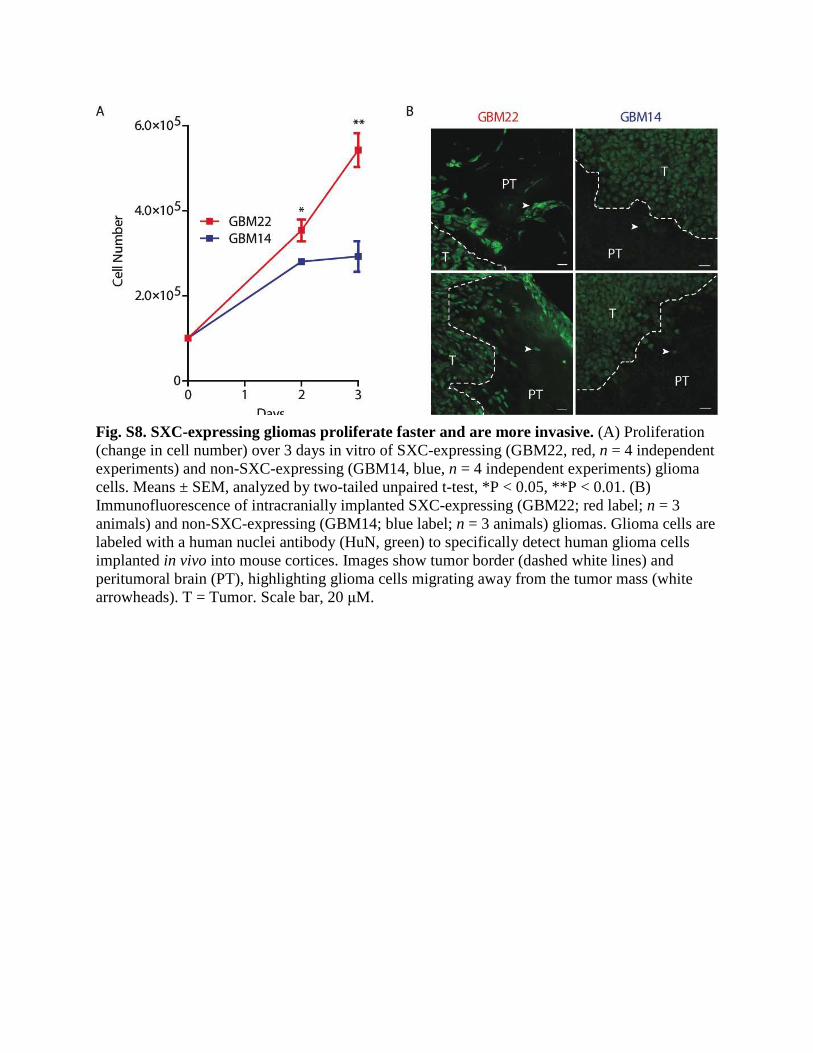
Fig. S8. SXC-expressing gliomas proliferate faster and are more invasive. (A) Proliferation (change in cell number) over 3 days in vitro of SXC-expressing (GBM22, red, n = 4 independent experiments) and non-SXC-expressing (GBM14, blue, n = 4 independent experiments) glioma cells. Means ± SEM, analyzed by two-tailed unpaired t-test, *P < 0.05, **P < 0.01. (B) Immunofluorescence of intracranially implanted SXC-expressing (GBM22; red label; n = 3 animals) and non-SXC-expressing (GBM14; blue label; n = 3 animals) gliomas. Glioma cells are labeled with a human nuclei antibody (HuN, green) to specifically detect human glioma cells implanted in vivo into mouse cortices. Images show tumor border (dashed white lines) and peritumoral brain (PT), highlighting glioma cells migrating away from the tumor mass (white arrowheads). T = Tumor. Scale bar, 20 µM.
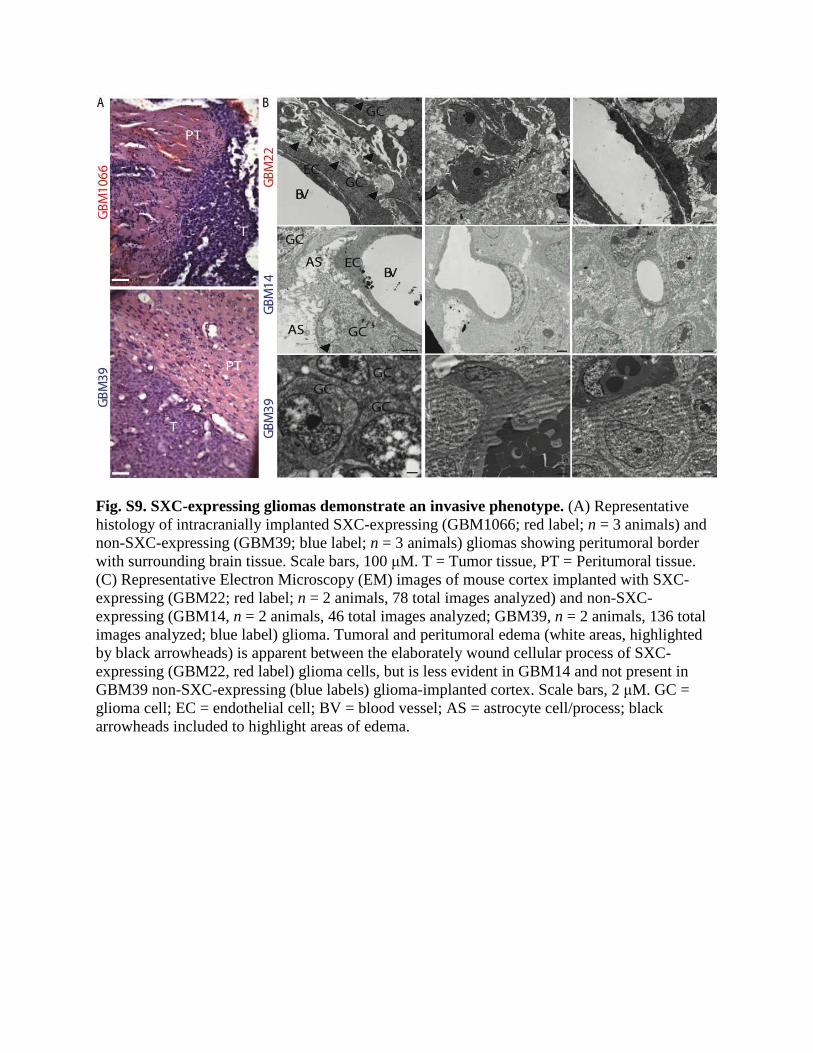
Fig. S9. SXC-expressing gliomas demonstrate an invasive phenotype. (A) Representative histology of intracranially implanted SXC-expressing (GBM1066; red label; n = 3 animals) and non-SXC-expressing (GBM39; blue label; n = 3 animals) gliomas showing peritumoral border with surrounding brain tissue. Scale bars, 100 µM. T = Tumor tissue, PT = Peritumoral tissue. (C) Representative Electron Microscopy (EM) images of mouse cortex implanted with SXC-expressing (GBM22; red label; n = 2 animals, 78 total images analyzed) and non-SXC-expressing (GBM14, n = 2 animals, 46 total images analyzed; GBM39, n = 2 animals, 136 total images analyzed; blue label) glioma. Tumoral and peritumoral edema (white areas, highlighted by black arrowheads) is apparent between the elaborately wound cellular process of SXC-expressing (GBM22, red label) glioma cells, but is less evident in GBM14 and not present in GBM39 non-SXC-expressing (blue labels) glioma-implanted cortex. Scale bars, 2 µM. GC = glioma cell; EC = endothelial cell; BV = blood vessel; AS = astrocyte cell/process; black arrowheads included to highlight areas of edema.
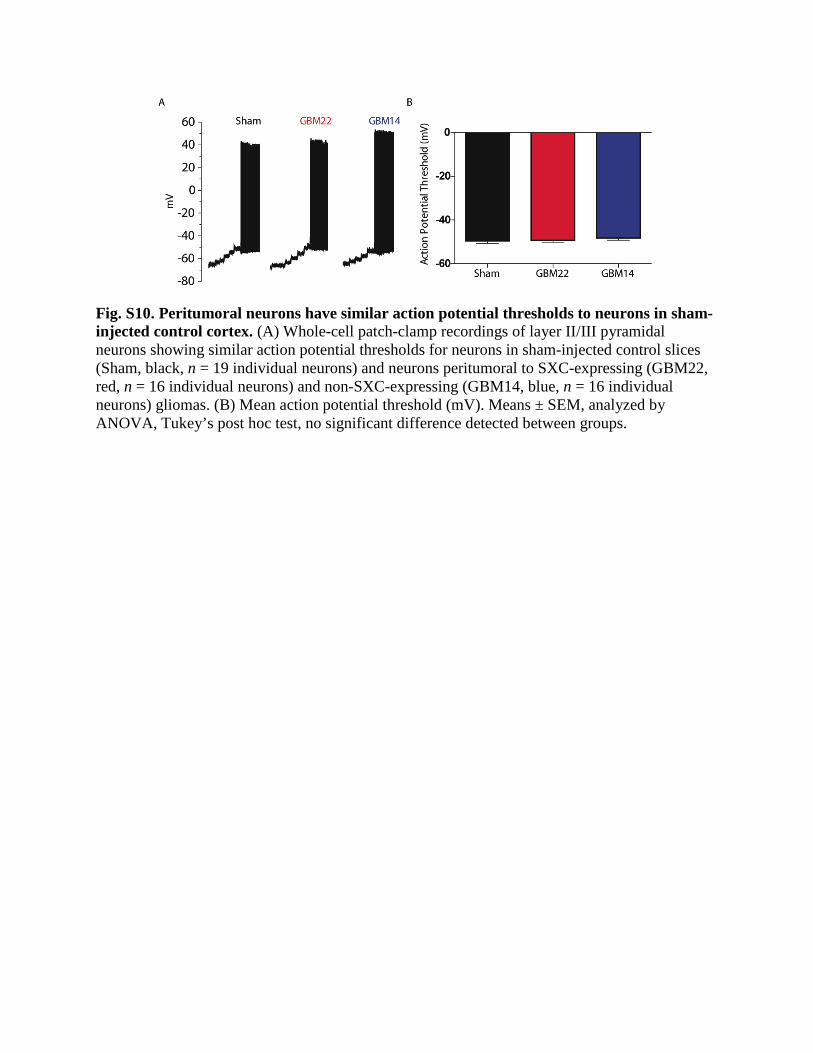
Fig. S10. Peritumoral neurons have similar action potential thresholds to neurons in sham-injected control cortex. (A) Whole-cell patch-clamp recordings of layer II/III pyramidal neurons showing similar action potential thresholds for neurons in sham-injected control slices (Sham, black, n = 19 individual neurons) and neurons peritumoral to SXC-expressing (GBM22, red, n = 16 individual neurons) and non-SXC-expressing (GBM14, blue, n = 16 individual neurons) gliomas. (B) Mean action potential threshold (mV). Means ± SEM, analyzed by ANOVA, Tukey’s post hoc test, no significant difference detected between groups.
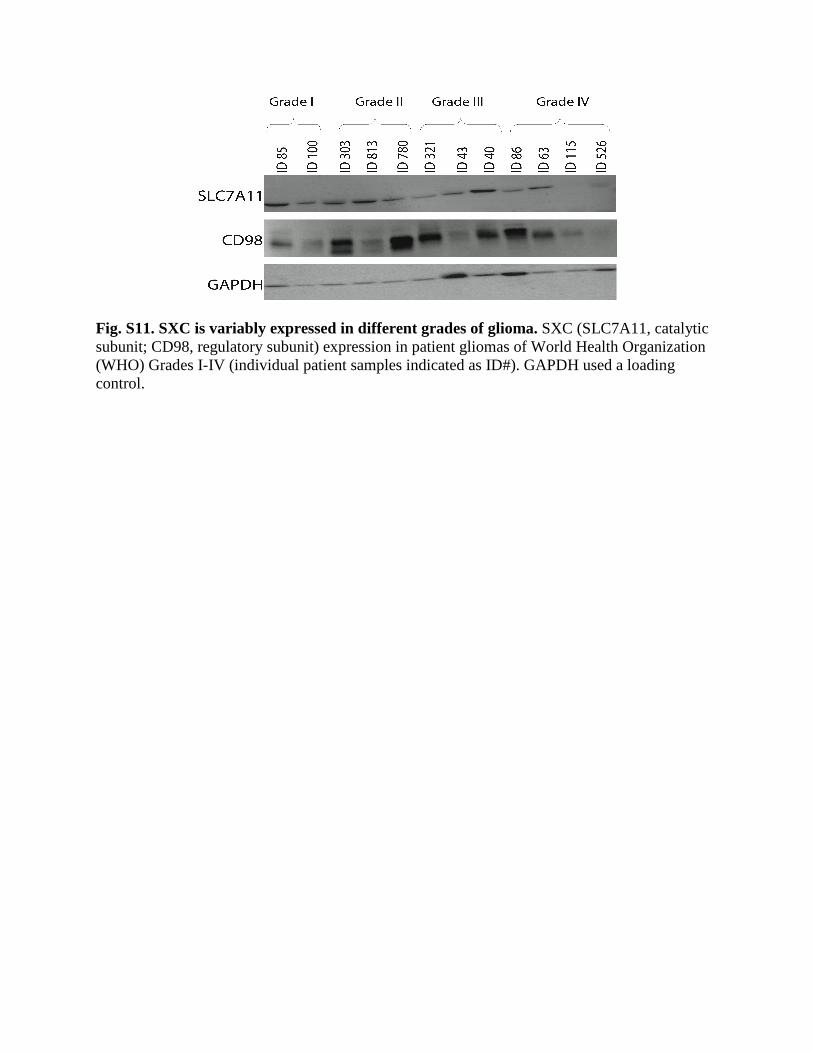
Fig. S11. SXC is variably expressed in different grades of glioma. SXC (SLC7A11, catalytic subunit; CD98, regulatory subunit) expression in patient gliomas of World Health Organization (WHO) Grades I-IV (individual patient samples indicated as ID#). GAPDH used a loading control.
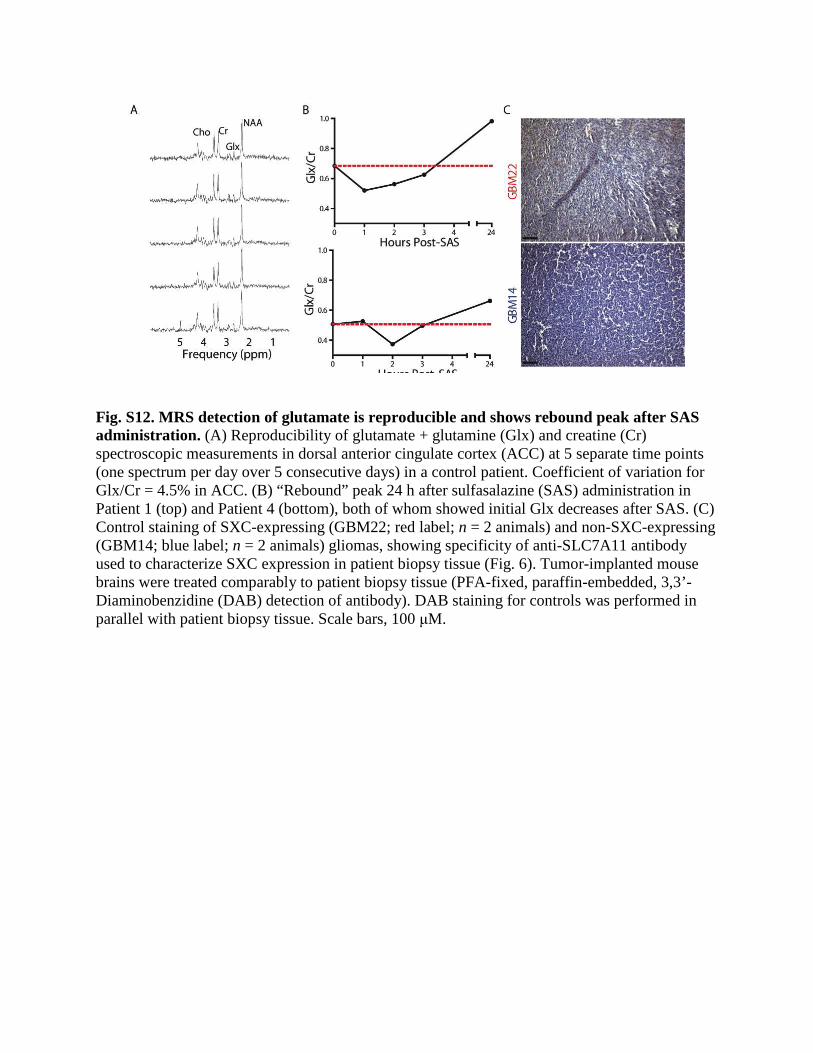
Fig. S12. MRS detection of glutamate is reproducible and shows rebound peak after SAS administration. (A) Reproducibility of glutamate + glutamine (Glx) and creatine (Cr) spectroscopic measurements in dorsal anterior cingulate cortex (ACC) at 5 separate time points (one spectrum per day over 5 consecutive days) in a control patient. Coefficient of variation for Glx/Cr = 4.5% in ACC. (B) “Rebound” peak 24 h after sulfasalazine (SAS) administration in Patient 1 (top) and Patient 4 (bottom), both of whom showed initial Glx decreases after SAS. (C) Control staining of SXC-expressing (GBM22; red label; n = 2 animals) and non-SXC-expressing (GBM14; blue label; n = 2 animals) gliomas, showing specificity of anti-SLC7A11 antibody used to characterize SXC expression in patient biopsy tissue (Fig. 6). Tumor-implanted mouse brains were treated comparably to patient biopsy tissue (PFA-fixed, paraffin-embedded, 3,3’-Diaminobenzidine (DAB) detection of antibody). DAB staining for controls was performed in parallel with patient biopsy tissue. Scale bars, 100 µM.
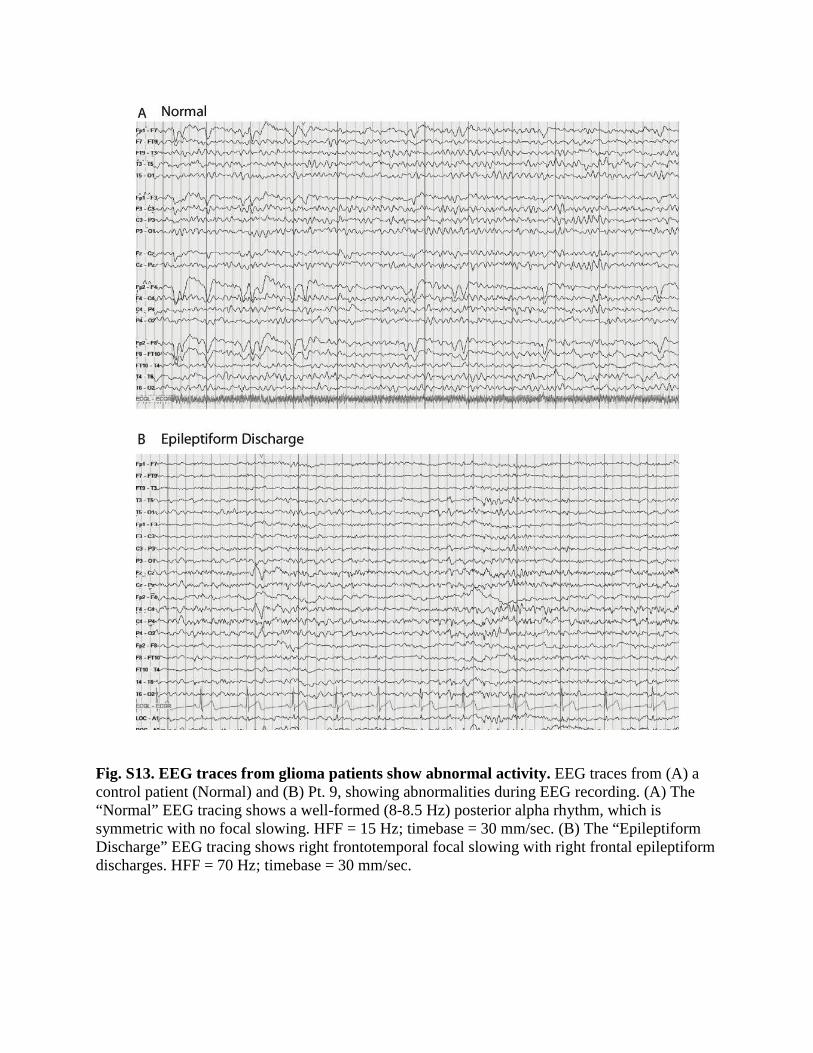
Fig. S13. EEG traces from glioma patients show abnormal activity. EEG traces from (A) a control patient (Normal) and (B) Pt. 9, showing abnormalities during EEG recording. (A) The “Normal” EEG tracing shows a well-formed (8-8.5 Hz) posterior alpha rhythm, which is symmetric with no focal slowing. HFF = 15 Hz; timebase = 30 mm/sec. (B) The “Epileptiform Discharge” EEG tracing shows right frontotemporal focal slowing with right frontal epileptiform discharges. HFF = 70 Hz; timebase = 30 mm/sec.
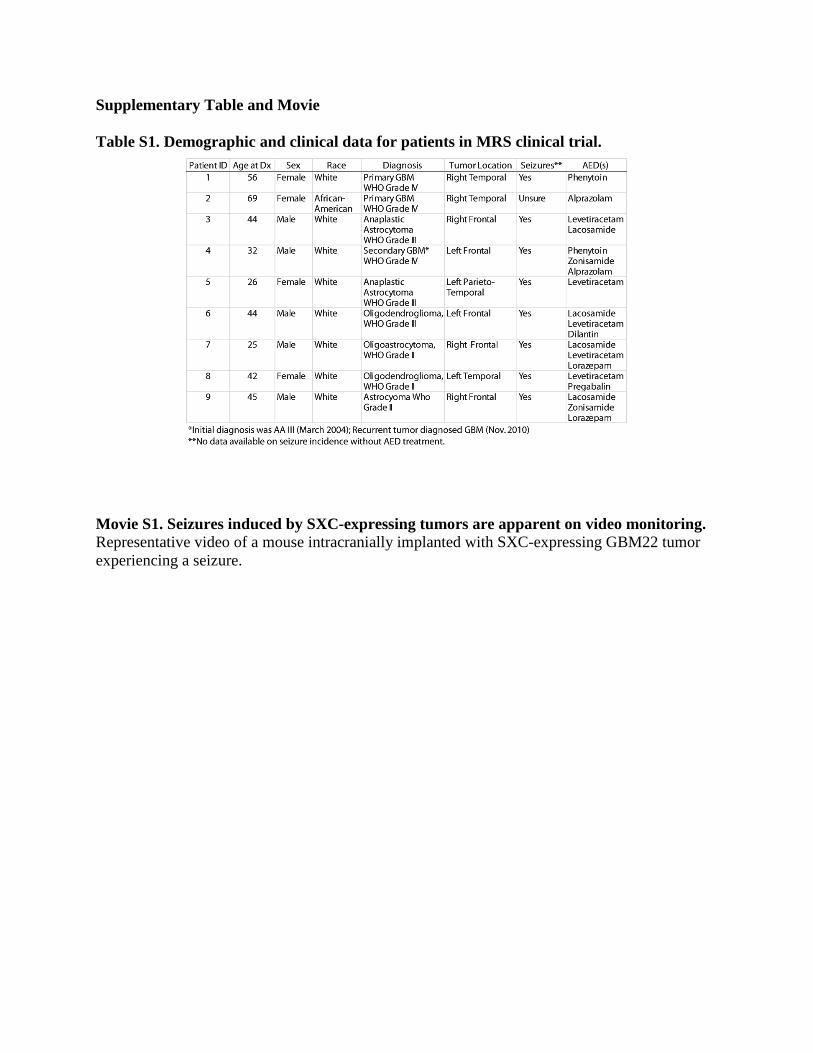
Supplementary Table and Movie Table S1. Demographic and clinical data for patients in MRS clinical trial.
Movie S1. Seizures induced by SXC-expressing tumors are apparent on video monitoring. Representative video of a mouse intracranially implanted with SXC-expressing GBM22 tumor experiencing a seizure.