Embed Size (px)
Citation preview
www.sciencesignaling.org/cgi/content/full/4/166/ra18/DC1
Supplementary Materials for
Global Phosphoproteomics Reveals Crosstalk Between Bcr-Abl and Negative Feedback Mechanisms Controlling Src Signaling
Liudmilla Rubbi, Björn Titz, Lauren Brown, Erica Galvan, Evangelia Komisopoulou,
Sharon S. Chen, Tracey Low, Martik Tahmasian, Brian Skaggs, Markus Müschen, Matteo Pellegrini, Thomas G. Graeber*
*To whom correspondence should be addressed. E-mail: [email protected]
Published 29 March 2011, Sci. Signal. 4, ra18 (2011)
DOI: 10.1126/scisignal.2001314 This PDF file includes:
Analysis: Unsupervised Hierarchical Clustering Fig. S1. Phosphoproteomics approach to delineate the bifurcation and coupling of the Bcr-Abl and Src family kinase (SFK) signaling network. Fig. S2. Global quantitative phosphoprofiling of dasatinib dose-escalation experiments reveals phosphorylation events with distinct inhibitor sensitivities and response patterns. Fig. S3. Comparison of dasatinib dose-response results using wild-type Bcr-Abl (p210) versus dasatinib-resistant T315A Bcr-Abl. Fig. S4. SFK-related properties are more enriched than Abl-related properties when phosphorylation events are ranked by their SFK perturbation response score. Fig. S5. The network of PPIs between the 40 proteins associated with the top-ranked SFK perturbation–correlated phosphosites and the 40 proteins with the smallest change in response to SFK perturbation. Fig. S6. The consensus sequence motifs of the top 50 correlated phosphosites based on SFK overexpression, drug inhibition (dasatinib), and combined rankings. Fig. S7. Unsupervised hierarchical clustering analysis of the Bcr-Abl and SFK network perturbation data. Fig. S8. The constitutive kinase activity of Bcr-Abl induces increased phosphorylation of the SFK activation domain tyrosine in Ba/F3 pro-B lymphoid cells. Fig. S9. Stable Csk knockdown in Ba/F3 Bcr-Abl (p210) cells. Fig. S10. Phosphorylation of the activation domain and C-terminal tyrosines of SFKs in response to a time course treatment with imatinib. Fig. S11. MS alignment and quantitation analysis pipeline and representative examples.

Fig. S12. Global changes in phosphorylation amounts upon SFK perturbation compared to differences between biological replicates. Fig. S13. Global phosphorylation changes detected in independently derived biological replicates are sufficient to correctly cluster like samples in an unsupervised fashion. Fig. S14. Comparison of label-free and SILAC-based MS quantitation and representative examples. Table S1. Enrichment of SFK-related properties at the top of our SFK perturbation response score–ranked lists. Table S2. SFK-related properties of the two clusters generated by the unsupervised hierarchical clustering analysis. References
Other Supplementary Material for this manuscript includes the following: (available at www.sciencesignaling.org/cgi/content/full/4/166/ra18/DC1)
Table S3. Quantitative fold change values for 493 phosphorylation sites upon SFK perturbation by genetics and inhibitors (Microsoft Excel format). Table S4. Kinetic fold change values for 74 phosphorylation sites upon imatinib inhibition of Bcr-Abl (Microsoft Excel format).
1
Supplementary Analysis: Unsupervised Hierarchical Clustering
For unsupervised clustering, we first compiled a matrix of all the log fold change values
between perturbation and control for the 601 phosphorylation sites observed in the
experiments indicated in Figure S7. Values for replicated experiments were averaged.
We then selected only phosphosites that appeared in at least four of the conditions,
leaving us with 263 phosphosites. We computed the distance matrix between these
phosphosites using the cosine correlation distance metric (1 – cosine). We only
considered experiments where both phosphosites were observed when computing the
distance, and set the distance between phosphosites that were observed in less than three
experiments together to one. We used an unsupervised hierarchical clustering algorithm
to subdivide the distance matrix into two main clusters of phosphosites using the Pearson
correlation coefficient as the metric to compute the distance between rows. The
clustering dendrogram computed from this procedure is shown in Figure S7, along with
the associated phosphosite log fold change values in a heatmap format. The heatmap
shows that the grouping of cluster 1 is driven primarily by the Lyn and Hck
overexpression experiments, and that of cluster 2 by a combination of the Csk and drug
inhibition experiments.
We next performed a series of analyses on the two clusters to characterize their SFK-
related properties. We first asked whether the phosphosites in each cluster were enriched
for „Src Kinase‟ motifs, as defined by the Scansite resource using low stringency. We
used the hypergeometric distribution to compute the enrichment values of Src motifs in
each cluster. We found that Src motifs were significantly enriched in cluster 1 but not in
cluster 2 (table S2). We next obtained protein-protein interaction data from the Human
Proteome Reference Database (HPRD). We asked whether the proteins containing the
phosphosites in each cluster were enriched for interactions with Src family kinases
(SFKs). To compute the statistical significance of these enrichments we again used the
hypergeometric distribution using the lists of unique proteins found in each cluster, and
all the proteins associated with our total pool of observed phosphosites as a background.
We observed that although both clusters were enriched for SFK interactions (indicating

2
that highly observed phosphosites are more likely to interact with SFKs), cluster 2
phosphosites had a more significant enrichment than cluster 1 (table S2).
Our final analyses used the online DAVID tool (1), to compute the enrichment of
structural domains within the proteins of each cluster. To identify enriched domains, we
used InterPro as the reference database. We found that cluster 2 proteins were
significantly more enriched for SH2 domains than were cluster 1 proteins (table S2). In
contrast, SH3 domains were found in roughly equal abundance in each cluster.
The unsupervised clustering results are in concordance with our perturbation response
score rank-based analysis (Fig. 3B and table S1). The unsupervised and rank-based
analysis approaches were done in parallel and helped guide each other. From both
analyses, we observed that perturbation by SFK overexpression resulted in a stronger
tendency to modulate phosphorylation sites within Src motifs. In contrast, drug
inhibition tended to mediate phosphorylation changes on (i) proteins known to
functionally interact with SFKs, including protein-protein physical interactions and
enzyme-substrate interactions, and (ii) proteins containing SH2 domains, which mediate
phosphorylation-regulated protein-protein physical interactions. One potential
explanation for these observed tendencies is that the effects of SFK overexpression (due
to increases in SFK activity and protein stoichiometry) involve more transient protein-
protein interactions (enzyme active site-substrate phosphosite) that are driven by a strong
Src motif rather than by prolonged proximity driven by stable protein interactions. In
contrast, the drug inhibition experiments (decreases in endogenous SFK activity) may be
preferentially targeting more stable interactions between SFKs and proteins in complex,
for example phosphotyrosine and SH2 domain interactions (see model in fig. S8), than by
motif-driven kinase specificity. We emphasize that the observed trends are only
tendencies or biases. In general, both types of protein interactions, transient and stable,
are most likely involved to some extent in the phosphorylation changes seen in both our
kinase overexpression and drug inhibition experiments.

I. perturbation
II. phosphoprofiling
global signaling
network delineation
literature-directed focus
on specific subnetworks
III. overlap with
functional databases
(literature)
Fig. S1. Phosphoproteomics approach to delineate the bifurcation and coupling of the Bcr-Abl and Src family kinase
(SFK) signaling network.

Atg3 pY18 ALEVAEpYLTPVLK (2+) IPI00132142.1 67841 autophagy-related 3 (yeast)Btk pY222 VVALpYDYMPMNANDLQLR (3+) IPI00312116.4 12229 Bruton agammaglobulinemia tyrosine kinaseActn1 pY246 AIMTYVSSFpYHAFSGAQK (3+) IPI00380436.1 109711 actinin, alpha 1Dapp1 pY139 EVEEPC8IpYESVR (2+) IPI00135514.1 26377 dual adaptor for phosphotyrosine and 3-phosphoinositides 1Btk pY224 VVALYDpYMPMNANDLQLR (3+) IPI00312116.4 12229 Bruton agammaglobulinemia tyrosine kinasePtpn18 pY381 APTSTDTPIpYSQVAPR (2+) IPI00117861.3 19253 protein tyrosine phosphatase, non-receptor type 18C230081A13Rik pY638 VPIVINPNAYDNLAIpYK (3+) IPI00136917.5 244895 RIKEN cDNA C230081A13 geneHsp90ab1 pY596 LVSSPC8C8IVTSTpYGWTANMER (3+) IPI00229080.5 15516 heat shock protein 90 alpha (cytosolic), class B member 1Actn4 pY213 HRPELIEpYDK (3+) IPI00118899.1 60595 actinin alpha 4Pdlim5 pY251 NTEFpYHIPTHSDASK (3+) IPI00415684.5 56376 PDZ and LIM domain 5Ptpn18 pY381 APTSTDTPIpYSQVAPR (3+) IPI00117861.3 19253 protein tyrosine phosphatase, non-receptor type 18Csk pY184 VMEGTVAAQDEFpYR (2+) IPI00331152.2 12988 c-src tyrosine kinaseItsn2 pY553 LIpYLVPEK (2+) IPI00222827.1 20403 intersectin 2Ppp1r11 pY69 #C8C8C8IpYEKPR (2+) IPI00118923.2 76497 protein phosphatase 1, regulatory (inhibitor) subunit 11Cdv3 pY199 KTPQGPPEIpYSDTQFPSLQSTAK (3+) IPI00227808.2 321022 carnitine deficiency-associated gene expressed in ventricle 3Ppp1r12a pY496 LApYVTPTIPR (2+) IPI00671847.3 17931 protein phosphatase 1, regulatory (inhibitor) subunit 12ANedd9 pY91 LpYQVPNSQAASR (2+) IPI00127755.4 18003 neural precursor cell expressed, developmentally down-regulated gene 9Itsn2 pY921 GEPEALpYAAVTK (2+) IPI00222827.1 20403 intersectin 2Rod1 pY95 SQPVpYIQYSNHR (3+) IPI00267224.4 230257 ROD1 regulator of differentiation 1 (S. pombe)Dok1 pY450 GFSSDTALpYSQVQK (2+) IPI00125534.4 13448 docking protein 1Pxn pY118 AGEEEHVpYSFPNK (3+) IPI00128703.3 19303 paxillinNedd9 pY165 TGHGYVpYEYPSR (3+) IPI00127755.4 18003 neural precursor cell expressed, developmentally down-regulated gene 9Nedd9 pY344 DGVpYDVPLHNPADAK (3+) IPI00127755.4 18003 neural precursor cell expressed, developmentally down-regulated gene 9Calm1 pY99 VFDKDGNGpYISAAELR (3+) IPI00761696.1 12313 calmodulin 1Shc1 pY423 ELFDDPSpYVNIQNLDK (2+) IPI00125298.2 20416 src homology 2 domain-containing transforming protein C1ABL1 pY253 LGGGQpYGEVYEGVWK (2+) IPI00216969.3 25 c-abl oncogene 1, receptor tyrosine kinaseEef2 pY442 EDLpYLKPIQR (3+) IPI00466069.2 13629 eukaryotic translation elongation factor 2Sorbs1 pY450 SIpYEYQPGK (2+) IPI00458048.1 20411 sorbin and SH3 domain containing 1Tuba1 pY399 FDLMpYAK (2+) IPI00110753.1 22142 tubulin, alpha 1ADok1 pY408 LKEEGYELPYNPATDDpYAVPPPR (3+) IPI00125534.4 13448 docking protein 1Inppl1 pY1136 TLSEVDpYAPGPGR (2+) IPI00312067.4 16332 inositol polyphosphate phosphatase-like 1Cfl1 pY140 HELQANC8pYEEVKDR (3+) IPI00407543.2 12631 cofilin 1, non-muscleGrlf1 pY1105 NEEENIpYSVPHDSTQGK (3+) IPI00480321.2 232906 glucocorticoid receptor DNA binding factor 1Tjp2 pY1095 HPDIpYAVPIK (2+) IPI00323349.2 21873 tight junction protein 2Ubash3a pY9 #AAGETQLpYAK (2+) IPI00130133.5 328795 ubiquitin associated and SH3 domain containing, ADok1 pY361 EDPIpYDEPEGLAPAPPR (3+) IPI00125534.4 13448 docking protein 1ABL1 pY226 NKPTVpYGVSPNYDK (3+) IPI00216969.3 25 c-abl oncogene 1, receptor tyrosine kinaseDok1 pY361 LTDSKEDPIpYDEPEGLAPAPPR (3+) IPI00125534.4 13448 docking protein 1Dok2 pY142 SGSPC8MEENELpYSSSTTGLC8K (3+) IPI00118319.1 13449 docking protein 2Dok1 pY376 GLpYDLPQEPR (2+) IPI00125534.4 13448 docking protein 1ABL1 pY393 LM#TGDTpYTAHAGAK (3+) IPI00216969.3 25 c-abl oncogene 1, receptor tyrosine kinaseKntc2 pY458 TQVpYAPLK (2+) IPI00120413.2 67052 NDC80 homolog, kinetochore complex component (S. cerevisiae)Crk pY108 IHpYLDTTTLIEPVAR (3+) IPI00307991.1 12928 v-crk sarcoma virus CT10 oncogene homolog (avian)Inpp5d pY868 EKLpYDFVK (2+) IPI00120516.2 16331 inositol polyphosphate-5-phosphatase DABL1 pY257 LGGGQYGEVpYEGVWKK (3+) IPI00216969.3 25 c-abl oncogene 1, receptor tyrosine kinaseABL1 pY257 LGGGQYGEVpYEGVWK (2+) IPI00216969.3 25 c-abl oncogene 1, receptor tyrosine kinaseTec pY518 YVLDDQpYTSSSGAK (2+) IPI00468346.1 21682 tec protein tyrosine kinaseABL1 pY393 LMTGDTpYTAHAGAK (3+) IPI00216969.3 25 c-abl oncogene 1, receptor tyrosine kinaseMyh9 pY754 ALELDSNLpYR (2+) IPI00788324.1 17886 myosin, heavy polypeptide 9, non-muscleFkbp4 pY219 GEHSIVpYLKPSYAFGSVGK (3+) IPI00230139.4 14228 FK506 binding protein 4Abi1 pY23 ALIESpYQNLTR (2+) IPI00798483.1 11308 abl-interactor 1BCR pY177 KGHGQPGADAEKPFpYVNVEFHHER (4+) IPI00004497.1 613 breakpoint cluster regionPfn1 pY128 #C8pYEM#ASHLR (2+) IPI00224740.5 18643 profilin 1BCR pY58 MIpYLQTLLAK (2+) IPI00004497.1 613 breakpoint cluster regionMapk14 pY182 HTDDEMTGpYVATR (3+) IPI00112346.1 26416 mitogen-activated protein kinase 14Hipk2 pY361 AVC8STpYLQSR (2+) IPI00137890.1 15258 homeodomain interacting protein kinase 2G6pdx pY401 VQPNEAVpYTK (2+) IPI00228385.4 14381 glucose-6-phosphate dehydrogenase X-linkedEG667978 pY91 HpYGGLTGLNK (2+) IPI00457898.2 667978 predicted gene, EG667978
Fig. S2. Global quantitative phosphoprofiling of dasatinib dose escalation experiments reveals phosphorylation
events with distinct inhibitor sensitivities and response patterns. This figure shows the heatmap of Figure 1B with the protein
and residue identities of the phosphorylation events listed: Entrez gene product name, phosphosite residue number,
phosphopeptide (charge state of mass spectrometry ion), IPI accession number, Entrez accession number, gene product
description.
Dasatinib (nM) 0 5 25
15
0
50
0
-

-10
-8
-6
-4
-2
0
2
4
-8 -6 -4 -2 0 2 4
T31
5A
5n
M (
log 2
rati
o v
s 0
nM
)
T315A 500nM (log2 ratio vs 0nM)
-10
-8
-6
-4
-2
0
2
4
-8 -6 -4 -2 0 2 4
T31
5A
50
0n
M (
log 2
rati
o v
s 0
nM
)
Bcr-Abl wild-type 5nM (log2 ratio vs 0nM)
-10
-8
-6
-4
-2
0
2
4
-8 -6 -4 -2 0 2 4
T31
5A
5n
M (
log 2
rati
o v
s 0
nM
)
Bcr-Abl wild-type 5nM (log2 ratio vs 0nM)
B
C D
Fig. S3. Comparison of dasatinib dose response results using wild-type Bcr-Abl (p210) versus dasatinib-resistant T315A Bcr-Abl.
(A) In Ba/F3 cells expressing wild-type Bcr-Abl (p210) treated with 5 nM dasatinib, both Bcr-Abl and the endogenous Src family kinases (SFKs)
are expected to be inhibited. Whereas in cells expressing the T315A isoform of Bcr-Abl, SFKs will be inhibited at low doses (5 nM) and Bcr-Abl
at higher doses (500 nM). The indicated Bcr-Abl IC50s are from (2 ) and the Bcr-Abl and SFK binding constants (Kd) from (3,4 ). (B) In
T315A-transformed cells, phosphorylation events sensitive to low dose dasatinib (5 nM; anticipated SFK substrates; y-axis) are not correlated to
events sensitive to high dose dasatinib (500 nM; anticipated Bcr-Abl T315A substrates; x-axis). R, Pearson correlation coefficient. (C) A similar
lack of correlation is seen when the anticipated Bcr-Abl substrates (x-axis) are identified by treatment of wild-type Bcr-Abl transformed cells with
low (5 nM) doses of dasatinib. The anticipated SFK substrates (y-axis) are identified as in panel B. 90 of the 155 phosphopeptides observed in
the T315A experiments were also seen in the Bcr-Abl wild-type experiment. (D) The responses of anticipated Bcr-Abl substrates are correlated
when these substrates are defined by either low dose (5 nM) treatment of sensitive wild-type cells (x-axis) or high dose (500 nM) treatment of
resistant T315A-expressing cells (y-axis).
Bcr-Abl
isoform
dasatinib
dose
Anticipated responsive
substrates
Bcr-Abl SFK(Kd 0.2-0.8 nM)
wild-type(Kd 0.5 nM;
IC50 1.3 nM)
5 nM (low)
T315A(IC50 125 nM)
5 nM (low)
500 nM (high)
A
n=155
R=0.15
n=90
R=0.05n=90
R=0.85
-
1.E-08
1.E-07
1.E-06
1.E-05
1.E-04
1.E-03
1.E-02
1.E-01
1.E+00
com
bin
ed
dru
g
ove
rexp
r.
com
bin
ed
dru
g
ove
rexp
r.
com
bin
ed
dru
g
ove
rexp
r.
motif PPI substrate
hyp
erg
eo
me
tric
p-v
alu
e
SFK
Abl
permutation
p-value 0.05
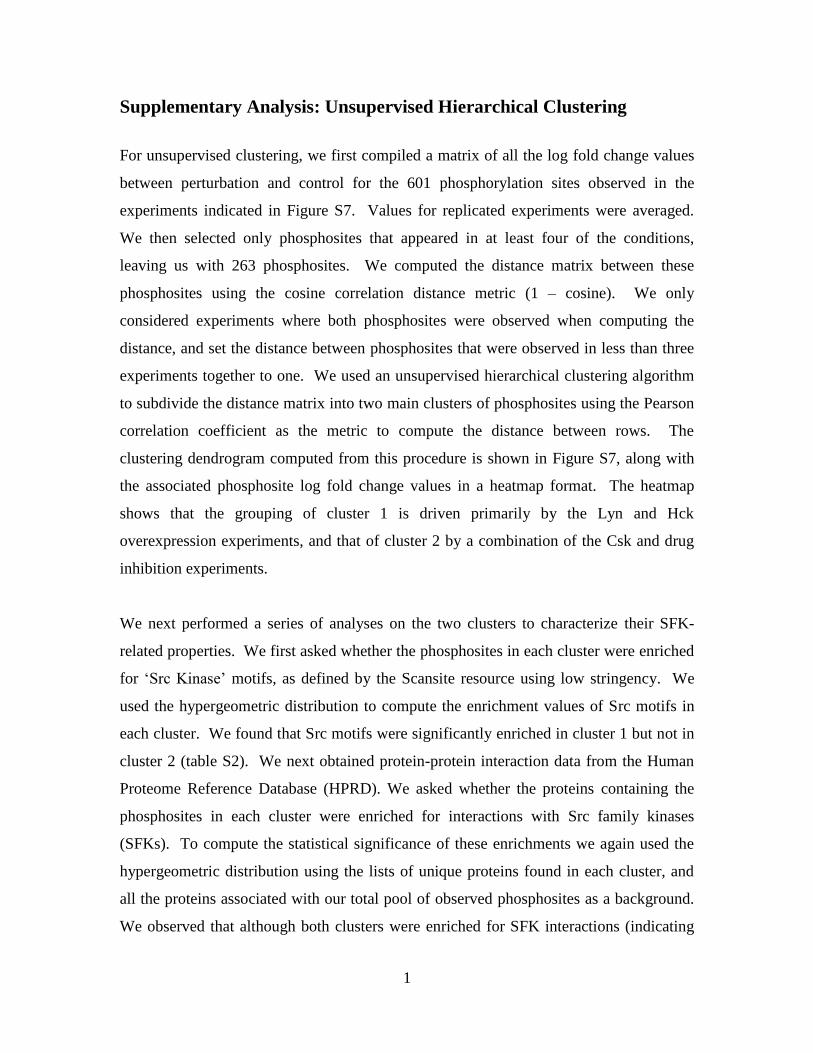
Fig. S4. SFK-related properties are more enriched than Abl-related properties when phosphorylation events are ranked by
their SFK perturbation response score. Hypergeometric distribution p-values for the likelihood of the observed enrichment of
phosphosites or proteins at the top of our SFK perturbation response score-ranked lists with the indicated SFK-related or Abl-related
property, as described in Figure 3B. Enrichment analysis was performed after ranking phosphosite lists or protein lists by their
perturbation scores using either both the drug and overexpression-based perturbation experiments or subsets of experiments as
indicated. As in Figure 3B, the presence of Src and Abl motifs was determined with Scansite, and protein-protein interactions (PPIs)
and kinase substrates were defined by the Human Protein Resource Database (HPRD). In the HPRD database, SFK substrates are
a subset of the SFK PPI set. The red dotted line indicates the approximate point (0.01) where the hypergeometric distribution results
yield a permutation analysis-based p-value of 0.05 (see Materials and Methods). Overall, the experimental design of perturbations
targeted at SFKs preferentially enriches for SFK-related properties relative to Abl-related properties.

Fig. S5. The network of PPIs between the 40 proteins associated with the top-ranked SFK perturbation-correlated
phosphosites (red nodes) and the 40 proteins with the smallest change in response to SFK
This is the same network as shown in Figure 3D but with nodes labeled with protein names. The white nodes indicate
proteins added by the Ingenuity Pathway Analysis algorithm to complete the network using a maximal number of red and
grey input proteins. Note that the SFK-correlated proteins (red) are more closely linked to SFKs (circled in purple) and to each other,
then are the unchanging proteins (grey), particularly within the region of the network with a higher density of links.
perturbation (grey).
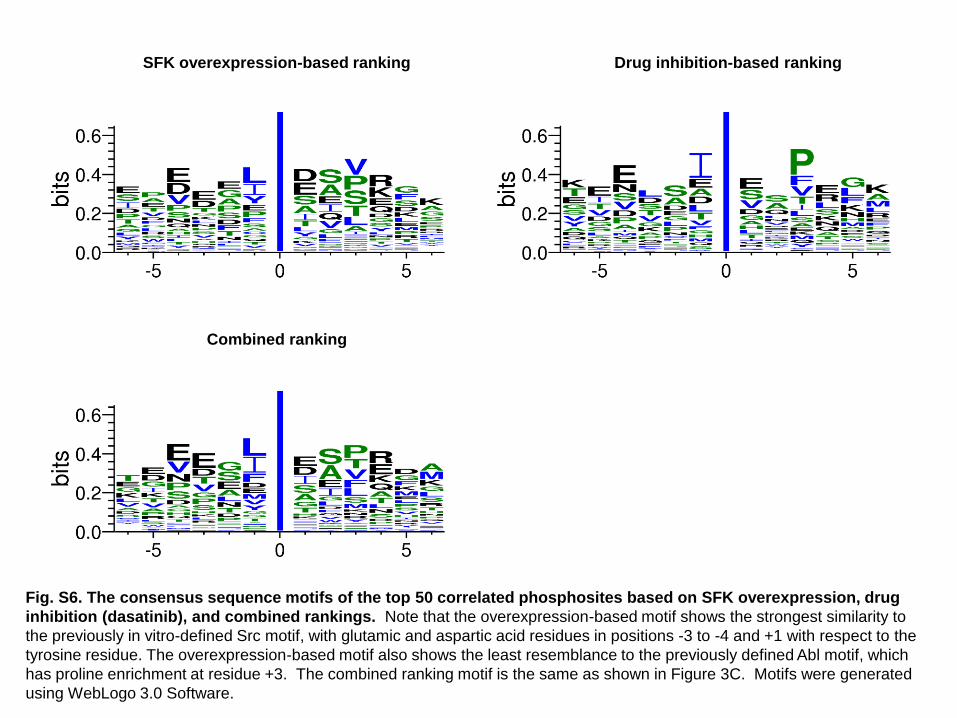
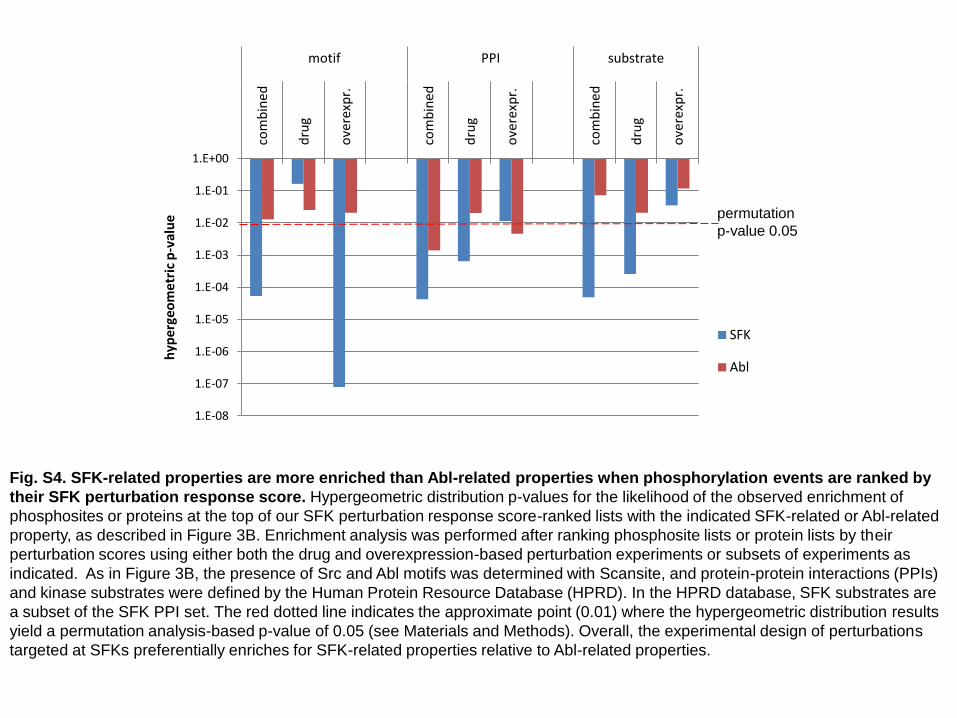
Fig. S6. The consensus sequence motifs of the top 50 correlated phosphosites based on SFK overexpression, drug
inhibition (dasatinib), and combined rankings. Note that the overexpression-based motif shows the strongest similarity to
the previously in vitro-defined Src motif, with glutamic and aspartic acid residues in positions -3 to -4 and +1 with respect to the
tyrosine residue. The overexpression-based motif also shows the least resemblance to the previously defined Abl motif, which
has proline enrichment at residue +3. The combined ranking motif is the same as shown in Figure 3C. Motifs were generated
using WebLogo 3.0 Software.
SFK overexpression-based ranking
Combined ranking
Drug inhibition-based ranking
Cluster 1
Cluster 2
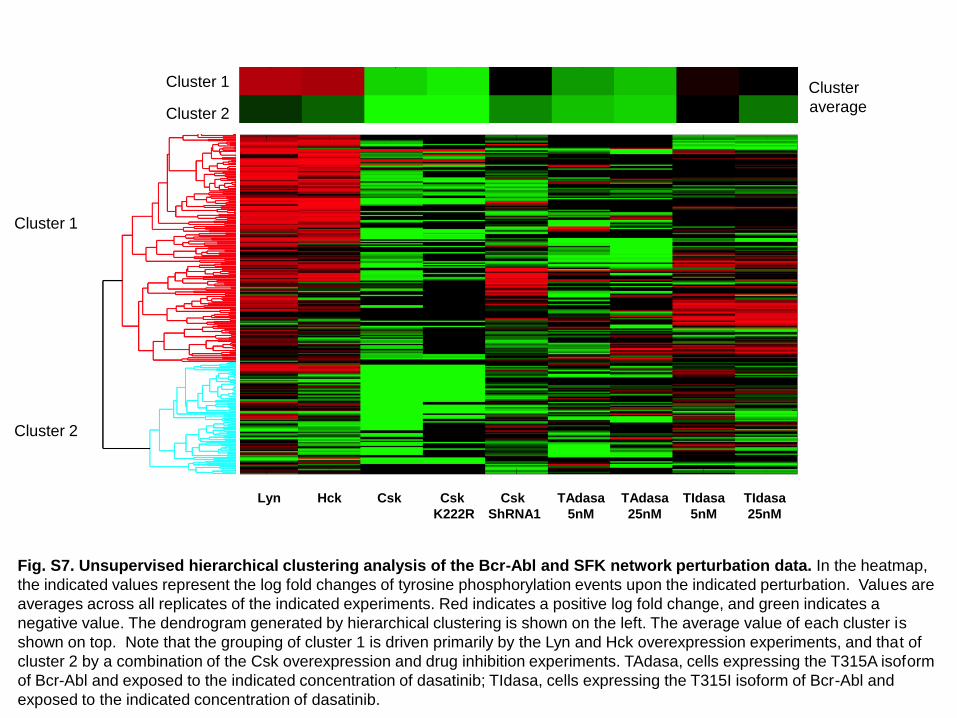
Fig. S7. Unsupervised hierarchical clustering analysis of the Bcr-Abl and SFK network perturbation data. In the heatmap,
the indicated values represent the log fold changes of tyrosine phosphorylation events upon the indicated perturbation. Values are
averages across all replicates of the indicated experiments. Red indicates a positive log fold change, and green indicates a
negative value. The dendrogram generated by hierarchical clustering is shown on the left. The average value of each cluster is
shown on top. Note that the grouping of cluster 1 is driven primarily by the Lyn and Hck overexpression experiments, and that of
cluster 2 by a combination of the Csk overexpression and drug inhibition experiments. TAdasa, cells expressing the T315A isoform
of Bcr-Abl and exposed to the indicated concentration of dasatinib; TIdasa, cells expressing the T315I isoform of Bcr-Abl and
exposed to the indicated concentration of dasatinib.
Lyn Hck Csk Csk
K222R
Csk
ShRNA1
TAdasa
5nM
TAdasa
25nM
TIdasa
25nM
TIdasa
5nM
Cluster
average
Cluster 2
Cluster 1
-pSrcY416
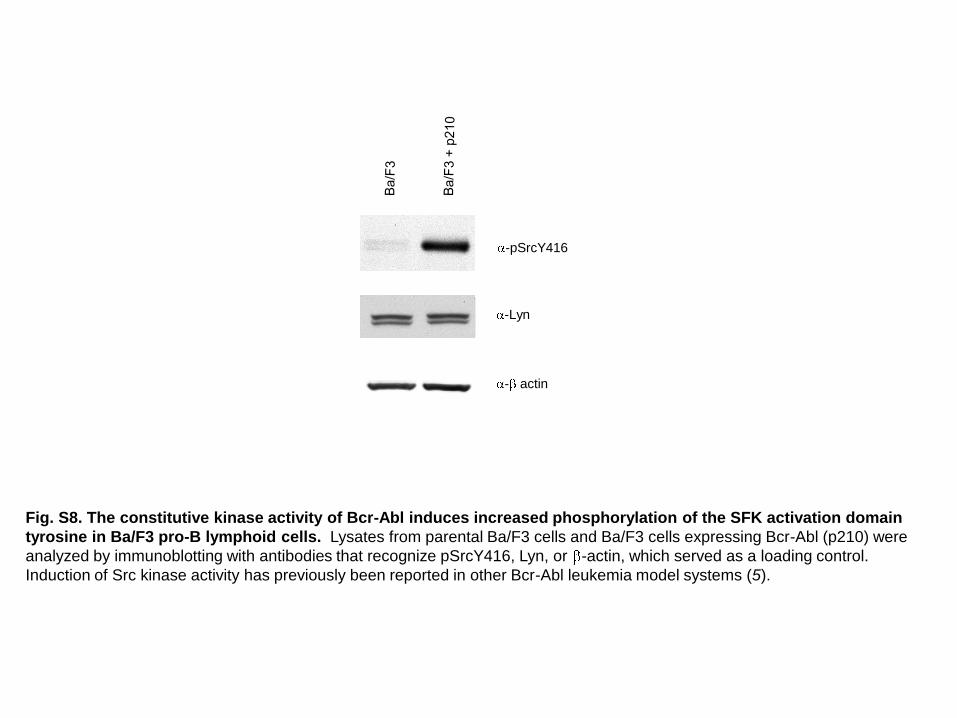
Fig. S8. The constitutive kinase activity of Bcr-Abl induces increased phosphorylation of the SFK activation domain
tyrosine in Ba/F3 pro-B lymphoid cells. Lysates from parental Ba/F3 cells and Ba/F3 cells expressing Bcr-Abl (p210) were
analyzed by immunoblotting with antibodies that recognize pSrcY416, Lyn, or -actin, which served as a loading control.
Induction of Src kinase activity has previously been reported in other Bcr-Abl leukemia model systems (5).
-Lyn
- actin

Fig. S9. Stable Csk knockdown in Ba/F3 Bcr-Abl (p210) cells. MicroRNA-adapted hairpins (shRNAmir) were used to stably
knockdown Csk in Ba/F3 Bcr-Abl (p210) cells (see Materials and Methods). Lysates from the Ba/F3 Bcr-Abl control cells (p210)
and the Csk knockdown cells (p210 + Csk shRNA, using two different hairpin sequences) were probed with the indicated
antibodies.
-Csk
-Src pY416
-actin
-Src pY527
0 60 120
Imatinib
2.5 M
-pSrcY416 -pSrcY527
-actin
0 60 120
A
-actin
Imatinib
2.5 M
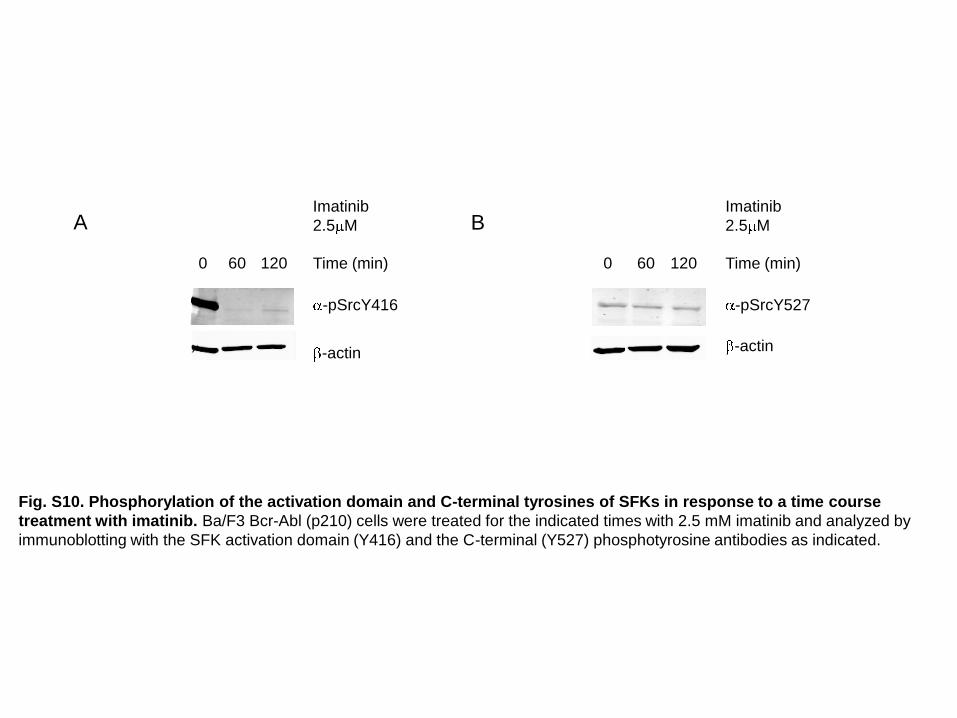
Fig. S10. Phosphorylation of the activation domain and C-terminal tyrosines of SFKs in response to a time course
treatment with imatinib. Ba/F3 Bcr-Abl (p210) cells were treated for the indicated times with 2.5 mM imatinib and analyzed by
immunoblotting with the SFK activation domain (Y416) and the C-terminal (Y527) phosphotyrosine antibodies as indicated.
Time (min) Time (min)
B

time
m / z 1. Chromatographic alignment
using a time warping
algorithm
2. Peptide peak identification
by MS2 sequencing
3. Peptide peak identification
by alignment
4. Quantitation of peak area by integration
time
m / z
Sample 1
Sample 2
Scan # (sample 1)Sca
n #
(sam
ple
2)
5. Manual inspection and correction of mis-aligned or mis-integrated peaks
0
50000
100000
150000
200000
250000
300000
350000
400000
2630 2640 2650 2660 2670 2680 2690 2700 2710 2720Time (secs)
0
50000
100000
150000
200000
250000
300000
350000
400000
2630 2640 2650 2660 2670 2680 2690 2700 2710 27200
50000
100000
150000
200000
250000
300000
350000
400000
2630 2640 2650 2660 2670 2680 2690 2700 2710 2720
inte
nsity
0
50000
100000
150000
200000
250000
300000
350000
400000
2630 2640 2650 2660 2670 2680 2690 2700 2710 2720Time (secs)
0
50000
100000
150000
200000
250000
300000
350000
400000
2630 2640 2650 2660 2670 2680 2690 2700 2710 27200
50000
100000
150000
200000
250000
300000
350000
400000
2630 2640 2650 2660 2670 2680 2690 2700 2710 2720
inte
nsity
200 400 600 800 1000 1200 1400 1600 1800 2000
m/z
0
5
10
15
20
25
30
35
40
45
50
55
60
65
70
75
80
85
90
95
100
Rela
tive
Ab
un
da
nce
745.65
646.02
1017.72
610.81901.50
797.05446.47 1074.92
1293.15376.37 1404.47 1799.711563.59
Fig. S11. M alignment and quantitation analysis pipeline and representative examples.
Fig. S11A. Mass spectrometry alignment and quantitation analysis pipeline. (Step 1) The chromatogram elution profiles of all samples are time-
axis pairwise aligned using a time warping algorithm (6 ). (Step 2) Peptide peaks are sequence identified using MS2 collision spectra. (Step 3)
Peptide peaks sequenced in some samples but not others are located in the remaining samples by the MS scan alignment mappings. (Step 4)
Relative quantitation is determined by integrating the area under the curve. (Step 5) Integration results are checked and corrected both
computationally and manually to ensure quality control. The following figure panels illustrate representative examples of the quantitation results.
S

Phosphopeptide: R.APTSTDTPIpYSQVAPR.A (Ptpn18 Y381)
Run #1
Run#2
p210 p210+Lyn p210+Hck p210+Csk
Peak Area (run#1) 154916571 534386308 329501746 315342604
Peak Area (run#2) 155258210 557487525 327206361 325152542
Average 155087390 545936916 328354053 320247573
Fold ratio (with p210) 1 3.52 2.11 2.06
p210+Csk
0
5e+06
1e+07
1.5e+07
2e+07
2.5e+07
3e+07
2050 2100 2150 2200 2250time(secs)
0
5e+06
1e+07
1.5e+07
2e+07
2.5e+07
3e+07
2050 2100 2150 2200 2250time(secs)
0
5e+06
1e+07
1.5e+07
2e+07
2.5e+07
3e+07
2050 2100 2150 2200 2250time(secs)
0
5e+06
1e+07
1.5e+07
2e+07
2.5e+07
3e+07
2050 2100 2150 2200 2250time(secs)
0
5e+06
1e+07
1.5e+07
2e+07
2.5e+07
3e+07
2050 2100 2150 2200 2250time(secs)
0
5e+06
1e+07
1.5e+07
2e+07
2.5e+07
3e+07
2050 2100 2150 2200 2250time(secs)
p210
0
5e+06
1e+07
1.5e+07
2e+07
2.5e+07
3e+07
2050 2100 2150 2200 2250time(secs)
0
5e+06
1e+07
1.5e+07
2e+07
2.5e+07
3e+07
2050 2100 2150 2200 2250time(secs)
0
5e+06
1e+07
1.5e+07
2e+07
2.5e+07
3e+07
2050 2100 2150 2200 2250time(secs)
0
5e+06
1e+07
1.5e+07
2e+07
2.5e+07
3e+07
2050 2100 2150 2200 225time(secs)
0
5e+06
1e+07
1.5e+07
2e+07
2.5e+07
3e+07
2050 2100 2150 2200 225time(secs)
0
5e+06
1e+07
1.5e+07
2e+07
2.5e+07
3e+07
2050 2100 2150 2200 225time(secs)
p210+Lyn
0
5e+06
1e+07
1.5e+07
2e+07
2.5e+07
3e+07
2050 2100 2150 2200 225time(secs)
0
5e+06
1e+07
1.5e+07
2e+07
2.5e+07
3e+07
2050 2100 2150 2200 225time(secs)
0
5e+06
1e+07
1.5e+07
2e+07
2.5e+07
3e+07
2050 2100 2150 2200 225time(secs)
0
5e+06
1e+07
1.5e+07
2e+07
2.5e+07
3e+07
2050 2100 2150 2200 225time(secs)
0
5e+06
1e+07
1.5e+07
2e+07
2.5e+07
3e+07
2050 2100 2150 2200 225time(secs)
0
5e+06
1e+07
1.5e+07
2e+07
2.5e+07
3e+07
2050 2100 2150 2200 225time(secs)
p210+Hck
0
5e+06
1e+07
1.5e+07
2e+07
2.5e+07
3e+07
2050 2100 2150 2200 2250time(secs)
0
5e+06
1e+07
1.5e+07
2e+07
2.5e+07
3e+07
2050 2100 2150 2200 2250time(secs)
0
5e+06
1e+07
1.5e+07
2e+07
2.5e+07
3e+07
2050 2100 2150 2200 2250time(secs)
inte
nsity
inte
nsity
inte
nsity
inte
nsity
inte
nsity
inte
nsity
inte
nsity
inte
nsity
0
5e+06
1e+07
1.5e+07
2e+07
2.5e+07
3e+07
2050 2100 2150 2200 2250time(secs)
0
5e+06
1e+07
1.5e+07
2e+07
2.5e+07
3e+07
2050 2100 2150 2200 2250time(secs)
0
5e+06
1e+07
1.5e+07
2e+07
2.5e+07
3e+07
2050 2100 2150 2200 2250time(secs)
Fig. S11B. M alignment and quantitation analysis example Ptpn18 Y381. S
Bcr-Abl T315I
25Dasatinib (nM)
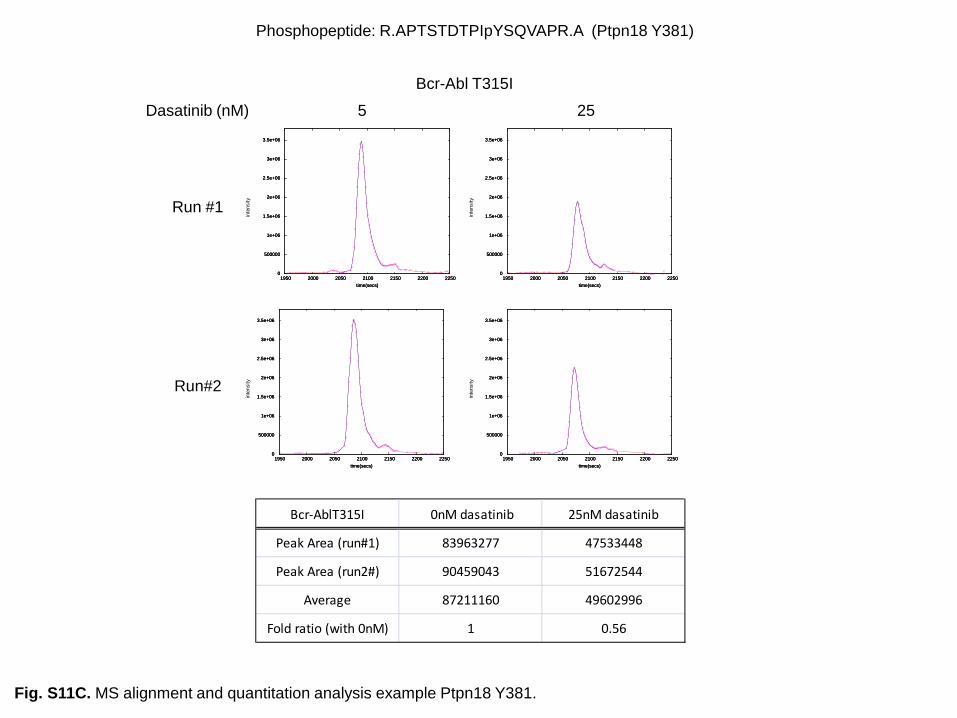
Bcr-AblT315I 0nM dasatinib 25nM dasatinib
Peak Area (run#1) 83963277 47533448
Peak Area (run2#) 90459043 51672544
Average 87211160 49602996
Fold ratio (with 0nM) 1 0.56
0
500000
1e+06
1.5e+06
2e+06
2.5e+06
3e+06
3.5e+06
1950 2000 2050 2100 2150 2200 2250time(secs)
0
500000
1e+06
1.5e+06
2e+06
2.5e+06
3e+06
3.5e+06
1950 2000 2050 2100 2150 2200 2250time(secs)
0
500000
1e+06
1.5e+06
2e+06
2.5e+06
3e+06
3.5e+06
1950 2000 2050 2100 2150 2200 2250time(secs)
0
500000
1e+06
1.5e+06
2e+06
2.5e+06
3e+06
3.5e+06
1950 2000 2050 2100 2150 2200 2250time(secs)
0
500000
1e+06
1.5e+06
2e+06
2.5e+06
3e+06
3.5e+06
1950 2000 2050 2100 2150 2200 2250time(secs)
0
500000
1e+06
1.5e+06
2e+06
2.5e+06
3e+06
3.5e+06
1950 2000 2050 2100 2150 2200 2250time(secs)
0
500000
1e+06
1.5e+06
2e+06
2.5e+06
3e+06
3.5e+06
1950 2000 2050 2100 2150 2200 2250time(secs)
0
500000
1e+06
1.5e+06
2e+06
2.5e+06
3e+06
3.5e+06
1950 2000 2050 2100 2150 2200 2250time(secs)
0
500000
1e+06
1.5e+06
2e+06
2.5e+06
3e+06
3.5e+06
1950 2000 2050 2100 2150 2200 2250time(secs)
0
500000
1e+06
1.5e+06
2e+06
2.5e+06
3e+06
3.5e+06
1950 2000 2050 2100 2150 2200 2250time(secs)
0
500000
1e+06
1.5e+06
2e+06
2.5e+06
3e+06
3.5e+06
1950 2000 2050 2100 2150 2200 2250time(secs)
0
500000
1e+06
1.5e+06
2e+06
2.5e+06
3e+06
3.5e+06
1950 2000 2050 2100 2150 2200 2250time(secs)
Run #1
Run#2
inte
nsity
inte
nsity
inte
nsity
inte
nsity
Phosphopeptide: R.APTSTDTPIpYSQVAPR.A (Ptpn18 Y381)
5
Fig. S11C. M alignment and quantitation analysis example Ptpn18 Y381.S
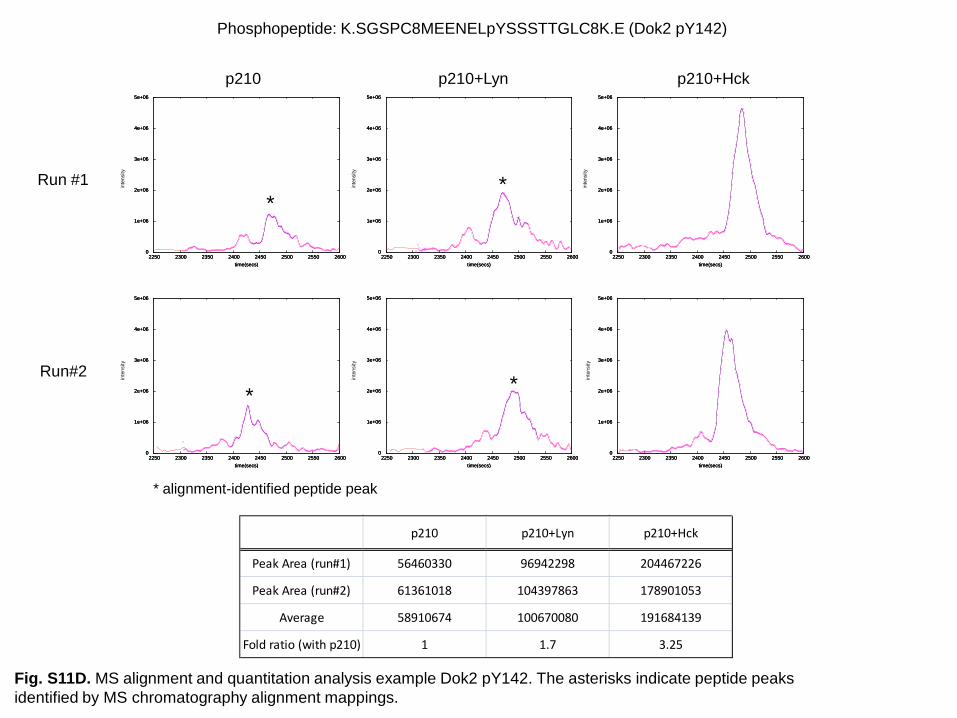
Phosphopeptide: K.SGSPC8MEENELpYSSSTTGLC8K.E (Dok2 pY142)
p210 p210+Lyn p210+Hck
p210 p210+Lyn p210+Hck
Peak Area (run#1) 56460330 96942298 204467226
Peak Area (run#2) 61361018 104397863 178901053
Average 58910674 100670080 191684139
Fold ratio (with p210) 1 1.7 3.25
Run #1
Run#2
0
1e+06
2e+06
3e+06
4e+06
5e+06
2250 2300 2350 2400 2450 2500 2550 2600time(secs)
0
1e+06
2e+06
3e+06
4e+06
5e+06
2250 2300 2350 2400 2450 2500 2550 2600time(secs)
0
1e+06
2e+06
3e+06
4e+06
5e+06
2250 2300 2350 2400 2450 2500 2550 2600time(secs)
0
1e+06
2e+06
3e+06
4e+06
5e+06
2250 2300 2350 2400 2450 2500 2550 2600time(secs)
0
1e+06
2e+06
3e+06
4e+06
5e+06
2250 2300 2350 2400 2450 2500 2550 2600time(secs)
0
1e+06
2e+06
3e+06
4e+06
5e+06
2250 2300 2350 2400 2450 2500 2550 2600time(secs)
*
*
0
1e+06
2e+06
3e+06
4e+06
5e+06
2250 2300 2350 2400 2450 2500 2550 2600time(secs)
0
1e+06
2e+06
3e+06
4e+06
5e+06
2250 2300 2350 2400 2450 2500 2550 2600time(secs)
0
1e+06
2e+06
3e+06
4e+06
5e+06
2250 2300 2350 2400 2450 2500 2550 2600time(secs)
0
1e+06
2e+06
3e+06
4e+06
5e+06
2250 2300 2350 2400 2450 2500 2550 2600time(secs)
0
1e+06
2e+06
3e+06
4e+06
5e+06
2250 2300 2350 2400 2450 2500 2550 2600time(secs)
0
1e+06
2e+06
3e+06
4e+06
5e+06
2250 2300 2350 2400 2450 2500 2550 2600time(secs)
0
1e+06
2e+06
3e+06
4e+06
5e+06
2250 2300 2350 2400 2450 2500 2550 2600time(secs)
0
1e+06
2e+06
3e+06
4e+06
5e+06
2250 2300 2350 2400 2450 2500 2550 2600time(secs)
0
1e+06
2e+06
3e+06
4e+06
5e+06
2250 2300 2350 2400 2450 2500 2550 2600time(secs)
0
1e+06
2e+06
3e+06
4e+06
5e+06
2250 2300 2350 2400 2450 2500 2550 2600time(secs)
0
1e+06
2e+06
3e+06
4e+06
5e+06
2250 2300 2350 2400 2450 2500 2550 2600time(secs)
0
1e+06
2e+06
3e+06
4e+06
5e+06
2250 2300 2350 2400 2450 2500 2550 2600time(secs)
*
*inte
nsity
inte
nsity
inte
nsity
inte
nsity
inte
nsity
inte
nsity
* alignment-identified peptide peak
Fig. S11D. M lignment and quantitation analysis example Dok2 pY142. The asterisks indicate peptide peaks identified by MS chromatography alignment mappings.
S a
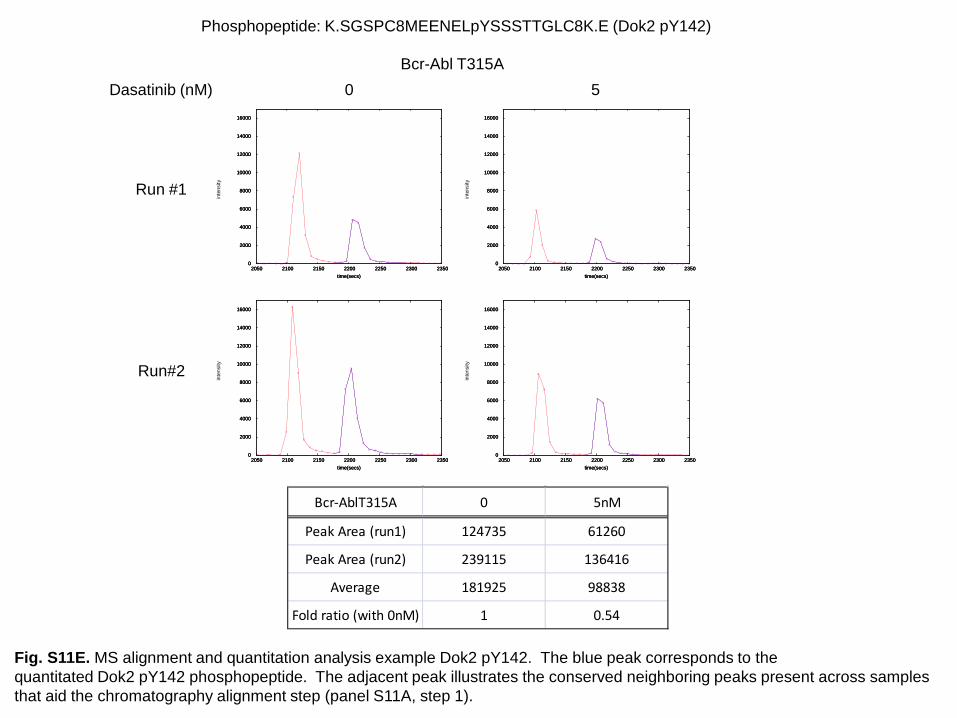
Dasatinib (nM)Bcr-Abl T315A
5
Bcr-AblT315A 0 5nM
Peak Area (run1) 124735 61260
Peak Area (run2) 239115 136416
Average 181925 98838
Fold ratio (with 0nM) 1 0.54
Phosphopeptide: K.SGSPC8MEENELpYSSSTTGLC8K.E (Dok2 pY142)
0
2000
4000
6000
8000
10000
12000
14000
16000
2050 2100 2150 2200 2250 2300 2350time(secs)
0
2000
4000
6000
8000
10000
12000
14000
16000
2050 2100 2150 2200 2250 2300 2350time(secs)
0
2000
4000
6000
8000
10000
12000
14000
16000
2050 2100 2150 2200 2250 2300 2350time(secs)
0
2000
4000
6000
8000
10000
12000
14000
16000
2050 2100 2150 2200 2250 2300 2350time(secs)
0
2000
4000
6000
8000
10000
12000
14000
16000
2050 2100 2150 2200 2250 2300 2350time(secs)
0
2000
4000
6000
8000
10000
12000
14000
16000
2050 2100 2150 2200 2250 2300 2350time(secs)
0
2000
4000
6000
8000
10000
12000
14000
16000
2050 2100 2150 2200 2250 2300 2350time(secs)
0
2000
4000
6000
8000
10000
12000
14000
16000
2050 2100 2150 2200 2250 2300 2350time(secs)
0
2000
4000
6000
8000
10000
12000
14000
16000
2050 2100 2150 2200 2250 2300 2350time(secs)
0
2000
4000
6000
8000
10000
12000
14000
16000
2050 2100 2150 2200 2250 2300 2350time(secs)
0
2000
4000
6000
8000
10000
12000
14000
16000
2050 2100 2150 2200 2250 2300 2350time(secs)
0
2000
4000
6000
8000
10000
12000
14000
16000
2050 2100 2150 2200 2250 2300 2350time(secs)
Run #1
Run#2
inte
nsity
inte
nsity
inte
nsity
inte
nsity
0
Fig. S11E. M alignment and quantitation analysis example Dok2 pY142. The blue peak corresponds to the quantitated Dok2 pY142 phosphopeptide. The adjacent peak illustrates the conserved neighboring peaks present across samples that aid the chromatography alignment step (panel S11A, step 1).
S

Phosphopeptide R.AGEEHVpYSFPNK.Q (Paxillin pY118)
p210 p210+Lyn p210+Hck p210+Csk
p210 p210+Lyn p210+Hck p210+Csk
Peak Area (run1) 4138067 7290262 10012332 24147421
Peak Area (run2) 3574854 7939715 8265635 24842101
Average 3856460 7614988 9138983 24494761
Fold ratio (with p210) 1 1.97 2.36 6.35
0
200000
400000
600000
800000
1e+06
1.2e+06
1600 1650 1700 1750 1800 1850 1900time(secs)
0
200000
400000
600000
800000
1e+06
1.2e+06
1600 1650 1700 1750 1800 1850 1900time(secs)
0
200000
400000
600000
800000
1e+06
1.2e+06
1600 1650 1700 1750 1800 1850 1900time(secs)
0
200000
400000
600000
800000
1e+06
1.2e+06
1600 1650 1700 1750 1800 1850 1900time(secs)
0
200000
400000
600000
800000
1e+06
1.2e+06
1600 1650 1700 1750 1800 1850 1900time(secs)
0
200000
400000
600000
800000
1e+06
1.2e+06
1600 1650 1700 1750 1800 1850 1900time(secs)
Run #1
Run#2
inte
nsity
inte
nsity
*
*
0
200000
400000
600000
800000
1e+06
1.2e+06
1600 1650 1700 1750 1800 1850 1900time(secs)
0
200000
400000
600000
800000
1e+06
1.2e+06
1600 1650 1700 1750 1800 1850 1900time(secs)
0
200000
400000
600000
800000
1e+06
1.2e+06
1600 1650 1700 1750 1800 1850 1900time(secs)
0
200000
400000
600000
800000
1e+06
1.2e+06
1600 1650 1700 1750 1800 1850 1900time(secs)
0
200000
400000
600000
800000
1e+06
1.2e+06
1600 1650 1700 1750 1800 1850 1900time(secs)
0
200000
400000
600000
800000
1e+06
1.2e+06
1600 1650 1700 1750 1800 1850 1900time(secs)
*
*
inte
nsity
inte
nsity
0
200000
400000
600000
800000
1e+06
1.2e+06
1600 1650 1700 1750 1800 1850 1900time(secs)
0
200000
400000
600000
800000
1e+06
1.2e+06
1600 1650 1700 1750 1800 1850 1900time(secs)
0
200000
400000
600000
800000
1e+06
1.2e+06
1600 1650 1700 1750 1800 1850 1900time(secs)
0
200000
400000
600000
800000
1e+06
1.2e+06
1600 1650 1700 1750 1800 1850 1900time(secs)
0
200000
400000
600000
800000
1e+06
1.2e+06
1600 1650 1700 1750 1800 1850 1900time(secs)
0
200000
400000
600000
800000
1e+06
1.2e+06
1600 1650 1700 1750 1800 1850 1900time(secs)
*
* 0
200000
400000
600000
800000
1e+06
1.2e+06
1600 1650 1700 1750 1800 1850 1900time(secs)
0
200000
400000
600000
800000
1e+06
1.2e+06
1600 1650 1700 1750 1800 1850 1900time(secs)
0
200000
400000
600000
800000
1e+06
1.2e+06
1600 1650 1700 1750 1800 1850 1900time(secs)
0
200000
400000
600000
800000
1e+06
.2e+06
1600 1650 1700 1750 1800 1850 1900time(secs)
0
200000
400000
600000
800000
1e+06
.2e+06
1600 1650 1700 1750 1800 1850 1900time(secs)
0
200000
400000
600000
800000
1e+06
.2e+06
1600 1650 1700 1750 1800 1850 1900time(secs)
inte
nsity
inte
nsity
inte
nsity
inte
nsity
* alignment-identified peptide peak
Fig. S11F. M alignment and quantitation analysis example Paxillin pY118.S
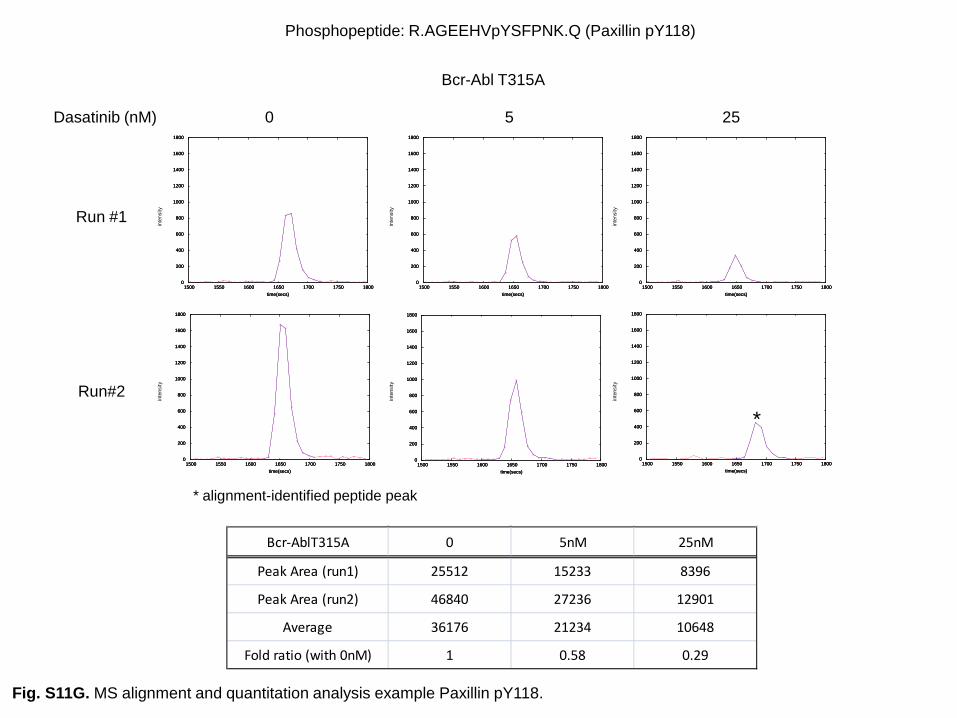
Phosphopeptide: R.AGEEHVpYSFPNK.Q (Paxillin pY118)
Dasatinib (nM)
Bcr-Abl T315A
255
Bcr-AblT315A 0 5nM 25nM
Peak Area (run1) 25512 15233 8396
Peak Area (run2) 46840 27236 12901
Average 36176 21234 10648
Fold ratio (with 0nM) 1 0.58 0.29
0
200
400
600
800
1000
1200
1400
1600
1800
1500 1550 1600 1650 1700 1750 1800time(secs)
0
200
400
600
800
1000
1200
1400
1600
1800
1500 1550 1600 1650 1700 1750 1800time(secs)
0
200
400
600
800
1000
1200
1400
1600
1800
1500 1550 1600 1650 1700 1750 1800time(secs)
0
200
400
600
800
1000
1200
1400
1600
1800
1500 1550 1600 1650 1700 1750 1800time(secs)
0
200
400
600
800
1000
1200
1400
1600
1800
1500 1550 1600 1650 1700 1750 1800time(secs)
0
200
400
600
800
1000
1200
1400
1600
1800
1500 1550 1600 1650 1700 1750 1800time(secs)
0
200
400
600
800
1000
1200
1400
1600
1800
1500 1550 1600 1650 1700 1750 1800time(secs)
0
200
400
600
800
1000
1200
1400
1600
1800
1500 1550 1600 1650 1700 1750 1800time(secs)
0
200
400
600
800
1000
1200
1400
1600
1800
1500 1550 1600 1650 1700 1750 1800time(secs)
0
200
400
600
800
1000
1200
1400
1600
1800
1500 1550 1600 1650 1700 1750 1800time(secs)
0
200
400
600
800
1000
1200
1400
1600
1800
1500 1550 1600 1650 1700 1750 1800time(secs)
0
200
400
600
800
1000
1200
1400
1600
1800
1500 1550 1600 1650 1700 1750 1800time(secs)
0
200
400
600
800
1000
1200
1400
1600
1800
1500 1550 1600 1650 1700 1750 1800time(secs)
0
200
400
600
800
1000
1200
1400
1600
1800
1500 1550 1600 1650 1700 1750 1800time(secs)
0
200
400
600
800
1000
1200
1400
1600
1800
1500 1550 1600 1650 1700 1750 1800time(secs)
0
200
400
600
800
1000
1200
1400
1600
1800
1500 1550 1600 1650 1700 1750 1800time(secs)
0
200
400
600
800
1000
1200
1400
1600
1800
1500 1550 1600 1650 1700 1750 1800time(secs)
0
200
400
600
800
1000
1200
1400
1600
1800
1500 1550 1600 1650 1700 1750 1800time(secs)
*
Run #1
Run#2
inte
nsity
inte
nsity
inte
nsity
inte
nsity
inte
nsity
inte
nsity
0
* alignment-identified peptide peak
Fig. S11G. M alignment and quantitation analysis example Paxillin pY118.S
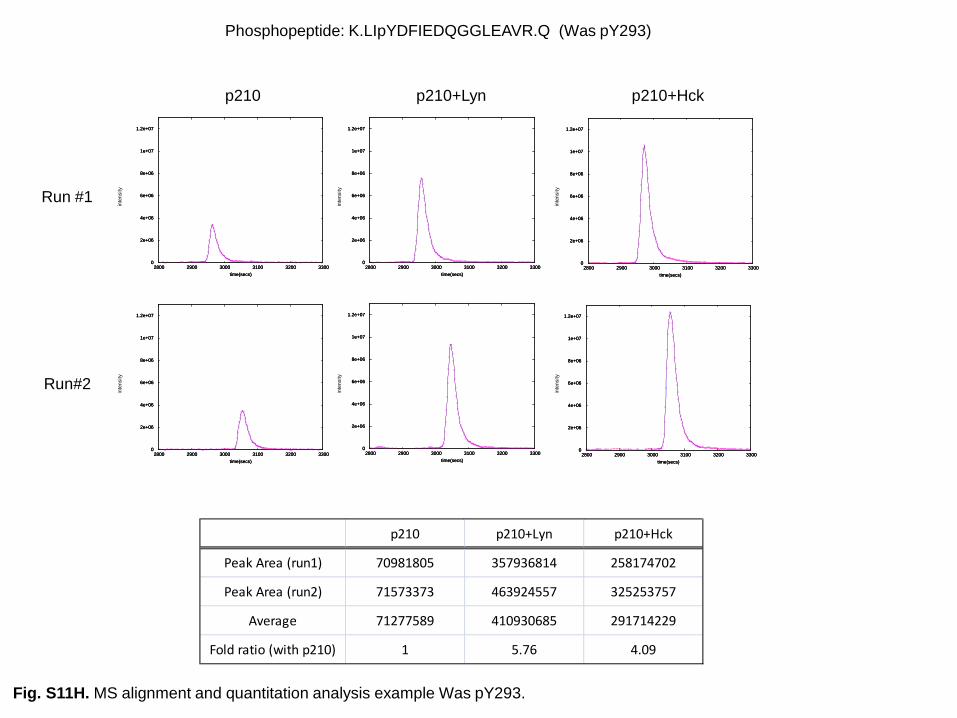
p210 p210+Lyn p210+Hck
Phosphopeptide: K.LIpYDFIEDQGGLEAVR.Q (Was pY293)
p210 p210+Lyn p210+Hck
Peak Area (run1) 70981805 357936814 258174702
Peak Area (run2) 71573373 463924557 325253757
Average 71277589 410930685 291714229
Fold ratio (with p210) 1 5.76 4.09
0
2e+06
4e+06
6e+06
8e+06
1e+07
1.2e+07
2800 2900 3000 3100 3200 3300time(secs)
0
2e+06
4e+06
6e+06
8e+06
1e+07
1.2e+07
2800 2900 3000 3100 3200 3300time(secs)
0
2e+06
4e+06
6e+06
8e+06
1e+07
1.2e+07
2800 2900 3000 3100 3200 3300time(secs)
0
2e+06
4e+06
6e+06
8e+06
1e+07
1.2e+07
2800 2900 3000 3100 3200 3300time(secs)
0
2e+06
4e+06
6e+06
8e+06
1e+07
1.2e+07
2800 2900 3000 3100 3200 3300time(secs)
0
2e+06
4e+06
6e+06
8e+06
1e+07
1.2e+07
2800 2900 3000 3100 3200 3300time(secs)
0
2e+06
4e+06
6e+06
8e+06
1e+07
1.2e+07
2800 2900 3000 3100 3200 3300time(secs)
0
2e+06
4e+06
6e+06
8e+06
1e+07
1.2e+07
2800 2900 3000 3100 3200 3300time(secs)
0
2e+06
4e+06
6e+06
8e+06
1e+07
1.2e+07
2800 2900 3000 3100 3200 3300time(secs)
0
2e+06
4e+06
6e+06
8e+06
1e+07
1.2e+07
2800 2900 3000 3100 3200 3300time(secs)
0
2e+06
4e+06
6e+06
8e+06
1e+07
1.2e+07
2800 2900 3000 3100 3200 3300time(secs)
0
2e+06
4e+06
6e+06
8e+06
1e+07
1.2e+07
2800 2900 3000 3100 3200 3300time(secs)
0
2e+06
4e+06
6e+06
8e+06
1e+07
1.2e+07
2800 2900 3000 3100 3200 3300time(secs)
0
2e+06
4e+06
6e+06
8e+06
1e+07
1.2e+07
2800 2900 3000 3100 3200 3300time(secs)
0
2e+06
4e+06
6e+06
8e+06
1e+07
1.2e+07
2800 2900 3000 3100 3200 3300time(secs)
0
2e+06
4e+06
6e+06
8e+06
1e+07
1.2e+07
2800 2900 3000 3100 3200 3300time(secs)
0
2e+06
4e+06
6e+06
8e+06
1e+07
1.2e+07
2800 2900 3000 3100 3200 3300time(secs)
0
2e+06
4e+06
6e+06
8e+06
1e+07
1.2e+07
2800 2900 3000 3100 3200 3300time(secs)
Run #1
Run#2
inte
nsity
inte
nsity
inte
nsity
inte
nsity
inte
nsity
inte
nsity
Fig. S11H. M lignment and quantitation analysis example Was pY293.S a
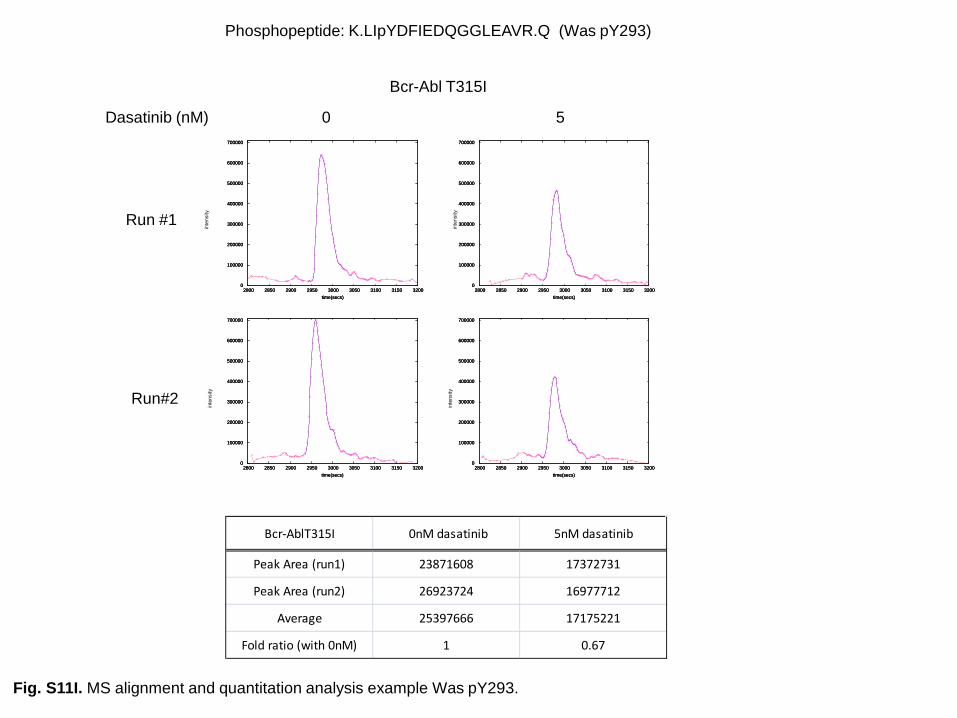
Dasatinib (nM) 5
Bcr-AblT315I 0nM dasatinib 5nM dasatinib
Peak Area (run1) 23871608 17372731
Peak Area (run2) 26923724 16977712
Average 25397666 17175221
Fold ratio (with 0nM) 1 0.67
Bcr-Abl T315I
Phosphopeptide: K.LIpYDFIEDQGGLEAVR.Q (Was pY293)
Run #1
Run#2
inte
nsity
inte
nsity
0
100000
200000
300000
400000
500000
600000
700000
2800 2850 2900 2950 3000 3050 3100 3150 3200time(secs)
0
100000
200000
300000
400000
500000
600000
700000
2800 2850 2900 2950 3000 3050 3100 3150 3200time(secs)
0
100000
200000
300000
400000
500000
600000
700000
2800 2850 2900 2950 3000 3050 3100 3150 3200time(secs)
0
100000
200000
300000
400000
500000
600000
700000
2800 2850 2900 2950 3000 3050 3100 3150 3200time(secs)
0
100000
200000
300000
400000
500000
600000
700000
2800 2850 2900 2950 3000 3050 3100 3150 3200time(secs)
0
100000
200000
300000
400000
500000
600000
700000
2800 2850 2900 2950 3000 3050 3100 3150 3200time(secs)
0
100000
200000
300000
400000
500000
600000
700000
2800 2850 2900 2950 3000 3050 3100 3150 3200time(secs)
0
100000
200000
300000
400000
500000
600000
700000
2800 2850 2900 2950 3000 3050 3100 3150 3200time(secs)
0
100000
200000
300000
400000
500000
600000
700000
2800 2850 2900 2950 3000 3050 3100 3150 3200time(secs)
0
100000
200000
300000
400000
500000
600000
700000
2800 2850 2900 2950 3000 3050 3100 3150 3200time(secs)
0
100000
200000
300000
400000
500000
600000
700000
2800 2850 2900 2950 3000 3050 3100 3150 3200time(secs)
0
100000
200000
300000
400000
500000
600000
700000
2800 2850 2900 2950 3000 3050 3100 3150 3200time(secs)
inte
nsity
inte
nsity
0
Fig. S11I. M alignment and quantitation analysis example Was pY293.S

0
0.05
0.1
0.15
-4 -3 -2 -1 0 1 2 3 4
Rela
tiv
e f
req
uen
cy
log2 fold change
p210/p210
p210+SFK/ p210 0
0.05
0.1
0.15
-4 -3 -2 -1 0 1 2 3 4
Rela
tiv
e f
req
uen
cy
log2 fold change
0 nM / 0 nM
25 nM / 0 nM 0
0.05
0.1
0.15
-6 -5 -4 -3 -2 -1 0 1 2 3 4
Rela
tiv
e f
req
uen
cy
log2 fold change
p210/p210
p210+Csk/ p210
Fig. S12. Global changes in phosphorylation amounts upon SFK perturbation compared to differences between
biological replicates. Using independently cultured, expanded, and protein purification processed replicates of the Ba/f3 + p210
cells (blue distribution, “p210/p210” or “0 nM / 0 nM”) only 1% of all phosphopeptides show a log2 fold change greater than 2 (fold
change > 4), and only 6.5% have a log2 fold change greater than 1 (fold change > 2). The distributions of log2 fold changes are
shifted by the perturbations of Lyn or Hck (SFK) overexpression (A), 25 nM dasatinib drug inhibition (B), or Csk overexpression (C)
(red distributions). Note that the trends of overall global phosphosite induction by SFK overexpression, and global repression by
dasatinib drug inhibition or Csk overexpression match the results presented in Figures 3A, 1B, and 5B, respectively. p-values for
the Student‟s t-test between the two distributions are indicated. The estimated one-tailed false positive rates for single
observations are 26% for log2 fold change > 1, 14% for log2 fold > 2, and 10% for log2 fold > 4. The false positive rate decreases
rapidly after that, but there are not enough observations to accurately estimate it. The phosphorylation changes focused on in the
manuscript results were detected multiple times, and the corresponding „multiple observation FPR‟ is accordingly much smaller.
For each phosphorylation event reported in Table 1 and table S3, we estimated a p-value for the likelihood of seeing a
phosphorylation event change by the observed amounts, the observed number of times using Fisher‟s combined probability test
(Fisher‟s method). This estimation is based on the background distribution of fold changes observed when the like p210 samples
were measured in replicate (blue histograms). Results are reported either with or without Benjamini and Hochberg correction for
multiple hypothesis testing.
A B CSFK overexpression drug inhibition Csk overexpression
p < 10-138 p < 10-47 p < 10-317

p210 (
5‟).1
p210 (
5‟).2
p210 (
2').1
p210 (
2').2
p210 (
2).
1
p210 (
2).
2
p210 (
3).
1
P210 (
3).
2
p210+
Lyn
(2').1
p210+
Lyn
(2').2
p210+
Lyn
(2).
1
p210+
Lyn
(2).
2
p210+
Lyn
(3).
2
p210+
Lyn
(3).
1
Fig. S13. Global phosphorylation changes detected in
independently derived biological replicates are sufficient to
correctly cluster like samples in an unsupervised fashion.
The abundances of phosphopeptides detected in three different
experimental batches were combined and used to group the
samples by unsupervised hierarchical clustering. Non-changing,
non-informative, phosphopeptides were cut by requiring a
coefficient of variation greater than 0.3 across the samples. This
data includes two independently derived sets of cell lines and one
additional p210 line as indicated by the number in parenthesis,
with independently expanded sets designated by the prime
symbol ('), for a total of three separate experimental mass
spectrometry batches. In each experimental batch, each sample
was run twice as technical replicates as indicated by the final
number in the sample name. Note that many additional peptides
were detected in one or two batches, but not in all three batches
due to the nature of data-dependent mass spectrometry. Full
results are presented in Figure 3A and table S3.
Tjp2 pY1095 2+Grlf1 pY1105 3+Ddx48 pY201 2+Mapk14 pY182 2+Vim pY52 2+G6pdx pY503 2+Prkcd pY311 2+Fcho1 pY15 3+Ran pY146 2+Dok2 pY142 3+Cct8 pY29 2+Acta1 pY93 3+Ptpn18 pY381 2+EG622339 pY322 2+Fyb pY560 2+Was pY293 2+Was pY293 3+Hist1h4a pY54 2+Dok1 pY361 3+Dok1 pY361 2+Pag1 pY165 2+Vasp pY39 2+Dok2 pY142 2+Dok1 pY450 2+Cfl1 pY140 3+Eno1 pY24 2+Gab2 pY263 3+Plek pY278 3+Btk pY222 2+Psma2 pY76 2+BC006779 pY93 3+Sfpq pY516 2+Itsn2 pY922 2+Ldha pY268 2+Cfl1 pY89 2+0610016J10Rik pY210 2+Ddx3x pY461 4+BCR pY177 4+Eif3s6ip pY415 2+Prpf4b pY849 2+Dok1 pY295 3+Abl1 pY413 2+

-1.5
-1
-0.5
0
0.5
1
1.5
2
2.5
3
3.5
-2 -1 0 1 2 3 4
lab
el-
fre
elo
g2
fold
ch
an
ge
SILAC log2 fold change
SILAC vs label-free
R=0.95
Fig. S14. Comparison of label-free and SILAC-based antitation and representative examples.
Fig. S14A. Quantitative log2 fold change phosphoproteomic results were measured using either SILAC (stable isotope labeling with amino acids
in cell culture) or label-free mass spectrometry methods. Two SILAC and four label-free tissue culture expansion and sample processing
replicates of (i) Bcr-Abl expressing (p210+empty vector (light isotope)) and (ii) Bcr-Abl plus wild-type Csk expressing Ba/F3 cells [p210+Csk
(heavy isotope)] were analyzed. Each sample was split into two aliquots that were run separately on the mass spectrometer (MS run technical
replicates), and the quantitation values for each peak were used to determine fold changes between samples (log2((p210+Csk)/p210)). n = 76,
s.e.m. error bars are shown for the phosphopeptides away from the origin. Additional details and peak and replicate examples for the two
indicated phosphopeptides are given in panels S14B-C. Phosphopeptides were filtered using manual inspection of their chromatography elution
peaks. Analysis of control samples resulted in estimates of 97.2 ± 0.5% for heavy isotope arginine and lysine incorporation and 5.4 ± 0.3%
arginine to proline conversion. These estimates are consistent with the shift towards negative numbers in the SILAC (x-axis) near zero „non-
changing„ events, primarily due to proline conversion in these peptides (the peptides plotted contain 1.9 prolines on average, 2.4 for the
peptides near the origin). Note, the cells used here for the purpose of comparing label-free and SILAC-based quantitation differ from those in
Figure 5 in that they are late passage cells relative to the time of Csk transduction and have fewer downregulated phosphorylation events than
the early passage cells. However, both sets of cells had increased abundance of Csk based on quantitative immunoblotting. The early
passage results shown in Figure 5 were seen consistently in three independently derived cell sublines following CSK transduction (table S3).
R, Pearson correlation coefficient.
A Ptpn18 pY381
Sgk269 pY613
MS qu
0.0E+00
2.0E+08
4.0E+08
6.0E+08
8.0E+08
1.0E+09
1.2E+09
1.4E+09
0 1 2 3p210 p210+Csk
0.0
2.0e+6
4.0e+6
6.0e+6
8.0e+6
1.0e+7
1.2e+7
1.4e+7
1.6e+7
1.8e+7
20002100
22002300
24000.0
0.5
1.0
1.5
2.0
2.5
3.0
Inte
nsity
time (sec.)
Y D
ata
0.0
2.0e+6
4.0e+6
6.0e+6
8.0e+6
1.0e+7
1.2e+7
1.4e+7
1.6e+7
1.8e+7
20002100
22002300
24000.0
0.5
1.0
1.5
2.0
2.5
3.0
Inte
nsity
time (sec.)
Y D
ata
0.0E+00
2.0E+08
4.0E+08
6.0E+08
8.0E+08
1.0E+09
1.2E+09
1.4E+09
0 1 2 3
Inte
grat
ed
are
a
a1
a2
b1
b2
p210 (light) p210+Csk (heavy)
n = 4(2 samples x 2 MS runs)
SILAC
Label-free
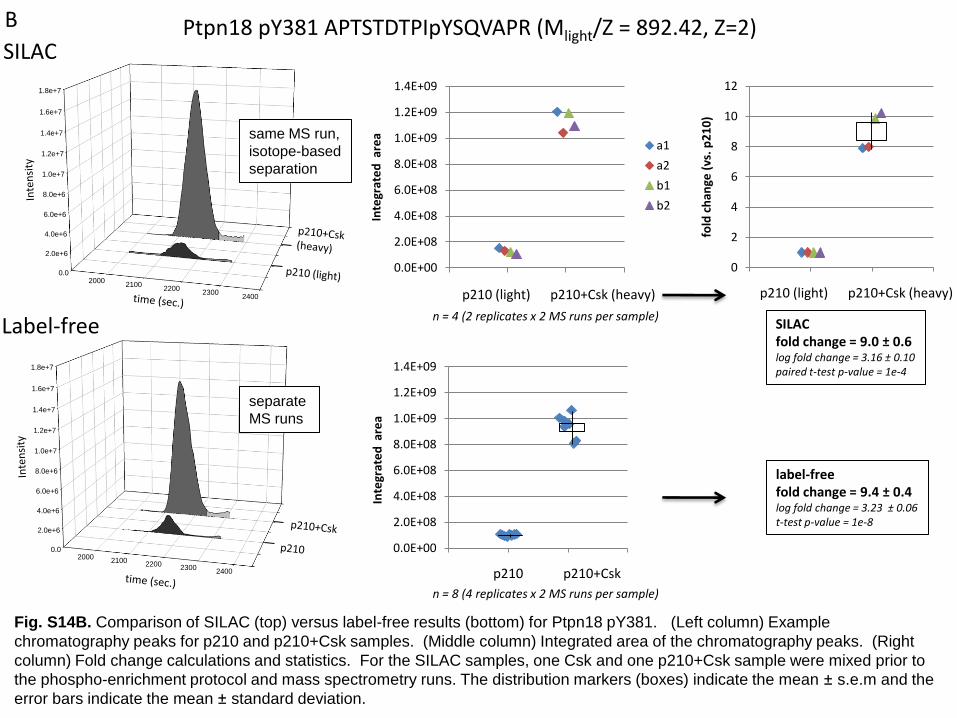
Ptpn18 pY381 APTSTDTPIpYSQVAPR (Mlight/Z = 892.42, Z=2)
label-free fold change = 9.4 ± 0.4log fold change = 3.23 ± 0.06t-test p-value = 1e-8
Fig. S14B. Comparison of SILAC (top) versus label-free results (bottom) for Ptpn18 pY381. (Left column) Example
chromatography peaks for p210 and p210+Csk samples. (Middle column) Integrated area of the chromatography peaks. (Right
column) Fold change calculations and statistics. For the SILAC samples, one Csk and one p210+Csk sample were mixed prior to
the phospho-enrichment protocol and mass spectrometry runs. The distribution markers (boxes) indicate the mean ± s.e.m and the
error bars indicate the mean ± standard deviation.
Inte
grat
ed
are
a
same MS run,
isotope-based
separation
separate
MS runs
0
2
4
6
8
10
12
0 1 2 3
fold
ch
ange
(vs
. p
21
0)
p210 (light) p210+Csk (heavy)
SILACfold change = 9.0 ± 0.6log fold change = 3.16 ± 0.10paired t-test p-value = 1e-4
n = 8 (4 replicates x 2 MS runs per sample)
n = 4 (2 replicates x 2 MS runs per sample)
B
0
1
2
3
0 1 2 3
fold
ch
ange
(vs
. p
21
0)
p210 (light) p210+Csk (heavy)
0.0E+00
2.0E+07
4.0E+07
6.0E+07
8.0E+07
1.0E+08
1.2E+08
0 1 2 3p210 p210+Csk
0.0
5.0e+5
1.0e+6
1.5e+6
2.0e+6
2.5e+6
2950 3000 3050 3100 31503200
0.0
0.5
1.0
1.5
2.0
2.5
3.0
Inte
nsity
time (sec.)
Y D
ata
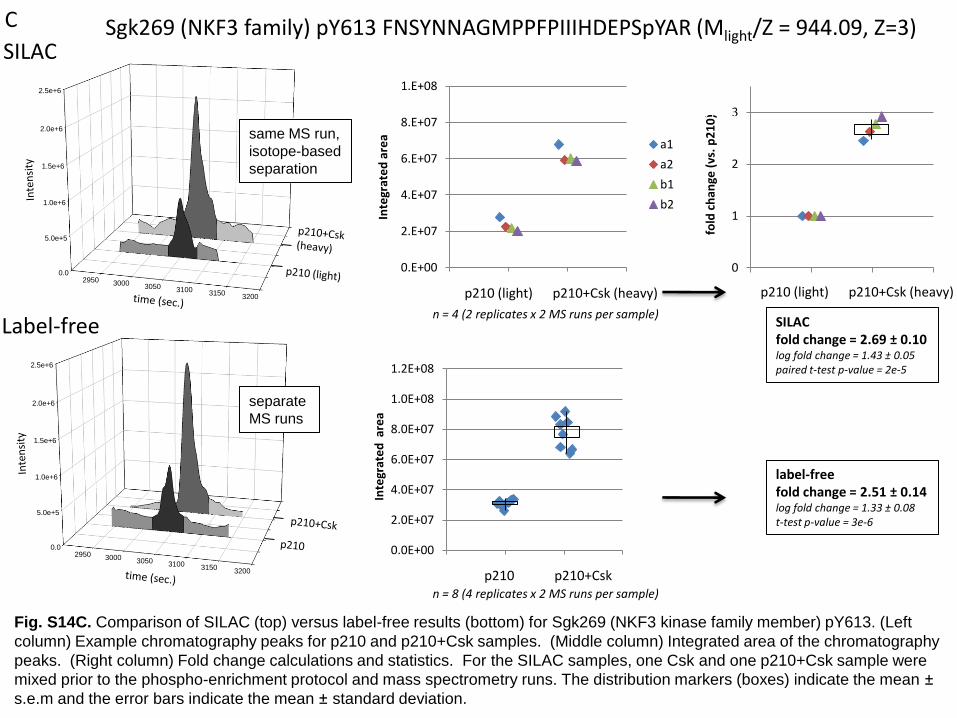
label-free fold change = 2.51 ± 0.14log fold change = 1.33 ± 0.08t-test p-value = 3e-6
SILACfold change = 2.69 ± 0.10log fold change = 1.43 ± 0.05paired t-test p-value = 2e-5
0.E+00
2.E+07
4.E+07
6.E+07
8.E+07
1.E+08
0 1 2 3
Inte
grat
ed
are
a
a1
a2
b1
b2
p210 (light) p210+Csk (heavy)
n = 4(2 samples x 2 MS runs)
0.0
5.0e+5
1.0e+6
1.5e+6
2.0e+6
2.5e+6
2950 3000 3050 3100 31503200
0.0
0.5
1.0
1.5
2.0
2.5
3.0
Inte
nsity
time (sec.)
Y D
ata
Sgk269 (NKF3 family) pY613 FNSYNNAGMPPFPIIIHDEPSpYAR (Mlight/Z = 944.09, Z=3)SILAC
Label-free
Inte
grat
ed
are
a
same MS run,
isotope-based
separation
separate
MS runs
n = 8 (4 replicates x 2 MS runs per sample)
n = 4 (2 replicates x 2 MS runs per sample)
C
Fig. S14C. Comparison of SILAC (top) versus label-free results (bottom) for Sgk269 (NKF3 kinase family member) pY613. (Left
column) Example chromatography peaks for p210 and p210+Csk samples. (Middle column) Integrated area of the chromatography
peaks. (Right column) Fold change calculations and statistics. For the SILAC samples, one Csk and one p210+Csk sample were
mixed prior to the phospho-enrichment protocol and mass spectrometry runs. The distribution markers (boxes) indicate the mean ±
s.e.m and the error bars indicate the mean ± standard deviation.

27
Table S1. Enrichment of SFK-related properties at the top of our SFK
perturbation response score-ranked lists. Hypergeometric distribution-based permutation
p-values for the likelihood of the observed enrichment of phosphosites or proteins with the
indicated SFK-related property at the top of our SFK perturbation response score-ranked lists (the
corresponding best hypergeometric p-value is in parenthesis). Phosphosite-based ranked lists
were used for Src motif analysis; and protein-based lists, ranked by the average response score
for all detected phosphosites on each protein, were used for SFK PPI (protein-protein functional
interactions), SFK substrate, and SH2 domain analysis (as in Fig. 1C and Fig. 3A-B). The
corresponding rank position (top “m”) for the enrichment of maximal statistical significance, and
the fold enrichment compared to the full list of detected and database annotated phosphosites
(n=455) or phosphoproteins (n=313) are also listed. Hypergeometric distribution-based
permutation p-values are described in Materials and Methods. N.S., not significant.
Permutation p-value
Response score version * Inhibition vs.
overexpression † SFK property Combined Drug Inhibition Overexpression
Src motif
(Scansite)
10-3
(5 10-5
)
top 316
1.3 fold
N.S.
<10-4
(8 10-8
)
top 269
1.3 fold
<10-4
SFK PPI
(HPRD)
3 10-3
(4 10-5
)
top 7 ‡
5.9 fold
0.01 (6 10-4
)
top 16
2.9 fold
N.S. 0.16
SFK substrate
(HPRD)
7 10-4
(5 10-5
)
top 5
13 fold
2 10-3
(3 10-4
)
top 21
4.2 fold
N.S. 0.01
SH2 domain
(InterPro) ‡ N.S.
0.05 (0.009)
top 140
1.3 fold
N.S. 0.09
‡ The six SFK PPI proteins that are in the top seven of our protein-ranked lists are Was, Ptpn18,
Fyb, Dapp1, Prkcd, and Pxn. The four italicized proteins are known SFK substrates. In the
HPRD database, SFK substrates are a subset of the SFK PPI set. * Experiments used to calculate
the response score for ranking were either all experiments (combined), or the drug inhibition or
overexpression experiments separately to investigate differences. † Comparison permutation p-
values for the likelihood of the observed difference in p-value between the drug inhibition and
overexpression cases (see Materials and Methods). The permutation type with the significantly
stronger enrichment is indicated in bold. ‡ SH2 enrichment results shown here were obtained
using the absolute SFK perturbation response score for phosphoprotein ranking. This table
summarizes the same results presented in Fig 3B in the manuscript with additional details.
28
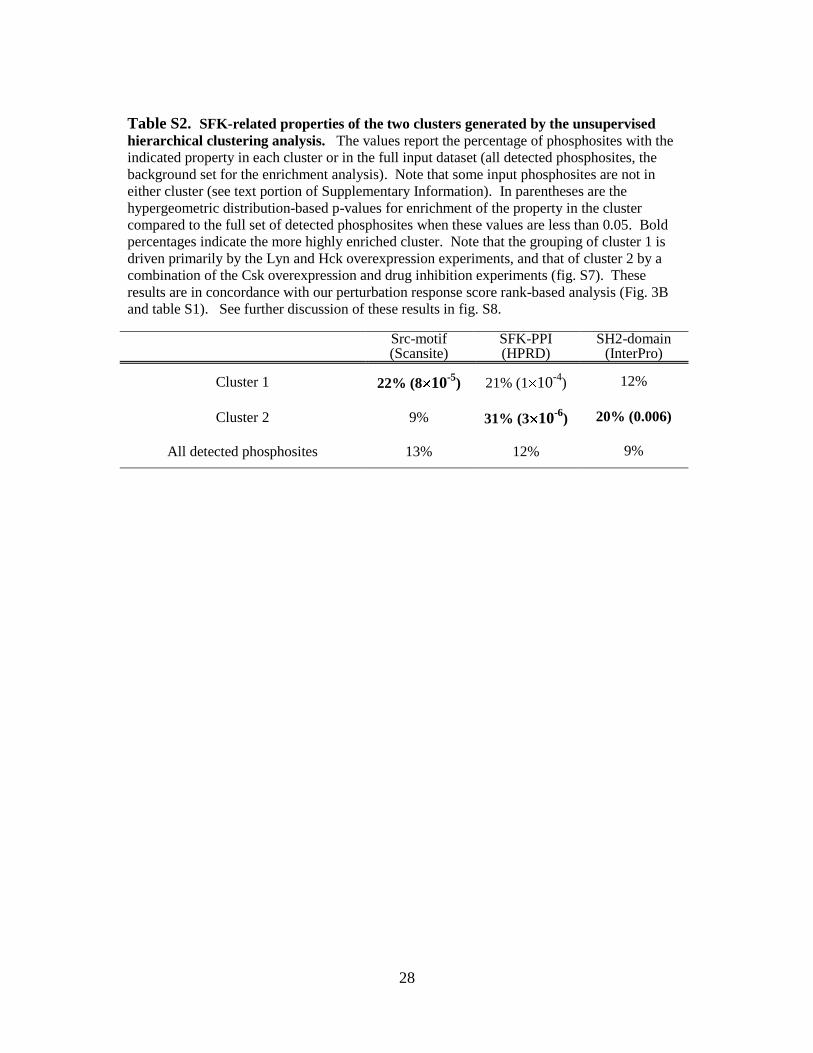
Table S2. SFK-related properties of the two clusters generated by the unsupervised
hierarchical clustering analysis. The values report the percentage of phosphosites with the
indicated property in each cluster or in the full input dataset (all detected phosphosites, the
background set for the enrichment analysis). Note that some input phosphosites are not in
either cluster (see text portion of Supplementary Information). In parentheses are the
hypergeometric distribution-based p-values for enrichment of the property in the cluster
compared to the full set of detected phosphosites when these values are less than 0.05. Bold
percentages indicate the more highly enriched cluster. Note that the grouping of cluster 1 is
driven primarily by the Lyn and Hck overexpression experiments, and that of cluster 2 by a
combination of the Csk overexpression and drug inhibition experiments (fig. S7). These
results are in concordance with our perturbation response score rank-based analysis (Fig. 3B
and table S1). See further discussion of these results in fig. S8.
Src-motif (Scansite)
SFK-PPI (HPRD)
SH2-domain (InterPro)
Cluster 1 22% (8 10-5
) 21% (1 10-4
) 12%
Cluster 2 9% 31% (3 10-6
) 20% (0.006)
All detected phosphosites 13% 12% 9%

29
SUPPLEMENTARY REFERENCES
1. G. Dennis, B. T. Sherman, D. A. Hosack, J. Yang, W. Gao, H. C. Lane, R. A.
Lempicki, DAVID: Database for annotation, visualization, and integrated
discovery. Genome Biology 4, R60 (2003).
2. M. R. Burgess, B. J. Skaggs, N. P. Shah, F. Y. Lee, C. L. Sawyers, Comparative
analysis of two clinically active BCR-ABL kinase inhibitors reveals the role of
conformation-specific binding in resistance. Proc Natl Acad Sci U S A 102, 3395-
3400 (2005).
3. T. A. Carter, L. M. Wodicka, N. P. Shah, A. M. Velasco, M. A. Fabian, D. K.
Treiber, Z. V. Milanov, C. E. Atteridge, W. H. Biggs, III, P. T. Edeen, M. Floyd,
J. M. Ford, R. M. Grotzfeld, S. Herrgard, D. E. Insko, S. A. Mehta, H. K. Patel,
W. Pao, C. L. Sawyers, H. Varmus, P. P. Zarrinkar, D. J. Lockhart, Inhibition of
drug-resistant mutants of ABL, KIT, and EGF receptor kinases. PNAS 102,
11011-11016 (2005).
4. M. W. Karaman, S. Herrgard, D. K. Treiber, P. Gallant, C. E. Atteridge, B. T.
Campbell, K. W. Chan, P. Ciceri, M. I. Davis, P. T. Edeen, R. Faraoni, M. Floyd,
J. P. Hunt, D. J. Lockhart, Z. V. Milanov, M. J. Morrison, G. Pallares, H. K. Patel,
S. Pritchard, L. M. Wodicka, P. P. Zarrinkar, A quantitative analysis of kinase
inhibitor selectivity. Nat Biotechnol 26, 127-132 (2008).
5. S. Danhauser-Riedl, M. Warmuth, B. J. Druker, B. Emmerich, M. Hallek,
Activation of Src kinases p53/56lyn and p59hck by p210bcr/abl in myeloid cells.
Cancer Res 56, 3589-3596 (1996).
6. A. Prakash, P. Mallick, J. Whiteaker, H. Zhang, A. Paulovich, M. Flory, H. Lee,
R. Aebersold, B. Schwikowski, Signal maps for mass spectrometry-based
comparative proteomics. Mol Cell Proteomics 5, 423-432 (2006).