Embed Size (px)
Citation preview
www.sciencemag.org/cgi/content/full/science.aaf6005/DC1
Supplementary Materials for
Phytochromes function as thermosensors in Arabidopsis
Jae-Hoon Jung, Mirela Domijan, Cornelia Klose, Surojit Biswas, Daphne Ezer, Mingjun Gao, Asif Khan Khattak, Mathew S. Box, Varodom Charoensawan,
Sandra Cortijo, Manoj Kumar, Alastair Grant, James C. W. Locke, Eberhard Schäfer, Katja E. Jaeger, Philip A. Wigge*
*Corresponding author. E-mail: [email protected]
Published 27 October 2016 on Science First Release DOI: 10.1126/science.aaf6005
This PDF file includes: Model description
Gene expression cluster descriptions
Materials and Methods
Figs. S1 to S14
Table S1
Captions for data S1 to S6
References
Other supplementary material for this manuscript includes the following: Data S1 to S6 (zipped folders and Excel files)
2
Model Description Mathematical model and parameter estimation.
To understand the role of temperature and light on hypocotyl growth we constructed a
model of ATHB2 mRNA dynamics. ATHB2 is a proxy for growth and its dynamics are
dependent on PIF4 and phytochrome behaviour (32). The model scheme describing this
interaction is shown in Fig. 4A and it builds upon our original model which described the
behaviour of PIF4 mRNA at ambient temperatures (8). Dynamics of PIF4 mRNA
(variable PIF4m), PIF4 protein (PIF4p), active phytochromes (Phy) and ATHB2 mRNA
(ATHB2) and are dependent on time, t and are described by the following differential
equations:
(1)
(2)
(3)
(4)
Equation (1) from our previous study (8) and additionally depends on the behavior of a
light active protein P and a temperature-sensitive repressor R. Their equations are given
as:
(5)
and
dPIF4m(t)dt
=Vmax
1+ gc ⋅R(t)− mD +mL ⋅L(t)+mp ⋅P(t) ⋅L(t)( ) ⋅PIF4m(t)
dPIF4 p(t)dt
= PIF4m (t)− m1 +mphyPhy(t)"
#$
%
&'⋅PIF4 p(t)
dPhy(t)dt
=10 ⋅L(t) ⋅ 1−Phy(t)( )− b ⋅ 1− L(t)( ) ⋅Phy(t)
dATHB2(t)dt
=V2 ⋅PIF4 p(t)k +PIF4 p(t)
− m2 +m3L(t)( ) ⋅ATHB2(t)
dP(t)dt
= 0.3 1− L(t)( ) 1−P(t)( )−P(t)L(t)
3
(6)
where , and
Several equations (namely, (1), (3) and (4)) also depend on the light term L(t). Light is modelled as a square wave function where
(7)
with light arbitrarily chosen to be on (i.e. 1) between 12 h and 20 h.
Equations (1), (5) and (7) form the original model, and the reader can find the detailed
description of equations and parameter names for the PIF4 mRNA, P and R in (8). We
briefly mention that protein P is light dependent and accumulates in light; equation (5)
comes from (33). The repressor R is a flexible wave function that provides a good proxy
for Evening Complex behaviour (8).
Now we describe the new model equations for phytochromes, PIF4 protein and ATHB2
mRNA in turn. PIF4 protein dynamics (Equation 2) depend on active phytochomes (Phy)
that trigger degradation of PIF4 (11). Here this degradation is represented by a rate mphy.
Phytochrome (Phy) dynamics are dependent on light and saturate at value of 1 when in
constant light. In the dark, they decay at the dark-reversion rate of b. Phytochrome
dynamics (Eq. 3) provide a simplified representation of the phyB model described by
other groups (17,34). In the YHB model equation (3) for Phytochrome dynamics is
replaced by Phy(t)=1 for all time, as we assume that the phytochrome effect is driven by
phyB. In the phyABCDE mutant model, Equation (3) for phytochrome dynamics is
R(t) =
rmin +rmax − rmin
21+ sin 2π
2tincrta
"
#$
%
&'
"
#$$
%
&'' 0 < t ' ≤ tincr
rmax tincr < t ' ≤ tincr + tup
rmin +rmax − rmin
21+ sin 2π
2tincrtb
"
#$
%
&'
"
#$$
%
&'' tincr + tup < t ' ≤ tincr + tup + tdecr
rmin tincr + tup + tdecr < t ' ≤ 24
)
*
+++++
,
+++++
t ' = t − tstart (mod24) ta = t '(mod24)−tincr2
tb = t '(mod24)+ tincr + tup( )+ tdecr2 .
L(t) = 1, 12 < t(mod24)< 200, otherwise
!"#
$#

4
replaced by Phy(t)=0 for all time, t.
ATHB2 dynamics depend on the activity of the PIF4 protein. Since ATHB2 is strongly
repressed in the light independently of the phytochromes (ATHB2 expression is still
repressed in phyABCDE) while PIF4 is expressed in the light (in all backgrounds and
temperatures, Figure S9), a second, light-dependent degradation rate (m3) is introduced.
The parameters for the Ler model and the mutant models were estimated by fitting the
models to the data using Bayesian inference and Markov Chain Monte Carlo technique.
Since PIF4 mRNA levels in phyABCDE mutant background (at the two temperatures) are
comparable to those in the wild-type Ler background (Figure S9), and follow the same
behaviour as the wild-type Col data from (8), for sake of simplicity, the parameters for
Equations (1), (5) and (7) are assumed to be identical at the same temperature in Col, Ler
and phyABCDE backgrounds and are taken from our previous model in (2). These values
are reproduced in Supplementary Table S1. The PIF4 mRNA levels in the YHB mutant
background are approximately half of those in the other backgrounds, so, in the YHB
mutant model, all parameters (in Equations (1), (5) and (7)) are kept as in the other model
variants, except for the rate of PIF4 transcription, Vmax , which is halved.
To test whether the difference in Ler data at the two temperatures could be partly
attributed to the difference in the phytochrome dark reversion dynamics, we built Ler
models at the two temperatures where the dark reversion rate parameter b was chosen to
be different across the two datasets, while the rest of the parameters (except Vmax in YHB)
were chosen to be common to all datasets (Ler, phyABCDE and YHB). We remind the
reader that in the phyABCDE and YHB models Equation (3) is replaced by a constant
function Phy(t)=0 and Phy(t)=1, respectively at all times, t. This means that the mutant
models can be simplified, and have fewer parameters. In the phyABCDE model there are
only five parameters (k, V2, m1, m2 and m3), while the YHB model includes the additional
parameter mphy.
Due to the nested structure of the model variants, we decided to parameterize the
phyABCDE model first, followed by the YHB and then the Ler model. For the

5
phyABCDE model, we inferred the parameter V2 (the other parameters were assumed).
Then we fit YHB model to the data (while other parameters are as determined from
phyABCDE model) and inferred the phytochrome dependent degradation of PIF4 protein
(mphy). Finally, in order to test whether the differences seen in the Ler data could be
attributed to the decay rate b, the rate was chosen to be represented by parameters, bj
where superscript represents the decay rate of the 22°C Ler model and that
of the 27 °C Ler model.
The model parameters are estimated from the normalised data, where all ATHB2 data
presented are normalised with respect to the maximum level of ATHB2 expression in 22
°C Ler. In the original model (from our previous study in (2)), the PIF4 expression was
normalised with respect to maximum level of PIF4 expression in 22 °C Col-0. The
nonnormalised version of model (for both PIF4 mRNA and ATHB2) can be easily
obtained by just rescaling the Vmax and k (they have to be multiplied by the value for the
maximum level of PIF4 in 22 °C) and by rescaling V2 (it has to be multiplied by the
value for the maximum level of ATHB2 in 22 °C Ler).
In the Bayesian approach, for data and parameters the prior distribution and
likelihood are used to compute a posterior probability for the parameters,
. Here the data is grouped with representing 22°C
time series data and representing 27°C data. Our parameters for the three model
variants are: , and , respectively. Uninformative prior
distributions and hyperparameters were chosen, specifically,
and .
In our model, the likelihood follows a Gaussian distribution, i.e.,
where for each time point , are the experimental values at for the dataset
(j=1,2) and are the estimated values obtained from the set of parameters . The
j =1 j = 2
d θ π (θ )
π (d |θ )
π (θ | d)∝π (d |θ )p(θ ) d = {d j} d1
d 2
θ = {V2} θ = {mphy} θ = {b1,b2}
π (V2 ) = π (mphy ) =Uniform(0,100) π (b1) = π (b2 ) =Uniform(0,1)
π (d j |θ )∝ exp |!dij − di
j |2σ 2
#
$%
&
'(
ti dij ti d j
!dij θ

6
posterior probability is A Metropolis Hastings
algorithm (35) with random walks for all parameters was used to explore the posterior.
For each model variant the dataset was run with 3 parallel chains with 50,000 iterations
each. The parallel chains were pooled together after a burn in of 10,000 iterations and
thinning with acceptance of each 80th iteration. We confirmed that the posterior
distribution had converged by visual inspection of trace plots and autocorrelation plots
that showed good mixing of chains and low autocorrelation. These diagnostic tools for
assessing convergence are provided with our code.
Preliminary runs of the phyABCDE model (with parameters V2, k, m1 and m2) indicated
that there is strong correlation between several pairs of the parameters when the
remaining two are held fixed. Hence, we decided to fix k, m1 and m2 at arbitrary values.
For simplicity, we assumed the degradation of PIF4 protein (m1) to be comparable to
degradation of PIF4 mRNA, and we chose k to be simply 1. We chose the degradation of
ATHB2 mRNA (m2) to be very low, since ATHB2 expression in phyABCDE in nighttime
shows an almost linear growth with time. We verified that these assumptions are not
strong, since sensitivity analysis (described below) showed that the results carry over
when different values of these three parameters are chosen.
Table S1 shows the parameter summary statistics for the Ler, phyABCDE and YHB
models at 22°C and 27°C. The dark reversion rates of the Ler model at 22°C and 27°C
are different with median(b1)=0.3337966 and median(b2)=0.4509969. The difference of
rates was also confirmed by the rejection of the null hypothesis of the Smirnov-
Kolmogorov two-sample test. The half lives of model phytochrome Phy were computed
and stand at t1/2=2.09103h in 22°C, and t1/2=1.531002h in 27°C. We verified that these
results hold when the parameters m1, m2 and k are varied. Each parameter was allowed to
take the values of 0.001, 0.01, 0.1, 1 and 10 in turn while the other two were kept at their
assumed values (see Table S1). Discarding the models that were a poor qualitative fit for
phyABCDE data (i.e ones where phyABCDE model at 22ºC and 27ºC showed a
temperature differential) or that were a poor fit for YHB data, we found that the remaining
π (θ | d)∝π (d1 |θ )π (d 2 |θ )π (θ ).
7
models suggest a difference in the two dark reversion rates, with comparable half lives
(b1 and b2 are in the ranges [0.281,0.445] (3 decimal places (d.p.)) and [0.331, 0.810] (3
d.p.), respectively). We confirmed that the same qualitative features are observed when
V2, mphy, b1 and b2 take values at the end of their inferred range (2.5th and 97.5th
percentile, Table S1). Though, as expected, in the cases where b1> b2 (i.e. the model has
b1 take it’s 97.5th percentile value while b2 takes it’s 2.5th percentile value) are the
temperature differential in WT model is very small and occurs only in last couple of
hours of darkness (For the cases where b1< b2 the temperature differential (the difference
in area under the curves for ATHB2 expression at 27ºC and 22ºC)) is in the range [2.495,
9.227] (3 d.p.) while in the four cases where b1>b2 the range is [0.295, 0.563] (3 d.p.)).
Additionally, to verify how much temperature dependence of the Phy decay contributes
to the fit of the model to the data, we fitted the Ler models at 22°C and 27°C to Ler data
assuming that they share the decay rate b identical at the two temperatures (i.e. b=b1=b2).
The value of b inferred from Ler data is median(b)=0.4078159. The other summary
statistics are as follows: the 2.75th, 25th, 75th and 97.5th percentiles are 0.3213224,
0.3796184, 0.4323124 and 0.4813988, respectively.
The simulated ATHB2 expression for both versions of Ler models (i.e. the models with
the temperature sensitive and insensitive dark reversion) is shown in Fig. S13. Our model
with the temperature sensitive Phy decay rate shows a greater temperature differential in
the nighttime which more closely recapitulates the experimental data.
All computations were performed in R (www.R-project.org) with the ODE model written
in Rcpp (36). The code is provided with the paper.Some of the plots were produced in
ggplot2 package (37) and MATLAB.
Gene Expression Cluster Descriptions
We used clustering to analyse gene expression over 24 h at 22 and 27ºC in Ler,
phyABCDE and YHB (see Materials and Methods for details). This results in 20 distinct
clusters of 25 or more genes for genes that are differentially expressed in response to

8
temperature. We have uploaded the individual gene lists for each cluster as well as the
GO enrichment terms. We describe these clusters in general terms below:
Cluster 1
1030 genes. This cluster shows the largest perturbation in YHB, where they become
highly expressed in the evening. These genes are slightly more expressed in conditions
that favour phytochrome activity (low temperature) and are slightly repressed in the
phyABCDE background.
Main GO Terms:
metabolic process, mitotic spindle assembly, activation of APC-Cdc20 complex activity,
exit from mitosis, regulation of transcription from RNA polymerase III promoter, mitotic,
metaphase/anaphase transition of mitotic cell cycle, mitotic cell cycle, regulation of
transcription from RNA polymerase I promoter, mitotic, positive regulation of
transcription from RNA polymerase I promoter during mitosis, positive regulation of
transcription from RNA polymerase III promoter during mitosis.
Cluster 2
722 genes. This cluster shows a very similar pattern to Cluster 1.
Main GO Terms:
cellular process, translational elongation, translational termination, mitochondrial
translation, cytoplasmic translation, viral translation, N-terminal peptidyl-proline
dimethylation involved in translation, maintenance of translational fidelity, plastid
translation, peptide biosynthetic process.
Cluster 3
507 genes. As with Cluster1 and 2, the genes in this group are more expressed in YHB,
and repressed compared to Ler in phyABCDE.
Main GO Terms:
metabolic process, cell killing, killing of cells of other organism, disruption of cells of
other organism, cytolysis in other organism, killing of cells in other organism involved in
symbiotic interaction, isopentenyl adenine biosynthetic process, discadenine biosynthetic
process, secretion by cell, zeatin biosynthetic process.
9
Cluster 4
890 genes. This cluster is more strongly expressed during the day in Ler, compared to
night-time. The cluster becomes more highly expressed in the presence of YHB, and less
expressed in phyABCDE.
Main GO Terms:
metabolic process; photosynthesis, dark reaction; cellular metabolic process;
photosynthesis; photosynthetic electron transport in photosystem I; photosynthetic
electron transport chain; photosynthesis, light reaction; single-organism metabolic
process; oxidation-reduction process; electron transport chain
Cluster 5
215 genes. Overall, this cluster has similar properties to Cluster 4 in terms of its
expression.
Main GO Terms:
metabolic process; anthocyanin-containing compound metabolic process; response to
fungus; anthocyanin biosynthetic process involved in anthocyanin accumulation in
response to UV light; regulation of transcription from RNA polymerase II promoter in
response to iron ion starvation; anthocyanin-containing compound biosynthetic process;
cellular response to jasmonic acid stimulus; cellular response to iron ion starvation;
response to jasmonic acid; response to herbivore.
Cluster 6
397 genes. This cluster shows broadly higher expression at 27ºC compared to 22ºC in all
backgrounds, although the degree of induction is highest in YHB.
Main GO Terms:
cellular process; cell killing; multi-organism process; biological adhesion; response to
stimulus; single-organism process; behavior; locomotion; biological phase; biological
regulation
Cluster 7
125 genes. This cluster is broadly similar in its expression to that of Cluster 6.

10
Main GO Terms:
metabolic process; protein C-linked glycosylation; protein S-linked glycosylation; protein
glucuronylation; protein glycosylation at cell surface; protein glycosylation in cytosol;
protein glycosylation in endoplasmic reticulum; protein glycosylation in Golgi; protein
phosphate-linked glycosylation; protein galactosylation
Cluster 8
84 genes. This cluster is broadly similar in its expression to that of Cluster 7.
Main GO Terms:
metabolic process; photosynthesis, light harvesting in photosystem I; photosynthesis,
light harvesting; protein-chromophore linkage via peptidyl-S-4-hydroxycinnamyl-L-
cysteine; peptide cross-linking via L-seryl-5-imidazolinone glycine; protein-chromophore
linkage via peptidyl-N6-retinal-L-lysine; peptide cross-linking via 2-imino-glutaminyl-5-
imidazolinone glycine; protein-chromophore linkage via peptidyl-cysteine; protein-
chromophore linkage via peptidyl-N6-3-dehydroretinal-L-lysine; peptide cross-linking
via 3-(2-methylthio)ethyl-6-(4-hydroxybenzylidene)-5-iminopiperazin-2-one
Cluster 9
1474 genes. These genes tend to be more repressed in expression in phyABCDE,
particularly at 27ºC.
Main GO Terms:
metabolic process; MAPK cascade; stress-activated protein kinase signaling cascade;
cytoplasmic pattern recognition receptor signaling pathway; signal transduction
downstream of smoothened; I-kappaB kinase/NF-kappaB signaling; protein kinase A
signaling; hippo signaling; TRAF-mediated signal transduction; NIK/NF-kappaB
signaling
Cluster 10
478 genes. These genes are relatively repressed in Ler at night-time at 27ºC compared to
22ºC. These genes are strongly repressed in phyABCDE.
Main GO Terms:
metabolic process; single-organism metabolic process; anaerobic phenylalanine
11
oxidation; ethanol oxidation; NADH oxidation; hypoxanthine oxidation; xanthine
oxidation; NADH regeneration; NADPH regeneration; ent-kaurene oxidation to
kaurenoic acid
Cluster 11
449 genes. Transcripts in this group are mildly induced by 27ºC during daytime
compared to 22ºC in Ler. They are strongly induced in phyABCDE during daytime
compared to Ler.
Main GO Terms:
metabolic process; DNA-dependent DNA replication; DNA strand elongation involved in
DNA replication; DNA replication; mitochondrial mRNA modification; RNA
phosphodiester bond hydrolysis; replication of extrachromosomal circular DNA;
mitochondrial RNA modification; RNA-dependent DNA replication; DNA synthesis
involved in DNA replication
Cluster 12
552 genes. These transcripts show similar behaviour to those in cluster 11.
Main GO Terms:
cellular process; rRNA processing; ribosome biogenesis; ncRNA processing; rRNA 3'-
end processing; maturation of LSU-rRNA; maturation of 5.8S rRNA; rRNA metabolic
process; exonucleolytic trimming involved in rRNA processing; rRNA modification
Cluster 13
436 genes. Genes in this cluster are induced in response to temperature with a peak of
expression 1 h after dawn. The expression of this cluster is largely unaffected by changes
in phytochrome activity.
Main GO Terms:
cellular process; cellular response to heat; heat acclimation; filamentous growth of a
population of unicellular organisms in response to heat; response to temperature stimulus;
response to heat; response to stress; response to high light intensity; cellular response to
high light intensity; photoinhibition
12
Cluster 14
161 genes. Genes in this cluster are most expressed in phyABCDE at the beginning of the
night at 27ºC.
Main GO Terms:
cell killing; biological_process; cellular process; reproductive process; growth; multi-
organism process; DNA modification; DNA alkylation; macromolecule modification;
meiotic DNA double-strand break formation involved in reciprocal meiotic
recombination
Cluster 15
747 genes. This cluster is inducible by warmer temperature in Ler during night-time,
constitutively repressed in YHB, and strongly up-regulated in phyABCDE.
Main GO Terms:
biological_process; signal transduction by protein phosphorylation; protein
phosphorylation; protein autophosphorylation; phosphorylation; inhibitory G-protein
coupled receptor phosphorylation; common-partner SMAD protein phosphorylation; I-
kappaB phosphorylation; JUN phosphorylation; regulation of translational initiation by
eIF2 alpha phosphorylation
Cluster 16
1189 genes. This cluster is similar to Cluster 15.
Main GO Terms:
metabolic process; mRNA splicing, via spliceosome; mRNA processing; RNA
processing; mRNA 3'-end processing; polycistronic mRNA processing; mRNA splicing,
via endonucleolytic cleavage and ligation; 7-methylguanosine mRNA capping;
chloroplast mRNA processing; mitochondrial mRNA processing.
Cluster 17
307 genes. Broadly similar to cluster 16.
Main GO Terms:
metabolic process; regulation of transcription from RNA polymerase II promoter in
response to hypoxia; intrinsic apoptotic signaling pathway in response to hypoxia;
13
cellular response to decreased oxygen levels; positive regulation of proteasomal
ubiquitin-dependent protein catabolic process involved in cellular response to hypoxia;
response to hypoxia; cellular response to hypoxia; seed development; cellular response to
stress; embryo development ending in seed dormancy
Cluster 18
607 genes. Broadly similar to cluster 16.
Main GO Terms:
metabolic process; arginine transport; histidine transport; lysine transport; pH elevation;
regulation of cellular pH; establishment or maintenance of cytoskeleton polarity;
regulation of pH; pH reduction; monovalent inorganic cation homeostasis
Cluster 19
133 genes. Broadly similar to Cluster 16.
Main GO Terms: response to stimulus; defense response to other organism; defense
response to bacterium; multicellular organismal reproductive process; induced systemic
resistance; cellular response to alcohol; seed dormancy process; innate immune response;
cellular response to lipid; defense response to bacterium, incompatible interaction
Cluster 20
641 genes. Genes in this cluster are specifically upregulated at night in Ler in response to
27ºC. These genes tend to show more expression during night-time in phyABCDE.
Main GO Terms:
cellular process; actin ubiquitination; isopeptide cross-linking via N6-glycyl-L-lysine;
protein monoubiquitination; protein autoubiquitination; circadian regulation of calcium
ion oscillation; histone ubiquitination; protein modification by small protein conjugation;
protein polyubiquitination; protein ubiquitination involved in ubiquitin-dependent protein
catabolic process.
Materials and Methods Plant materials and growth conditions (Fig. 1, 2 and 3)

14
The elf3-1, lux-4, and phyB-9 mutants have been described previously (8). The
phytochrome mutants in Ler backgrounds phyB-1, phyBDE, phyABDE, and phyABCDE
were provided by K. Franklin. The PHYB and YHB transgenic plants in the phyAB
backgrounds were obtained from J. C. Lagarias (19). The PHYB::PHYB-myc, which was
used in chromatin immunopurification sequencing (ChIP-seq) experiments, was
constructed by amplifying a 8.2 kb genomic fragment of PHYB including its promoter
with primers 6469 (5’-TTGCCTAGGCATAAGTGATTCTTAGAGATTG) and 6472
(5’-AAAGGCGCGCCATATGGCATCATCAGCATCATG). The PCR product was
digested using AvrII and AscI restriction enzymes and then cloned into the modified
6xmyc-pBA vector, in which the cauliflower mosaic virus (CaMV) 35S promoter was
deleted. The PHYB::PHYB-FLAG (PHYB-FLAG), which was also used in ChIP-seq
experiments, was generated by cloning the PHYB genomic sequence into pENTR vector
(ThermoFisher) according to the manufacturer’s procedure, in which primers 5257 (5’-
CACCGGACTAACAGGAGAAACAGATCAGGTAC) and 5268 (5’-
ATATGGCATCATCAGCATCATGTCAC) were used for PCR. The resultant entry
plasmid was recombined with LR clonase into the Gateway binary vector pJHA212K
containing a C-terminal 3xFLAG tag. The binary constructs were transformed into the
phyB-9 mutant by floral dipping method. The PHYB-MYC and PHYB-FLAG transgenic
plants were isolated by Basta and Kanamycin selection respectively, and propagated to
obtain single insertion lines rescuing the long hypocotyl phenotype in the phyB-9. The
ABO/A- transgenic line used for dark reversion measurements has been described
previously (38, 39).
For assays, Arabidopsis seeds were sterilized and sown on ½ X Murashige and
Skoog-agar (MS-agar) plates at pH 5.7. Sterilized seeds were stratified for 3 days at 4ºC
in the dark and allowed to germinate for 24 hours at 22ºC under cool-white fluorescent
light at 170 µmol/m2s. The plates were then transferred to short-day conditions (8 h light
and 16 h dark) at different temperatures for assays. For hypocotyl length measurement, 8
or 9 day-old seedlings were photographed and analyzed using ImageJ software
(http://rsbweb.nih.gov/ij/).
Gene expression by RNA-seq (Fig. 2)
15
Seedlings of the indicated genotypes were grown at the specified temperatures and
sampled at intervals over the diurnal cycle: ZT = 0, 1, 4, 8, 12, 16, 20 and 22 h. For Ler
27ºC at ZT=12 the sample was lost, so some of the analyses relying on this sample omit
this time-point. Total RNA was isolated from 30 mg of ground seedlings using the
MagMAX-96 Total RNA Isolation kit (Ambion, AM1830), following the manufacturer’s
instructions. RNA quality and integrity was assessed on the Agilent 2200 TapeStation.
Library preparation was performed using 1 µg of high integrity total RNA (RIN>8) using
the TruSeq RNA Library Preparation Kit v2 (Illumina, RS-122-2101 and RS-122-2001),
following manufacturer’s instruction. The libraries were sequenced on a HiSeq2000
using paired-end sequencing of 100 bp in length at the Beijing Genomics Institute (BGI)
sequencing centre. Analysis of sequence reads: First, adapters were trimmed
with Trimmomatic-0.32. Then, Tophat was used to map to the ler_0.v7 annotated
genome-- duplicates were removed and the read counts were normalised by genome-wide
coverage. Raw counts were determined by HTseq-count, and cufflinks was used to
calculate Fragments Per Kilobase Million (FPKM), which was then converted into
Transcripts Per Million (TPM).
Analysis of RNA-seq data (Fig. 2) by clustering, PCA and Venn diagram
Data preprocessing - For the clustering and PCA visualizations presented in Fig 2A and
2C, we used an ‘expression-filtered’ dataset. Genes that were not-differentially expressed
(see below) or had low expression variation (coefficient of variation = standard deviation
of expression/mean expression < 0.4) were first filtered out of the dataset, leaving 11143
genes left in the analysis.
Differential expression analysis - We performed differential expression analysis on the
full data set that included all 24689 measurable genes (mean counts per million > 0.001).
To do this, we utilized the generalized linear model functionality of the edgeR package.
For each gene, expression was modeled as a negative binomial random variable, whose
mean was given by the equation exp(light*b1 + temperature*b2 + genotypeYHB*b3 +
genotypephyA-E*b4). Here light, temperature, genotypeYHB, and genotypephyA-E were all
binary indicator variables where light = 1 if the growth chamber lights were on when the
16
sample was obtained (0 if the lights were off), temperature = 1 if the sample was in a
27ºC chamber, genotypeYHB = 1 if the sample was from the YHB mutant, and
genotypephyA-E if the sample was from the phyABCDE mutant. The bi represent regression
coefficients. Differential expression with respect to any of the modeled terms was
assessed using a likelihood ratio test. The genes were considered differentially expressed
if their regression coefficients varied significantly from zero; the significance threshold
was set so that the false discovery rate would not surpass 0.01 using the method of
Benjamini and Hochberg (40) on the p-values obtained from the likelihood ratio test.
Clustering - Clustering was performed using the method described in
(http://research.microsoft.com/apps/pubs/default.aspx?id=67239). This allowed us to
model the number of clusters without any prior restrictions. The algorithm found 23
distinct clusters in the data, however 3 of these clusters contained fewer than 25 genes
and were discarded from the visualization.
PCA - Principal components analysis was performed using the ‘pca’ function in
MATLAB on the expression-filtered dataset, using genes as features. Specifically, we
first calculated each gene’s read counts per million (CPM) as a measure of its expression
in each sample (Calculated by read count for each transcript divided by total number of
read counts in sample and multiplying this ratio by 106). These values were then z-score
transformed across all samples presented in the PCA in order to center the expression of
each gene and normalize their variance. This ensures that the patterns observed in the
PCA are representative of the entire transcriptome and are not driven by a few highly
expressed and/or highly variable genes.
Venn diagram - Venn diagram was created based on the differential expression analysis
described above.
ChIP-seq experimental details (Fig. 3)
Seedlings were grown under short day (SD) conditions (8 hours light, 16 hours dark) on
MS agar plates at 17ºC for 11 days. Seedlings were shifted at the end of the light period
(ZT=8) to 27ºC onto pre-warmed plates while control plants were maintained at 17ºC.
17
After 2 h of darkness (ZT=10), 3 g seedlings for each treatment were fixed under vacuum
for 20 min in 1xPBS (10 mM PO43−, 137 mM NaCl, and 2.7 mM KCl) containing 1%
Formaldehyde (F8775 SIGMA). The reaction was quenched by adding glycine to a final
concentration of 62 mM. Chromatin immunoprecipitation (ChIP) was performed as
described (28), with the exception that 100 µl of anti-c-Myc agarose affinity gel antibody
was used (A7470 SIGMA-Aldrich) per sample. Sequencing libraries were prepared
using TruSeq ChIP Sample Preparation Kit (Illumina IP-202-1024) and samples
sequenced on an Illumina HiSeq system (BGI). Sequence reads were analysed using in-
house pipelines.
For the MNase ChIP, 3 g seedlings were flash frozen and ground with mortar and pestle.
Resulting powder was fixed in 1% Formaldehyde (F8775 SIGMA) at room
temperature. Fragmentation was done using micrococcal nuclease according to
manufacturer’s instructions (NEB, M0247S). ChIP was performed as described (28),
using 100 µl anti-flag M2 Affinity Gel (SIGMA-ALDRICH, A2220) per sample.
Libraries were prepared using NEBNext® Ultra™ II DNA Library Prep Kit for
Illumina® (NEB, E7645L) with a size selection step as described (26). Libraries were
sequenced in-house on an Illumina NextSeq 500 system.
Analysis of ChIP-seq data (Fig. 3)
The ChIP-seq data was mapped against the TAIR10 Arabidopsis genome using Bowtie2,
and the peaks were identified with Model Based Analysis of ChIP-seq data (MACS2).
Specifically, phyB peak enrichment in Figure 3B refers to the MACS2-calculated log-
fold change over Input. De novo motif analysis was performed with Homer2, using
shuffled sequence as a background. The ChIP-seq data was visualized with the
Integrated Genome Viewer (IGV). Figure 3F illustrates the direct overlap in binding sites
between PIFs (rows) and phyB binding sites (columns), as determined by the bedtools
intersect function. The order of the columns was determined as follows: firstly, the
columns were separated by whether phyB was bound at 17ºC only, 27ºC only, or at both
temperatures. Within each category, columns with no overlap with PIFs were placed on
the left, and columns with 100% PIF overlap were placed on the right. The order of
columns with 1 to 3 overlaps with PIFs was determined by hierarchical clustering
(default parameters from R heatmap).

18
Modelling of the network (Fig. 4)
Described above.
Assaying dark reversion rate for phyB (Fig. 4)
4-day-old etiolated Arabidopsis thaliana seedlings overexpressing PHYB in a phyA-201
mutant background (ABO/A-) were irradiated with red light (LED; Λmax=656 nm; 20
µmol/m2s) for 10 min in order to photoconvert the maximal amount of phyB into the Pfr
form (87%). Subsequently seedlings were transferred to darkness at different
temperatures (12, 17, 21 or 27°C) for up to 8 h. At the respective time-points seedlings
were harvested, placed into cuvettes and Pfr/Ptot ratios were measured in a dual
wavelength spectrophotometer as described (29).
19
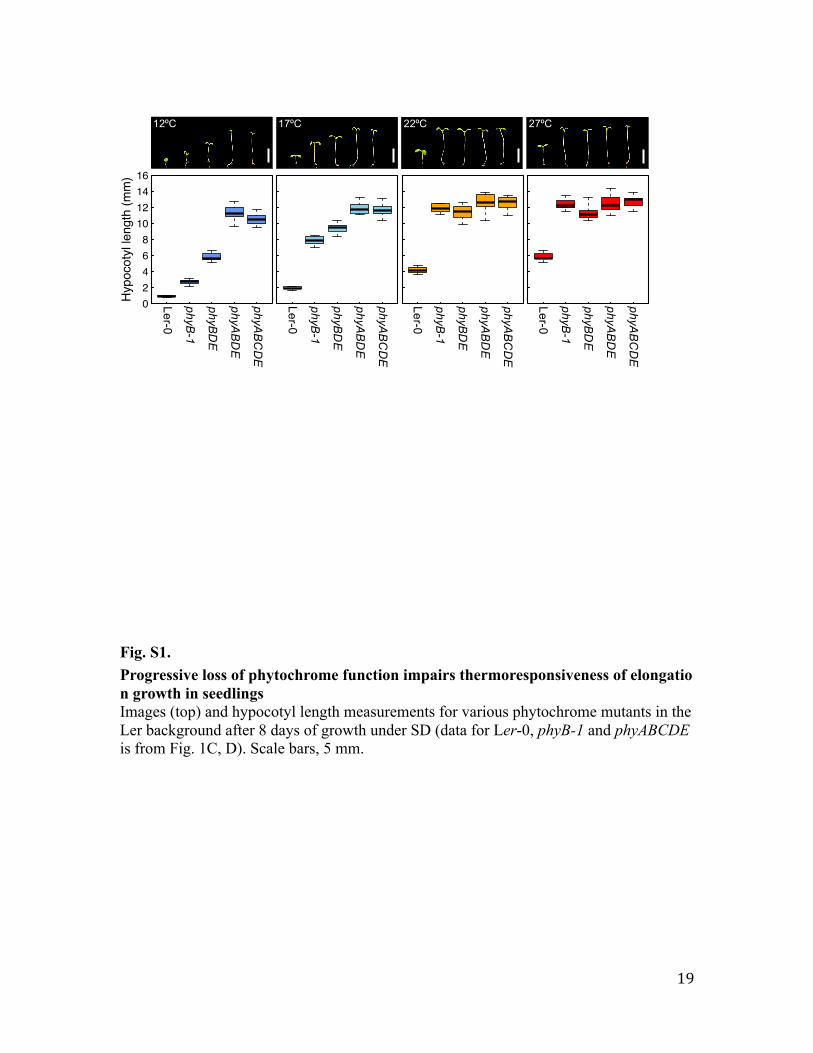
Fig. S1. Progressive loss of phytochrome function impairs thermoresponsiveness of elongation growth in seedlings Images (top) and hypocotyl length measurements for various phytochrome mutants in the Ler background after 8 days of growth under SD (data for Ler-0, phyB-1 and phyABCDE is from Fig. 1C, D). Scale bars, 5 mm.
12ºC 17ºC 22ºC 27ºC
02468
10121416
Hyp
ocot
yl le
ngth
(mm
)
Ler−
0
phyb−1
phybde
phyabde
phyabcde
02468
10121416
Hyp
ocot
yl le
ngth
(mm
)
Ler−
0
phyb−1
phybde
phyabde
phyabcde
02468
10121416
Hyp
ocot
yl le
ngth
(mm
)
Ler−
0
phyb−1
phybde
phyabde
phyabcde
02468
10121416
Hyp
ocot
yl le
ngth
(mm
)
Ler−
0
phyb−1
phybde
phyabde
phyabcde
Ler-0phyB
-1
phyAB
CD
EphyA
BD
EphyB
DE
Ler-0phyB
-1
phyAB
CD
EphyA
BD
EphyB
DE
Ler-0phyB
-1
phyAB
CD
EphyA
BD
EphyB
DE
Ler-0phyB
-1
phyAB
CD
EphyA
BD
EphyB
DE
20
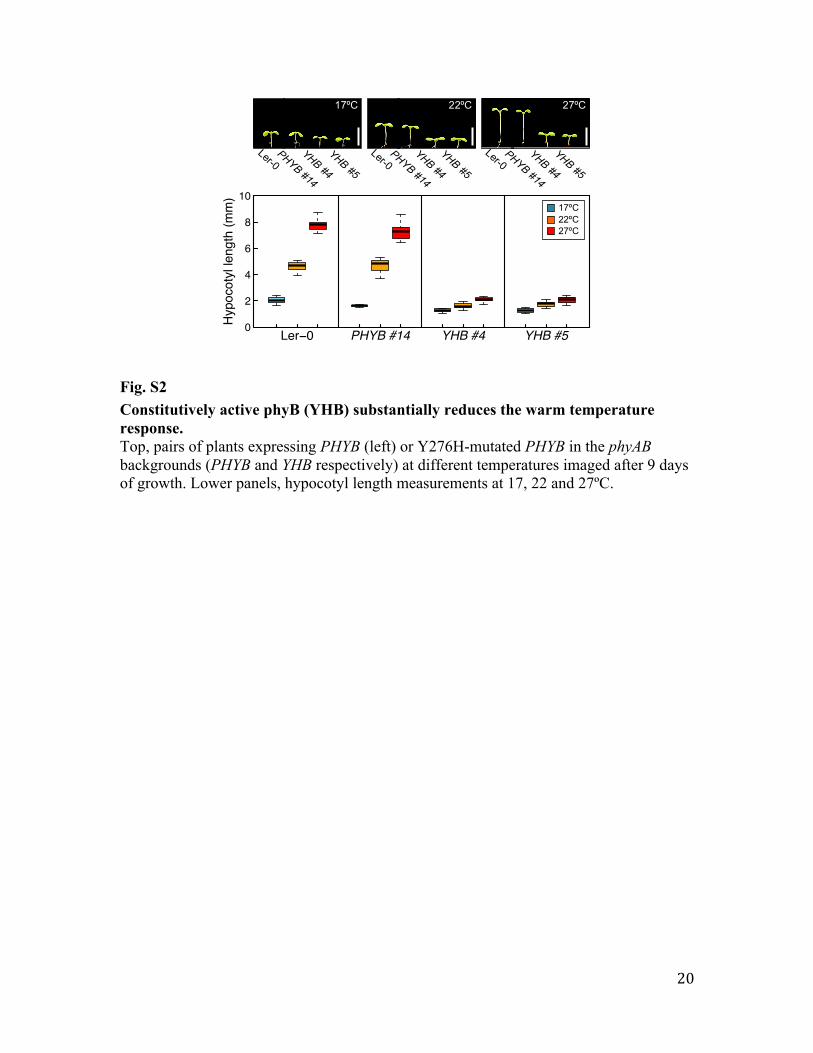
Fig. S2 Constitutively active phyB (YHB) substantially reduces the warm temperature response. Top, pairs of plants expressing PHYB (left) or Y276H-mutated PHYB in the phyAB backgrounds (PHYB and YHB respectively) at different temperatures imaged after 9 days of growth. Lower panels, hypocotyl length measurements at 17, 22 and 27ºC.
0
2
4
6
8
10
Hyp
ocot
yl le
ngth
(mm
)
Ler−0 PHYB #14 YHB #4 YHB #5
22ºC27ºC17ºC
22ºC 27ºC17ºC
Ler-0PHYB #14
YHB #4YHB #5
Ler-0PHYB #14
YHB #4YHB #5
Ler-0PHYB #14
YHB #4YHB #5
21
●
●
−20
24
6
Cluster13 : 22° C
time
Z−score
ZT−4 ZT0 ZT4 ZT8 ZT−12 ZT−8
●
●
−20
24
6
Cluster13 : 27° C
time
Z−score
ZT−4 ZT0 ZT4 ZT8 ZT−12 ZT−8
●
●
−20
24
6
phyq −Cluster13 : 22° C
time
Z−score
ZT−4 ZT0 ZT4 ZT8 ZT−12 ZT−8
●
●
−20
24
6
phyq −Cluster13 : 27° C
time
Z−score
ZT−4 ZT0 ZT4 ZT8 ZT−12 ZT−8
●
●
−20
24
6
yhb −Cluster13 : 22° C
time
Z−score
ZT−4 ZT0 ZT4 ZT8 ZT−12 ZT−8
●
●
−20
24
6
yhb −Cluster13 : 27° C
time
Z−score
ZT−4 ZT0 ZT4 ZT8 ZT−12 ZT−8
22
●
●
−20
24
6
Cluster15 : 22° C
time
Z−score
ZT−4 ZT0 ZT4 ZT8 ZT−12 ZT−8
●
●
−20
24
6
Cluster15 : 27° C
time
Z−score
ZT−4 ZT0 ZT4 ZT8 ZT−12 ZT−8
●
●
−20
24
6
phyq −Cluster15 : 22° C
time
Z−score
ZT−4 ZT0 ZT4 ZT8 ZT−12 ZT−8
●
●
−20
24
6
phyq −Cluster15 : 27° C
time
Z−score
ZT−4 ZT0 ZT4 ZT8 ZT−12 ZT−8
●
●
−20
24
6
yhb −Cluster15 : 22° C
time
Z−score
ZT−4 ZT0 ZT4 ZT8 ZT−12 ZT−8
●
●
−20
24
6
yhb −Cluster15 : 27° C
time
Z−score
ZT−4 ZT0 ZT4 ZT8 ZT−12 ZT−8
23
●
●−2
02
46
Cluster16 : 22° C
time
Z−score
ZT−4 ZT0 ZT4 ZT8 ZT−12 ZT−8
●
●
−20
24
6
Cluster16 : 27° C
time
Z−score
ZT−4 ZT0 ZT4 ZT8 ZT−12 ZT−8
●
●
−20
24
6
phyq −Cluster16 : 22° C
time
Z−score
ZT−4 ZT0 ZT4 ZT8 ZT−12 ZT−8
●
●
−20
24
6
phyq −Cluster16 : 27° C
time
Z−score
ZT−4 ZT0 ZT4 ZT8 ZT−12 ZT−8
●
●
−20
24
6
yhb −Cluster16 : 22° C
time
Z−score
ZT−4 ZT0 ZT4 ZT8 ZT−12 ZT−8
●
●
−20
24
6
yhb −Cluster16 : 27° C
time
Z−score
ZT−4 ZT0 ZT4 ZT8 ZT−12 ZT−8
24
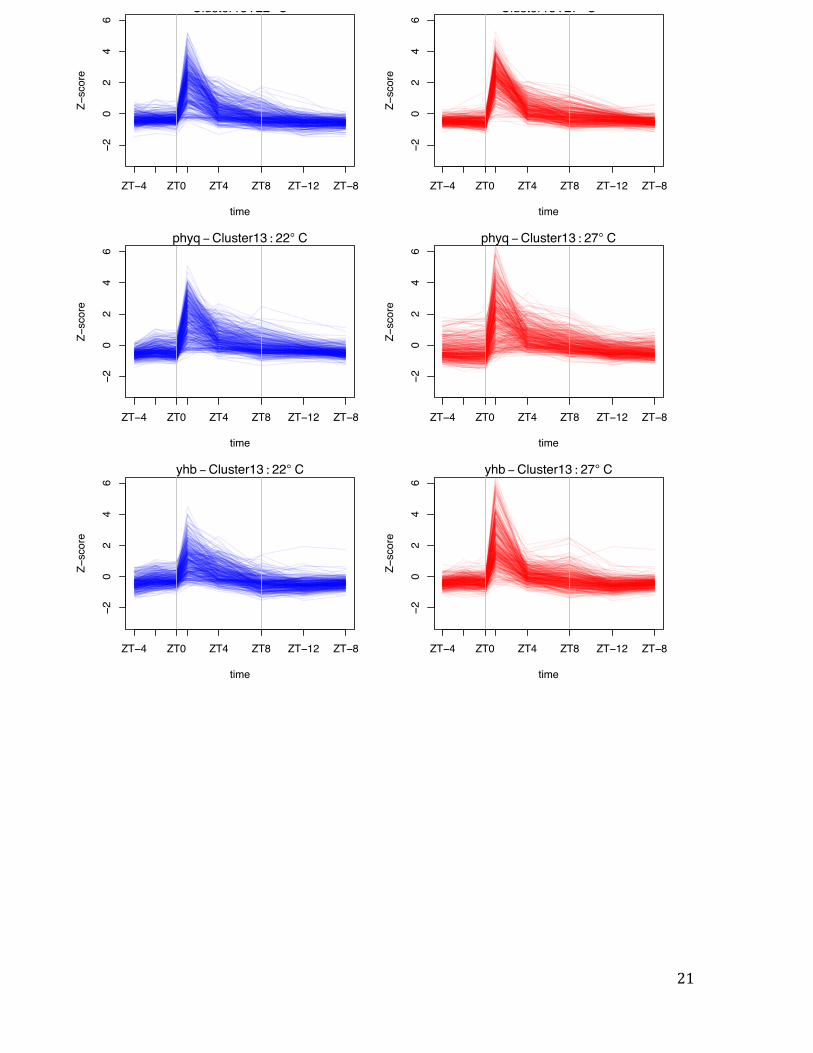
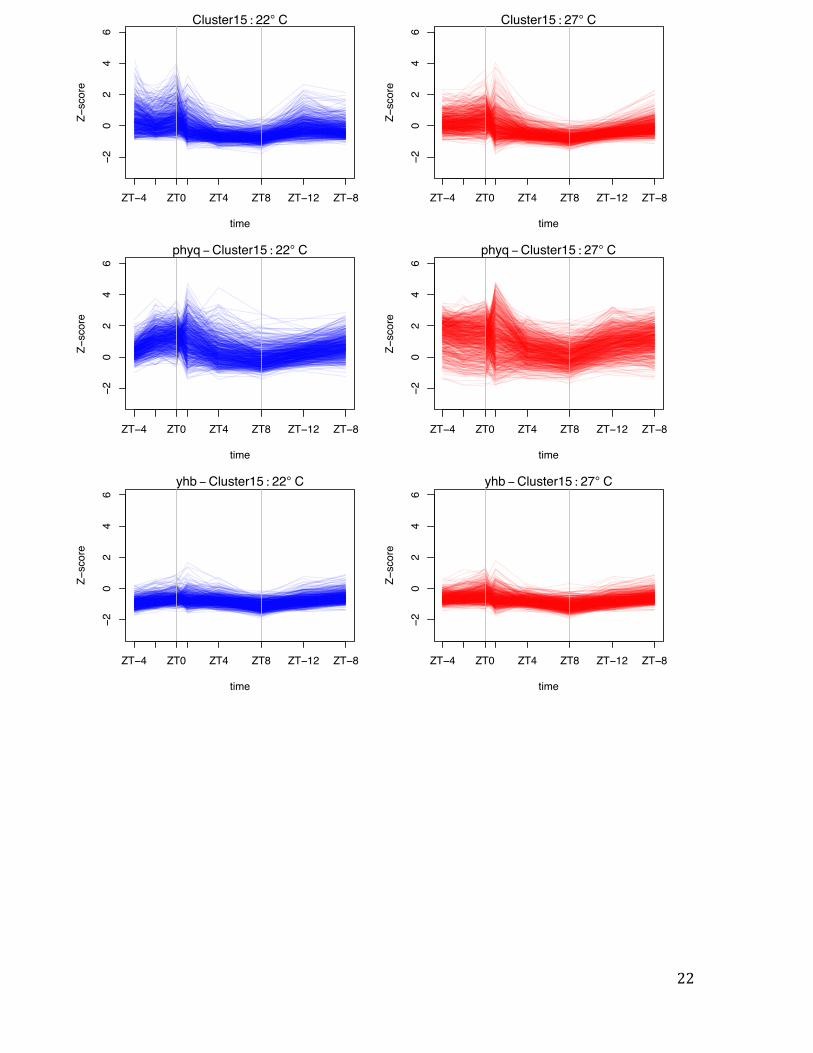
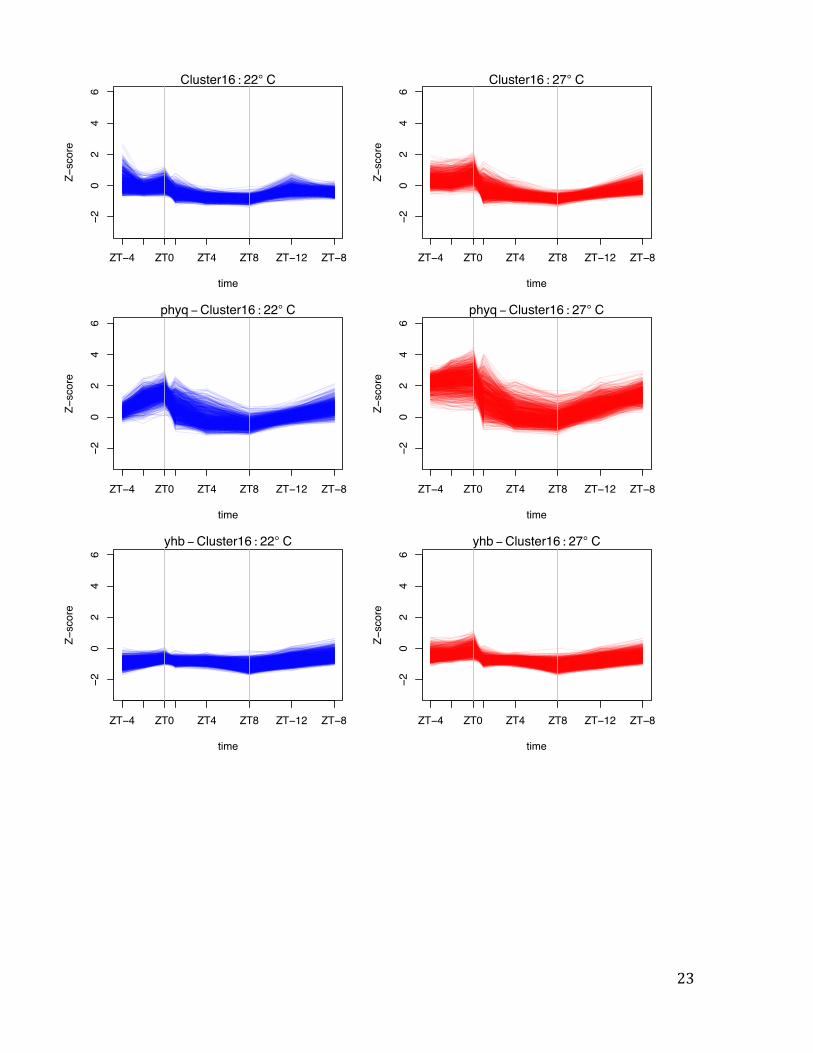
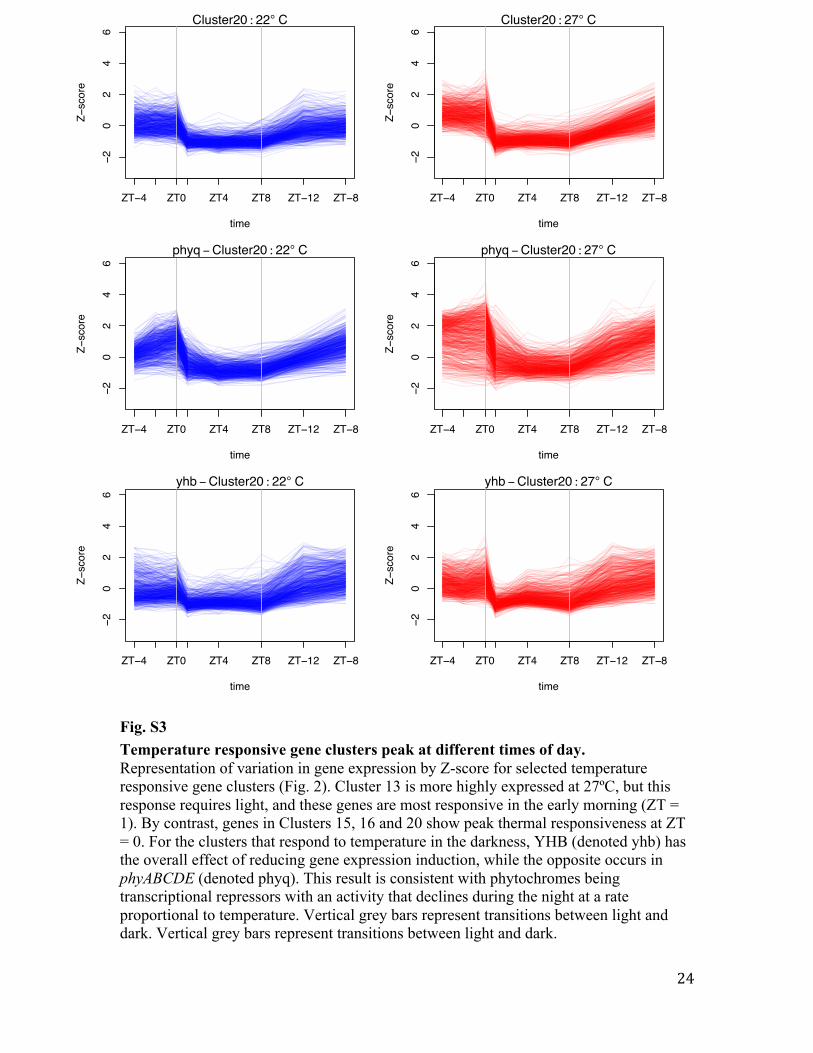
Fig. S3 Temperature responsive gene clusters peak at different times of day. Representation of variation in gene expression by Z-score for selected temperature responsive gene clusters (Fig. 2). Cluster 13 is more highly expressed at 27ºC, but this response requires light, and these genes are most responsive in the early morning (ZT = 1). By contrast, genes in Clusters 15, 16 and 20 show peak thermal responsiveness at ZT = 0. For the clusters that respond to temperature in the darkness, YHB (denoted yhb) has the overall effect of reducing gene expression induction, while the opposite occurs in phyABCDE (denoted phyq). This result is consistent with phytochromes being transcriptional repressors with an activity that declines during the night at a rate proportional to temperature. Vertical grey bars represent transitions between light and dark. Vertical grey bars represent transitions between light and dark.
●
●
−20
24
6
Cluster20 : 22° C
time
Z−score
ZT−4 ZT0 ZT4 ZT8 ZT−12 ZT−8
●
●
−20
24
6
Cluster20 : 27° C
time
Z−score
ZT−4 ZT0 ZT4 ZT8 ZT−12 ZT−8
●
●
−20
24
6
phyq −Cluster20 : 22° C
time
Z−score
ZT−4 ZT0 ZT4 ZT8 ZT−12 ZT−8
●
●
−20
24
6
phyq −Cluster20 : 27° C
time
Z−score
ZT−4 ZT0 ZT4 ZT8 ZT−12 ZT−8
●
●
−20
24
6
yhb −Cluster20 : 22° C
time
Z−score
ZT−4 ZT0 ZT4 ZT8 ZT−12 ZT−8
●
●
−20
24
6
yhb −Cluster20 : 27° C
time
Z−score
ZT−4 ZT0 ZT4 ZT8 ZT−12 ZT−8
25
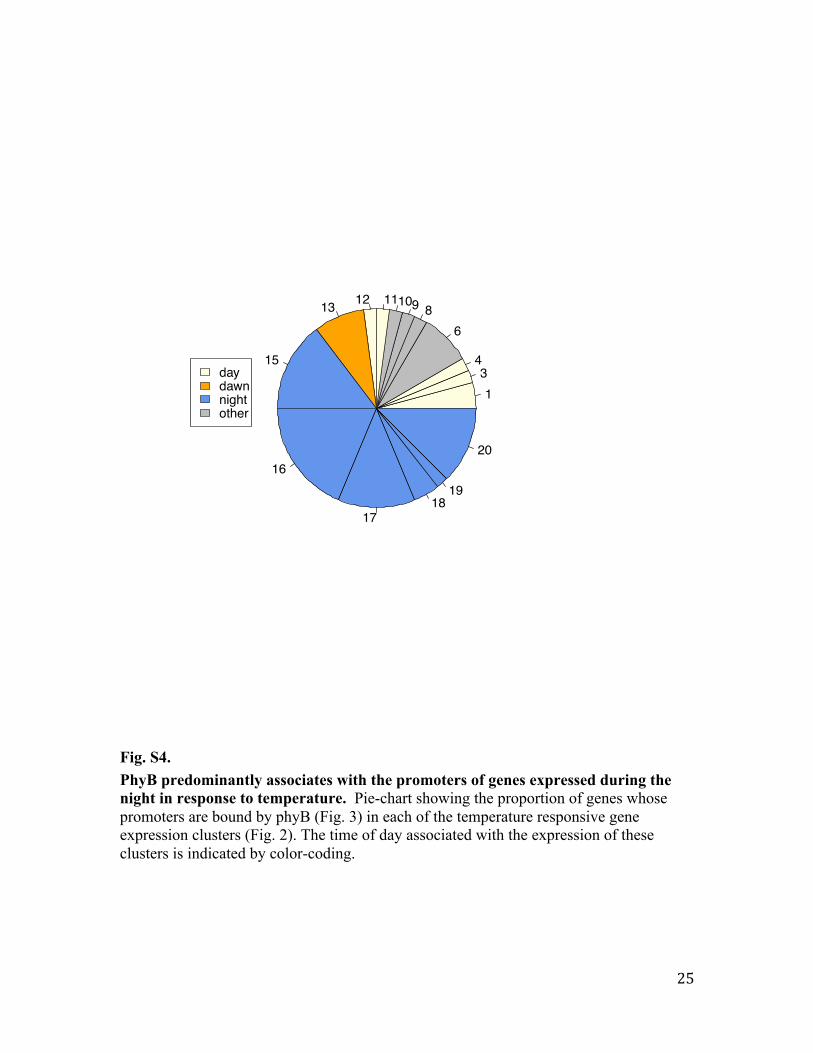
Fig. S4. PhyB predominantly associates with the promoters of genes expressed during the night in response to temperature. Pie-chart showing the proportion of genes whose promoters are bound by phyB (Fig. 3) in each of the temperature responsive gene expression clusters (Fig. 2). The time of day associated with the expression of these clusters is indicated by color-coding.
134
68910111213
15
16
1718
19
20
daydawnnightother
26
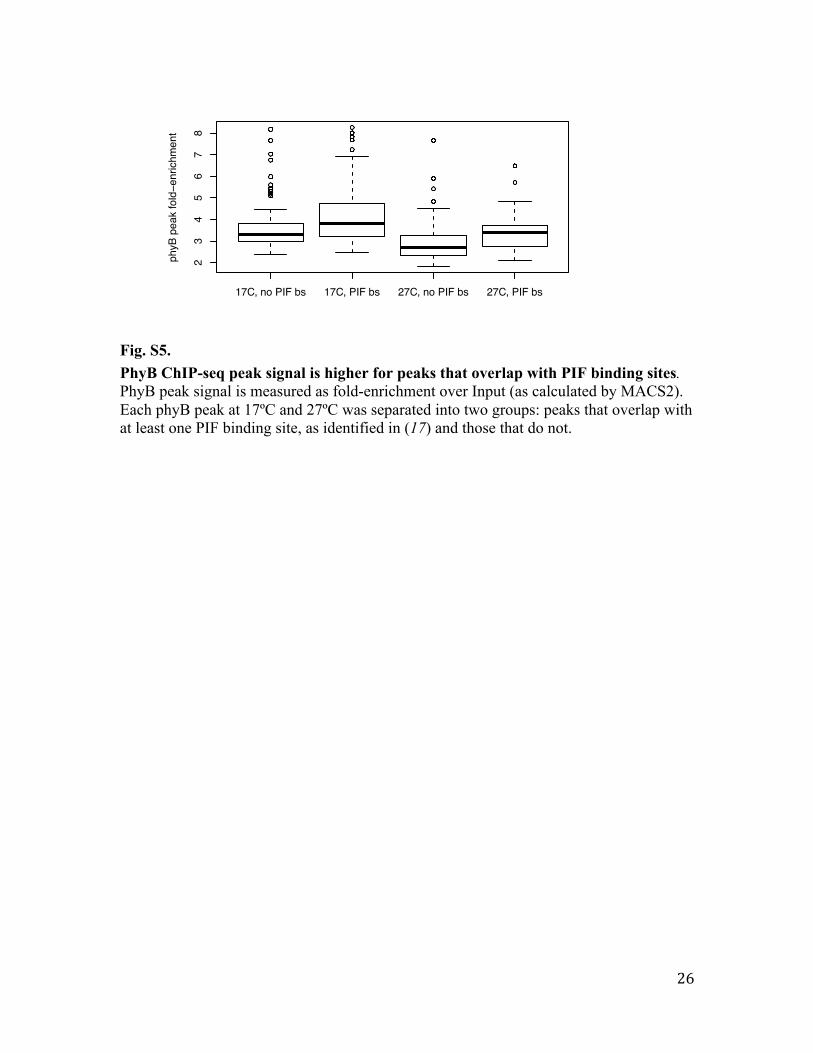
Fig. S5. PhyB ChIP-seq peak signal is higher for peaks that overlap with PIF binding sites. PhyB peak signal is measured as fold-enrichment over Input (as calculated by MACS2). Each phyB peak at 17ºC and 27ºC was separated into two groups: peaks that overlap with at least one PIF binding site, as identified in (17) and those that do not.
17C, no PIF bs 17C, PIF bs 27C, no PIF bs 27C, PIF bs
23
45
67
8
phyB
pea
k fo
ld−e
nric
hmen
t
27
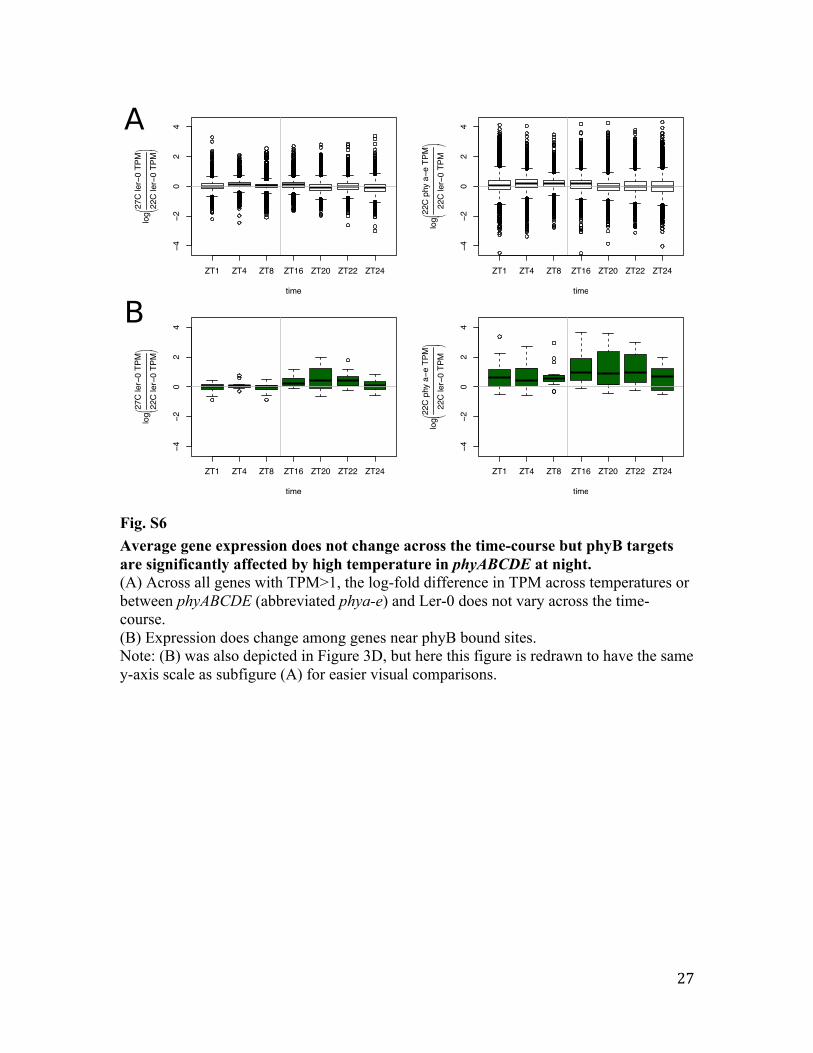
Fig. S6 Average gene expression does not change across the time-course but phyB targets are significantly affected by high temperature in phyABCDE at night. (A) Across all genes with TPM>1, the log-fold difference in TPM across temperatures or between phyABCDE (abbreviated phya-e) and Ler-0 does not vary across the time-course. (B) Expression does change among genes near phyB bound sites. Note: (B) was also depicted in Figure 3D, but here this figure is redrawn to have the same y-axis scale as subfigure (A) for easier visual comparisons.
ZT1 ZT4 ZT8 ZT16 ZT20 ZT22 ZT24
−4−2
02
4
time
log⎛ ⎝⎜27
C le
r−0
TPM
22C
ler−
0 TP
M⎞ ⎠⎟
ZT1 ZT4 ZT8 ZT16 ZT20 ZT22 ZT24
−4−2
02
4
time
log⎛ ⎝⎜22
C p
hy a−e
TPM
22C
ler−
0 TP
M⎞ ⎠⎟
ZT1 ZT4 ZT8 ZT16 ZT20 ZT22 ZT24
−4−2
02
4
time
log⎛ ⎝⎜27
C le
r−0
TPM
22C
ler−
0 TP
M⎞ ⎠⎟
ZT1 ZT4 ZT8 ZT16 ZT20 ZT22 ZT24−4
−20
24
time
log⎛ ⎝⎜22
C p
hy a−e
TPM
22C
ler−
0 TP
M⎞ ⎠⎟
A
B
28
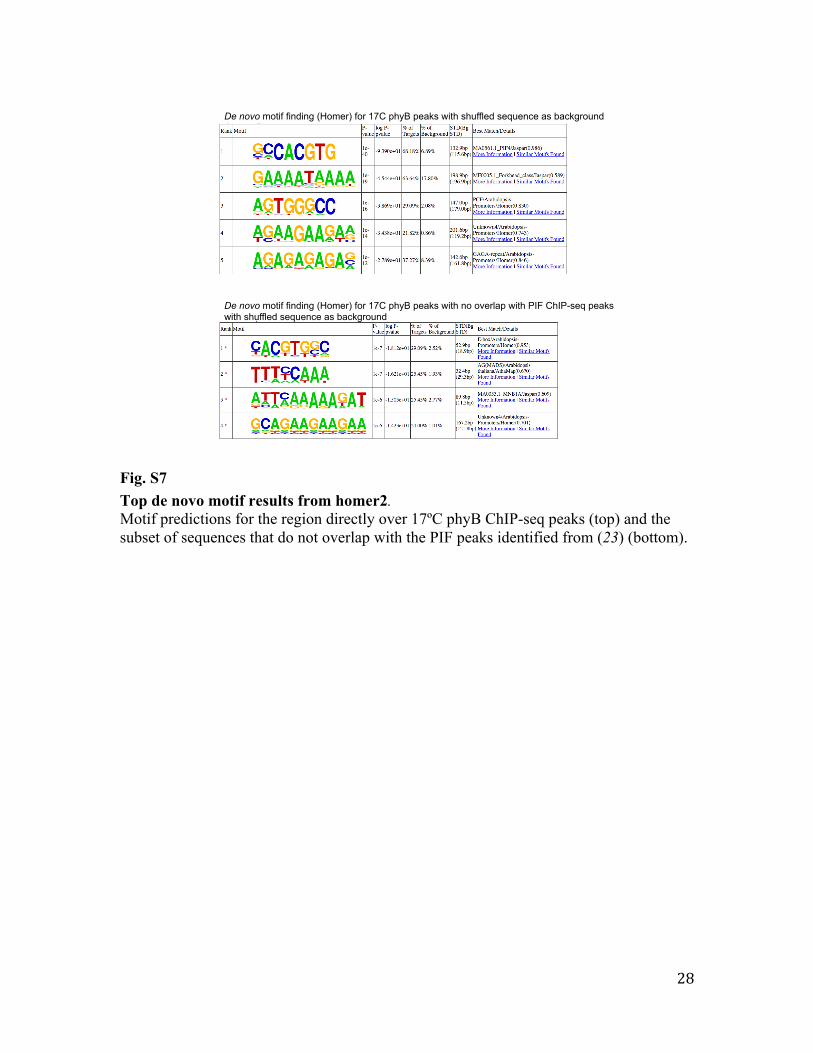
Fig. S7 Top de novo motif results from homer2. Motif predictions for the region directly over 17ºC phyB ChIP-seq peaks (top) and the subset of sequences that do not overlap with the PIF peaks identified from (23) (bottom).
De novo motif finding (Homer) for 17C phyB peaks with shuffled sequence as background
De novo motif finding (Homer) for 17C phyB peaks with no overlap with PIF ChIP-seq peaks with shuffled sequence as background
29
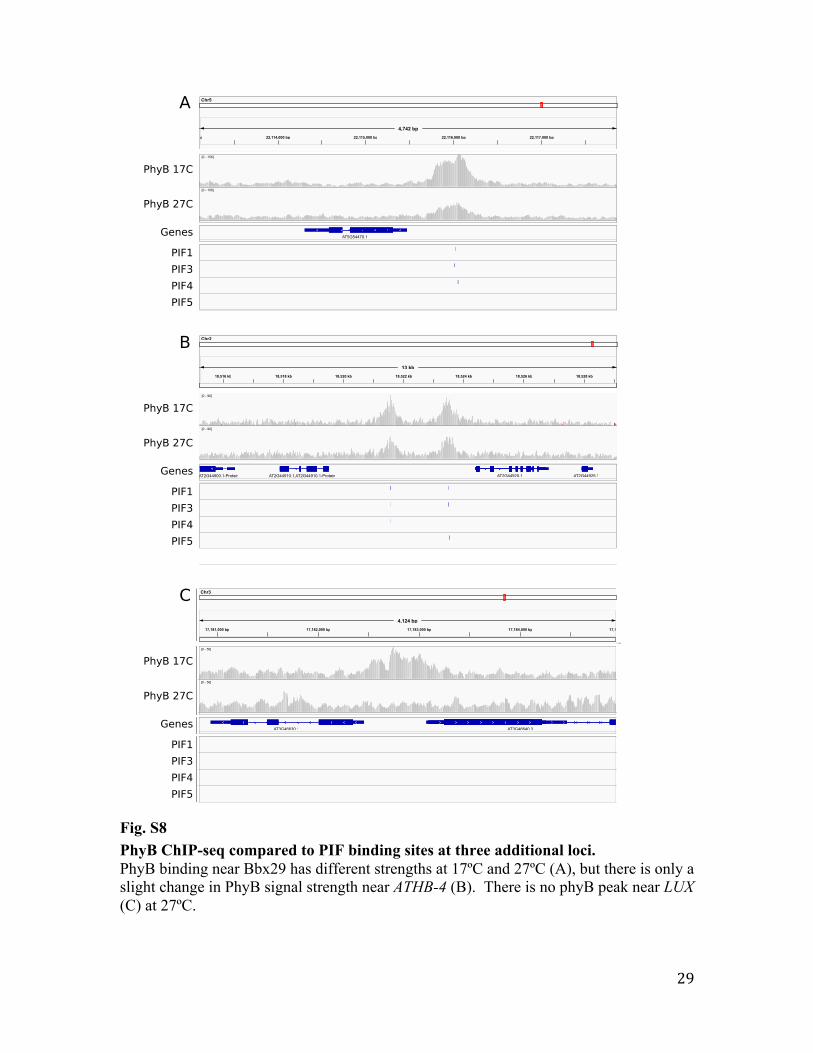
Fig. S8 PhyB ChIP-seq compared to PIF binding sites at three additional loci. PhyB binding near Bbx29 has different strengths at 17ºC and 27ºC (A), but there is only a slight change in PhyB signal strength near ATHB-4 (B). There is no phyB peak near LUX (C) at 27ºC.
AT5G54470.1
[0 - 156]
[0 - 156]
22,113,000 bp 22,114,000 bp 22,115,000 bp 22,116,000 bp 22,117,000 bp
4,742 bp
Chr5
AT2G44900.1,AT2G44900.1-Protein AT2G44910.1,AT2G44910.1-Protein AT2G44920.1 AT2G44925.1
[0 - 90]
[0 - 90]
18,516 kb 18,518 kb 18,520 kb 18,522 kb 18,524 kb 18,526 kb 18,528 kb
13 kb
Chr2
PhyB 17C
PhyB 27C
Genes
PIF1
PIF3
PIF4
PIF5
PhyB 17C
PhyB 27C
Genes
PIF1
PIF3
PIF4
PIF5
AT3G46630.1 AT3G46640.3
[0 - 56]
[0 - 56]
17,181,000 bp 17,182,000 bp 17,183,000 bp 17,184,000 bp 17,185,00
4,124 bp
Chr3
PhyB 17C
PhyB 27C
Genes
PIF1
PIF3
PIF4
PIF5
A
B
C
30
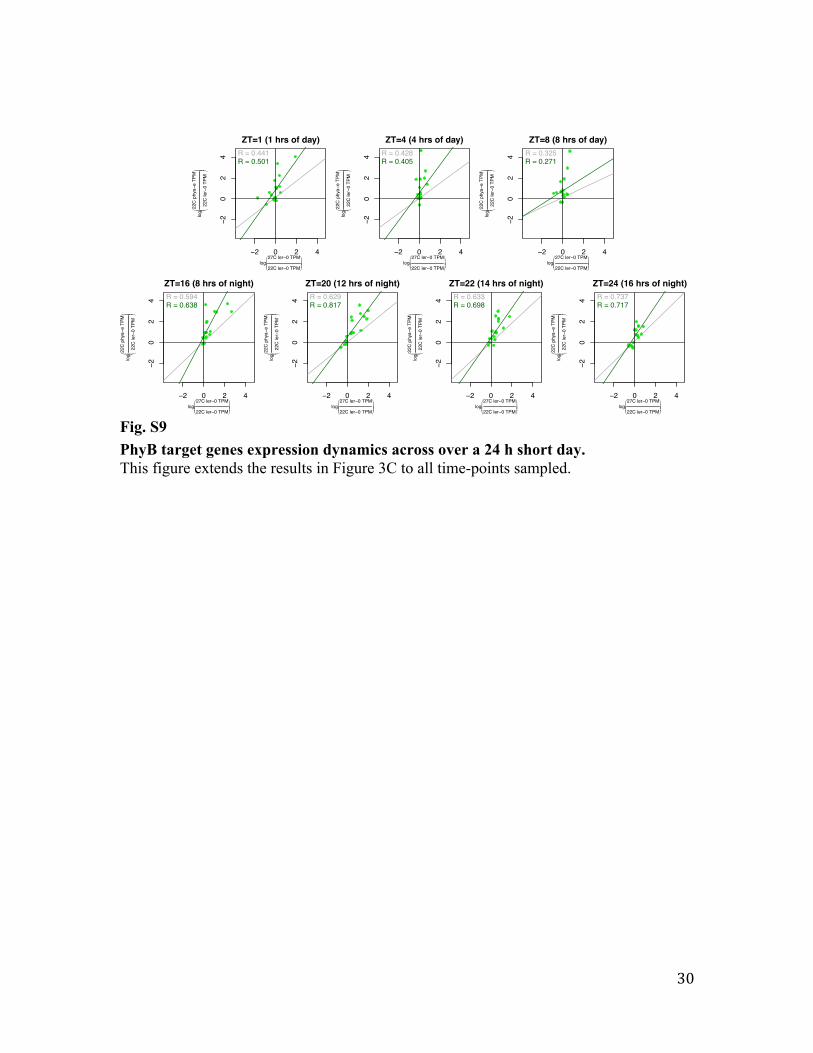
Fig. S9 PhyB target genes expression dynamics across over a 24 h short day. This figure extends the results in Figure 3C to all time-points sampled.
−2 0 2 4
−20
24
ZT=1 (1 hrs of day)
log
27C ler−0 TPM
22C ler−0 TPM
log 22
C p
hya−
e TP
M
22C
ler−
0 TP
M
R = 0.441R = 0.501
−2 0 2 4
−20
24
ZT=4 (4 hrs of day)
log
27C ler−0 TPM
22C ler−0 TPM
log 22
C p
hya−
e TP
M
22C
ler−
0 TP
M
R = 0.428R = 0.405
−2 0 2 4
−20
24
ZT=8 (8 hrs of day)
log
27C ler−0 TPM
22C ler−0 TPM
log 22
C p
hya−
e TP
M
22C
ler−
0 TP
M
R = 0.325R = 0.271
−2 0 2 4
−20
24
ZT=16 (8 hrs of night)
log
27C ler−0 TPM
22C ler−0 TPM
log 22
C p
hya−
e TP
M
22C
ler−
0 TP
M
R = 0.594R = 0.638
−2 0 2 4
−20
24
ZT=20 (12 hrs of night)
log
27C ler−0 TPM
22C ler−0 TPM
log 22
C p
hya−
e TP
M
22C
ler−
0 TP
M
R = 0.629R = 0.817
−2 0 2 4
−20
24
ZT=22 (14 hrs of night)
log
27C ler−0 TPM
22C ler−0 TPM
log 22
C p
hya−
e TP
M
22C
ler−
0 TP
M
R = 0.633R = 0.698
−2 0 2 4
−20
24
ZT=24 (16 hrs of night)
log
27C ler−0 TPM
22C ler−0 TPM
log 22
C p
hya−
e TP
M
22C
ler−
0 TP
M
R = 0.737R = 0.717
31
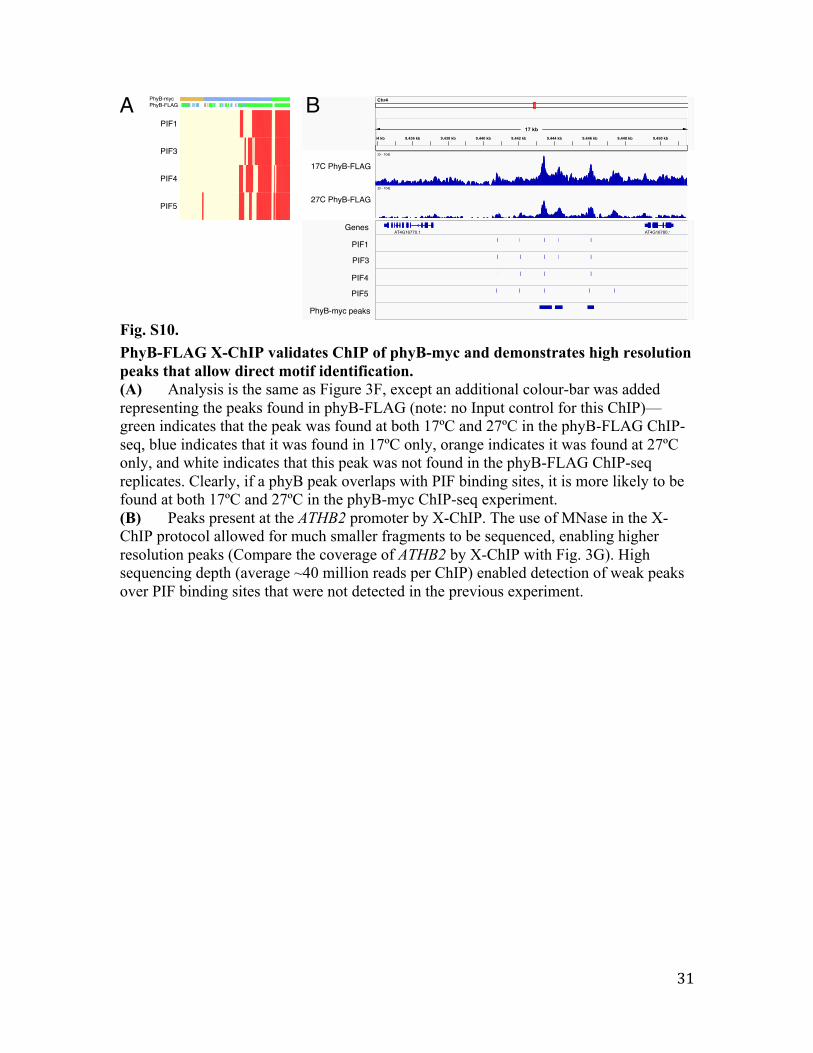
Fig. S10. PhyB-FLAG X-ChIP validates ChIP of phyB-myc and demonstrates high resolution peaks that allow direct motif identification. (A) Analysis is the same as Figure 3F, except an additional colour-bar was added representing the peaks found in phyB-FLAG (note: no Input control for this ChIP)—green indicates that the peak was found at both 17ºC and 27ºC in the phyB-FLAG ChIP-seq, blue indicates that it was found in 17ºC only, orange indicates it was found at 27ºC only, and white indicates that this peak was not found in the phyB-FLAG ChIP-seq replicates. Clearly, if a phyB peak overlaps with PIF binding sites, it is more likely to be found at both 17ºC and 27ºC in the phyB-myc ChIP-seq experiment. (B) Peaks present at the ATHB2 promoter by X-ChIP. The use of MNase in the X-ChIP protocol allowed for much smaller fragments to be sequenced, enabling higher resolution peaks (Compare the coverage of ATHB2 by X-ChIP with Fig. 3G). High sequencing depth (average ~40 million reads per ChIP) enabled detection of weak peaks over PIF binding sites that were not detected in the previous experiment.
PIF1
PIF3
PIF4
PIF5
PhyB-FLAGPhyB-myc
AT4G16770.1 AT4G16780.1
[0 - 104]
[0 - 104]
9,434 kb 9,436 kb 9,438 kb 9,440 kb 9,442 kb 9,444 kb 9,446 kb 9,448 kb 9,450 kb
17 kb
Chr4
PIF1
PIF3
PIF4
PIF5
PhyB-myc peaks
Genes
17C PhyB-FLAG
27C PhyB-FLAG
A B
32
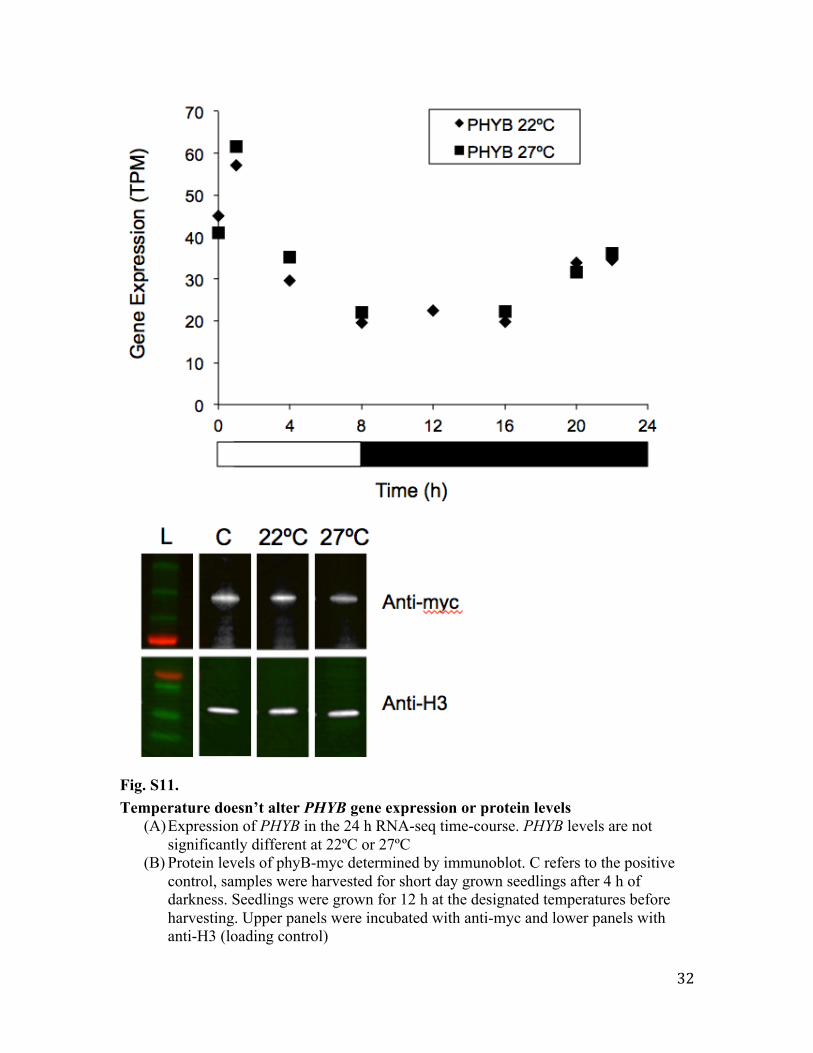
Fig. S11. Temperature doesn’t alter PHYB gene expression or protein levels
(A) Expression of PHYB in the 24 h RNA-seq time-course. PHYB levels are not significantly different at 22ºC or 27ºC
(B) Protein levels of phyB-myc determined by immunoblot. C refers to the positive control, samples were harvested for short day grown seedlings after 4 h of darkness. Seedlings were grown for 12 h at the designated temperatures before harvesting. Upper panels were incubated with anti-myc and lower panels with anti-H3 (loading control)
33
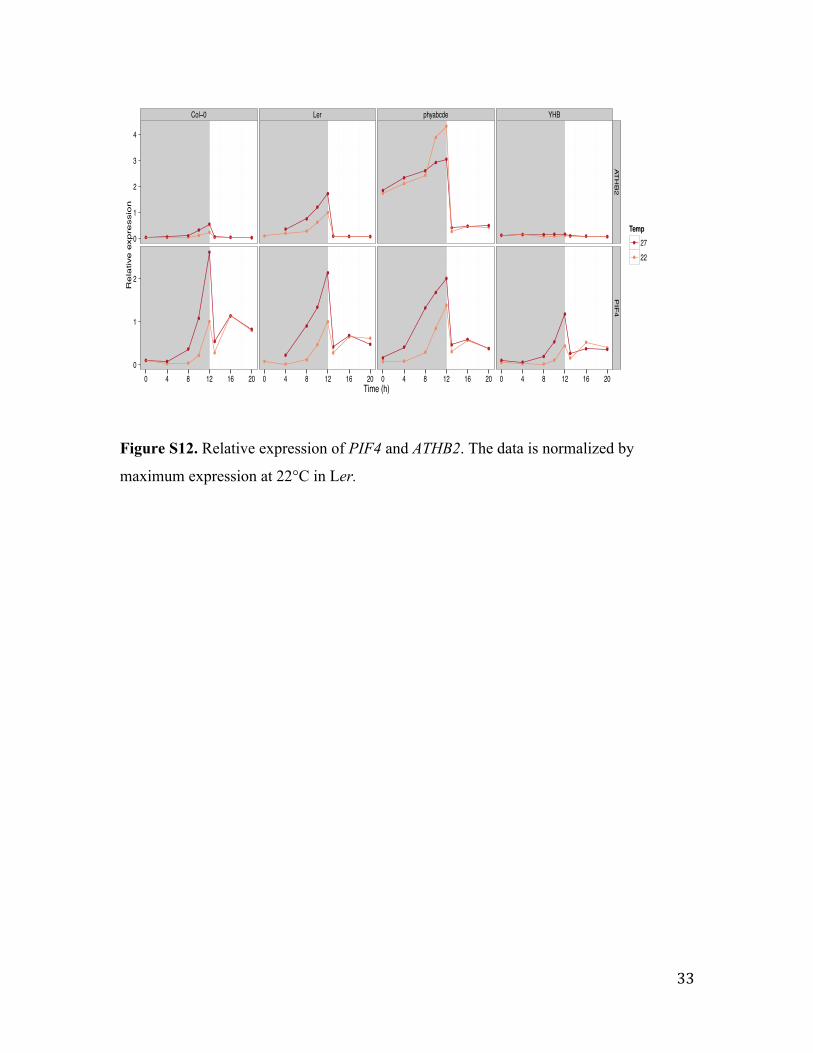
Figure S12. Relative expression of PIF4 and ATHB2. The data is normalized by
maximum expression at 22°C in Ler.
Col−0 Ler phyabcde YHB
● ● ● ●●
● ● ●● ● ●●
●
● ● ●
●● ●
●
●
●
●
●
● ●
●
●
●
●
●
●
●● ●
●
●
● ● ●
●
●
●
●
● ● ●
●●
●
●
●
●
● ●
●
●
●
●
●
●
●
●
●
●
●
●
●● ●
●
●
●
●●
● ● ●
● ●
●
●
●
●
●
●
●
●
●
●
●
●●
●
● ● ● ● ● ● ● ●● ● ● ● ● ● ● ●
● ● ●●
●
●
●●
● ●●
●
●
●● ●
0
1
2
3
4
0
1
2
AT
HB
2P
IF4
0 4 8 12 16 20 0 4 8 12 16 20 0 4 8 12 16 20 0 4 8 12 16 20Time (h)
Rela
tive
expre
ssio
n
Temp●
●
2722
34
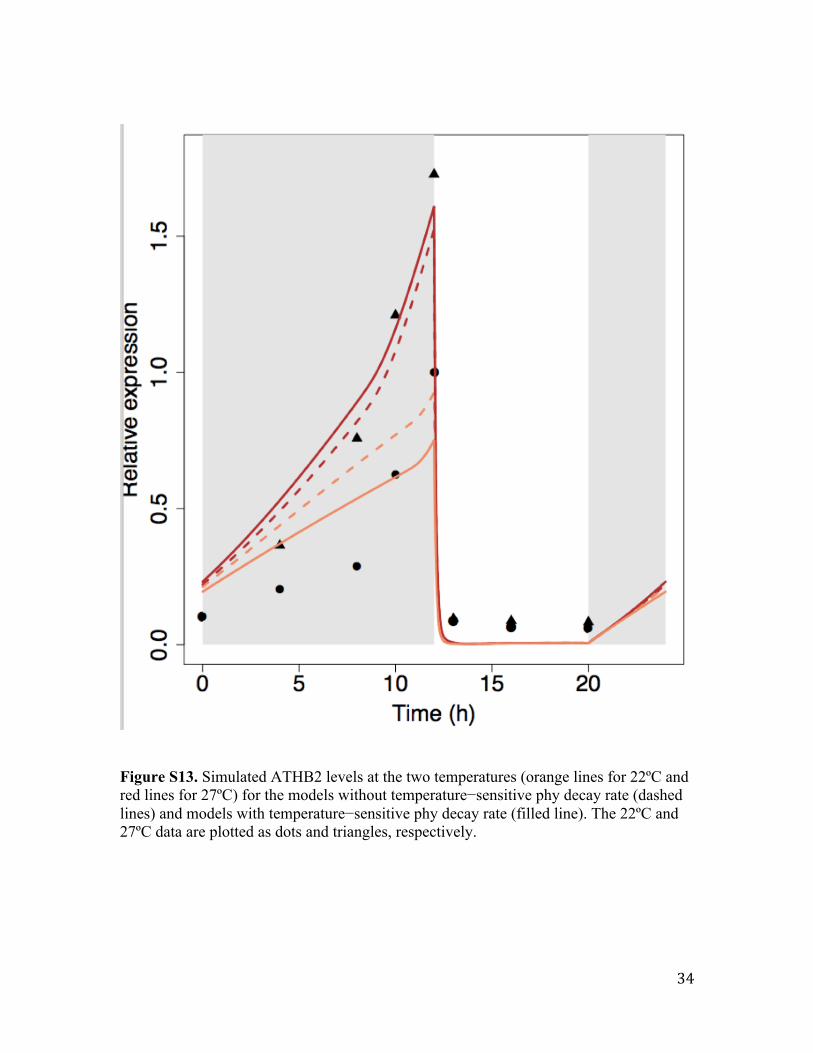
Figure S13. Simulated ATHB2 levels at the two temperatures (orange lines for 22ºC and red lines for 27ºC) for the models without temperature−sensitive phy decay rate (dashed lines) and models with temperature−sensitive phy decay rate (filled line). The 22ºC and 27ºC data are plotted as dots and triangles, respectively.
35
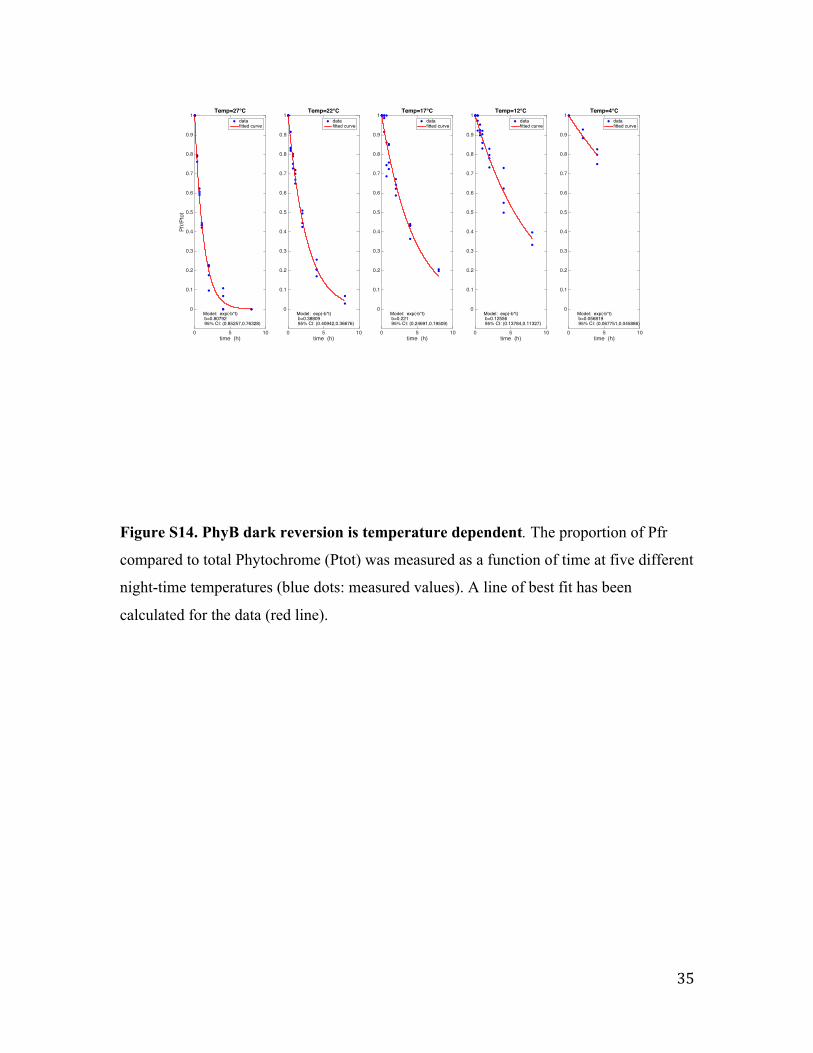
Figure S14. PhyB dark reversion is temperature dependent. The proportion of Pfr
compared to total Phytochrome (Ptot) was measured as a function of time at five different
night-time temperatures (blue dots: measured values). A line of best fit has been
calculated for the data (red line).
time (h)0 5 10
Pfr/P
tot
0
0.1
0.2
0.3
0.4
0.5
0.6
0.7
0.8
0.9
1
Model: exp(-b*t) b=0.80792 95% CI: (0.85257,0.76328)
Temp=27°Cdatafitted curve
time (h)0 5 10
0
0.1
0.2
0.3
0.4
0.5
0.6
0.7
0.8
0.9
1
Model: exp(-b*t) b=0.38809 95% CI: (0.40942,0.36676)
Temp=22°Cdatafitted curve
time (h)0 5 10
0
0.1
0.2
0.3
0.4
0.5
0.6
0.7
0.8
0.9
1
Model: exp(-b*t) b=0.221 95% CI: (0.24691,0.19509)
Temp=17°Cdatafitted curve
time (h)0 5 10
0
0.1
0.2
0.3
0.4
0.5
0.6
0.7
0.8
0.9
1
Model: exp(-b*t) b=0.12556 95% CI: (0.13784,0.11327)
Temp=12°Cdatafitted curve
time (h)0 5 10
0
0.1
0.2
0.3
0.4
0.5
0.6
0.7
0.8
0.9
1
Model: exp(-b*t) b=0.056819 95% CI: (0.067751,0.045886)
Temp=4°Cdatafitted curve
36
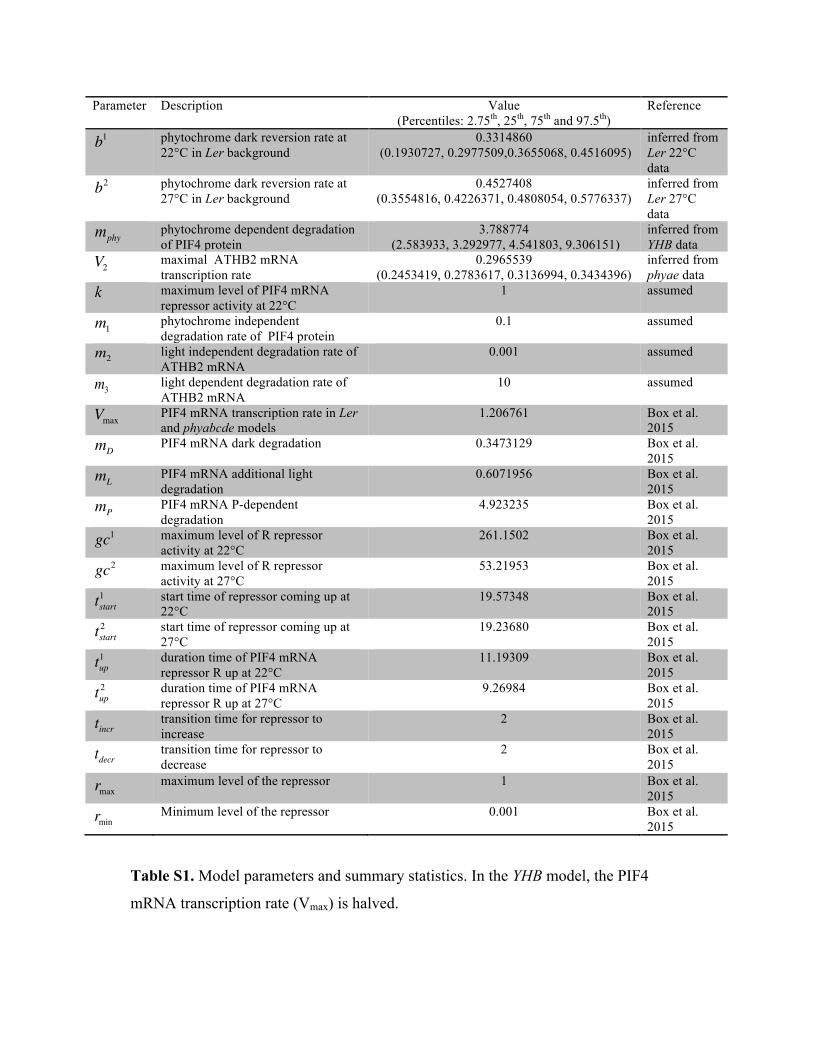
Parameter Description Value (Percentiles: 2.75th, 25th, 75th and 97.5th)
Reference
phytochrome dark reversion rate at 22°C in Ler background
0.3314860 (0.1930727, 0.2977509,0.3655068, 0.4516095)
inferred from Ler 22°C data
phytochrome dark reversion rate at 27°C in Ler background
0.4527408 (0.3554816, 0.4226371, 0.4808054, 0.5776337)
inferred from Ler 27°C data
phytochrome dependent degradation of PIF4 protein
3.788774 (2.583933, 3.292977, 4.541803, 9.306151)
inferred from YHB data
maximal ATHB2 mRNA transcription rate
0.2965539 (0.2453419, 0.2783617, 0.3136994, 0.3434396)
inferred from phyae data
maximum level of PIF4 mRNA repressor activity at 22°C
1 assumed
phytochrome independent degradation rate of PIF4 protein
0.1 assumed
light independent degradation rate of ATHB2 mRNA
0.001 assumed
light dependent degradation rate of ATHB2 mRNA
10 assumed
PIF4 mRNA transcription rate in Ler and phyabcde models
1.206761 Box et al. 2015
PIF4 mRNA dark degradation 0.3473129 Box et al.
2015
PIF4 mRNA additional light degradation
0.6071956 Box et al. 2015
PIF4 mRNA P-dependent degradation
4.923235 Box et al. 2015
maximum level of R repressor activity at 22°C
261.1502 Box et al. 2015
maximum level of R repressor activity at 27°C
53.21953 Box et al. 2015
start time of repressor coming up at 22°C
19.57348 Box et al. 2015
start time of repressor coming up at 27°C
19.23680 Box et al. 2015
duration time of PIF4 mRNA repressor R up at 22°C
11.19309 Box et al. 2015
duration time of PIF4 mRNA repressor R up at 27°C
9.26984 Box et al. 2015
transition time for repressor to increase
2 Box et al. 2015
transition time for repressor to decrease
2 Box et al. 2015
maximum level of the repressor 1 Box et al.
2015
Minimum level of the repressor 0.001 Box et al.
2015 Table S1. Model parameters and summary statistics. In the YHB model, the PIF4
mRNA transcription rate (Vmax) is halved.
b1
b2
mphy
V2k
m1m2
m3
VmaxmD
mL
mP
gc1
gc2
tstart1
tstart2
tup1
tup2
tincrtdecr
rmaxrmin
37
Legends for Data S1 to S6
Data S1
An Excel file containing the normalized read values (Transcripts Per Million; TPM)
for gene expression over a 24 h timecourse at 22 and 27ºC. A separate tab is present
for each genetic background: Landsberg erecta, phyABCDE and PHYB YHB (Fig. 2).
Data S2
An Excel file listing the genes in each of the 20 clusters depicted in Fig. 2.
Data S3
An Excel file listing the enriched Gene Ontology (GO)-terms for each of the 20
clusters depicted in Fig. 2.
Data S4
A list of the peaks detected as bound by phyB by ChIP-seq (Fig. 3)
Data S5
Scripts used to analyse the Illumina generated sequence reads for RNA- and ChIP-
seq. (Fig. 2 and 3).
Data S6
The code used to model the PIF-phytochrome temperature network (Fig. 4).

References
1. C. G. Willis, B. Ruhfel, R. B. Primack, A. J. Miller-Rushing, C. C. Davis, Phylogenetic patterns of species loss in Thoreau’s woods are driven by climate change. Proc. Natl. Acad. Sci. U.S.A. 105, 17029–17033 (2008). Medline doi:10.1073/pnas.0806446105
2. D. S. Battisti, R. L. Naylor, Historical warnings of future food insecurity with unprecedented seasonal heat. Science 323, 240–244 (2009). Medline doi:10.1126/science.1164363
3. W. M. Gray, A. Ostin, G. Sandberg, C. P. Romano, M. Estelle, High temperature promotes auxin-mediated hypocotyl elongation in Arabidopsis. Proc. Natl. Acad. Sci. U.S.A. 95, 7197–7202 (1998). Medline doi:10.1073/pnas.95.12.7197
4. K. J. Halliday, M. G. Salter, E. Thingnaes, G. C. Whitelam, Phytochrome control of flowering is temperature sensitive and correlates with expression of the floral integrator FT. Plant J. 33, 875–885 (2003). Medline doi:10.1046/j.1365-313X.2003.01674.x
5. M. A. Koini, L. Alvey, T. Allen, C. A. Tilley, N. P. Harberd, G. C. Whitelam, K. A. Franklin, High temperature-mediated adaptations in plant architecture require the bHLH transcription factor PIF4. Curr. Biol. 19, 408–413 (2009). Medline doi:10.1016/j.cub.2009.01.046
6. S. V. Kumar, D. Lucyshyn, K. E. Jaeger, E. Alós, E. Alvey, N. P. Harberd, P. A. Wigge, Transcription factor PIF4 controls the thermosensory activation of flowering. Nature 484, 242–245 (2012). Medline doi:10.1038/nature10928
7. T. Mizuno, Y. Nomoto, H. Oka, M. Kitayama, A. Takeuchi, M. Tsubouchi, T. Yamashino, Ambient temperature signal feeds into the circadian clock transcriptional circuitry through the EC night-time repressor in Arabidopsis thaliana. Plant Cell Physiol. 55, 958–976 (2014). Medline doi:10.1093/pcp/pcu030
8. M. S. Box, B. E. Huang, M. Domijan, K. E. Jaeger, A. K. Khattak, S. J. Yoo, E. L. Sedivy, D. M. Jones, T. J. Hearn, A. A. Webb, A. Grant, J. C. Locke, P. A. Wigge, ELF3 controls thermoresponsive growth in Arabidopsis. Curr. Biol. 25, 194–199 (2015). Medline doi:10.1016/j.cub.2014.10.076
9. A. Raschke, C. Ibañez, K. K. Ullrich, M. U. Anwer, S. Becker, A. Glöckner, J. Trenner, K. Denk, B. Saal, X. Sun, M. Ni, S. J. Davis, C. Delker, M. Quint, Natural variants of ELF3 affect thermomorphogenesis by transcriptionally modulating PIF4-dependent auxin response genes. BMC Plant Biol. 15, 197 (2015). Medline doi:10.1186/s12870-015-0566-6
10. S. V. Kumar, D. Lucyshyn, K. E. Jaeger, E. Alós, E. Alvey, N. P. Harberd, P. A. Wigge, Transcription factor PIF4 controls the thermosensory activation of flowering. Nature 484, 242–245 (2012). Medline doi:10.1038/nature10928
11. S. Lorrain, T. Allen, P. D. Duek, G. C. Whitelam, C. Fankhauser, Phytochrome-mediated inhibition of shade avoidance involves degradation of growth-promoting bHLH transcription factors. Plant J. 53, 312–323 (2008). Medline doi:10.1111/j.1365-313X.2007.03341.x
12. W. Hu, K. A. Franklin, R. A. Sharrock, M. A. Jones, S. L. Harmer, J. C. Lagarias, Unanticipated regulatory roles for Arabidopsis phytochromes revealed by null mutant analysis. Proc. Natl. Acad. Sci. U.S.A. 110, 1542–1547 (2013). Medline doi:10.1073/pnas.1221738110
13. H. A. Borthwick, S. B. Hendricks, M. W. Parker, E. H. Toole, V. K. Toole, A reversible photoreaction controlling seed germination. Proc. Natl. Acad. Sci. U.S.A. 38, 662–666 (1952). Medline doi:10.1073/pnas.38.8.662
14. W. L. Butler, H. C. Lane, H. W. Siegelman, Nonphotochemical transformations of phytochrome in vivo. Plant Physiol. 38, 514–519 (1963). Medline doi:10.1104/pp.38.5.514
15. M. Chen, J. Chory, C. Fankhauser, Light signal transduction in higher plants. Annu. Rev. Genet. 38, 87–117 (2004). Medline doi:10.1146/annurev.genet.38.072902.092259
16. L. Hennig, E. Schäfer, Both subunits of the dimeric plant photoreceptor phytochrome require chromophore for stability of the far-red light-absorbing form. J. Biol. Chem. 276, 7913–7918 (2001). Medline doi:10.1074/jbc.M009793200
17. C. Klose, F. Venezia, A. Hussong, S. Kircher, E. Schäfer, C. Fleck, Systematic analysis of how phytochrome B dimerization determines its specificity. Nat. Plants 1, 15090 (2015). Medline doi:10.1038/nplants.2015.90
18. U. Sweere, K. Eichenberg, J. Lohrmann, V. Mira-Rodado, I. Bäurle, J. Kudla, F. Nagy, E. Schafer, K. Harter, Interaction of the response regulator ARR4 with phytochrome B in modulating red light signaling. Science 294, 1108–1111 (2001). Medline doi:10.1126/science.1065022
19. W. Hu, Y. S. Su, J. C. Lagarias, A light-independent allele of phytochrome B faithfully recapitulates photomorphogenic transcriptional networks. Mol. Plant 2, 166–182 (2009). Medline doi:10.1093/mp/ssn086
20. Y. S. Su, J. C. Lagarias, Light-independent phytochrome signaling mediated by dominant GAF domain tyrosine mutants of Arabidopsis phytochromes in transgenic plants. Plant Cell 19, 2124–2139 (2007). Medline doi:10.1105/tpc.107.051516
21. F. Chen, B. Li, G. Li, J. B. Charron, M. Dai, X. Shi, X. W. Deng, Arabidopsis phytochrome A directly targets numerous promoters for individualized modulation of genes in a wide range of pathways. Plant Cell 26, 1949–1966 (2014). Medline doi:10.1105/tpc.114.123950
22. J. F. Martínez-García, E. Huq, P. H. Quail, Direct targeting of light signals to a promoter element-bound transcription factor. Science 288, 859–863 (2000). Medline doi:10.1126/science.288.5467.859
23. A. Pfeiffer, H. Shi, J. M. Tepperman, Y. Zhang, P. H. Quail, Combinatorial complexity in a transcriptionally centered signaling hub in Arabidopsis. Mol. Plant 7, 1598–1618 (2014). Medline doi:10.1093/mp/ssu087
24. Y. Zhang, O. Mayba, A. Pfeiffer, H. Shi, J. M. Tepperman, T. P. Speed, P. H. Quail, A quartet of PIF bHLH factors provides a transcriptionally centered signaling hub that regulates seedling morphogenesis through differential expression-patterning of shared target genes in Arabidopsis. PLOS Genet. 9, e1003244 (2013). Medline doi:10.1371/journal.pgen.1003244
25. P. Hornitschek, M. V. Kohnen, S. Lorrain, J. Rougemont, K. Ljung, I. López-Vidriero, J. M. Franco-Zorrilla, R. Solano, M. Trevisan, S. Pradervand, I. Xenarios, C. Fankhauser, Phytochrome interacting factors 4 and 5 control seedling growth in changing light conditions by directly controlling auxin signaling. Plant J. 71, 699–711 (2012). Medline doi:10.1111/j.1365-313X.2012.05033.x
26. P. J. Skene, S. Henikoff, A simple method for generating high-resolution maps of genome-wide protein binding. eLife 4, e09225 (2015). Medline doi:10.7554/eLife.09225
27. T. Yamashino, Y. Nomoto, S. Lorrain, M. Miyachi, S. Ito, N. Nakamichi, C. Fankhauser, T. Mizuno, Verification at the protein level of the PIF4-mediated external coincidence model for the temperature-adaptive photoperiodic control of plant growth in Arabidopsis thaliana. Plant Signal. Behav. 8, e23390 (2013). Medline doi:10.4161/psb.23390
28. K. E. Jaeger, N. Pullen, S. Lamzin, R. J. Morris, P. A. Wigge, Interlocking feedback loops govern the dynamic behavior of the floral transition in Arabidopsis. Plant Cell 25, 820–833 (2013). Medline doi:10.1105/tpc.113.109355
29. M. Medzihradszky, J. Bindics, É. Ádám, A. Viczián, É. Klement, S. Lorrain, P. Gyula, Z. Mérai, C. Fankhauser, K. F. Medzihradszky, T. Kunkel, E. Schäfer, F. Nagy, Phosphorylation of phytochrome B inhibits light-induced signaling via accelerated dark reversion in Arabidopsis. Plant Cell 25, 535–544 (2013). Medline doi:10.1105/tpc.112.106898
30. D. L. Filiault, C. A. Wessinger, J. R. Dinneny, J. Lutes, J. O. Borevitz, D. Weigel, J. Chory, J. N. Maloof, Amino acid polymorphisms in Arabidopsis phytochrome B cause differential responses to light. Proc. Natl. Acad. Sci. U.S.A. 105, 3157–3162 (2008). Medline doi:10.1073/pnas.0712174105
31. J. N. Maloof, J. O. Borevitz, T. Dabi, J. Lutes, R. B. Nehring, J. L. Redfern, G. T. Trainer, J. M. Wilson, T. Asami, C. C. Berry, D. Weigel, J. Chory, Natural variation in light sensitivity of Arabidopsis. Nat. Genet. 29, 441–446 (2001). Medline doi:10.1038/ng777

32. A. Kunihiro, T. Yamashino, T. Mizuno, PHYTOCHROME-INTERACTING FACTORS PIF4 and PIF5 are implicated in the regulation of hypocotyl elongation in response to blue light in Arabidopsis thaliana. Biosci. Biotechnol. Biochem. 74, 2538–2541 (2010). Medline doi:10.1271/bbb.100586
33. A. Pokhilko, A. P. Fernández, K. D. Edwards, M. M. Southern, K. J. Halliday, A. J. Millar, The clock gene circuit in Arabidopsis includes a repressilator with additional feedback loops. Mol. Syst. Biol. 8, 574 (2012). Medline doi:10.1038/msb.2012.6
34. J. Rausenberger, A. Hussong, S. Kircher, D. Kirchenbauer, J. Timmer, F. Nagy, E. Schäfer, C. Fleck, An integrative model for phytochrome B mediated photomorphogenesis: From protein dynamics to physiology. PLOS ONE 5, e10721 (2010). Medline doi:10.1371/journal.pone.0010721
35. W. K. Hastings, Monte carlo sampling methods using Markov chains and their applications. Biometrika 57, 97–109 (1970). doi:10.1093/biomet/57.1.97
36. D. Eddelbuettel, R. François, Rcpp: Seamless R and C ++ Integration. J. Stat. Softw. 40, 1–18 (2011). doi:10.18637/jss.v040.i08
37. H. Wickham, ggplot2: Elegant Graphics for Data Analysis (Springer, 2009).
38. S. Shannon, D. R. Meeks-Wagner, A mutation in the Arabidopsis TFL1 gene affects inflorescence meristem development. Plant Cell 3, 877–892 (1991). Medline doi:10.1105/tpc.3.9.877
39. V. Mira-Rodado, U. Sweere, C. Grefen, T. Kunkel, E. Fejes, F. Nagy, E. Schäfer, K. Harter, Functional cross-talk between two-component and phytochrome B signal transduction in Arabidopsis. J. Exp. Bot. 58, 2595–2607 (2007). Medline doi:10.1093/jxb/erm087
40. Y. Benjamini, Y. Hochberg, Controlling the false discovery rate: A practical and powerful approach to multiple testing. J. R. Stat. Soc. 57, 289–300 (1995).


![Phytochrome, Carbon Sensing, Metabolism, and …...Phytochrome, Carbon Sensing, Metabolism, and Plant Growth Plasticity1[CC-BY] Johanna Krahmer, Ashwin Ganpudi, Ammad Abbas, Andrés](https://img.pdfslide.us/doc/110x75/5e52046a46d25750920125b7/phytochrome-carbon-sensing-metabolism-and-phytochrome-carbon-sensing-metabolism.jpg)