Embed Size (px)
Citation preview
stm.sciencemag.org/cgi/content/full/12/545/eaay1548/DC1
Supplementary Materials for
Using genetics to prioritize diagnoses for rheumatology outpatients with
inflammatory arthritis
Rachel Knevel, Saskia le Cessie, Chikashi C. Terao, Kamil Slowikowski, Jing Cui, Tom W. J. Huizinga, Karen H. Costenbader, Katherine P. Liao, Elizabeth W. Karlson, Soumya Raychaudhuri*
*Corresponding author. Email: [email protected]
Published 27 May 2020, Sci. Transl. Med. 12, eaay1548 (2020)
DOI: 10.1126/scitranslmed.aay1548
The PDF file includes:
Fig. S1. Flowchart of the simulation study. Fig. S2. Test characteristics of different ICD9 cutoffs for identification of RA cases using reviewed medical record data as the gold standard. Fig. S3. Flowchart of patient selection in setting I. Fig. S4. Flowchart of patient selection in setting II. Fig. S5. Flowchart of patient selection in setting III. Fig. S6. Flowchart of the medical record review procedure. Fig. S7. Density plots of G-probabilities per disease. Fig. S8. Precision recall curves. Fig. S9. Sensitivity analysis of the performance of G-PROB per disease. Fig. S10. Sensitivity analysis of the influence of individual diseases on G-PROB’s performance. Fig. S11 Sensitivity analysis comparing different shrinkage factors. Fig. S12. Test characteristics for the probabilities at different cutoffs. Table S1. ICD9 and ICD10 codes used to identify patients in setting I (eMERGE). Table S2. Patient characteristics in setting I. Table S3. Patient characteristics in setting II. Table S4. Patient characteristics in setting III. Table S5. Area under the receiver operating curve per disease. Table S6. McFadden’s R2 from multinomial logistic regression testing how much of the variance in the final disease diagnosis was explained by clinical, genetic, or serologic information. Legends for data files S1 and S2

Other Supplementary Material for this manuscript includes the following: (available at stm.sciencemag.org/cgi/content/full/12/545/eaay1548/DC1)
Data file S1 (Microsoft Excel format). ORs of curated risk variants for RA, RAneg, SLE, PsA, SpA, and gout. Data file S2 (Microsoft Excel format). Disease prevalence used in G-PROB per setting.
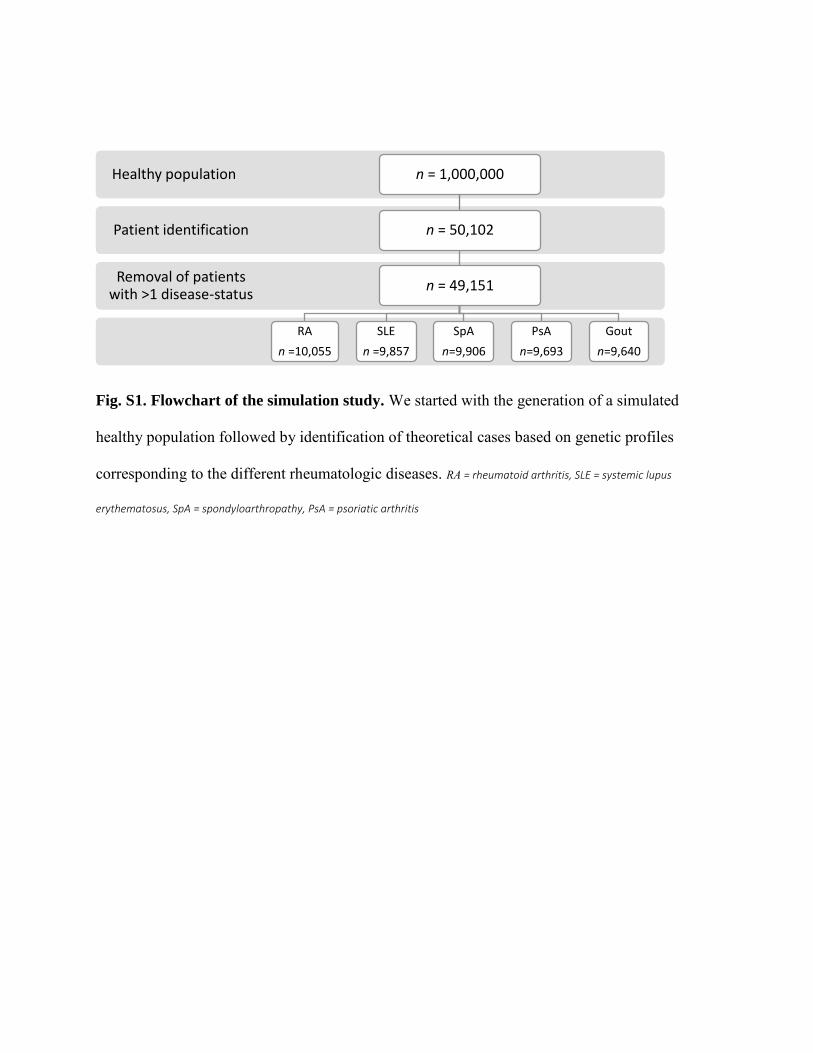
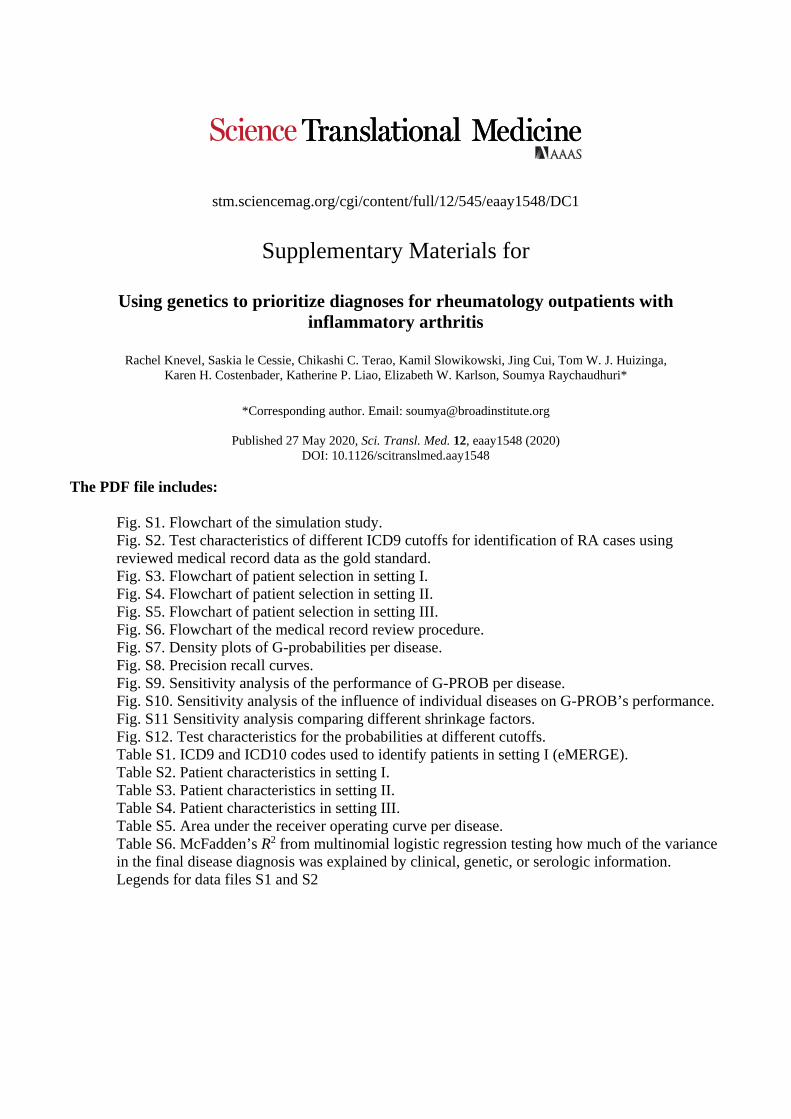
Fig. S1. Flowchart of the simulation study. We started with the generation of a simulated
healthy population followed by identification of theoretical cases based on genetic profiles
corresponding to the different rheumatologic diseases. RA = rheumatoid arthritis, SLE = systemic lupus
erythematosus, SpA = spondyloarthropathy, PsA = psoriatic arthritis
Removal of patients with >1 disease-status
Patient identification
Healthy population n = 1,000,000
n = 50,102
n = 49,151
RA
n =10,055
SLE
n =9,857
SpA
n=9,906
PsA
n=9,693
Gout
n=9,640
Chart review RA patients (n) Non-RA patients
(n)
ACR2010
Meeting
98 51
Expert opinion 94 56
Summary statistics of ICD9 counts of the reviewed notes
Min 1st Qu Median Mean 3
rd Qu Max
Number
of RA
ICD9
codes
0 2 4 54.9 54 1315
Fig. S2. Test characteristics of different ICD9 cutoffs for identification of RA cases using
reviewed medical record data as the gold standard.
RA = rheumatoid arthritis
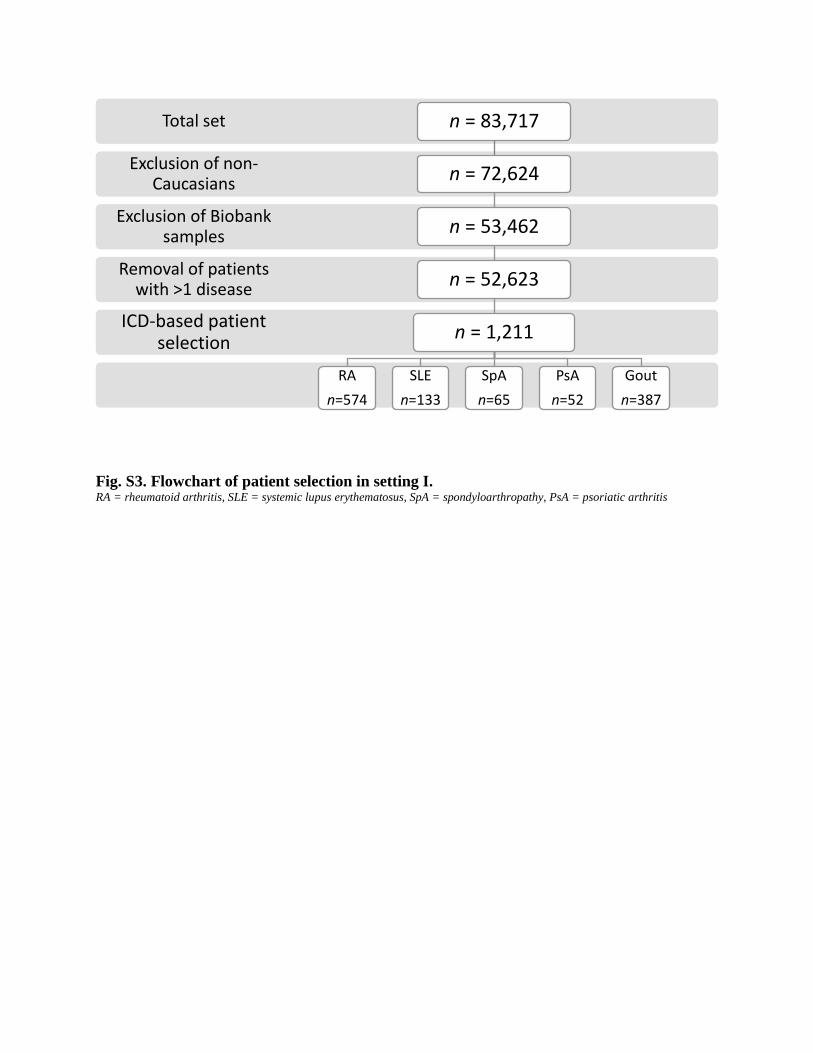
Fig. S3. Flowchart of patient selection in setting I. RA = rheumatoid arthritis, SLE = systemic lupus erythematosus, SpA = spondyloarthropathy, PsA = psoriatic arthritis
ICD-based patient selection
Removal of patients with >1 disease
Exclusion of Biobank samples
Exclusion of non-Caucasians
Total set n = 83,717
n = 72,624
n = 53,462
n = 52,623
n = 1,211
RA
n=574
SLE
n=133
SpA
n=65
PsA
n=52
Gout
n=387
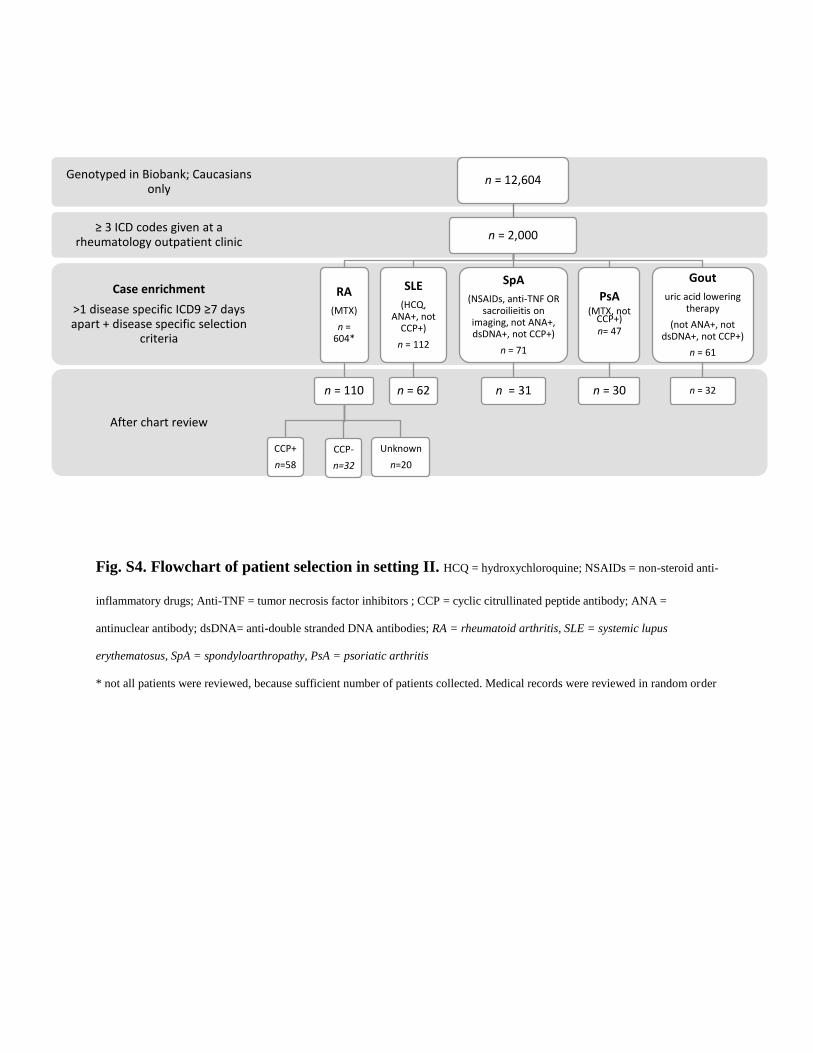
After chart review
Case enrichment
>1 disease specific ICD9 ≥7 days apart + disease specific selection
criteria
≥ 3 ICD codes given at a rheumatology outpatient clinic
Genotyped in Biobank; Caucasians only
n = 12,604
n = 2,000
RA
(MTX)
n = 604*
n = 110
CCP+
n=58
CCP-
n=32
Unknown
n=20
SLE
(HCQ, ANA+, not
CCP+)
n = 112
n = 62
SpA
(NSAIDs, anti-TNF OR sacroilieitis on
imaging, not ANA+, dsDNA+, not CCP+)
n = 71
n = 31
PsA (MTX, not
CCP+) n= 47
n = 30
Gout
uric acid lowering therapy
(not ANA+, not dsDNA+, not CCP+)
n = 61
n = 32
Fig. S4. Flowchart of patient selection in setting II. HCQ = hydroxychloroquine; NSAIDs = non-steroid anti-
inflammatory drugs; Anti-TNF = tumor necrosis factor inhibitors ; CCP = cyclic citrullinated peptide antibody; ANA =
antinuclear antibody; dsDNA= anti-double stranded DNA antibodies; RA = rheumatoid arthritis, SLE = systemic lupus
erythematosus, SpA = spondyloarthropathy, PsA = psoriatic arthritis
* not all patients were reviewed, because sufficient number of patients collected. Medical records were reviewed in random order
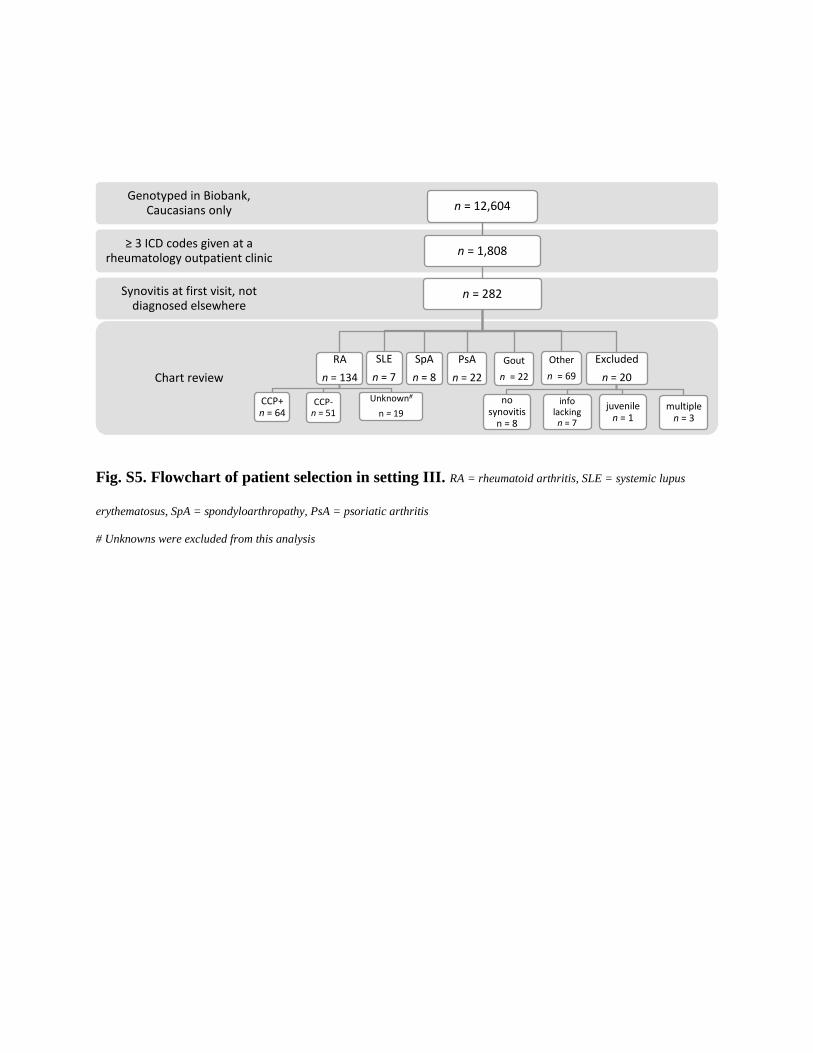
Fig. S5. Flowchart of patient selection in setting III. RA = rheumatoid arthritis, SLE = systemic lupus
erythematosus, SpA = spondyloarthropathy, PsA = psoriatic arthritis
# Unknowns were excluded from this analysis
Chart review
Synovitis at first visit, not diagnosed elsewhere
≥ 3 ICD codes given at a rheumatology outpatient clinic
Genotyped in Biobank, Caucasians only n = 12,604
n = 1,808
n = 282
RA
n = 134
CCP+ n = 64
CCP- n = 51
Unknown#
n = 19
SLE
n = 7
SpA
n = 8
PsA
n = 22
Gout
n = 22
Other
n = 69
Excluded
n = 20
no synovitis
n = 8
info lacking n = 7
juvenile n = 1
multiple n = 3
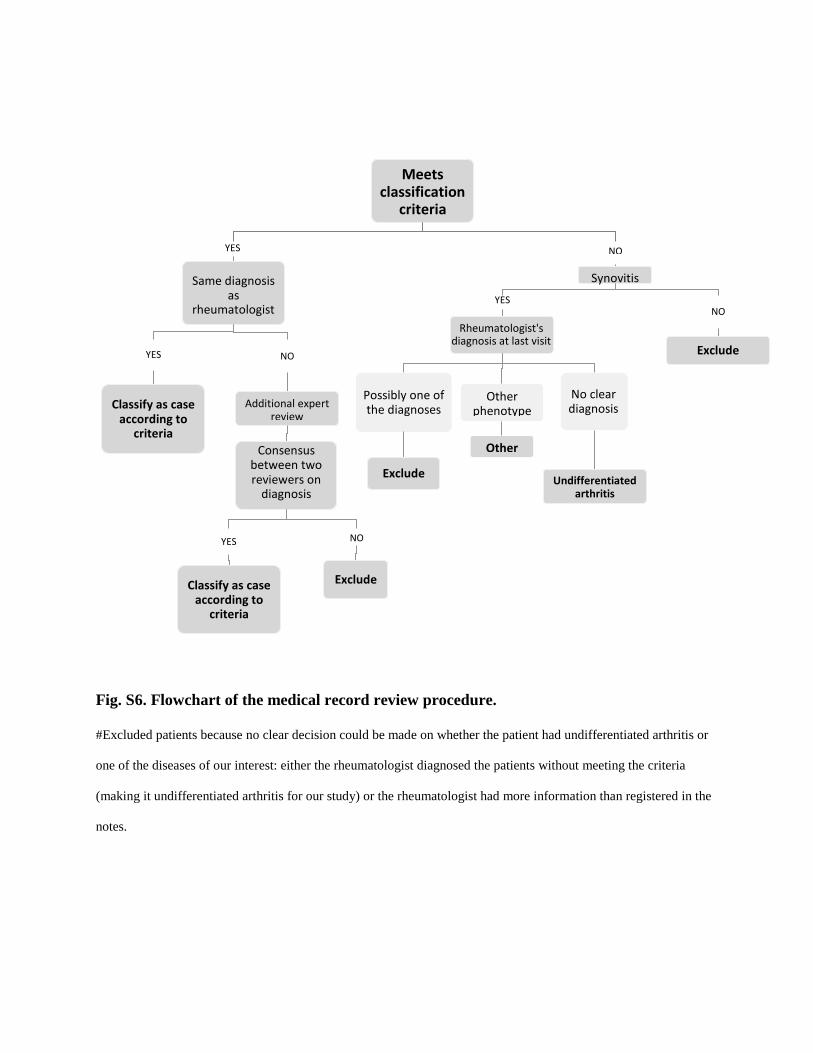
Fig. S6. Flowchart of the medical record review procedure.
#Excluded patients because no clear decision could be made on whether the patient had undifferentiated arthritis or
one of the diseases of our interest: either the rheumatologist diagnosed the patients without meeting the criteria
(making it undifferentiated arthritis for our study) or the rheumatologist had more information than registered in the
notes.
Meets
classification criteria
YES
Same diagnosis
as rheumatologist
YES
Classify as case
according to criteria
NO
Additional expert
review
Consensus between two reviewers on
diagnosis
YES
Classify as case
according to criteria
NO
Exclude
NO
Synovitis
YES
Rheumatologist's
diagnosis at last visit
Possibly one of the diagnoses
Exclude
Other
phenotype
Other
No clear diagnosis
Undifferentiated
arthritis
NO
Exclude
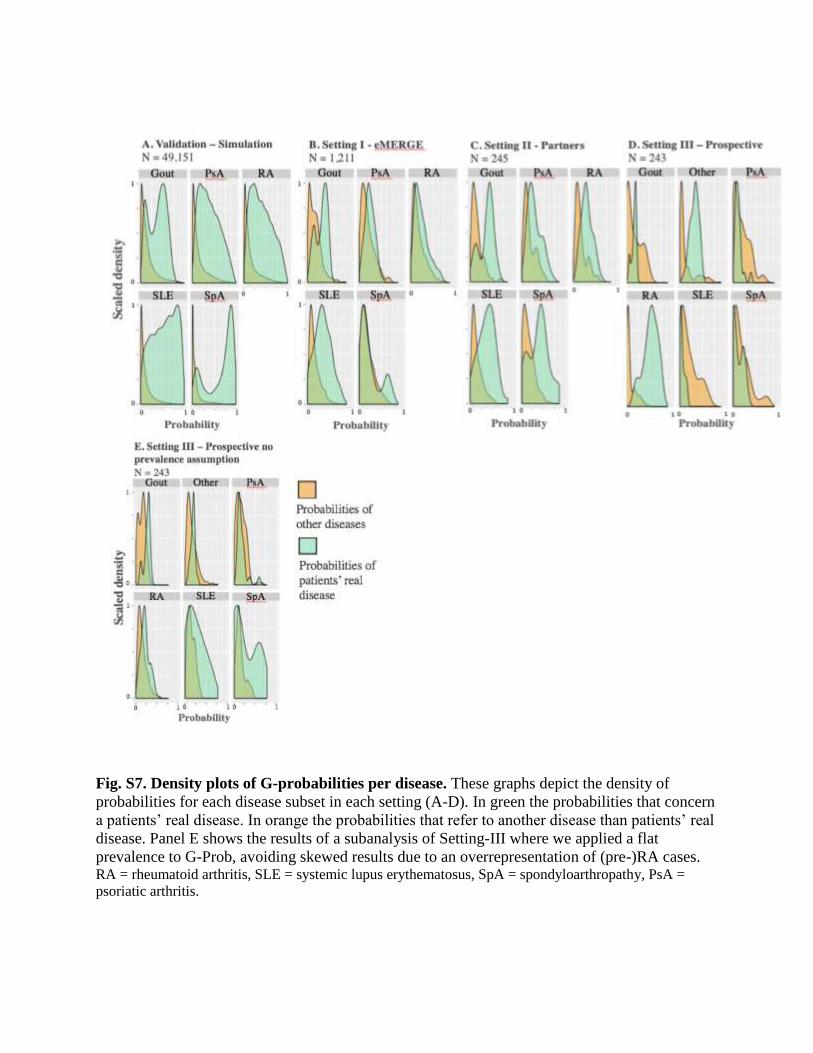
Fig. S7. Density plots of G-probabilities per disease. These graphs depict the density of
probabilities for each disease subset in each setting (A-D). In green the probabilities that concern
a patients’ real disease. In orange the probabilities that refer to another disease than patients’ real
disease. Panel E shows the results of a subanalysis of Setting-III where we applied a flat
prevalence to G-Prob, avoiding skewed results due to an overrepresentation of (pre-)RA cases. RA = rheumatoid arthritis, SLE = systemic lupus erythematosus, SpA = spondyloarthropathy, PsA =
psoriatic arthritis.
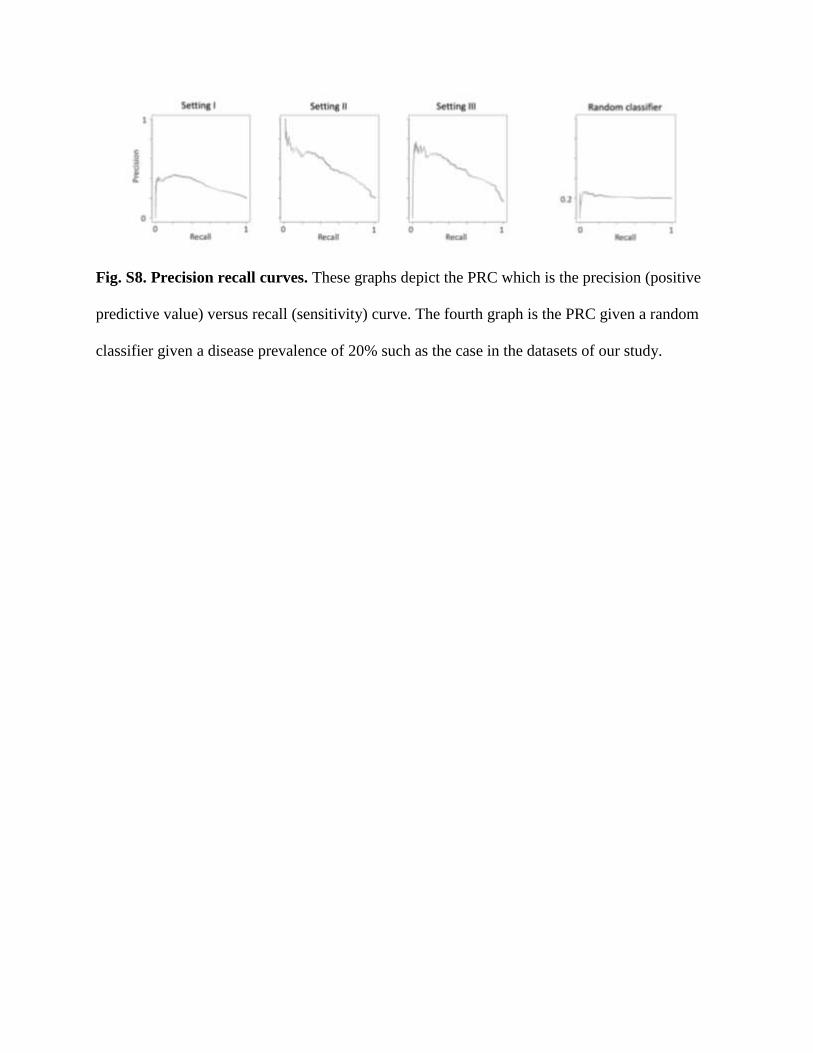
Fig. S8. Precision recall curves. These graphs depict the PRC which is the precision (positive
predictive value) versus recall (sensitivity) curve. The fourth graph is the PRC given a random
classifier given a disease prevalence of 20% such as the case in the datasets of our study.
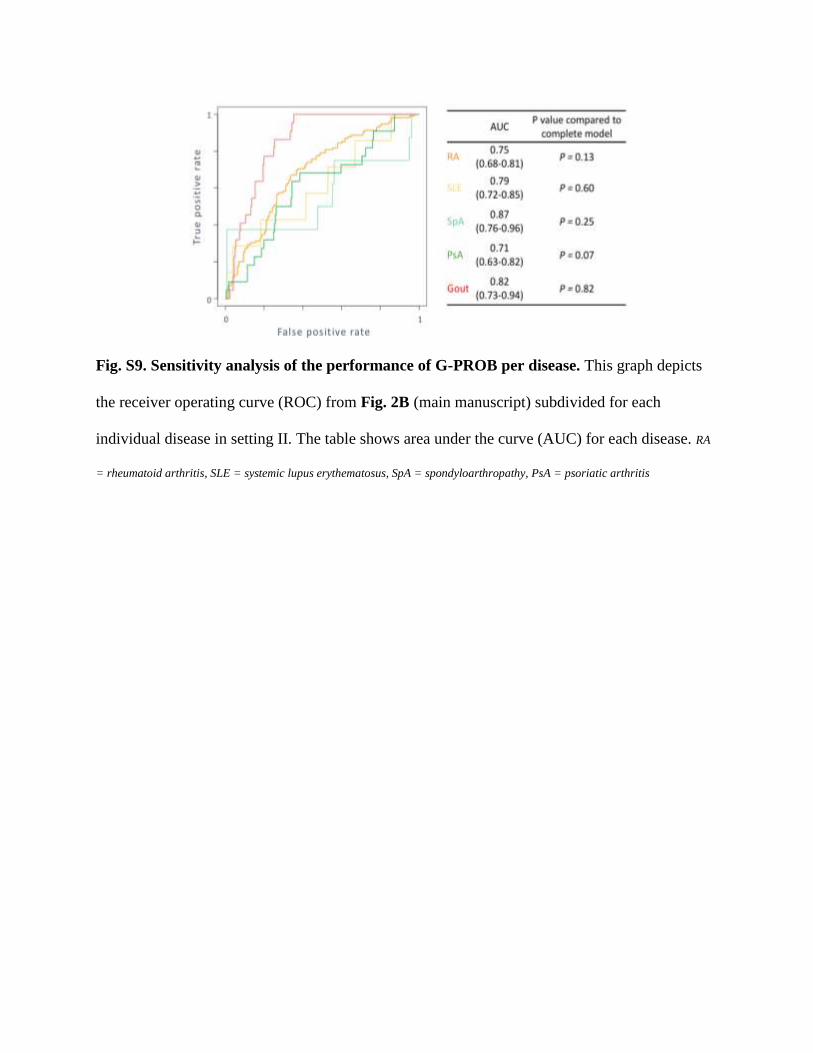
Fig. S9. Sensitivity analysis of the performance of G-PROB per disease. This graph depicts
the receiver operating curve (ROC) from Fig. 2B (main manuscript) subdivided for each
individual disease in setting II. The table shows area under the curve (AUC) for each disease. RA
= rheumatoid arthritis, SLE = systemic lupus erythematosus, SpA = spondyloarthropathy, PsA = psoriatic arthritis
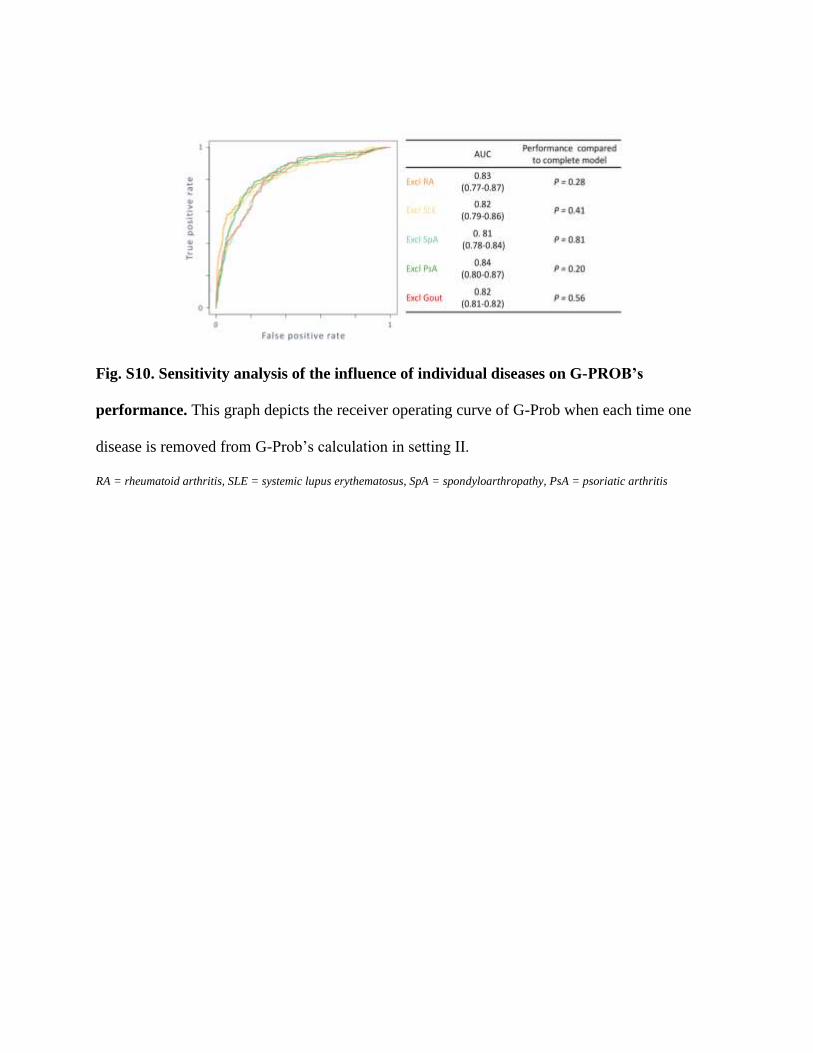
Fig. S10. Sensitivity analysis of the influence of individual diseases on G-PROB’s
performance. This graph depicts the receiver operating curve of G-Prob when each time one
disease is removed from G-Prob’s calculation in setting II.
RA = rheumatoid arthritis, SLE = systemic lupus erythematosus, SpA = spondyloarthropathy, PsA = psoriatic arthritis
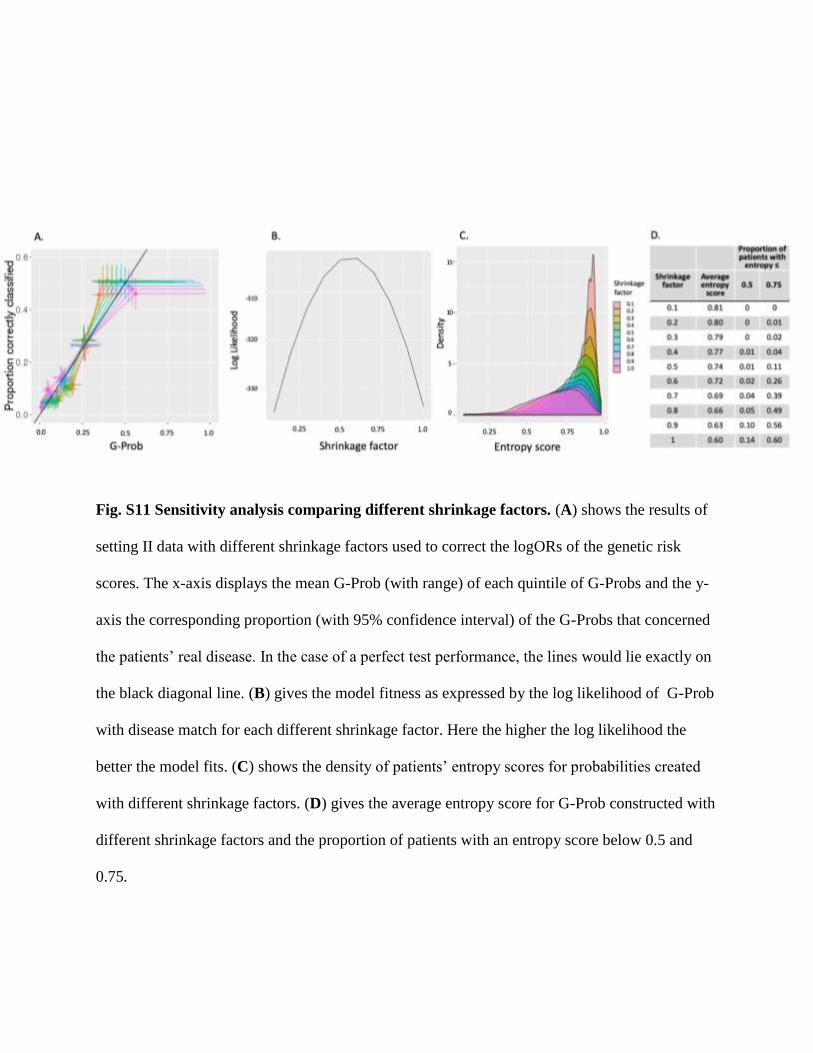
Fig. S11 Sensitivity analysis comparing different shrinkage factors. (A) shows the results of
setting II data with different shrinkage factors used to correct the logORs of the genetic risk
scores. The x-axis displays the mean G-Prob (with range) of each quintile of G-Probs and the y-
axis the corresponding proportion (with 95% confidence interval) of the G-Probs that concerned
the patients’ real disease. In the case of a perfect test performance, the lines would lie exactly on
the black diagonal line. (B) gives the model fitness as expressed by the log likelihood of G-Prob
with disease match for each different shrinkage factor. Here the higher the log likelihood the
better the model fits. (C) shows the density of patients’ entropy scores for probabilities created
with different shrinkage factors. (D) gives the average entropy score for G-Prob constructed with
different shrinkage factors and the proportion of patients with an entropy score below 0.5 and
0.75.
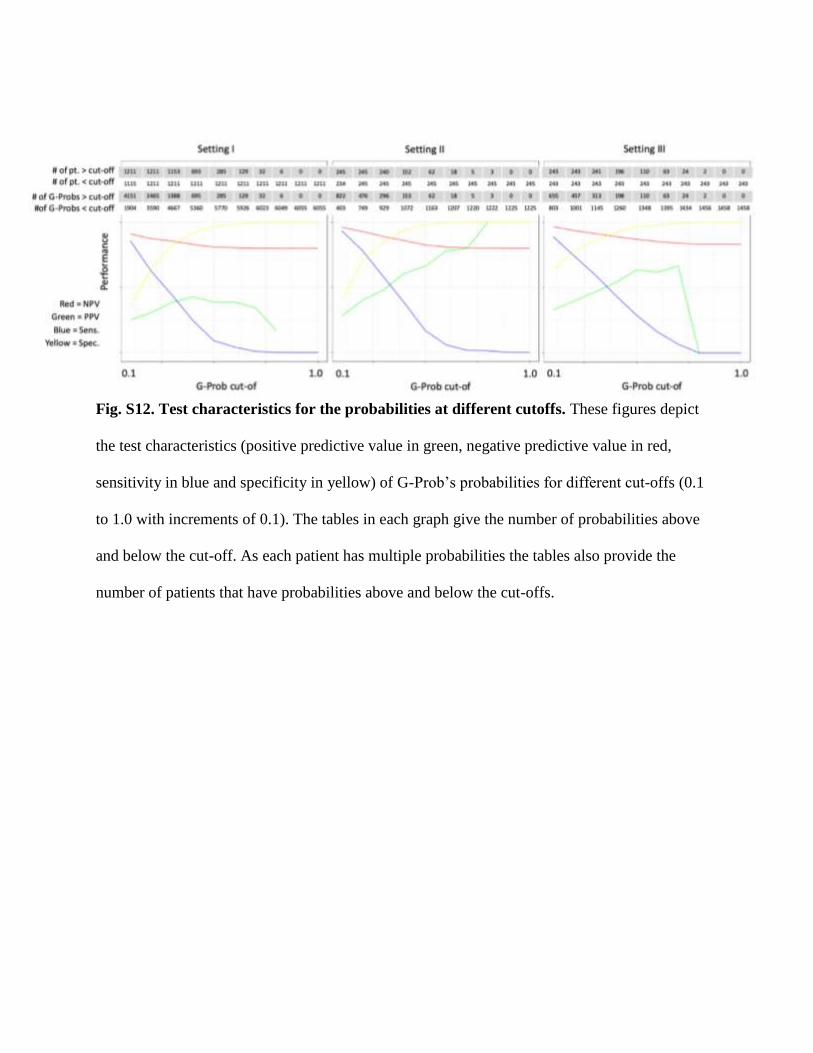
Fig. S12. Test characteristics for the probabilities at different cutoffs. These figures depict
the test characteristics (positive predictive value in green, negative predictive value in red,
sensitivity in blue and specificity in yellow) of G-Prob’s probabilities for different cut-offs (0.1
to 1.0 with increments of 0.1). The tables in each graph give the number of probabilities above
and below the cut-off. As each patient has multiple probabilities the tables also provide the
number of patients that have probabilities above and below the cut-offs.
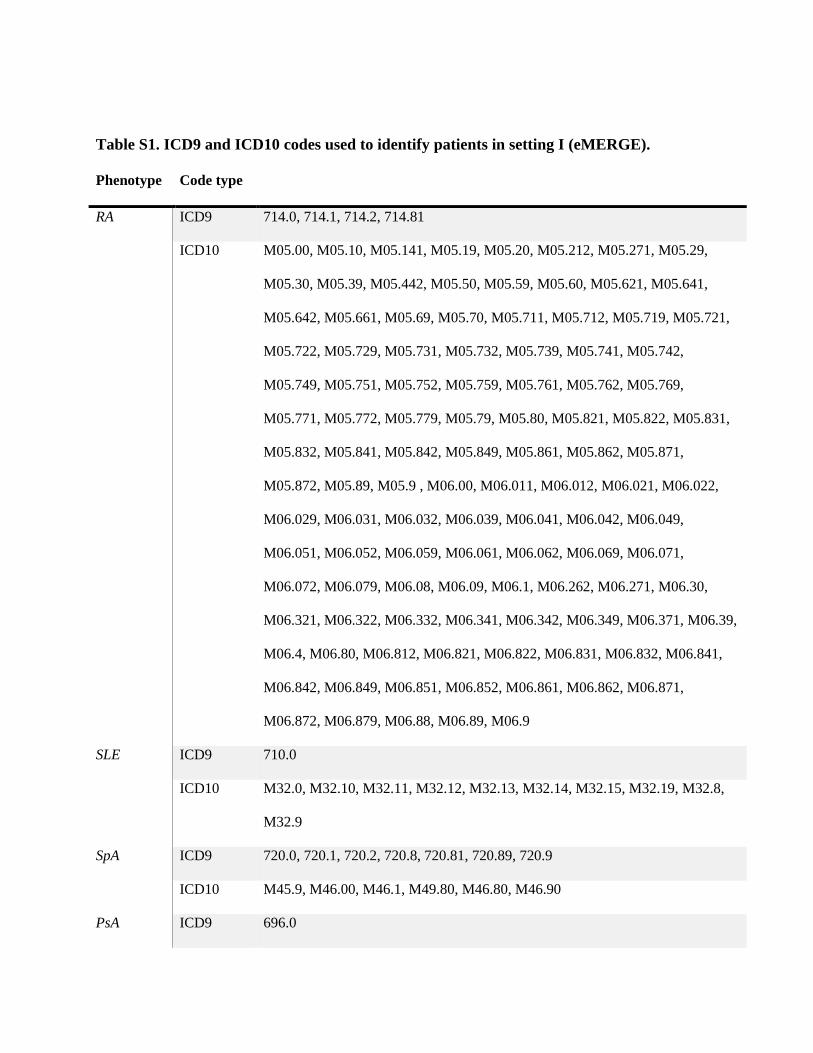
Table S1. ICD9 and ICD10 codes used to identify patients in setting I (eMERGE).
Phenotype Code type
RA ICD9 714.0, 714.1, 714.2, 714.81
ICD10 M05.00, M05.10, M05.141, M05.19, M05.20, M05.212, M05.271, M05.29,
M05.30, M05.39, M05.442, M05.50, M05.59, M05.60, M05.621, M05.641,
M05.642, M05.661, M05.69, M05.70, M05.711, M05.712, M05.719, M05.721,
M05.722, M05.729, M05.731, M05.732, M05.739, M05.741, M05.742,
M05.749, M05.751, M05.752, M05.759, M05.761, M05.762, M05.769,
M05.771, M05.772, M05.779, M05.79, M05.80, M05.821, M05.822, M05.831,
M05.832, M05.841, M05.842, M05.849, M05.861, M05.862, M05.871,
M05.872, M05.89, M05.9 , M06.00, M06.011, M06.012, M06.021, M06.022,
M06.029, M06.031, M06.032, M06.039, M06.041, M06.042, M06.049,
M06.051, M06.052, M06.059, M06.061, M06.062, M06.069, M06.071,
M06.072, M06.079, M06.08, M06.09, M06.1, M06.262, M06.271, M06.30,
M06.321, M06.322, M06.332, M06.341, M06.342, M06.349, M06.371, M06.39,
M06.4, M06.80, M06.812, M06.821, M06.822, M06.831, M06.832, M06.841,
M06.842, M06.849, M06.851, M06.852, M06.861, M06.862, M06.871,
M06.872, M06.879, M06.88, M06.89, M06.9
SLE ICD9 710.0
ICD10 M32.0, M32.10, M32.11, M32.12, M32.13, M32.14, M32.15, M32.19, M32.8,
M32.9
SpA ICD9 720.0, 720.1, 720.2, 720.8, 720.81, 720.89, 720.9
ICD10 M45.9, M46.00, M46.1, M49.80, M46.80, M46.90
PsA ICD9 696.0

ICD10 L40.52, L40.51, L40.50, L40.59, L40.54
Gout ICD9 274, 274.0, 274.00, 274.01, 274.02, 274.03, 274.1, 274.10, 274.11, 274.19,
274.8, 274.81, 274.82, 274.89, 274.9
ICD10 M10.00, M1A.9XX0, M1A.00XX1, M10.30, M10.9, M10.40
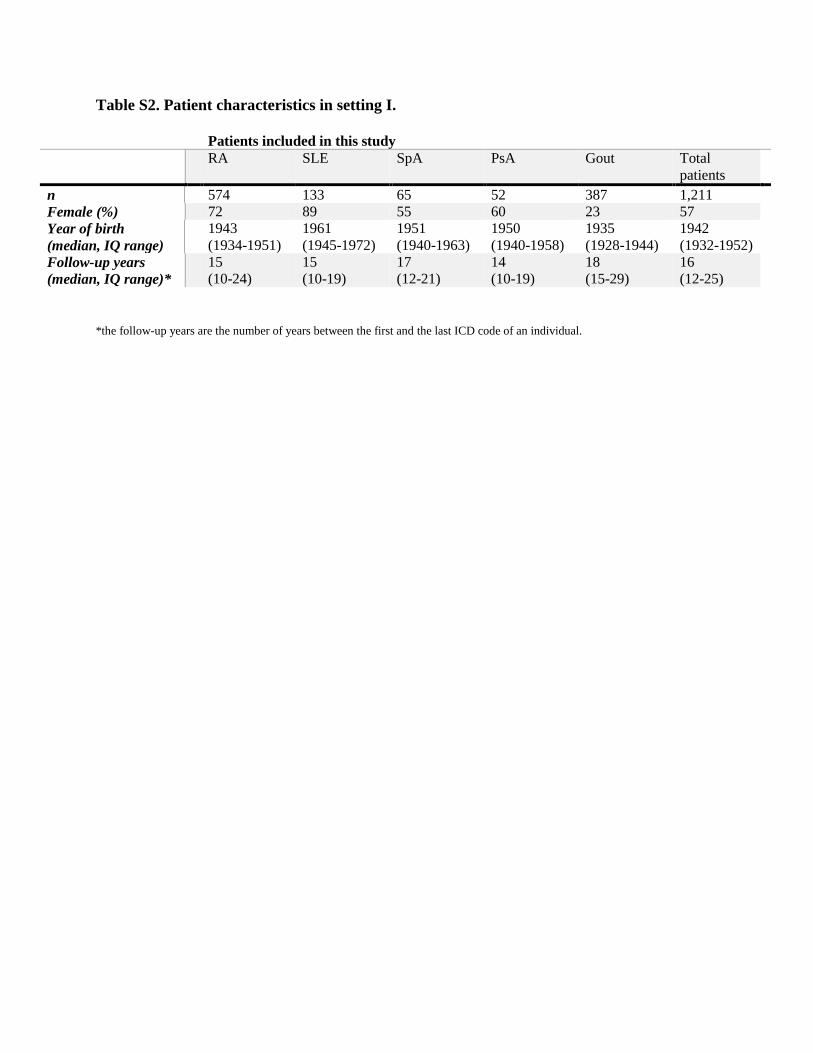
Table S2. Patient characteristics in setting I.
Patients included in this study
RA SLE SpA PsA Gout Total
patients
n 574 133 65 52 387 1,211
Female (%) 72 89 55 60 23 57
Year of birth
(median, IQ range)
1943
(1934-1951)
1961
(1945-1972)
1951
(1940-1963)
1950
(1940-1958)
1935
(1928-1944)
1942
(1932-1952)
Follow-up years
(median, IQ range)*
15
(10-24)
15
(10-19)
17
(12-21)
14
(10-19)
18
(15-29)
16
(12-25)
*the follow-up years are the number of years between the first and the last ICD code of an individual.
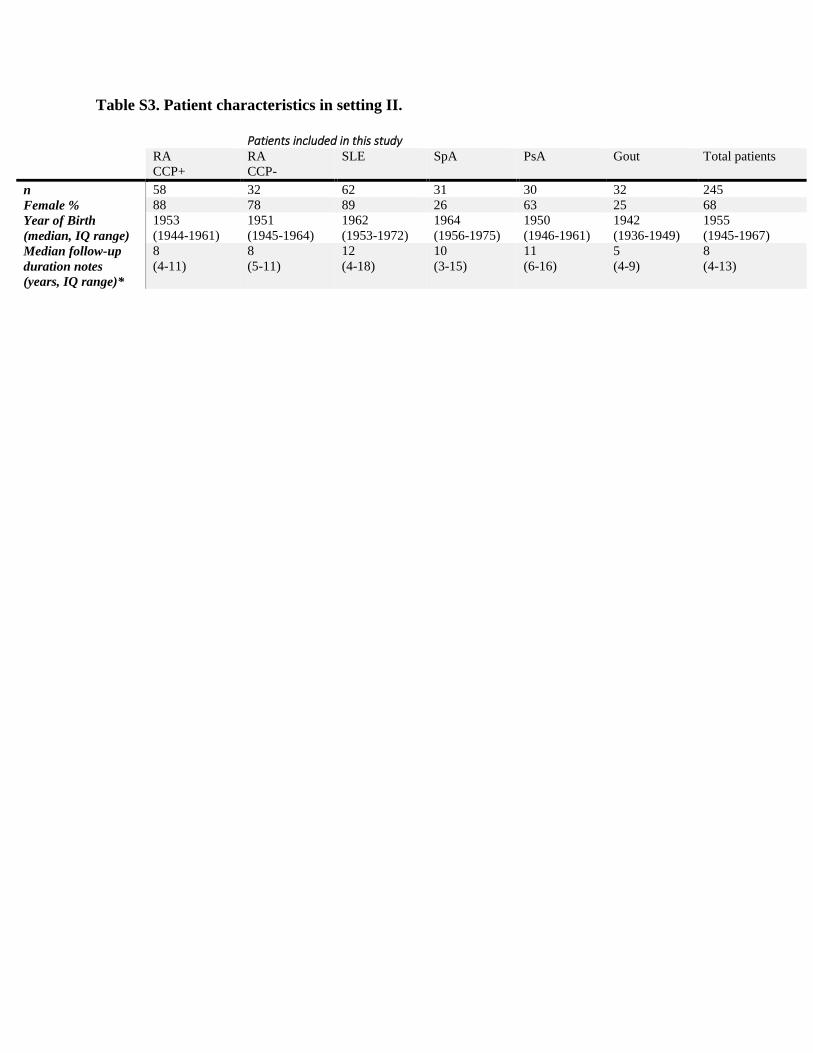
Table S3. Patient characteristics in setting II.
Patients included in this study
RA
CCP+
RA
CCP-
SLE SpA PsA Gout Total patients
n 58 32 62 31 30 32 245
Female % 88 78 89 26 63 25 68
Year of Birth
(median, IQ range)
1953
(1944-1961)
1951
(1945-1964)
1962
(1953-1972)
1964
(1956-1975)
1950
(1946-1961)
1942
(1936-1949)
1955
(1945-1967)
Median follow-up
duration notes
(years, IQ range)*
8
(4-11)
8
(5-11)
12
(4-18)
10
(3-15)
11
(6-16)
5
(4-9)
8
(4-13)
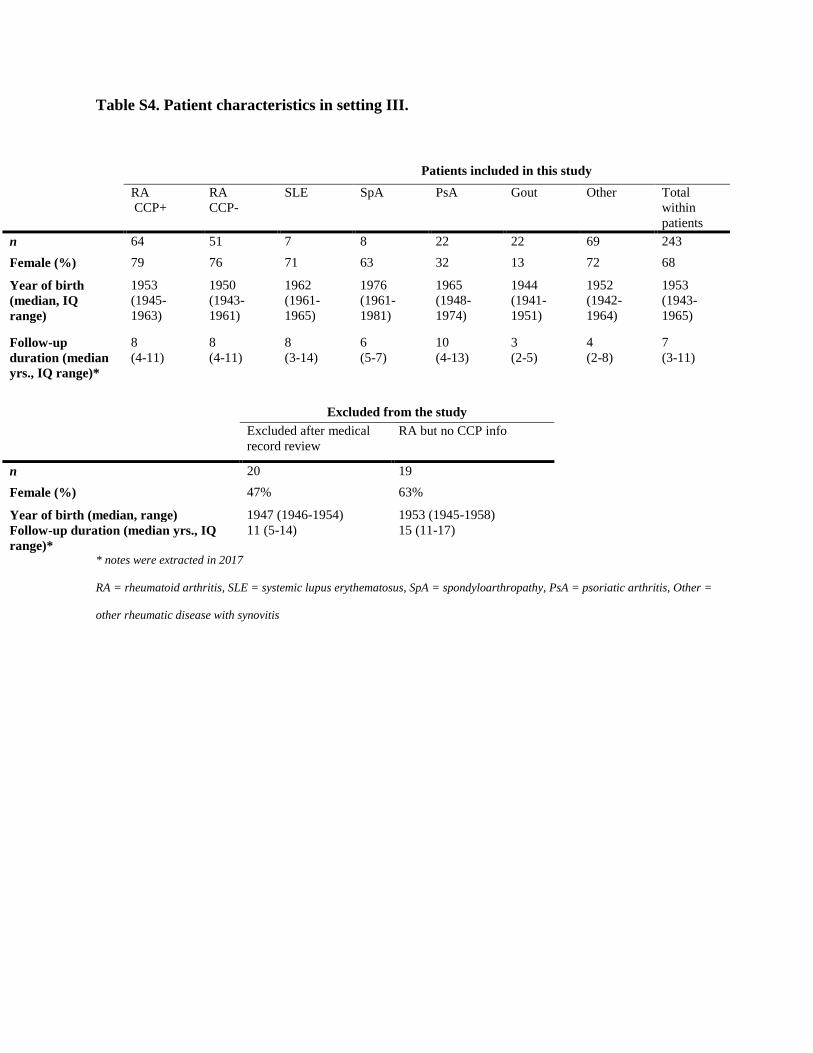
Table S4. Patient characteristics in setting III.
* notes were extracted in 2017
RA = rheumatoid arthritis, SLE = systemic lupus erythematosus, SpA = spondyloarthropathy, PsA = psoriatic arthritis, Other =
other rheumatic disease with synovitis
Patients included in this study
RA
CCP+
RA
CCP-
SLE SpA PsA Gout Other Total
within
patients
n 64 51 7 8 22 22 69 243
Female (%) 79 76 71 63 32 13 72 68
Year of birth
(median, IQ
range)
1953
(1945-
1963)
1950
(1943-
1961)
1962
(1961-
1965)
1976
(1961-
1981)
1965
(1948-
1974)
1944
(1941-
1951)
1952
(1942-
1964)
1953
(1943-
1965)
Follow-up
duration (median
yrs., IQ range)*
8
(4-11)
8
(4-11)
8
(3-14)
6
(5-7)
10
(4-13)
3
(2-5)
4
(2-8)
7
(3-11)
Excluded from the study
Excluded after medical
record review
RA but no CCP info
n 20 19
Female (%) 47% 63%
Year of birth (median, range) 1947 (1946-1954) 1953 (1945-1958)
Follow-up duration (median yrs., IQ
range)*
11 (5-14) 15 (11-17)
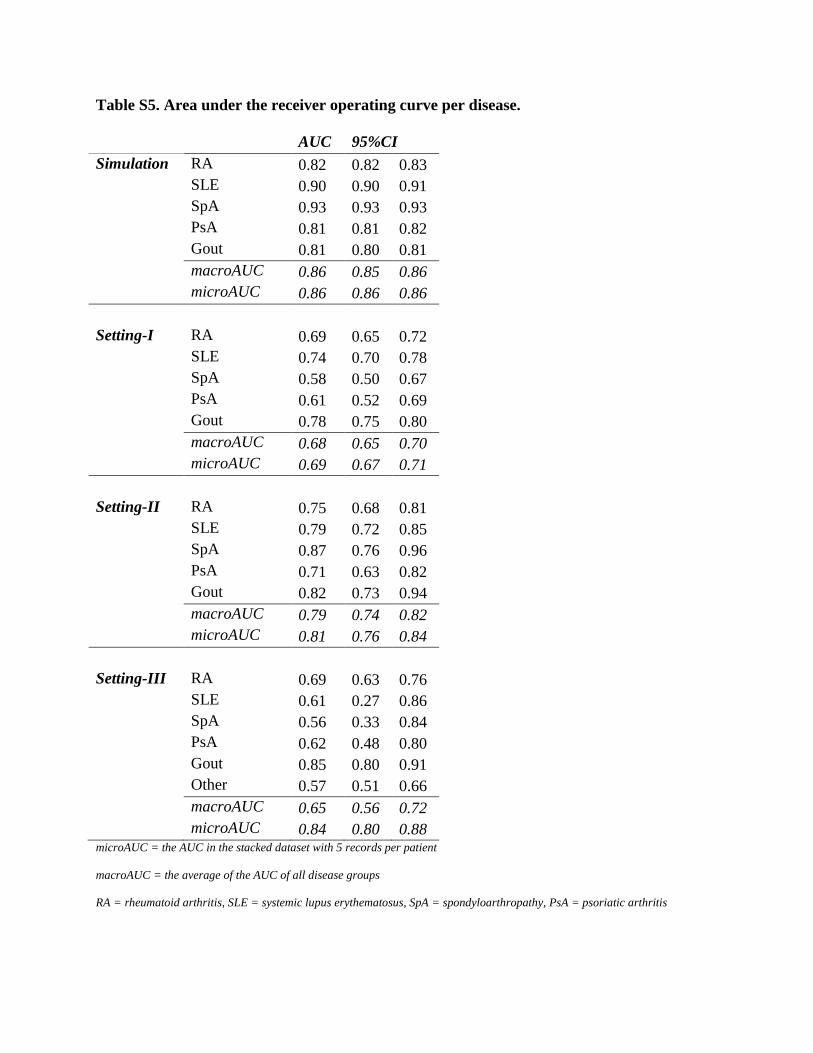
Table S5. Area under the receiver operating curve per disease.
AUC 95%CI
Simulation RA 0.82 0.82 0.83
SLE 0.90 0.90 0.91
SpA 0.93 0.93 0.93
PsA 0.81 0.81 0.82
Gout 0.81 0.80 0.81
macroAUC 0.86 0.85 0.86
microAUC 0.86 0.86 0.86
Setting-I RA 0.69 0.65 0.72
SLE 0.74 0.70 0.78
SpA 0.58 0.50 0.67
PsA 0.61 0.52 0.69
Gout 0.78 0.75 0.80
macroAUC 0.68 0.65 0.70
microAUC 0.69 0.67 0.71
Setting-II RA 0.75 0.68 0.81
SLE 0.79 0.72 0.85
SpA 0.87 0.76 0.96
PsA 0.71 0.63 0.82
Gout 0.82 0.73 0.94
macroAUC 0.79 0.74 0.82
microAUC 0.81 0.76 0.84
Setting-III RA 0.69 0.63 0.76
SLE 0.61 0.27 0.86
SpA 0.56 0.33 0.84
PsA 0.62 0.48 0.80
Gout 0.85 0.80 0.91
Other 0.57 0.51 0.66
macroAUC 0.65 0.56 0.72
microAUC 0.84 0.80 0.88 microAUC = the AUC in the stacked dataset with 5 records per patient
macroAUC = the average of the AUC of all disease groups
RA = rheumatoid arthritis, SLE = systemic lupus erythematosus, SpA = spondyloarthropathy, PsA = psoriatic arthritis
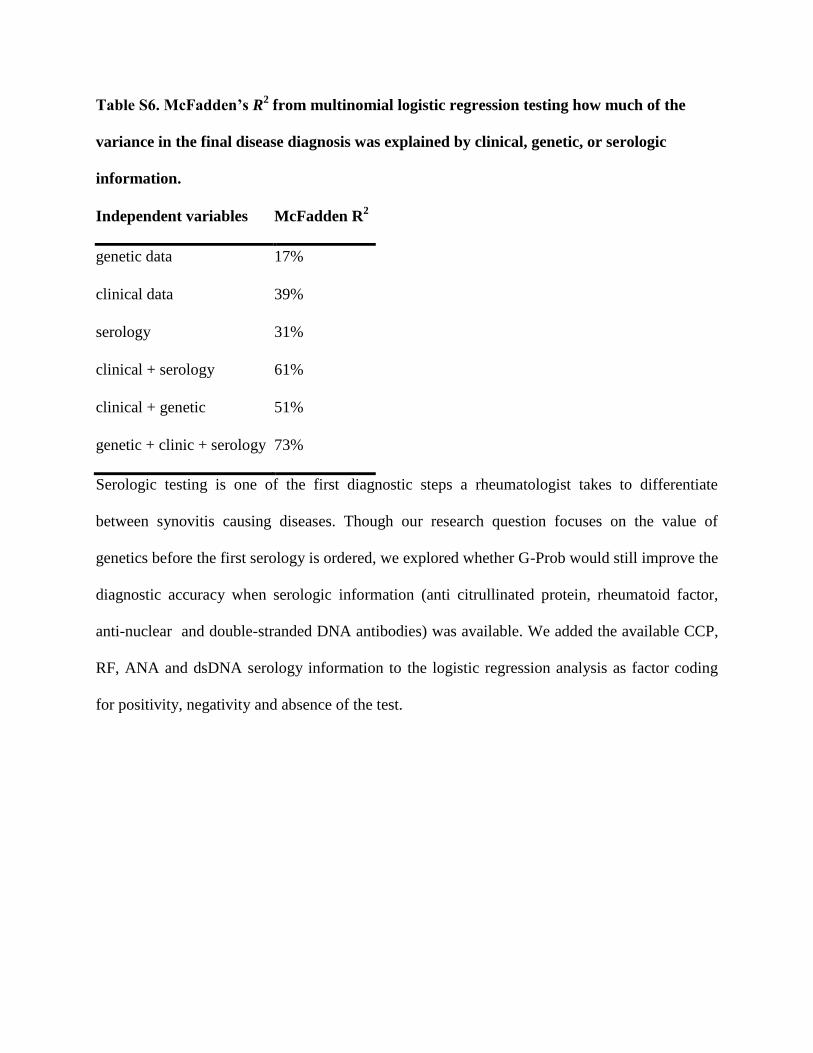
Table S6. McFadden’s R2 from multinomial logistic regression testing how much of the
variance in the final disease diagnosis was explained by clinical, genetic, or serologic
information.
Independent variables McFadden R2
genetic data 17%
clinical data 39%
serology 31%
clinical + serology 61%
clinical + genetic 51%
genetic + clinic + serology 73%
Serologic testing is one of the first diagnostic steps a rheumatologist takes to differentiate
between synovitis causing diseases. Though our research question focuses on the value of
genetics before the first serology is ordered, we explored whether G-Prob would still improve the
diagnostic accuracy when serologic information (anti citrullinated protein, rheumatoid factor,
anti-nuclear and double-stranded DNA antibodies) was available. We added the available CCP,
RF, ANA and dsDNA serology information to the logistic regression analysis as factor coding
for positivity, negativity and absence of the test.

Data file S1. ORs of curated risk variants for RA, RAneg, SLE, PsA, SpA, and gout.
Data file S2. Disease prevalence used in G-PROB per setting.