Embed Size (px)
Citation preview

www.sciencemag.org/content/349/6250/873/suppl/DC1
Supplementary Materials for
Membrane potential modulates plasma membrane phospholipid
dynamics and K-Ras signaling
Yong Zhou, Ching-On Wong, Kwang-jin Cho, Dharini van der Hoeven, Hong Liang,
Dhananiay P. Thakur, Jialie Luo, Milos Babic, Konrad E. Zinsmaier, Michael X. Zhu,
Hongzhen Hu, Kartik Venkatachalam, John F. Hancock*
*Corresponding author. E-mail: [email protected]
Published 21 August 2015, Science 349, 873 (2015)
DOI: 10.1126/science.aaa5619
This PDF file includes:
Materials and Methods
Figs. S1 to S16
2
Materials and Methods Materials BHK cells were maintained in DMEM (10% BCS) while CHO cells were grown in F-12K (10% FBS). Mutant PSA-3 cells were grown in F-12K with dialyzed FBS for at least 72 hours to ensure efficient PS depletion while 10µM ethanolamine was added to the media to recover PS level back to the wild-type level (16). Neuroblastoma (N2A) cells were cultured in DMEM containing 10% FBS and incubated in serum-free DMEM over-night to allow sufficient differentiation. Dr. Sergio Grinstein (The Hospital for Sick Children, Toronto, Canada) generously provided GFP-LactC2 (lactadherin C2 domain) as a specific probe for PS. Dr. Guangwei Du (University of Texas Health Science Center, Houston, Texas, USA) kindly provided GFP-Spo20 (PA-binding domain derived from Saccharomyces cerevisiae protein Spo20), GFP-PH-PLCδ (pleckstrin homology, PH, domain of phospholipase C-delta specifically for binding to PIP2) and GFP-PH-Akt (PH domain of Akt and a PIP3 probe) (9). HEPES buffer contains NaCl 140mM, KCl 5mM, CaCl2 2mM, MgCl2 1mM, HEPES 10mM, Glucose 10mM, sucrose 30mM. Solution pH was adjusted to 7.4 with NaOH. For high K+ solution, NaCl was replaced with an equal molar concentration of KCl and other components remained the same. For Ca2+-free buffer, MgCl2 was adjusted to 2mM while additional 1mM EGTA was added to quench any trace amount of Ca2+. Fluorescent lipids, TopFluor-PS (TF-PS) or TopFluor-PIP2 (TF-PIP2), were purchased from Avanti Polar Lipids in powder form, dissolved in chloroform as stock (1mg/ml) and stored at -20oC under N2. Methods Immuno-electron microscopy (EM) spatial mapping:
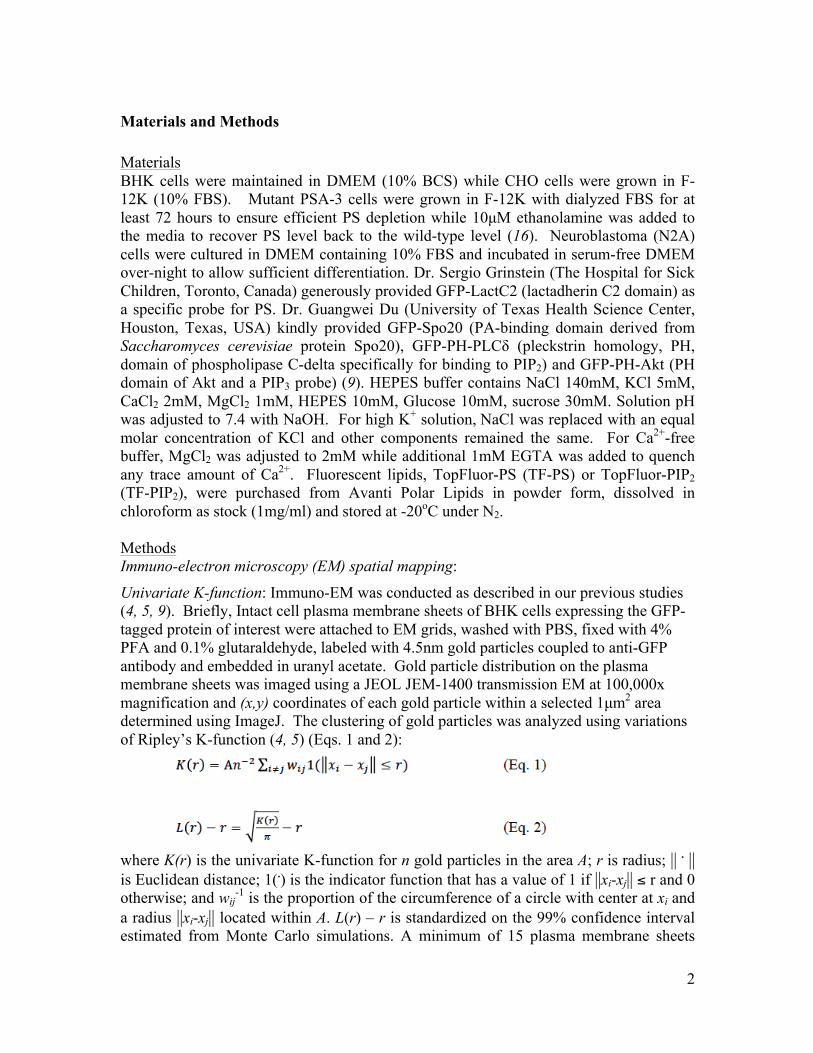
Univariate K-function: Immuno-EM was conducted as described in our previous studies (4, 5, 9). Briefly, Intact cell plasma membrane sheets of BHK cells expressing the GFP-tagged protein of interest were attached to EM grids, washed with PBS, fixed with 4% PFA and 0.1% glutaraldehyde, labeled with 4.5nm gold particles coupled to anti-GFP antibody and embedded in uranyl acetate. Gold particle distribution on the plasma membrane sheets was imaged using a JEOL JEM-1400 transmission EM at 100,000x magnification and (x,y) coordinates of each gold particle within a selected 1µm2 area determined using ImageJ. The clustering of gold particles was analyzed using variations of Ripley’s K-function (4, 5) (Eqs. 1 and 2):
where K(r) is the univariate K-function for n gold particles in the area A; r is radius; || . || is Euclidean distance; 1(.) is the indicator function that has a value of 1 if ||xi-xj|| ≤ r and 0 otherwise; and wij
-1 is the proportion of the circumference of a circle with center at xi and a radius ||xi-xj|| located within A. L(r) – r is standardized on the 99% confidence interval estimated from Monte Carlo simulations. A minimum of 15 plasma membrane sheets
3
were imaged and analyzed for each experiment. The statistical significance of differences between replicated point patterns was evaluated in bootstrap tests constructed as described (4).
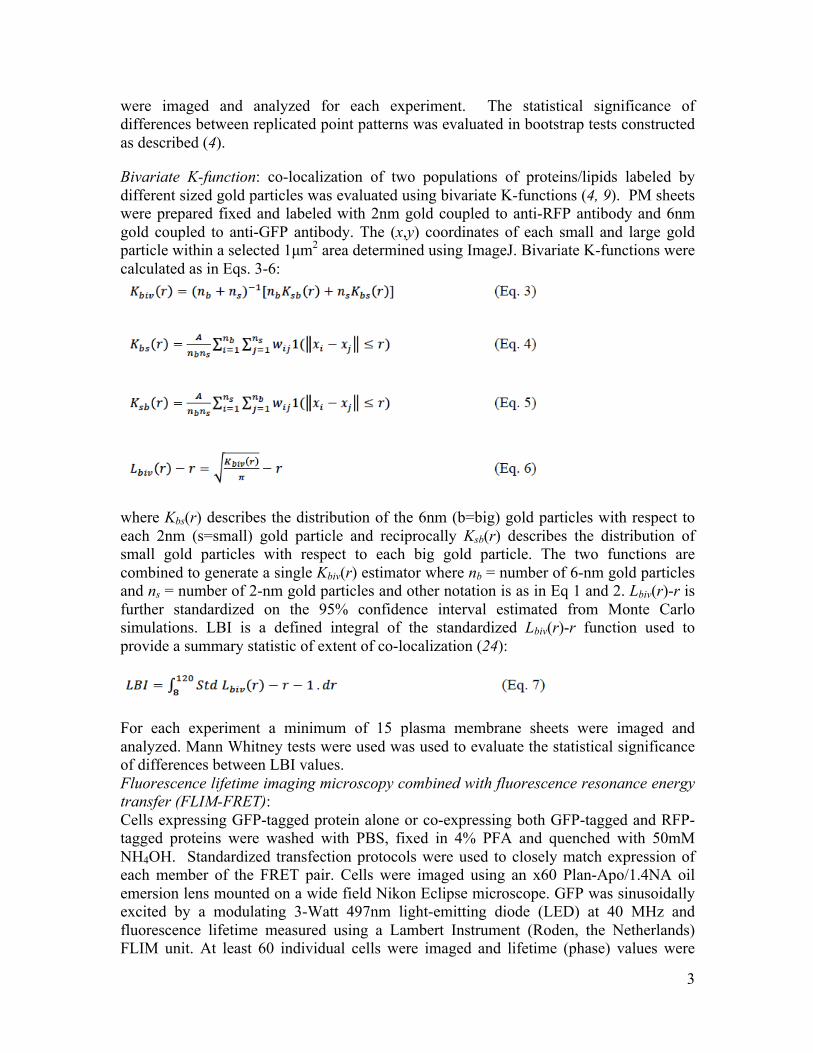
Bivariate K-function: co-localization of two populations of proteins/lipids labeled by different sized gold particles was evaluated using bivariate K-functions (4, 9). PM sheets were prepared fixed and labeled with 2nm gold coupled to anti-RFP antibody and 6nm gold coupled to anti-GFP antibody. The (x,y) coordinates of each small and large gold particle within a selected 1µm2 area determined using ImageJ. Bivariate K-functions were calculated as in Eqs. 3-6:
where Kbs(r) describes the distribution of the 6nm (b=big) gold particles with respect to each 2nm (s=small) gold particle and reciprocally Ksb(r) describes the distribution of small gold particles with respect to each big gold particle. The two functions are combined to generate a single Kbiv(r) estimator where nb = number of 6-nm gold particles and ns = number of 2-nm gold particles and other notation is as in Eq 1 and 2. Lbiv(r)-r is further standardized on the 95% confidence interval estimated from Monte Carlo simulations. LBI is a defined integral of the standardized Lbiv(r)-r function used to provide a summary statistic of extent of co-localization (24):
For each experiment a minimum of 15 plasma membrane sheets were imaged and analyzed. Mann Whitney tests were used was used to evaluate the statistical significance of differences between LBI values. Fluorescence lifetime imaging microscopy combined with fluorescence resonance energy transfer (FLIM-FRET): Cells expressing GFP-tagged protein alone or co-expressing both GFP-tagged and RFP-tagged proteins were washed with PBS, fixed in 4% PFA and quenched with 50mM NH4OH. Standardized transfection protocols were used to closely match expression of each member of the FRET pair. Cells were imaged using an x60 Plan-Apo/1.4NA oil emersion lens mounted on a wide field Nikon Eclipse microscope. GFP was sinusoidally excited by a modulating 3-Watt 497nm light-emitting diode (LED) at 40 MHz and fluorescence lifetime measured using a Lambert Instrument (Roden, the Netherlands) FLIM unit. At least 60 individual cells were imaged and lifetime (phase) values were
4
pooled and averaged. Each experiment was replicated 3 times. Statistical analysis was performed using one-way ANOVA. For fly FLIM experiments, 3rd instar larvae expressing the GFP/RFP constructs in the nervous system were filleted and fixed in 4% PFA prior to mounting in Vectashield and FLIM-FRET imaging. Confocal images of the fly brains were imaged on Nikon A1 confocal microscope using a 20x Air objective. Western blots: MAPK signaling activity was examined in wild-type BHK cells, BHK cells expressing GFP-K-RasG12V, BHK cells expressing GFP-H-RasG12V, CHO cells expressing GFP-K-RasG12V, or PSA-3 cells (in dialyzed FBS or supplemented with 10mM ethanolamine) expressing GFP-K-RasG12V. PS depletion was achieved by incubating PSA-3 cells in dialyzed FBS for at least 72h, PS levels were maintained at control levels by supplementing the growth medium of PSA-3 cells with 10µM ethanolamine. On the day of experiments, cells were washed with HEPES buffers containing various [K+], incubated in the same buffers for up to 1h and harvested. Whole cell lysates were collected as described (9) and immunoblotted for pMEK, pERK and pAkt. Drosophila genetics and husbandry:
cDNAs encoding GFP-tH, RFP-tH, GFP-tK, RFP-tK, and LactC2-mCherry (LC2-mCherry) were subcloned vectors containing Upstream Activation Sequence (UAS). Transgenic flies carrying the UAS expression constructs were generated by attB-attP integration by injecting the constructs to fly embryos. pUAS-GFP-tH and pUAS-GFP-tK were injected to 2nd chromosome, pUAS-RFP-tH and pUAS-RFP-tK to 3rd chromosome, and pUAS-LC2-mCherry to 2nd chromosome. We used elav-GAL4 to express these constructs in fly neurons. Wild-type (w1118) and two mutant alleles of the Drosophila flippase homolog atp8b (CG14741) were obtained from Bloomington Stock Center. atg8b1 and atg8b2 correspond to CG14741f05203 and CG14741MI06979 respectively. All flies were reared in vials with standard cornmeal based food at room temperature (~22°C). The ingredients in 1 L of liquid fly food were: 95 g agar, 275 g Brewer’s yeast, 520 g of cornmeal, 110 g of sugar, and 45 g of propionic acid. 36 g of Tegosept was dissolved in 92 ml of 95% ethanol and added to the mixture to prevent bacterial growth. Western blotting of whole Drosophila embryo:
Flies were transferred to cages containing grape juice agar (Genesee Scientific) for egg-laying for 14 hours. Cages were cleared of flies for 2 hours before collecting the embryos from the surface of the agar. Embryos were dechorionated in 50% bleach for 5 minutes. After washing 3 times with PBS, embryos were bathed in either 5mM K+ or 90mM K+ HL-3 for 20 minutes, before homogenized in 2X Laemmli sample buffer (Bio-Rad). 5K+ HL-3 contained: 5 mM KCl, 70 mM NaCl, 20 mM MgCl2, 10 mM NaHCO3, 0.5 mM CaCl2, 115 mM sucrose, 5 mM trehalose, and 5 mM HEPES (pH7.2). 90K+ HL-3 contained: 90 mM KCl, 40mM NaCl, 20 mM MgCl2, 10 mM NaHCO3, 0.5 mM CaCl2, 115 mM sucrose, 5 mM trehalose, and 5 mM HEPES (pH7.2). Total lysate from ~7-10 embryos was loaded onto each lane of 10% Tris-glycine gel (Bio-Rad). Blots were probed with primary antibodies against pERK and α-tubulin. After overnight incubations with the primary antibodies, the blots were washed and probed with IRDye 680 donkey anti-rabbit IgG (LI-COR) and IRDye 800 donkey anti-mouse IgG (LI-COR), and signals were detected with the Odyssey infrared imaging system (LI-COR). Blot images were analyzed using ImageJ (National Institutes of Health).
5
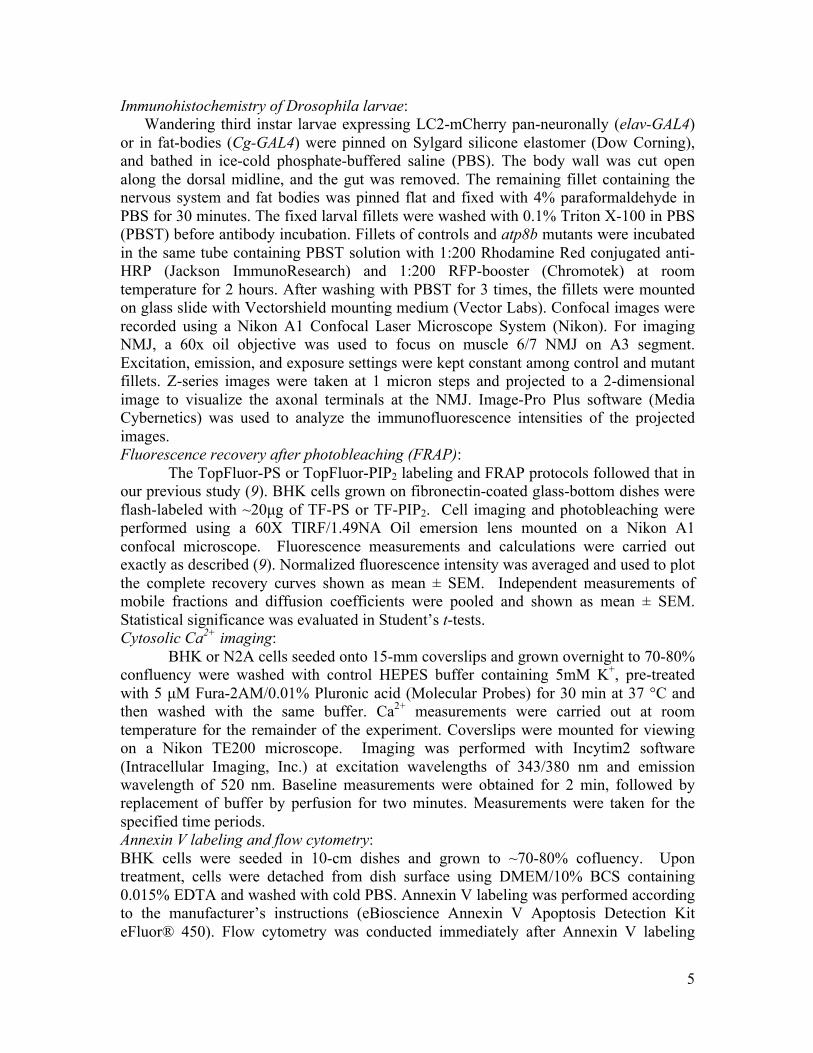
Immunohistochemistry of Drosophila larvae: Wandering third instar larvae expressing LC2-mCherry pan-neuronally (elav-GAL4)
or in fat-bodies (Cg-GAL4) were pinned on Sylgard silicone elastomer (Dow Corning), and bathed in ice-cold phosphate-buffered saline (PBS). The body wall was cut open along the dorsal midline, and the gut was removed. The remaining fillet containing the nervous system and fat bodies was pinned flat and fixed with 4% paraformaldehyde in PBS for 30 minutes. The fixed larval fillets were washed with 0.1% Triton X-100 in PBS (PBST) before antibody incubation. Fillets of controls and atp8b mutants were incubated in the same tube containing PBST solution with 1:200 Rhodamine Red conjugated anti-HRP (Jackson ImmunoResearch) and 1:200 RFP-booster (Chromotek) at room temperature for 2 hours. After washing with PBST for 3 times, the fillets were mounted on glass slide with Vectorshield mounting medium (Vector Labs). Confocal images were recorded using a Nikon A1 Confocal Laser Microscope System (Nikon). For imaging NMJ, a 60x oil objective was used to focus on muscle 6/7 NMJ on A3 segment. Excitation, emission, and exposure settings were kept constant among control and mutant fillets. Z-series images were taken at 1 micron steps and projected to a 2-dimensional image to visualize the axonal terminals at the NMJ. Image-Pro Plus software (Media Cybernetics) was used to analyze the immunofluorescence intensities of the projected images. Fluorescence recovery after photobleaching (FRAP):
The TopFluor-PS or TopFluor-PIP2 labeling and FRAP protocols followed that in our previous study (9). BHK cells grown on fibronectin-coated glass-bottom dishes were flash-labeled with ~20µg of TF-PS or TF-PIP2. Cell imaging and photobleaching were performed using a 60X TIRF/1.49NA Oil emersion lens mounted on a Nikon A1 confocal microscope. Fluorescence measurements and calculations were carried out exactly as described (9). Normalized fluorescence intensity was averaged and used to plot the complete recovery curves shown as mean ± SEM. Independent measurements of mobile fractions and diffusion coefficients were pooled and shown as mean ± SEM. Statistical significance was evaluated in Student’s t-tests. Cytosolic Ca2+ imaging:
BHK or N2A cells seeded onto 15-mm coverslips and grown overnight to 70-80% confluency were washed with control HEPES buffer containing 5mM K+, pre-treated with 5 µM Fura-2AM/0.01% Pluronic acid (Molecular Probes) for 30 min at 37 °C and then washed with the same buffer. Ca2+ measurements were carried out at room temperature for the remainder of the experiment. Coverslips were mounted for viewing on a Nikon TE200 microscope. Imaging was performed with Incytim2 software (Intracellular Imaging, Inc.) at excitation wavelengths of 343/380 nm and emission wavelength of 520 nm. Baseline measurements were obtained for 2 min, followed by replacement of buffer by perfusion for two minutes. Measurements were taken for the specified time periods. Annexin V labeling and flow cytometry: BHK cells were seeded in 10-cm dishes and grown to ~70-80% cofluency. Upon treatment, cells were detached from dish surface using DMEM/10% BCS containing 0.015% EDTA and washed with cold PBS. Annexin V labeling was performed according to the manufacturer’s instructions (eBioscience Annexin V Apoptosis Detection Kit eFluor® 450). Flow cytometry was conducted immediately after Annexin V labeling

6
using BD LSRFortessa flow cytometer as described previously (13). Overnight incubation with 20µM camptothecin was used as positive control to induce PS externalization.
7
Fig. S1.
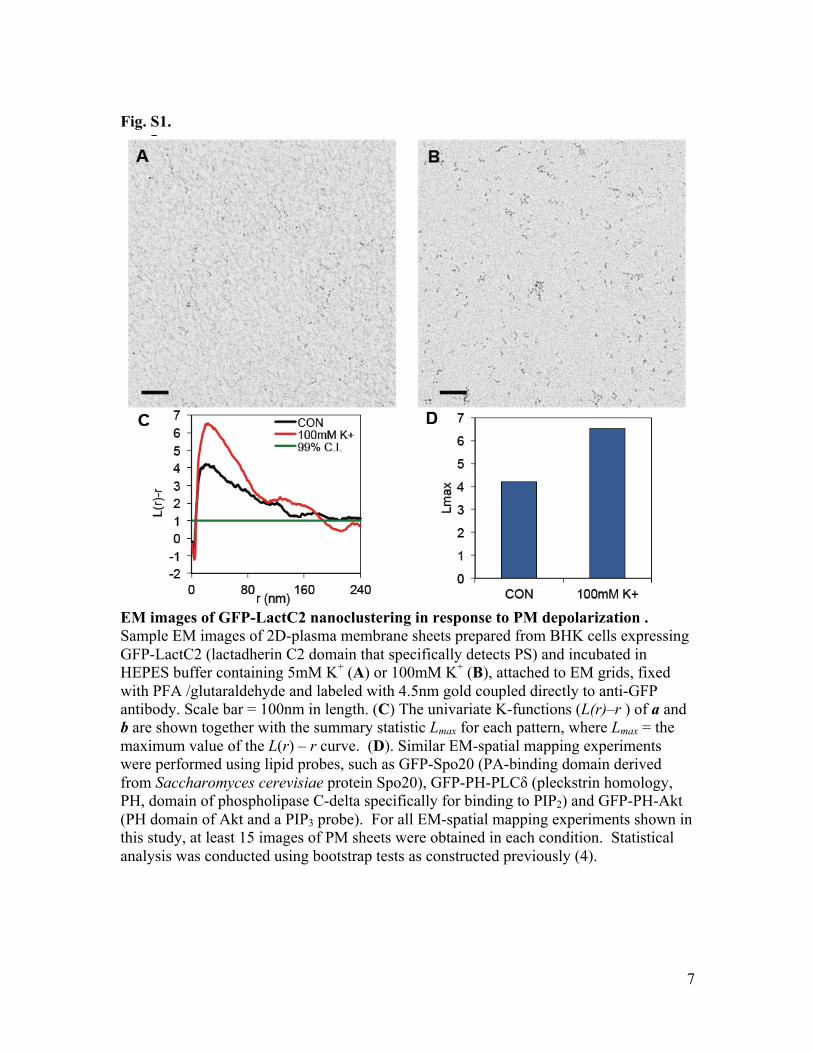
EM images of GFP-LactC2 nanoclustering in response to PM depolarization . Sample EM images of 2D-plasma membrane sheets prepared from BHK cells expressing GFP-LactC2 (lactadherin C2 domain that specifically detects PS) and incubated in HEPES buffer containing 5mM K+ (A) or 100mM K+ (B), attached to EM grids, fixed with PFA /glutaraldehyde and labeled with 4.5nm gold coupled directly to anti-GFP antibody. Scale bar = 100nm in length. (C) The univariate K-functions (L(r)–r ) of a and b are shown together with the summary statistic Lmax for each pattern, where Lmax = the maximum value of the L(r) – r curve. (D). Similar EM-spatial mapping experiments were performed using lipid probes, such as GFP-Spo20 (PA-binding domain derived from Saccharomyces cerevisiae protein Spo20), GFP-PH-PLCδ (pleckstrin homology, PH, domain of phospholipase C-delta specifically for binding to PIP2) and GFP-PH-Akt (PH domain of Akt and a PIP3 probe). For all EM-spatial mapping experiments shown in this study, at least 15 images of PM sheets were obtained in each condition. Statistical analysis was conducted using bootstrap tests as constructed previously (4).
8
Fig. S2
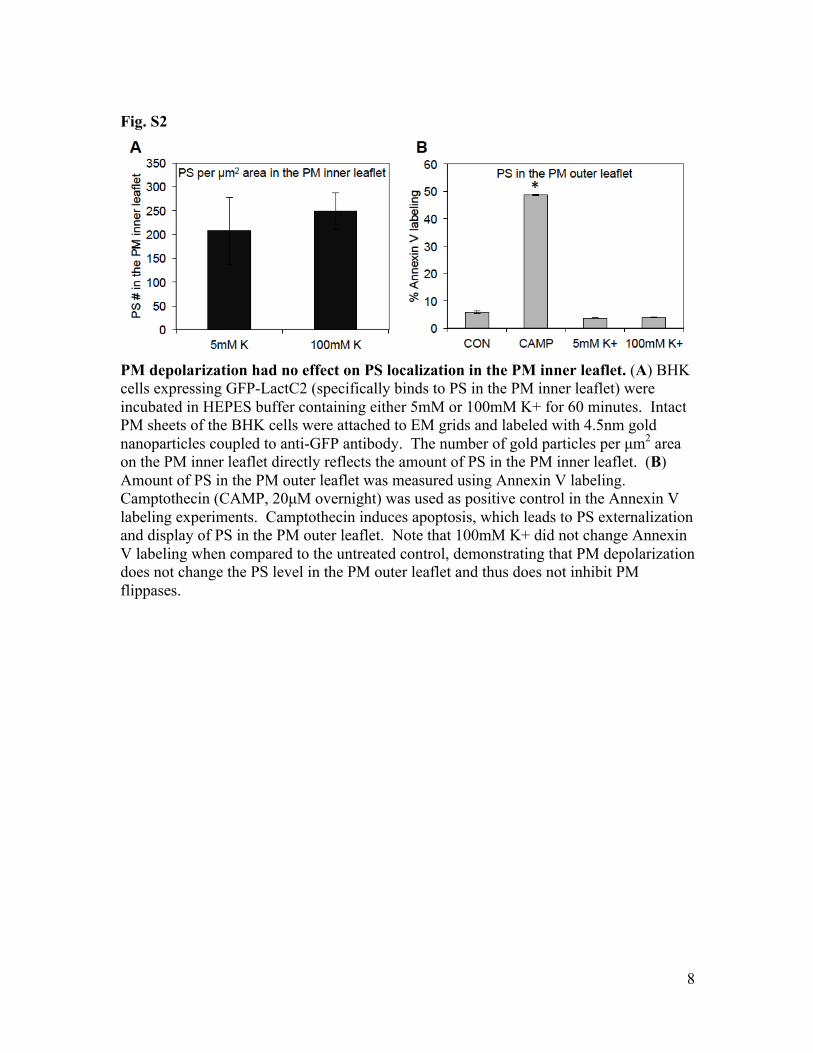
PM depolarization had no effect on PS localization in the PM inner leaflet. (A) BHK cells expressing GFP-LactC2 (specifically binds to PS in the PM inner leaflet) were incubated in HEPES buffer containing either 5mM or 100mM K+ for 60 minutes. Intact PM sheets of the BHK cells were attached to EM grids and labeled with 4.5nm gold nanoparticles coupled to anti-GFP antibody. The number of gold particles per µm2 area on the PM inner leaflet directly reflects the amount of PS in the PM inner leaflet. (B) Amount of PS in the PM outer leaflet was measured using Annexin V labeling. Camptothecin (CAMP, 20µM overnight) was used as positive control in the Annexin V labeling experiments. Camptothecin induces apoptosis, which leads to PS externalization and display of PS in the PM outer leaflet. Note that 100mM K+ did not change Annexin V labeling when compared to the untreated control, demonstrating that PM depolarization does not change the PS level in the PM outer leaflet and thus does not inhibit PM flippases.
9
Fig. S3
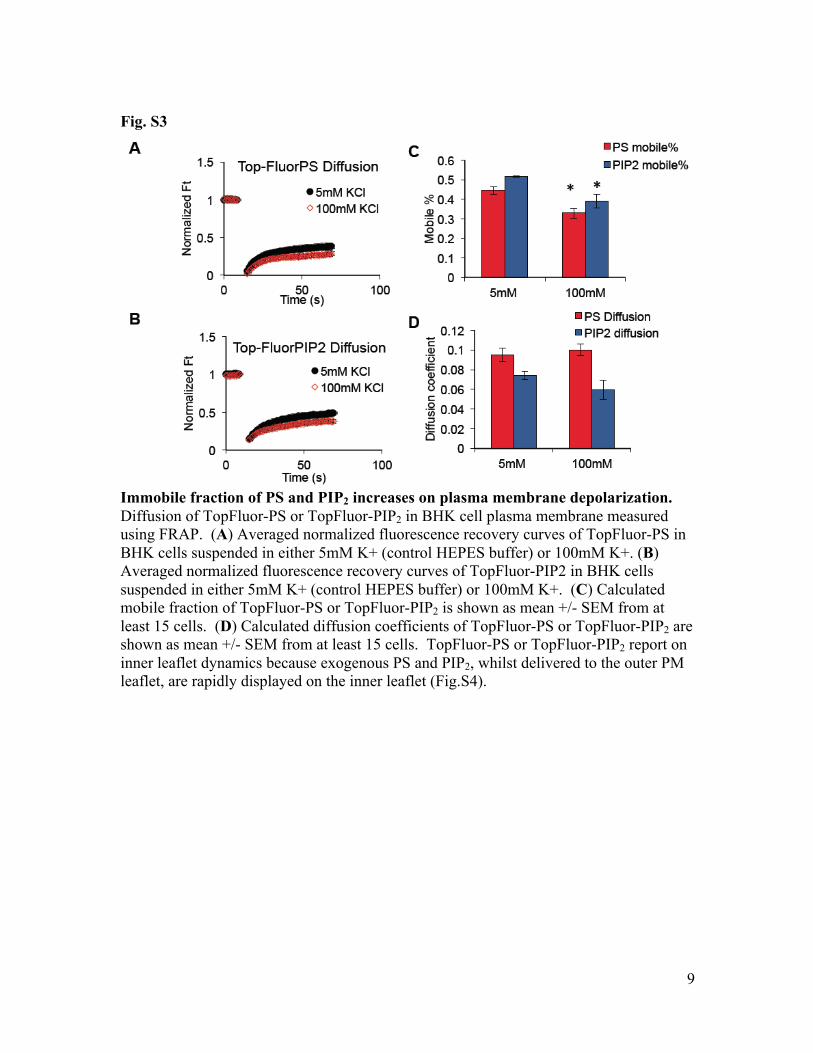
Immobile fraction of PS and PIP2 increases on plasma membrane depolarization. Diffusion of TopFluor-PS or TopFluor-PIP2 in BHK cell plasma membrane measured using FRAP. (A) Averaged normalized fluorescence recovery curves of TopFluor-PS in BHK cells suspended in either 5mM K+ (control HEPES buffer) or 100mM K+. (B) Averaged normalized fluorescence recovery curves of TopFluor-PIP2 in BHK cells suspended in either 5mM K+ (control HEPES buffer) or 100mM K+. (C) Calculated mobile fraction of TopFluor-PS or TopFluor-PIP2 is shown as mean +/- SEM from at least 15 cells. (D) Calculated diffusion coefficients of TopFluor-PS or TopFluor-PIP2 are shown as mean +/- SEM from at least 15 cells. TopFluor-PS or TopFluor-PIP2 report on inner leaflet dynamics because exogenous PS and PIP2, whilst delivered to the outer PM leaflet, are rapidly displayed on the inner leaflet (Fig.S4).
10
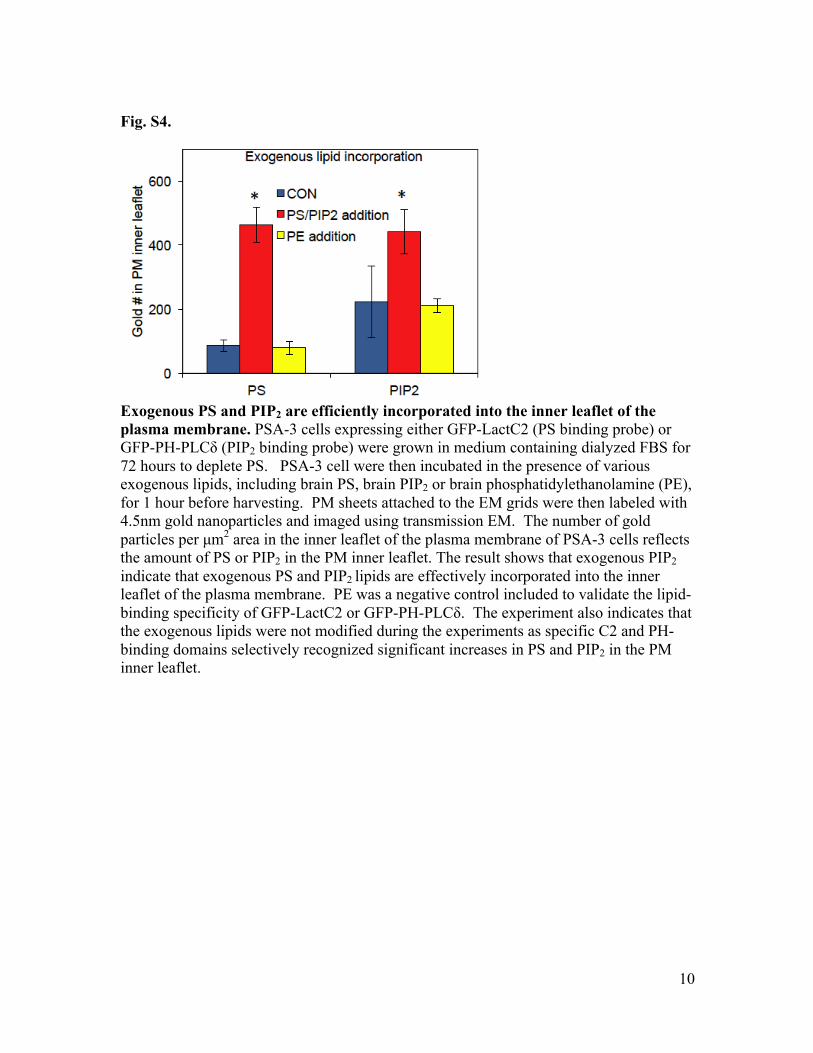
Fig. S4.
Exogenous PS and PIP2 are efficiently incorporated into the inner leaflet of the plasma membrane. PSA-3 cells expressing either GFP-LactC2 (PS binding probe) or GFP-PH-PLCδ (PIP2 binding probe) were grown in medium containing dialyzed FBS for 72 hours to deplete PS. PSA-3 cell were then incubated in the presence of various exogenous lipids, including brain PS, brain PIP2 or brain phosphatidylethanolamine (PE), for 1 hour before harvesting. PM sheets attached to the EM grids were then labeled with 4.5nm gold nanoparticles and imaged using transmission EM. The number of gold particles per µm2 area in the inner leaflet of the plasma membrane of PSA-3 cells reflects the amount of PS or PIP2 in the PM inner leaflet. The result shows that exogenous PIP2 indicate that exogenous PS and PIP2 lipids are effectively incorporated into the inner leaflet of the plasma membrane. PE was a negative control included to validate the lipid-binding specificity of GFP-LactC2 or GFP-PH-PLCδ. The experiment also indicates that the exogenous lipids were not modified during the experiments as specific C2 and PH-binding domains selectively recognized significant increases in PS and PIP2 in the PM inner leaflet.
11
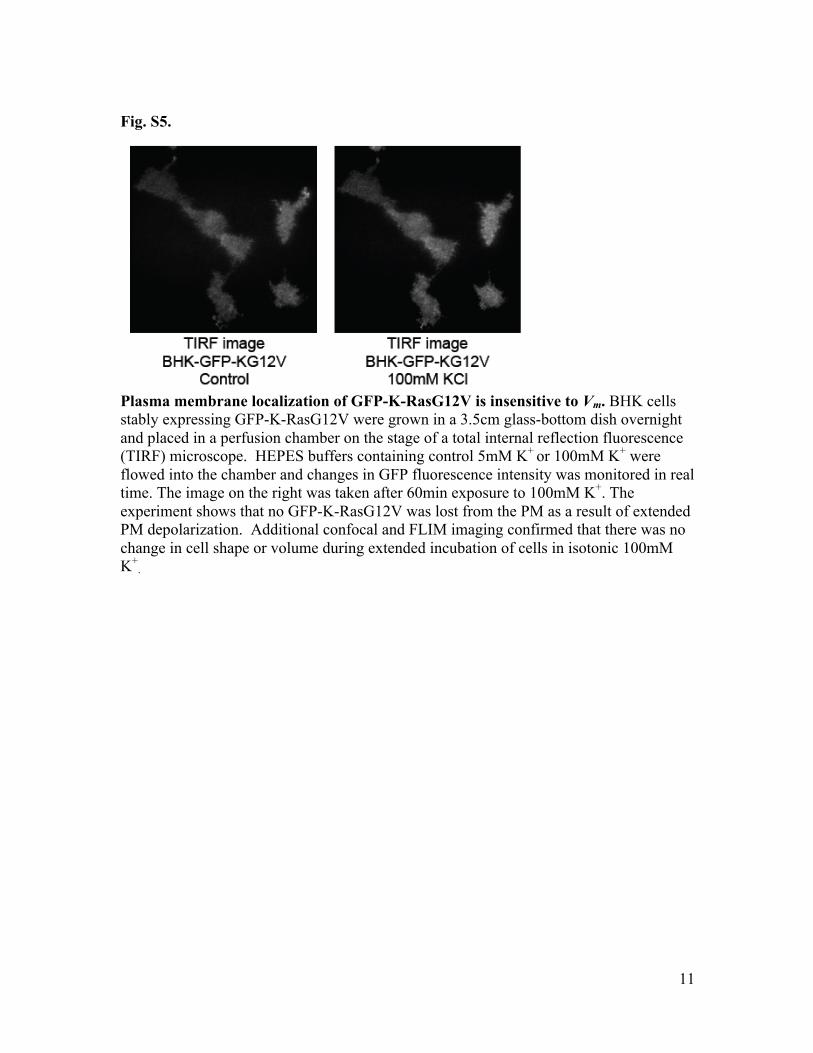
Fig. S5.
Plasma membrane localization of GFP-K-RasG12V is insensitive to Vm. BHK cells stably expressing GFP-K-RasG12V were grown in a 3.5cm glass-bottom dish overnight and placed in a perfusion chamber on the stage of a total internal reflection fluorescence (TIRF) microscope. HEPES buffers containing control 5mM K+ or 100mM K+ were flowed into the chamber and changes in GFP fluorescence intensity was monitored in real time. The image on the right was taken after 60min exposure to 100mM K+. The experiment shows that no GFP-K-RasG12V was lost from the PM as a result of extended PM depolarization. Additional confocal and FLIM imaging confirmed that there was no change in cell shape or volume during extended incubation of cells in isotonic 100mM K+
.
12
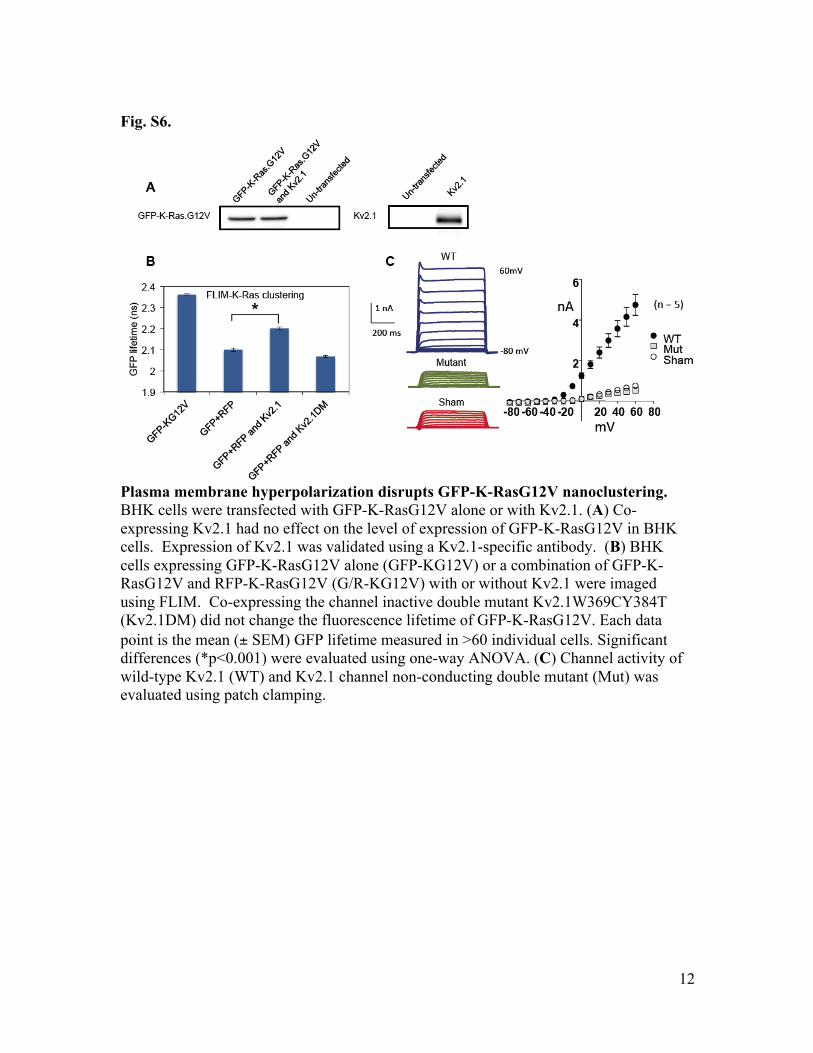
Fig. S6.
Plasma membrane hyperpolarization disrupts GFP-K-RasG12V nanoclustering. BHK cells were transfected with GFP-K-RasG12V alone or with Kv2.1. (A) Co-expressing Kv2.1 had no effect on the level of expression of GFP-K-RasG12V in BHK cells. Expression of Kv2.1 was validated using a Kv2.1-specific antibody. (B) BHK cells expressing GFP-K-RasG12V alone (GFP-KG12V) or a combination of GFP-K-RasG12V and RFP-K-RasG12V (G/R-KG12V) with or without Kv2.1 were imaged using FLIM. Co-expressing the channel inactive double mutant Kv2.1W369CY384T (Kv2.1DM) did not change the fluorescence lifetime of GFP-K-RasG12V. Each data point is the mean (± SEM) GFP lifetime measured in >60 individual cells. Significant differences (*p<0.001) were evaluated using one-way ANOVA. (C) Channel activity of wild-type Kv2.1 (WT) and Kv2.1 channel non-conducting double mutant (Mut) was evaluated using patch clamping.
13
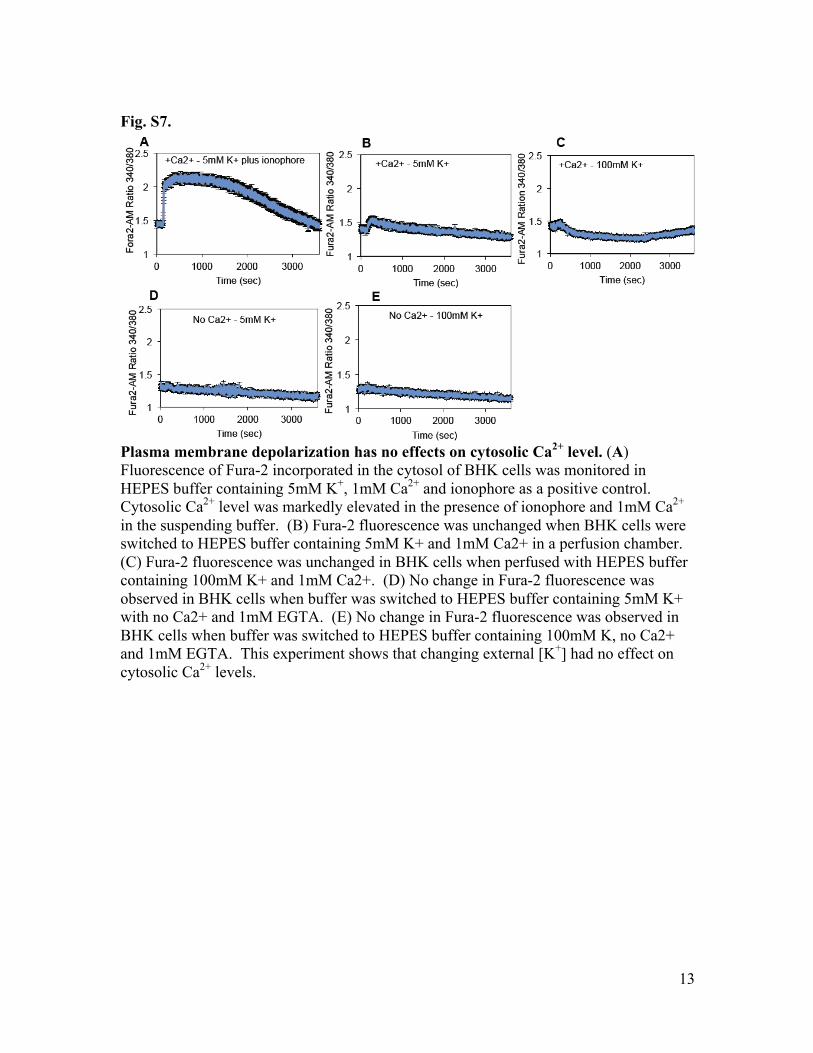
Fig. S7.
Plasma membrane depolarization has no effects on cytosolic Ca2+ level. (A) Fluorescence of Fura-2 incorporated in the cytosol of BHK cells was monitored in HEPES buffer containing 5mM K+, 1mM Ca2+ and ionophore as a positive control. Cytosolic Ca2+ level was markedly elevated in the presence of ionophore and 1mM Ca2+ in the suspending buffer. (B) Fura-2 fluorescence was unchanged when BHK cells were switched to HEPES buffer containing 5mM K+ and 1mM Ca2+ in a perfusion chamber. (C) Fura-2 fluorescence was unchanged in BHK cells when perfused with HEPES buffer containing 100mM K+ and 1mM Ca2+. (D) No change in Fura-2 fluorescence was observed in BHK cells when buffer was switched to HEPES buffer containing 5mM K+ with no Ca2+ and 1mM EGTA. (E) No change in Fura-2 fluorescence was observed in BHK cells when buffer was switched to HEPES buffer containing 100mM K, no Ca2+ and 1mM EGTA. This experiment shows that changing external [K+] had no effect on cytosolic Ca2+ levels.
14
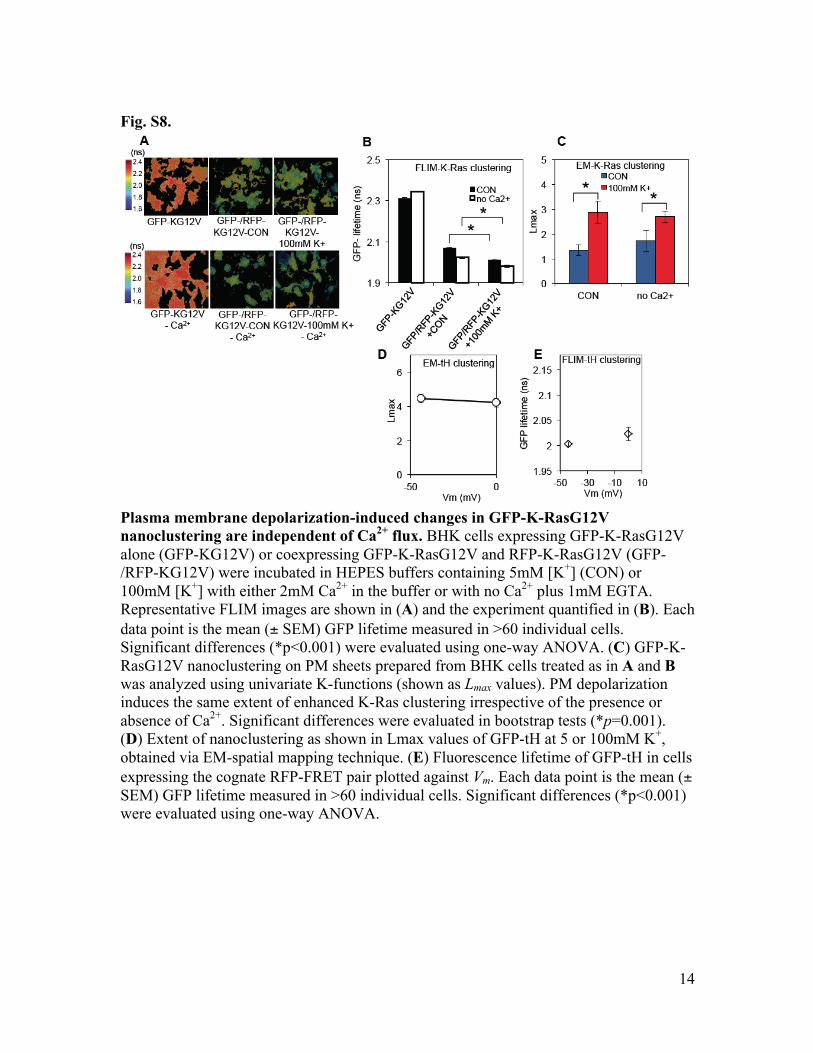
Fig. S8.
Plasma membrane depolarization-induced changes in GFP-K-RasG12V nanoclustering are independent of Ca2+ flux. BHK cells expressing GFP-K-RasG12V alone (GFP-KG12V) or coexpressing GFP-K-RasG12V and RFP-K-RasG12V (GFP-/RFP-KG12V) were incubated in HEPES buffers containing 5mM [K+] (CON) or 100mM [K+] with either 2mM Ca2+ in the buffer or with no Ca2+ plus 1mM EGTA. Representative FLIM images are shown in (A) and the experiment quantified in (B). Each data point is the mean (± SEM) GFP lifetime measured in >60 individual cells. Significant differences (*p<0.001) were evaluated using one-way ANOVA. (C) GFP-K-RasG12V nanoclustering on PM sheets prepared from BHK cells treated as in A and B was analyzed using univariate K-functions (shown as Lmax values). PM depolarization induces the same extent of enhanced K-Ras clustering irrespective of the presence or absence of Ca2+. Significant differences were evaluated in bootstrap tests (*p=0.001). (D) Extent of nanoclustering as shown in Lmax values of GFP-tH at 5 or 100mM K+, obtained via EM-spatial mapping technique. (E) Fluorescence lifetime of GFP-tH in cells expressing the cognate RFP-FRET pair plotted against Vm. Each data point is the mean (± SEM) GFP lifetime measured in >60 individual cells. Significant differences (*p<0.001) were evaluated using one-way ANOVA.
15
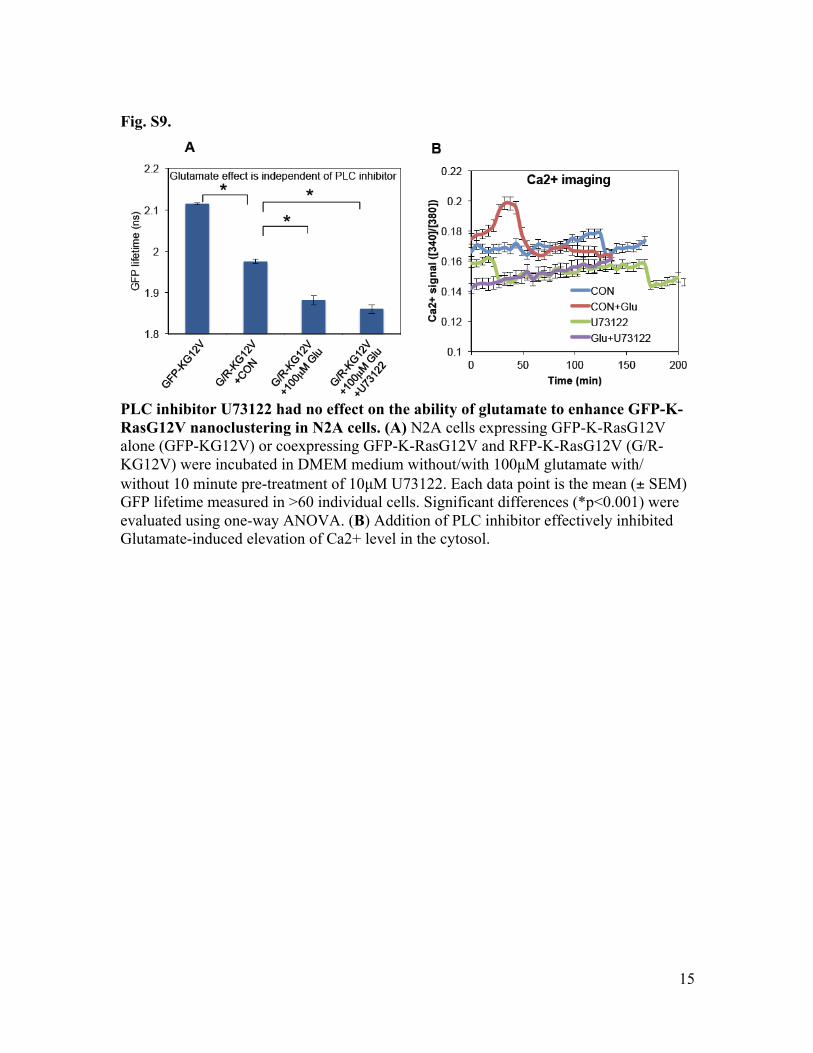
Fig. S9.
PLC inhibitor U73122 had no effect on the ability of glutamate to enhance GFP-K-RasG12V nanoclustering in N2A cells. (A) N2A cells expressing GFP-K-RasG12V alone (GFP-KG12V) or coexpressing GFP-K-RasG12V and RFP-K-RasG12V (G/R-KG12V) were incubated in DMEM medium without/with 100µM glutamate with/ without 10 minute pre-treatment of 10µM U73122. Each data point is the mean (± SEM) GFP lifetime measured in >60 individual cells. Significant differences (*p<0.001) were evaluated using one-way ANOVA. (B) Addition of PLC inhibitor effectively inhibited Glutamate-induced elevation of Ca2+ level in the cytosol.
16
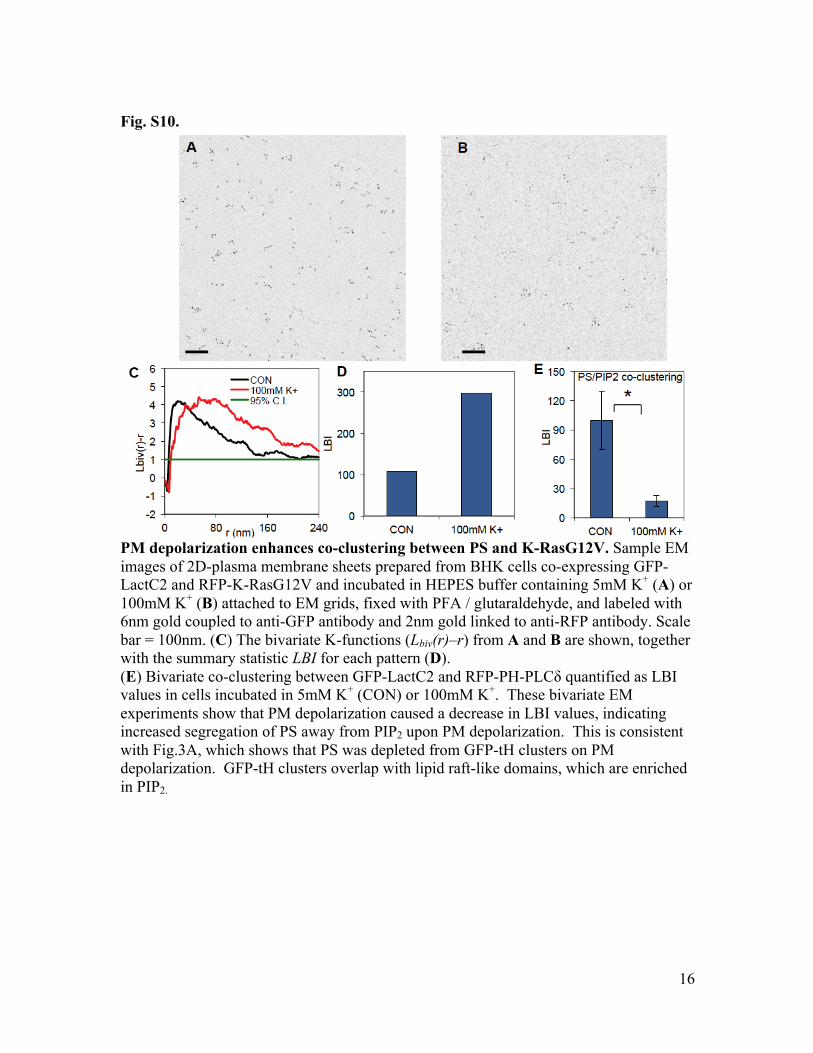
Fig. S10.
PM depolarization enhances co-clustering between PS and K-RasG12V. Sample EM images of 2D-plasma membrane sheets prepared from BHK cells co-expressing GFP-LactC2 and RFP-K-RasG12V and incubated in HEPES buffer containing 5mM K+ (A) or 100mM K+ (B) attached to EM grids, fixed with PFA / glutaraldehyde, and labeled with 6nm gold coupled to anti-GFP antibody and 2nm gold linked to anti-RFP antibody. Scale bar = 100nm. (C) The bivariate K-functions (Lbiv(r)–r) from A and B are shown, together with the summary statistic LBI for each pattern (D). (E) Bivariate co-clustering between GFP-LactC2 and RFP-PH-PLCδ quantified as LBI values in cells incubated in 5mM K+ (CON) or 100mM K+. These bivariate EM experiments show that PM depolarization caused a decrease in LBI values, indicating increased segregation of PS away from PIP2 upon PM depolarization. This is consistent with Fig.3A, which shows that PS was depleted from GFP-tH clusters on PM depolarization. GFP-tH clusters overlap with lipid raft-like domains, which are enriched in PIP2.
17
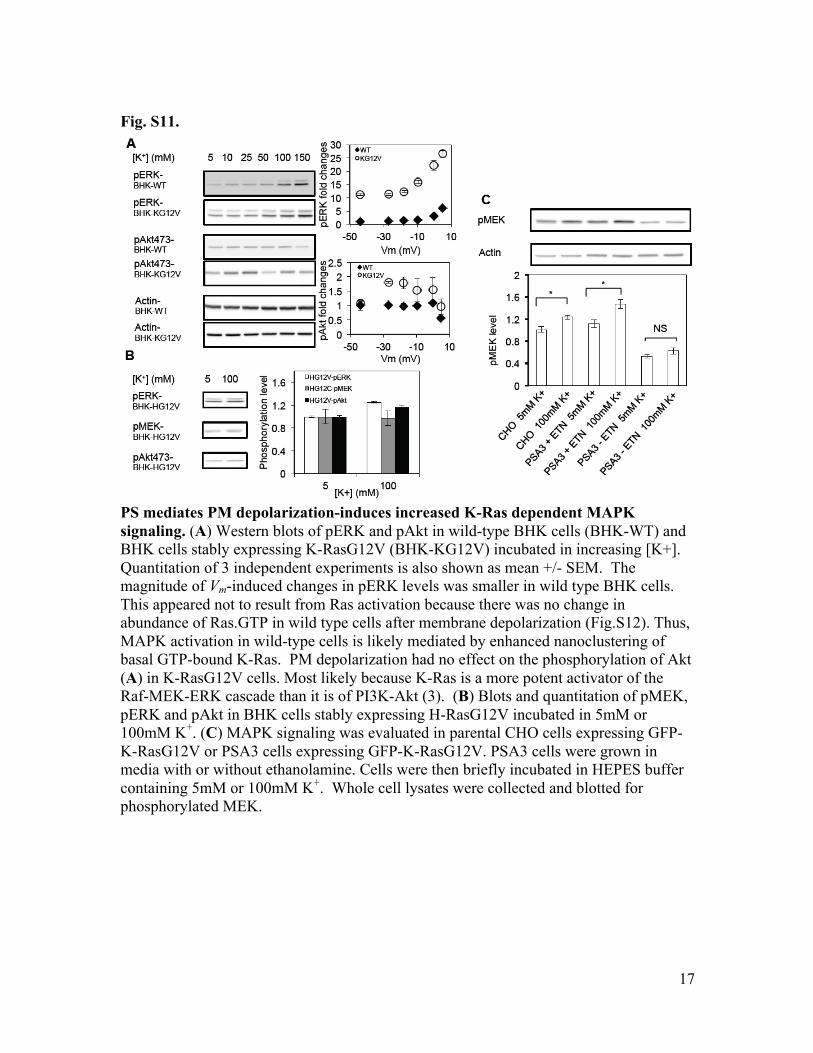
Fig. S11.
PS mediates PM depolarization-induces increased K-Ras dependent MAPK signaling. (A) Western blots of pERK and pAkt in wild-type BHK cells (BHK-WT) and BHK cells stably expressing K-RasG12V (BHK-KG12V) incubated in increasing [K+]. Quantitation of 3 independent experiments is also shown as mean +/- SEM. The magnitude of Vm-induced changes in pERK levels was smaller in wild type BHK cells. This appeared not to result from Ras activation because there was no change in abundance of Ras.GTP in wild type cells after membrane depolarization (Fig.S12). Thus, MAPK activation in wild-type cells is likely mediated by enhanced nanoclustering of basal GTP-bound K-Ras. PM depolarization had no effect on the phosphorylation of Akt (A) in K-RasG12V cells. Most likely because K-Ras is a more potent activator of the Raf-MEK-ERK cascade than it is of PI3K-Akt (3). (B) Blots and quantitation of pMEK, pERK and pAkt in BHK cells stably expressing H-RasG12V incubated in 5mM or 100mM K+. (C) MAPK signaling was evaluated in parental CHO cells expressing GFP-K-RasG12V or PSA3 cells expressing GFP-K-RasG12V. PSA3 cells were grown in media with or without ethanolamine. Cells were then briefly incubated in HEPES buffer containing 5mM or 100mM K+. Whole cell lysates were collected and blotted for phosphorylated MEK.
18
Fig. S12.
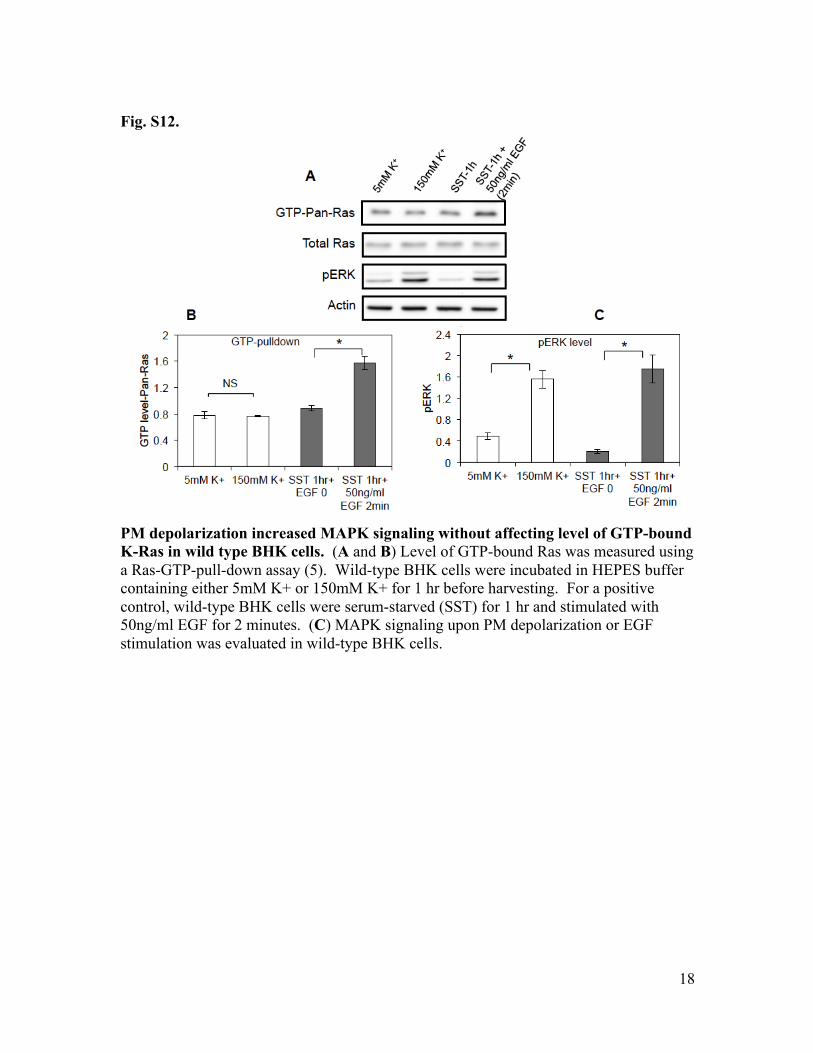
PM depolarization increased MAPK signaling without affecting level of GTP-bound K-Ras in wild type BHK cells. (A and B) Level of GTP-bound Ras was measured using a Ras-GTP-pull-down assay (5). Wild-type BHK cells were incubated in HEPES buffer containing either 5mM K+ or 150mM K+ for 1 hr before harvesting. For a positive control, wild-type BHK cells were serum-starved (SST) for 1 hr and stimulated with 50ng/ml EGF for 2 minutes. (C) MAPK signaling upon PM depolarization or EGF stimulation was evaluated in wild-type BHK cells.
19
Fig. S13.
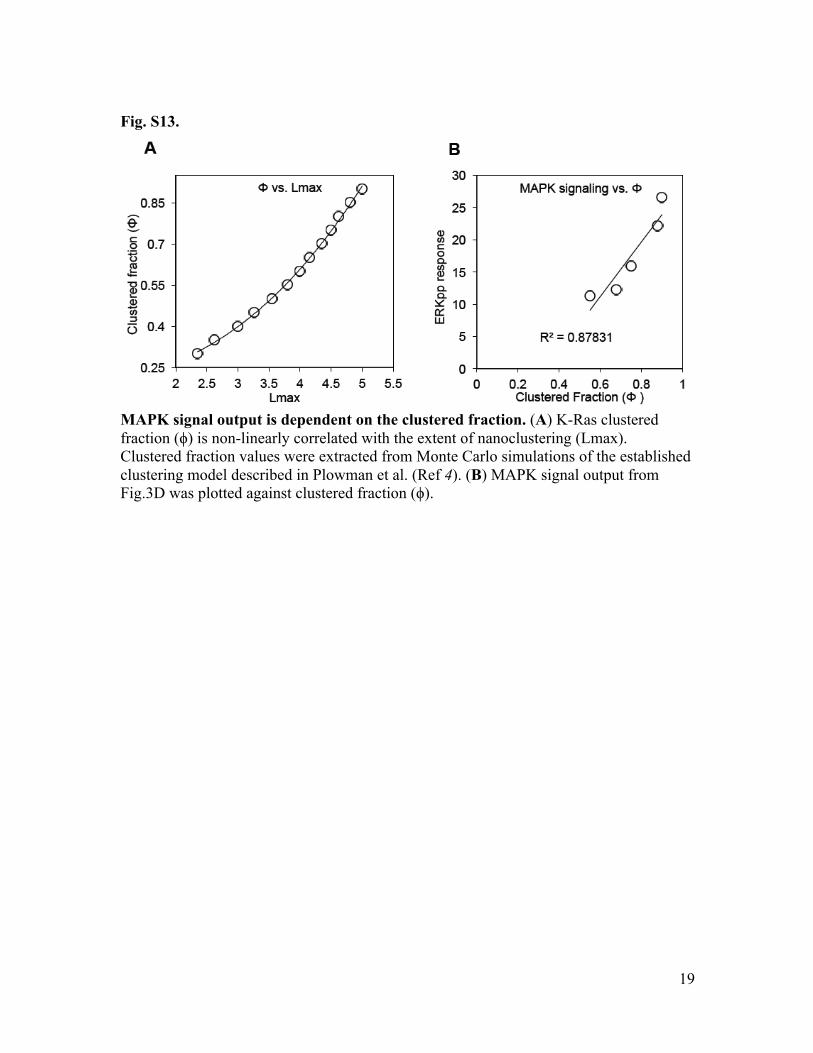
MAPK signal output is dependent on the clustered fraction. (A) K-Ras clustered fraction (ϕ) is non-linearly correlated with the extent of nanoclustering (Lmax). Clustered fraction values were extracted from Monte Carlo simulations of the established clustering model described in Plowman et al. (Ref 4). (B) MAPK signal output from Fig.3D was plotted against clustered fraction (ϕ).
20
Fig. S14.
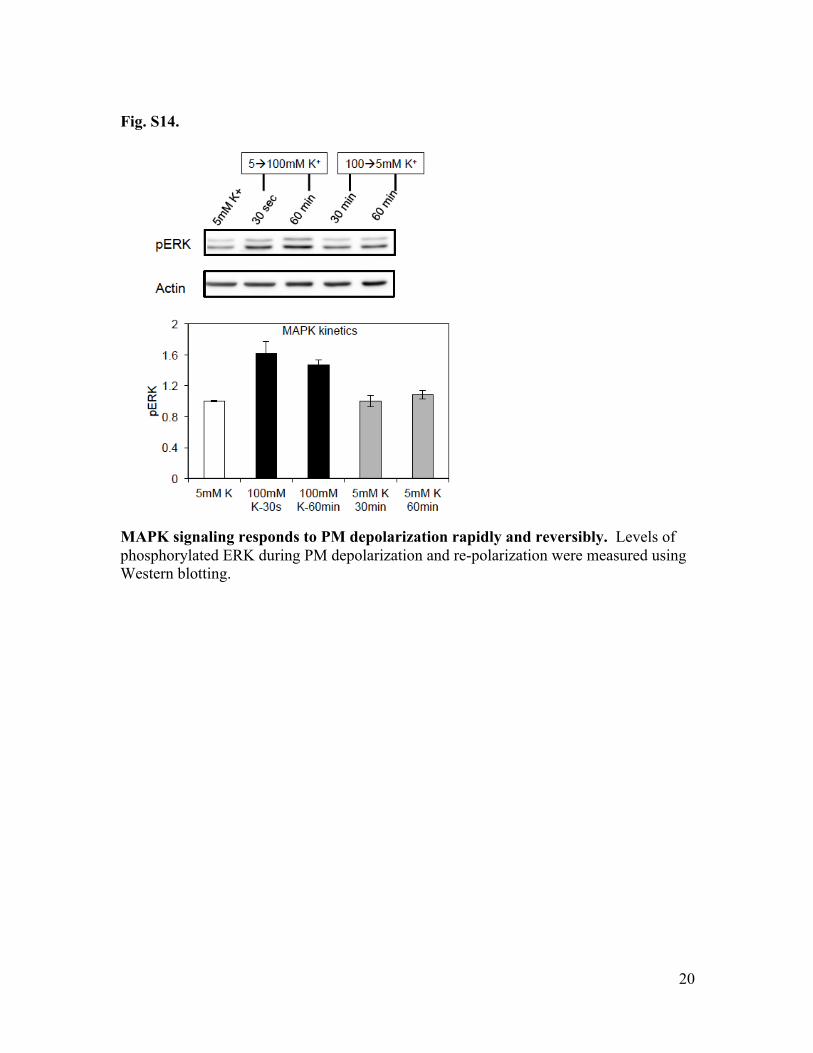
MAPK signaling responds to PM depolarization rapidly and reversibly. Levels of phosphorylated ERK during PM depolarization and re-polarization were measured using Western blotting.
21
Fig. S15.
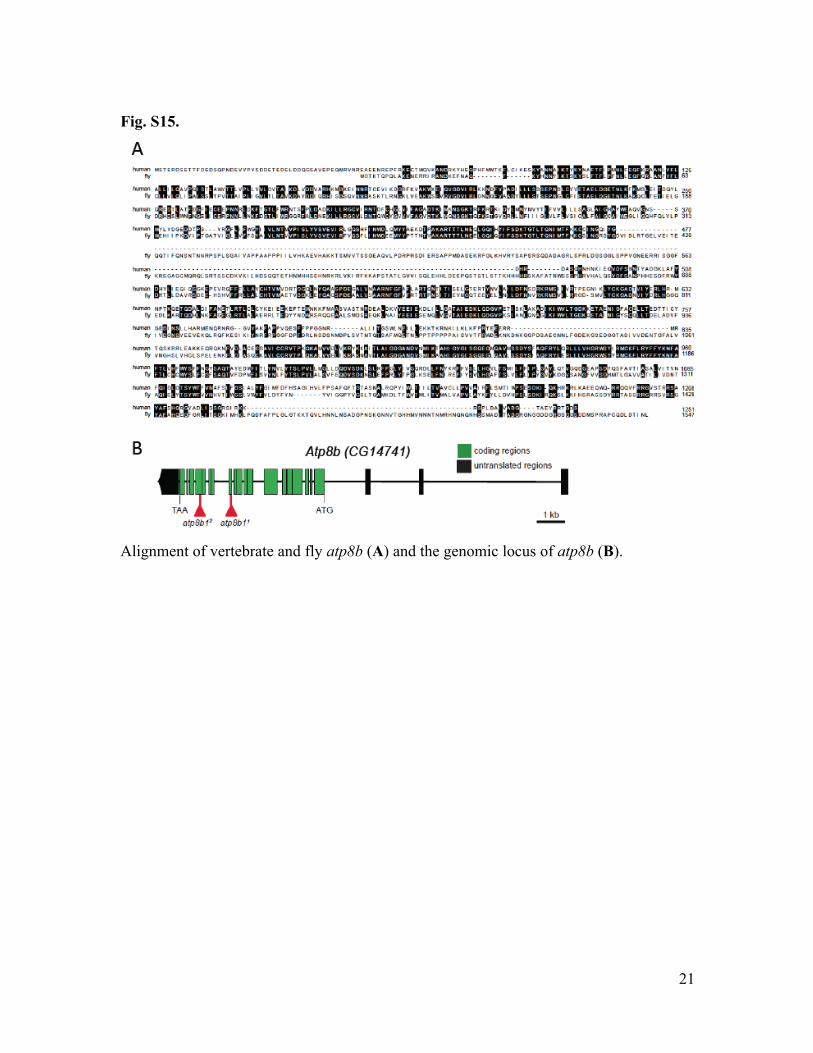
Alignment of vertebrate and fly atp8b (A) and the genomic locus of atp8b (B).
22
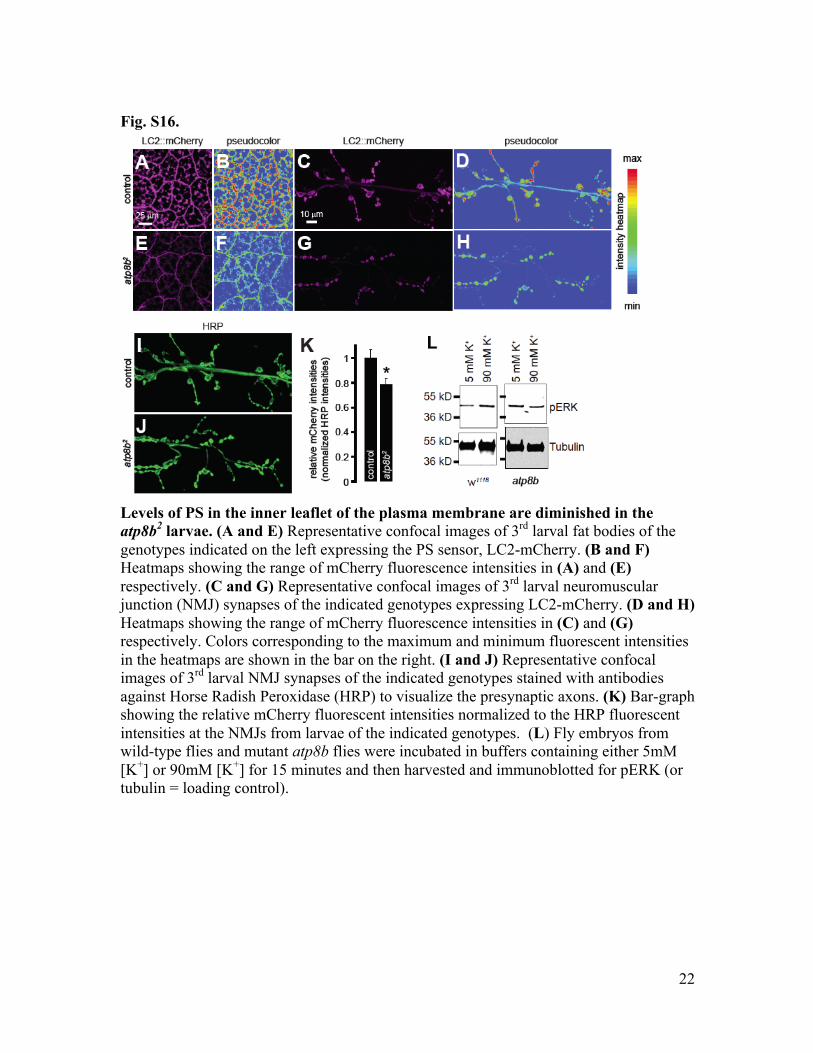
Fig. S16.
Levels of PS in the inner leaflet of the plasma membrane are diminished in the atp8b2 larvae. (A and E) Representative confocal images of 3rd larval fat bodies of the genotypes indicated on the left expressing the PS sensor, LC2-mCherry. (B and F) Heatmaps showing the range of mCherry fluorescence intensities in (A) and (E) respectively. (C and G) Representative confocal images of 3rd larval neuromuscular junction (NMJ) synapses of the indicated genotypes expressing LC2-mCherry. (D and H) Heatmaps showing the range of mCherry fluorescence intensities in (C) and (G) respectively. Colors corresponding to the maximum and minimum fluorescent intensities in the heatmaps are shown in the bar on the right. (I and J) Representative confocal images of 3rd larval NMJ synapses of the indicated genotypes stained with antibodies against Horse Radish Peroxidase (HRP) to visualize the presynaptic axons. (K) Bar-graph showing the relative mCherry fluorescent intensities normalized to the HRP fluorescent intensities at the NMJs from larvae of the indicated genotypes. (L) Fly embryos from wild-type flies and mutant atp8b flies were incubated in buffers containing either 5mM [K+] or 90mM [K+] for 15 minutes and then harvested and immunoblotted for pERK (or tubulin = loading control).