Embed Size (px)
Citation preview
www.sciencemag.org/cgi/content/full/336/6081/559/DC1
Supplementary Materials for
Spin-Orbital Short-Range Order on a Honeycomb-Based Lattice S. Nakatsuji,∗ K. Kuga, K. Kimura, R. Satake, N. Katayama, E. Nishibori, H. Sawa, R. Ishii, M. Hagiwara, F.
Bridges, T. U. Ito, W. Higemoto, Y. Karaki, M. Halim, A. A. Nugroho, J. A. Rodriguez-Rivera, M. A. Green, C. Broholm
* To whom correspondence should be addressed. E-mail: [email protected]
Published 4 May 2012, Science 336, 559 (2012)
DOI: 10.1126/science.1212154
This PDF file includes:
Materials and Methods Supplementary Text Figs. S1 to S7 Tables S1 and S2 References
Supplementary Materials
Materials and methods
Polycrystalline samples were synthesized by heating stoichiometric mixtures of binary oxides.
Single crystals of Ba3CuSb2O9 with linear dimensions up to several mm were grown using a
flux method [13]. Induction Coupled Plasma (ICP) analysis showed the polycrystalline and
single crystal samples to be impurity free to the level of several %. Powder X-ray diffrac-
tion measurement was carried out at SPring-8 BL02B2 with the wave length of 0.648728(2)
A. The sample was cooled to 12 K in a cryostat. A single crystal sample with dimension
0.03 mm×0.03 mm×0.02 mm was measured at SPring-8 BL02B1 with the wave length of
0.353642(3)A. Low T measurements were performed using a helium gas spray device. Ri-
etveld analysis of diffraction patterns from polycrystalline samples confirmed the nominal sto-
ichiometry, but found local off-stoichiometry in single crystalline samples in deviations of the
Cu/Sb2 ratio from unity. This off-stoichiometry could be the origin of the structural phase tran-
sition found in single crystalline samples. Second Harmonic Generation (SHG) measurements
were carried out using a fundamental wavelength of 1063 nm and a scanning SHG microscope
[15]. For the measurement of pyroelectric current along thec-axis, Ag electrodes were vacuum
deposited onto both sample faces perpendicular to thec-axis. Then, pyroelectric current was
measured at a temperature sweep rate of∼ 3 K/min.
Specific heatCP was measured by a thermal relaxation method down to 2 K or 0.4 K. The
magnetic partCM was isolated by subtracting a lattice contribution approximated byCP of the
Zn analog, Ba3ZnSb2O9. DC magnetization measurements were performed under a magnetic
field of 0.1 T for temperatures between 2 K and 350 K and under 1 T between 300 K and 600 K
using a commercial SQUID magnetometer. For both hexagonal and orthorhombic samples, no
hysteresis is observed between field-cooled and zero-field-cooled sequences above 2 K. The low
T AC susceptibility was measured by a mutual inductance method using a dilution refrigerator
for temperatures between 0.02 K and 4 K. For hexagonal polycrystalline samples, an ac field of
7 µT with frequency above 70 Hz was applied.
K-band ESR measurements at 27.5 GHz were performed using a superconducting magnet,
a vector network analyzer, and a home-made ESR cryostat with a cylindrical resonator. No
field-modulation technique was used to detect direct ESR absorption spectra.
ConventionalµSR measurements under zero magnetic fields (less than a few Oe) were car-
ried out at the M15 beam line of TRIUMF, Vancouver, Canada.
The EXAFS experiments were carried out at the Stanford Synchrotron Radiation Light-
source (SSRL), a Directorate of SLAC National Accelerator Laboratory and an Office of Sci-
ence User Facility operated for the U.S. DOE Office of Science by Stanford University.EXAFS
1
data were collected for the hexagonal and orthorhombic samples on beam line 10-2 at SSRL. A
double Si(111) monochromator, with a slit height of 0.5 mm (energy resolution∼ 1.6 eV) and
detuned 50 % for harmonic rejection, was used for the Cu data. For the Sb K-edge, we used a
Si(220) double monochromator with a slit height of 0.25 mm (energy resolution∼ 3.0 eV) and
detuned to 80 % to reduce harmonics. Data were collected at 10 and 300 K using a helium flow
cryostat. Fine powdered samples were mounted on tape and two tape pieces pressed together
(double layer) to encapsulate the material; the appropriate number of double layers were then
stacked together such that the step height at the Cu or Sb K-edge was∼ 0.5.
Supporting online text
1. Crystal Structure Analysis based on X-ray Diffraction
For single crystalline samples, integrated intensities of Bragg reflections were extracted from the
two-dimensional Imaging Plate (IP) usingRAPIDAUTO software (Rigaku). The intensities
were processed bySORTAV software [31]. The initial position of Ba3CuSb2O9 in the unit cell
was determined by a direct method usingSIR2004 [32]. The crystal structures were refined by
full-matrix least-squares methods with anisotropic displacement parameters usingSHELXL−97 [33]. The site occupancy of Cu and Sb2 and an extinction parameter were refined. The
lattice parameters obtained are summarized in Table S1. For powder samples with isotropic
displacement parameters, the structure models were refined by Rietveld analysis [34]. The site
occupancy of Cu and Sb2 (Fig. S1) and the hexagonal to orthorhombic phase fraction were
refined.
In Ba3CuSb2O9, face sharing octahedra (CuSbO9) are connected through corner-sharing
octahedra (SbO6), as shown in Fig. S1. Because of the Cu to Sb2 site mixing, the exact bond
length of Cu-O (dCu−O) cannot be obtained from crystal structural analysis of X-ray diffraction.
ConsideringdSb2−O is almost the same asdSb1−O, the Sb-O bond length in SbO6 octahedra,
which is verified by EXAFS (see the following section for EXAFS), we estimatedCu−O through
the following equation,
dSb2/Cu−O =dSb1−O + dCu−O
2, (S1)
Here,dSb2/Cu−O is the average ofdSb2−O anddCu−O, obtained from crystal structural refine-
ment. Using Eq.S1, we obtain four short (ds = 2.038(3)A) and two long (dl = 2.246(5)A)
Cu-O bonds.A crystal information file (CIF) of the crystal structure of Ba3CuSb2O9 derived
here is available in the Inorganic Crystal Structure Database [35].
The contour diffraction plot was constructed from 30 oscillating 2D patterns recorded on
the IP, which were collected over 60 degrees of sample rotation at intervals of 2 degrees. Figure
2
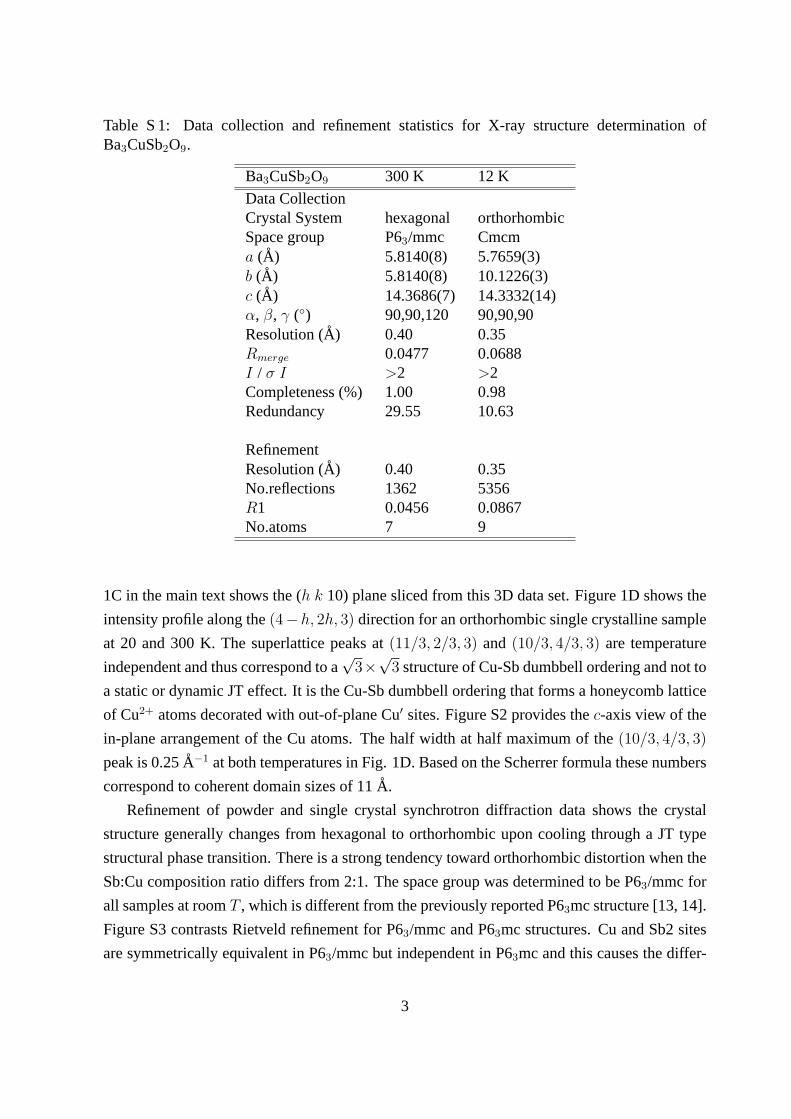
Table S 1: Data collection and refinement statistics for X-ray structure determination ofBa3CuSb2O9.
Ba3CuSb2O9 300 K 12 K
Data CollectionCrystal System hexagonal orthorhombicSpace group P63/mmc Cmcma (A) 5.8140(8) 5.7659(3)b (A) 5.8140(8) 10.1226(3)c (A) 14.3686(7) 14.3332(14)α, β, γ () 90,90,120 90,90,90Resolution (A) 0.40 0.35Rmerge 0.0477 0.0688I / σ I >2 >2Completeness (%) 1.00 0.98Redundancy 29.55 10.63
RefinementResolution (A) 0.40 0.35No.reflections 1362 5356R1 0.0456 0.0867No.atoms 7 9
1C in the main text shows the (h k 10) plane sliced from this 3D data set. Figure 1D shows the
intensity profile along the(4−h, 2h, 3) direction for an orthorhombic single crystalline sample
at 20 and 300 K. The superlattice peaks at(11/3, 2/3, 3) and (10/3, 4/3, 3) are temperature
independent and thus correspond to a√3×
√3 structure of Cu-Sb dumbbell ordering and not to
a static or dynamic JT effect. It is the Cu-Sb dumbbell ordering that forms a honeycomb lattice
of Cu2+ atoms decorated with out-of-plane Cu′ sites. Figure S2 provides thec-axis view of the
in-plane arrangement of the Cu atoms. The half width at half maximum of the(10/3, 4/3, 3)
peak is 0.25A−1 at both temperatures in Fig. 1D. Based on the Scherrer formula these numbers
correspond to coherent domain sizes of 11A.
Refinement of powder and single crystal synchrotron diffraction data shows the crystal
structure generally changes from hexagonal to orthorhombic upon cooling through a JT type
structural phase transition. There is a strong tendency toward orthorhombic distortion when the
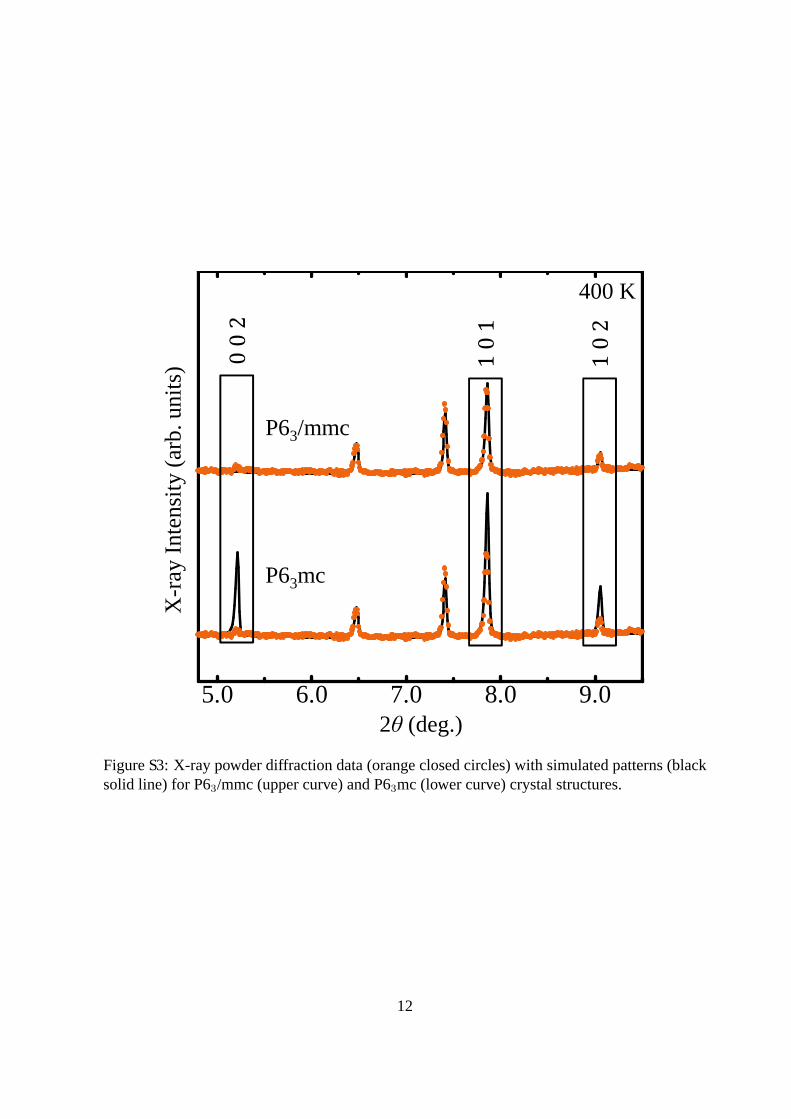
Sb:Cu composition ratio differs from 2:1. The space group was determined to be P63/mmc for
all samples at roomT , which is different from the previously reported P63mc structure [13, 14].
Figure S3 contrasts Rietveld refinement for P63/mmc and P63mc structures. Cu and Sb2 sites
are symmetrically equivalent in P63/mmc but independent in P63mc and this causes the differ-
3
ence in total structural factors, and therefore, different peak intensities. The data can be fitted
better by P63/mmc, resulting in the differentRwp values of 4.00 % for P63/mmc and 5.22 %
for P63mc. At low temperatures, more than 90 % of the sample transforms to Cmcm when the
deviation from 2:1 Sb-Cu stoichiometry exceeds 8 % (Fig. 2C). We label such samples “or-
thorhombic”. In contrast, when the Sb-Cu stoichiometry is within 1 % of nominal composition,
more than 70 % of the sample remains hexagonal at low temperatures (Fig. 2D). This class of
samples is labeled “hexagonal”. The microscopic mechanism that links the off stoichiometry in
Sb/Cu ratio and the JT type structural phase transition is an interesting issue for future studies.
2. Powder Pattern Simulations for ESR Absorption Spectra
The ESR absorption spectra for powdered orthorhombic Ba3CuSb2O9 samples are similar to
powder ESR data for typical crystalline copper compounds with a static JT distortion [36]. The
absorption spectra were simulated assuming a Lorentzian line shape and angular dependence of
line width, anisotropicg-values (ga, gb′, andgc) below 150 K for the orthorhombic sample (Fig.
2A) and below 20 K for the hexagonal sample (Fig. 2B). Isotropicg−values were adequate at
190 K for the orthorhombic sample (Fig. 2A) and above 30 K for the hexagonal sample (Fig.
2B). Here,a, b′, and c are the orthogonal crystal-structure coordinates of the orthorhombic
phase. The powder absorption curve was obtained by numerical spherical integration of the
absorption line expressed in spherical coordinates by the following equations,
I(H) =
∫ π
0
∫ 2π
0
C
(H0(θ, φ)−H)2 +∆H2sinθ dθ dφ (S2)
H0(θ, φ) =hν0
g(θ, φ)µB
(S3)
g(θ, φ) =√g2asin
2θcos2φ+ g2b′sin2θsin2φ+ g2ccos
2θ (S4)
∆H =√∆2
asin2θcos2φ+∆2
b′sin2θsin2φ+∆2
ccos2θ. (S5)
Here,C is a constant,h is Planck’s constant,ν0 is the ESR frequency, andµB is the Bohr
magneton. We used∆a=∆b′=∆c for the spectra at 190 K in Fig. 2A and at 30 K in Fig. 2B of
the main text (single Lorentzian line shape).
3. Extended X-ray Absorption Fine Structure (EXAFS)
Cu and Sb K-edge transmission EXAFS experiments were used to probe the local structure
about Cu and Sb independently. The EXAFS data were reduced using standard techniques
available in the RSXAP package [37]. First a pre-edge background was removed from the
raw data; next the post edge background was removed and the k-space EXAFS oscillations
4
extracted. The k-space data were fast Fourier transformed (FFT) into r-space using the k-space
ranges 3.5-13.0A−1 for the Cu K-edge and 3.5-14.3A−1 for the Sb edge.
In Fig. 2F, we plot the 10 K r-space (Fourier transform) data at the Cu K-edge for the
hexagonal and orthorhombic samples. Although these samples appear quite different using
other probes, the EXAFS data are indistinguishable, indicating comparable local correlations
on the10−16 s EXAFS time scale. We also include two simulations (using FEFF [38]). The
first simulation uses the old P63mc structure [13] (green dashed line in Fig. 2F), which does
not model the EXAFS well. Here we have applied a large global broadening at 10 K (σ2 =
0.005A2) to account for the anticipated reduced amplitude of the Cu-O peak. This accounts
for the peak heights between 3-4A observed in the data, but the data indicates an even broader
distribution of Cu-O bond lengths. In addition, the peak near 2.5A, corresponding to one Sb2
neighbor, is much larger in the data compared to the simulation and has littleT dependence
from 10-300 K. These results indicate the Cu-Sb2 pair (forming the Cu-Sb dumbbell) is very
well ordered. A third result is that the Cu-Ba and Cu-Sb1 peaks between 3 and 4A are broad
and shifted to shorter distances; further evidence of significant local deviations from the best
periodic structure.
The second simulation uses the best orthorhombic structure (Cmcm, dotted blue line in Fig.
2F) and requires significantly less global disorder (σ2 = 0.003A2) for a comparable amplitude
of the Cu-O peak and the longer distance Cu-Sb1 peak (near 3.7A). Also the short Cu-Sb2
peak has a larger amplitude and is slightly shifted to longer distances - somewhat closer to the
EXAFS results. Although there are still significant differences, this orthorhombic structure is
closer to the local structure obtained from EXAFS.
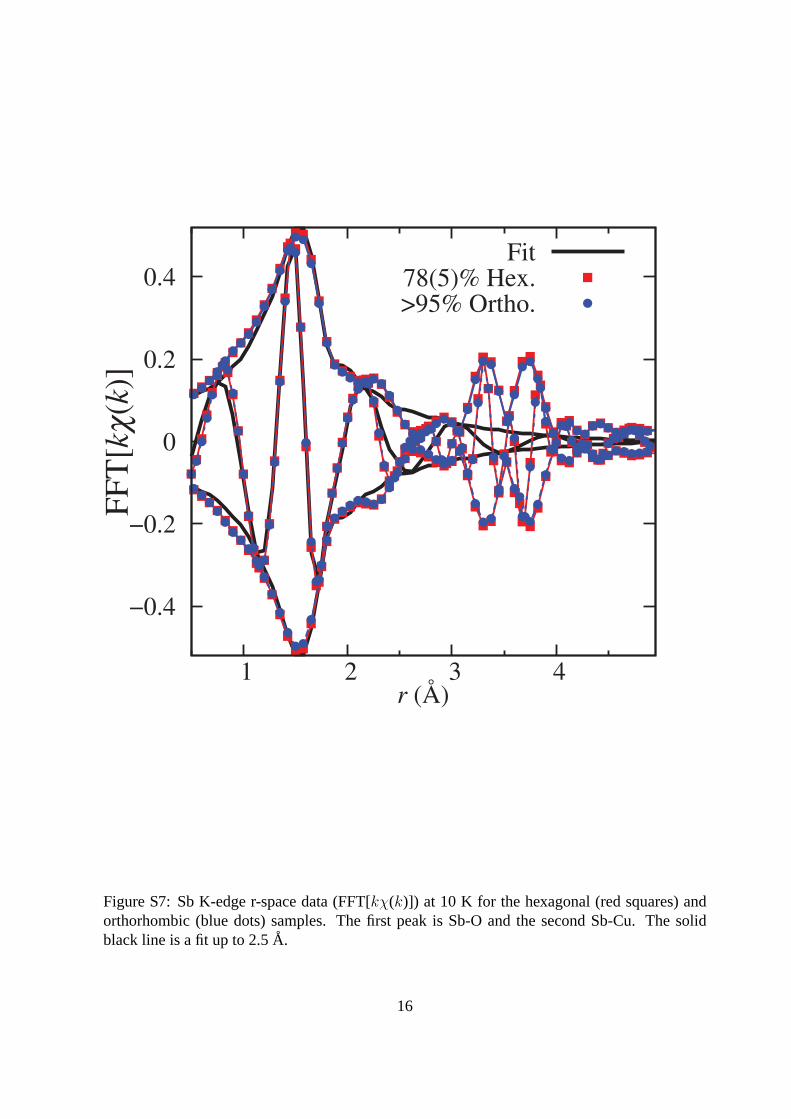
Example of the corresponding Sb r-space data are shown in Fig. S7 for the two samples at
10 K. Note that as for the Cu K-edge data, the traces for each sample overlap extremely well,
indicating similar local order in each material.
The data were fitted to a sum of EXAFS functions, generated by FEFF [38] for each atom
pair. For the Cu K-edge we fit from 1.1-3.9A, to a sum of two Cu-O peaks, with four and
two O neighbors to model the JT distortion, plus a Cu-Sb2 peak (1 neighbor), three Cu-Ba
peaks (3, 3, and 1 neighbors) and a Cu-Sb1 peak (3 neighbors). Because the Cu-O-Sb1 linkage
is nearly linear, we included the Cu-O-Sb1 multiscattering contributions which dominate the
Cu-Sb1 single scattering peak. Also, only the first Cu-Ba peak had a large contribution - the
other two peaks which are too close together to resolve, were significantly broadened. Fourteen
parameters were varied - well below the number of independent parameters [39]. The fit to
the hexagonal sample is shown in Fig. 2F of the main text (solid black line). The fit to the
orthorhombic sample is nearly identical.
The distances for the JT split Cu-O shell (∼ 2.03 and 2.27A) are given in Table S2 for
5
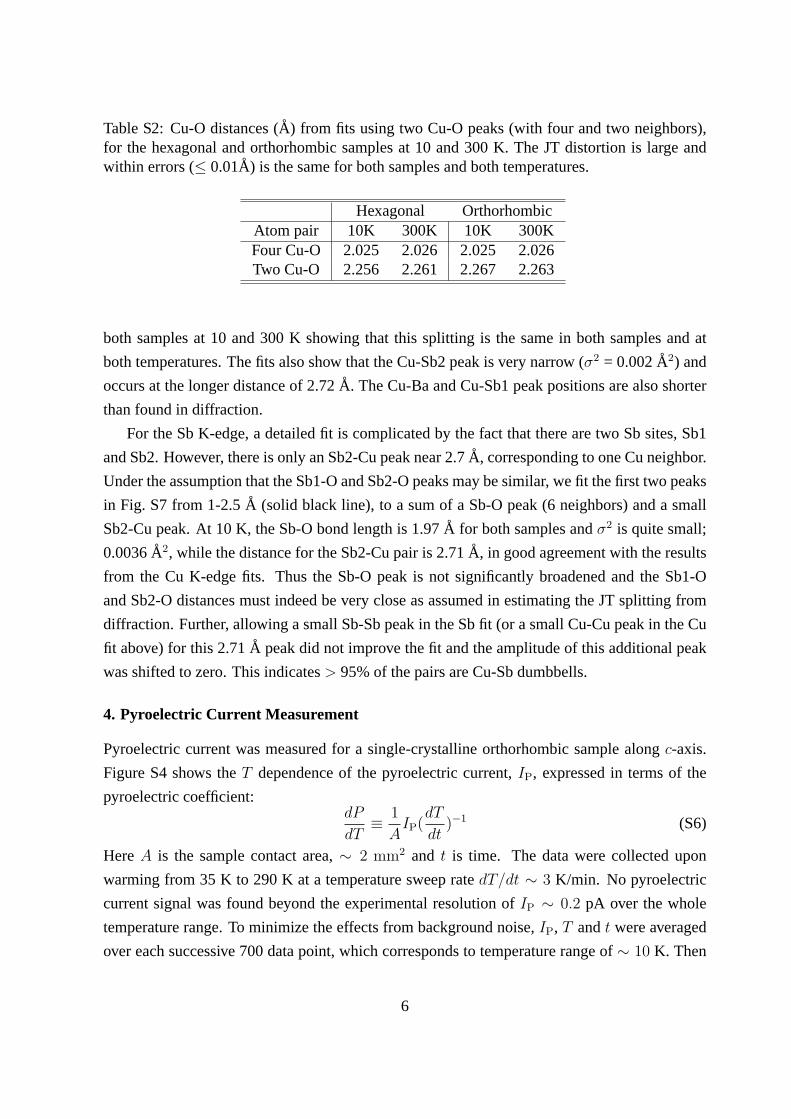
Table S2: Cu-O distances (A) from fits using two Cu-O peaks (with four and two neighbors),for the hexagonal and orthorhombic samples at 10 and 300 K. The JT distortion is large andwithin errors (≤ 0.01A) is the same for both samples and both temperatures.
Hexagonal OrthorhombicAtom pair 10K 300K 10K 300KFour Cu-O 2.025 2.026 2.025 2.026Two Cu-O 2.256 2.261 2.267 2.263
both samples at 10 and 300 K showing that this splitting is the same in both samples and at
both temperatures. The fits also show that the Cu-Sb2 peak is very narrow (σ2 = 0.002A2) and
occurs at the longer distance of 2.72A. The Cu-Ba and Cu-Sb1 peak positions are also shorter
than found in diffraction.
For the Sb K-edge, a detailed fit is complicated by the fact that there are two Sb sites, Sb1
and Sb2. However, there is only an Sb2-Cu peak near 2.7A, corresponding to one Cu neighbor.
Under the assumption that the Sb1-O and Sb2-O peaks may be similar, we fit the first two peaks
in Fig. S7 from 1-2.5A (solid black line), to a sum of a Sb-O peak (6 neighbors) and a small
Sb2-Cu peak. At 10 K, the Sb-O bond length is 1.97A for both samples andσ2 is quite small;
0.0036A2, while the distance for the Sb2-Cu pair is 2.71A, in good agreement with the results
from the Cu K-edge fits. Thus the Sb-O peak is not significantly broadened and the Sb1-O
and Sb2-O distances must indeed be very close as assumed in estimating the JT splitting from
diffraction. Further, allowing a small Sb-Sb peak in the Sb fit (or a small Cu-Cu peak in the Cu
fit above) for this 2.71A peak did not improve the fit and the amplitude of this additional peak
was shifted to zero. This indicates> 95% of the pairs are Cu-Sb dumbbells.
4. Pyroelectric Current Measurement
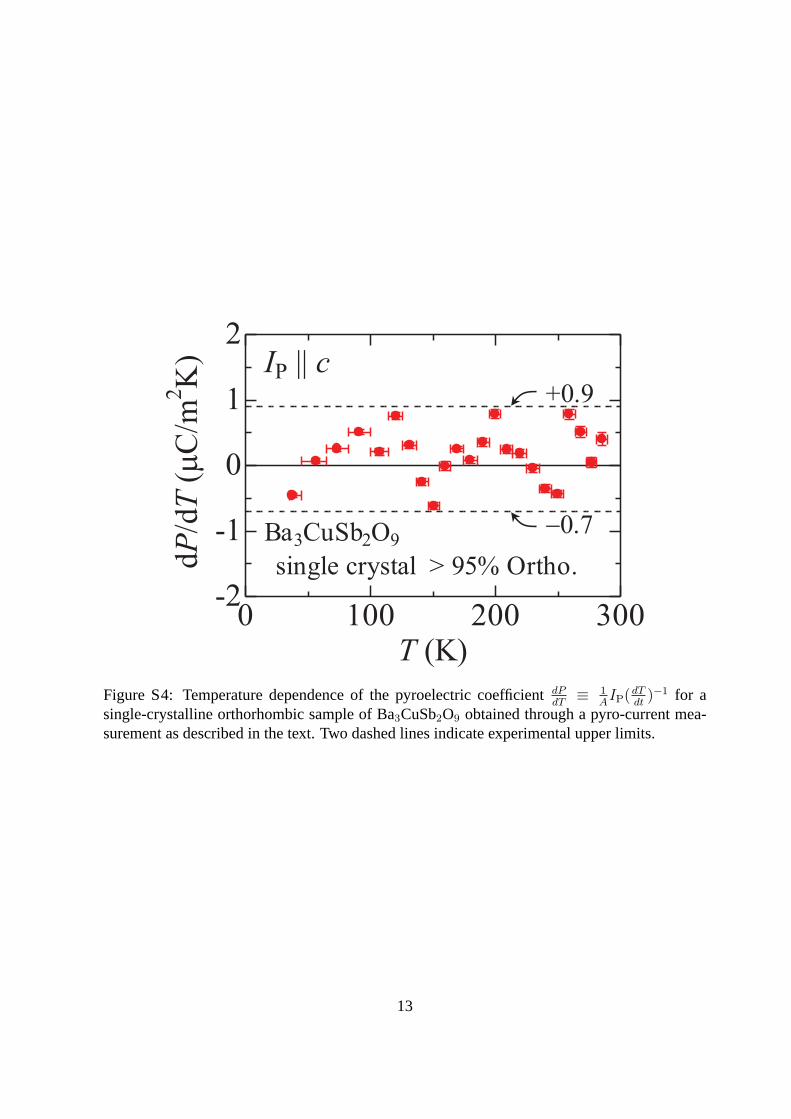
Pyroelectric current was measured for a single-crystalline orthorhombic sample alongc-axis.
Figure S4 shows theT dependence of the pyroelectric current,IP, expressed in terms of the
pyroelectric coefficient:dP
dT≡ 1
AIP(
dT
dt)−1 (S6)
HereA is the sample contact area,∼ 2 mm2 and t is time. The data were collected upon
warming from 35 K to 290 K at a temperature sweep ratedT/dt ∼ 3 K/min. No pyroelectric
current signal was found beyond the experimental resolution ofIP ∼ 0.2 pA over the whole
temperature range. To minimize the effects from background noise,IP, T andt were averaged
over each successive 700 data point, which corresponds to temperature range of∼ 10 K. Then
6
dP/dT was calculated using Eq. (S6). The vertical error bar ofdP/dT is estimated by standard
error. The horizontal error bar ofT represents the temperature range used for averaging data
points. The results in Fig. S4 place an upper limit of 0.9µC/m2K on the pyroelectric coefficient.
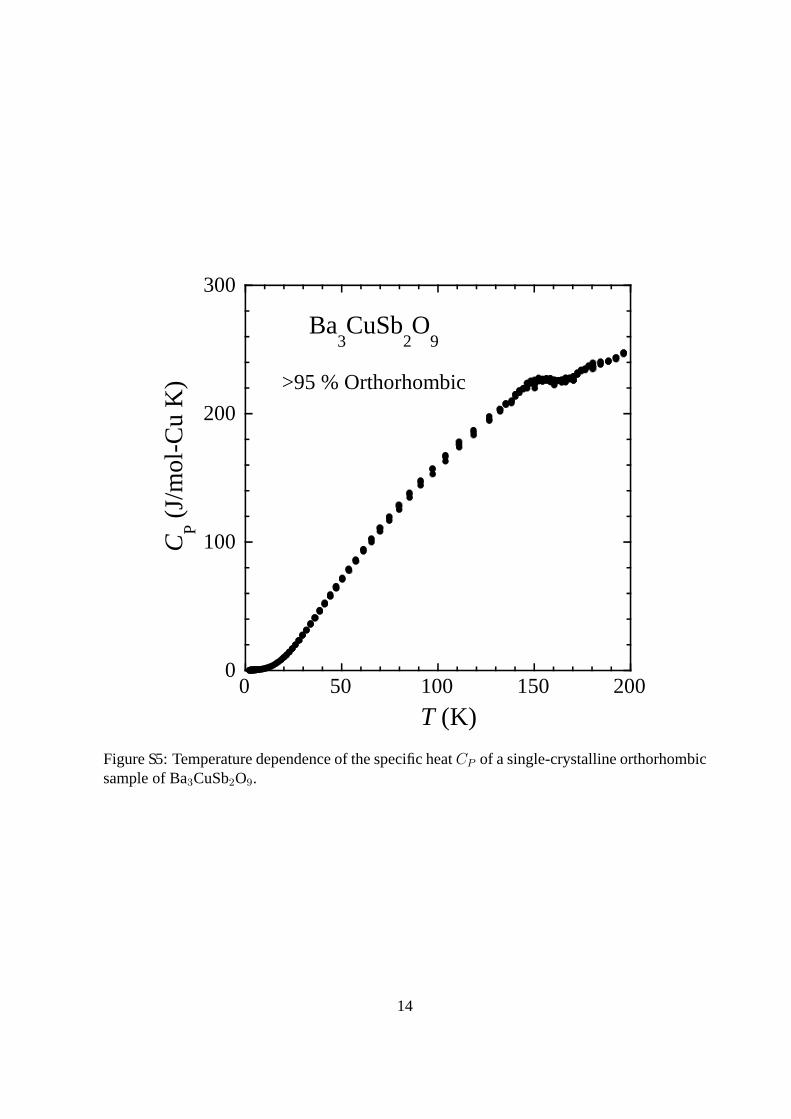
5. Temperature Dependence of Specific Heat for Orthorhombic Sample
The temperature dependence of the specific heatCP was measured for a single crystal that
has an orthorhombic volume fraction beyond 95 % at low temperatures. An anomaly found
at ∼ 170 K corresponds to the Jahn-Teller type transition between the high-T hexagonal and
low-T orthorhombic phases (Fig. S5).
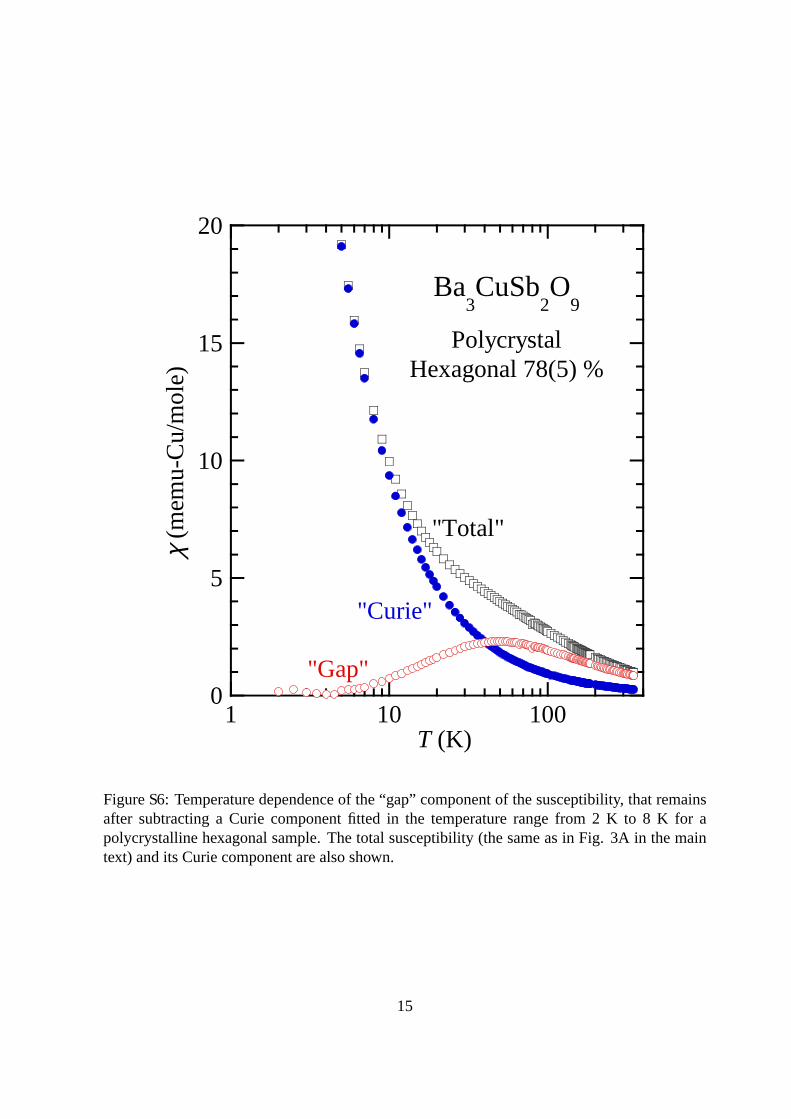
6. Temperature Dependence of Susceptibility
The temperature dependence of the susceptibility shows a Curie behavior at low temperatures
below∼ 10 K for both hexagonal and orthorhombic samples, as shown in Fig. 3A in the main
text. The component left after subtraction of this Curie component is found to be almost the
same for hexagonal and orthorhombic samples, and shows a gap like feature with a peak at
∼ 50 K. This indicates a peak in the density of states near 5 meV, consistent with the inelastic
neutron scattering data. For example, Figure S6 shows the “gap” component for a hexagonal
polycrystalline sample together with the “Curie” component and the total susceptibility. In real-
ity these two components are surely not independent but arise from a single quantum correlated
state such as a random singlet phase or a spin-orbital quantum liquid. A similar analysis and
related results were recently reported forS = 1/2 double perovskites [20].
7. Neutron Scattering
Neutron scattering measurements were carried out at the MACS spectrometer at the NIST Cen-
ter for Neutron Research [40]. A monochromatic neutron beam with energy 4 meV< Ei <
15 meV was reflected to the sample by a double focusing PG(002) monochromator subtending
6 mSr to the hydrogen cold source of the 20 MW NCNR neutron source. The mosaic Full Width
at Half Maximum (FWHM) of the PG(002) crystalline platelets was 50′. A super-mirror guide
with a critical anglem = 3 times that of58Ni provided additional long wave length focusing
between the monochromator and sample. A fission monitor was placed 25 cm before the sam-
ple and its count rate was corrected for order contamination from neutrons with energy4Ei.
Twenty identical detection channels separated by8o in scattering angle within the horizontal
plane subtend a total of 0.2 Sr solid angle to the sample. From sample to3He proportional
counter each channel consists of a90′ soller collimator, a warm beryllium filter to remove order
7
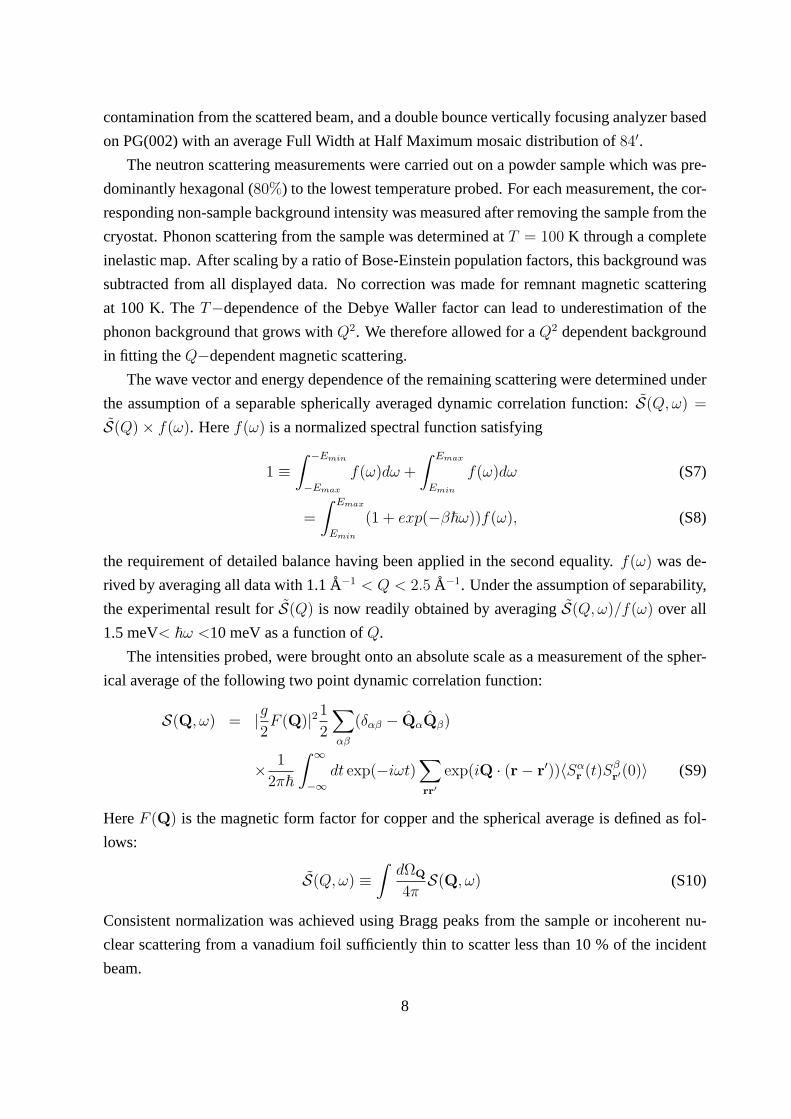
contamination from the scattered beam, and a double bounce vertically focusing analyzer based
on PG(002) with an average Full Width at Half Maximum mosaic distribution of84′.
The neutron scattering measurements were carried out on a powder sample which was pre-
dominantly hexagonal (80%) to the lowest temperature probed. For each measurement, the cor-
responding non-sample background intensity was measured after removing the sample from the
cryostat. Phonon scattering from the sample was determined atT = 100 K through a complete
inelastic map. After scaling by a ratio of Bose-Einstein population factors, this background was
subtracted from all displayed data. No correction was made for remnant magnetic scattering
at 100 K. TheT−dependence of the Debye Waller factor can lead to underestimation of the
phonon background that grows withQ2. We therefore allowed for aQ2 dependent background
in fitting theQ−dependent magnetic scattering.
The wave vector and energy dependence of the remaining scattering were determined under
the assumption of a separable spherically averaged dynamic correlation function:S(Q,ω) =
S(Q)× f(ω). Heref(ω) is a normalized spectral function satisfying
1 ≡∫ −Emin
−Emax
f(ω)dω +
∫ Emax
Emin
f(ω)dω (S7)
=
∫ Emax
Emin
(1 + exp(−β~ω))f(ω), (S8)
the requirement of detailed balance having been applied in the second equality.f(ω) was de-
rived by averaging all data with 1.1A−1 < Q < 2.5 A−1. Under the assumption of separability,
the experimental result forS(Q) is now readily obtained by averagingS(Q,ω)/f(ω) over all
1.5 meV< ~ω <10 meV as a function ofQ.
The intensities probed, were brought onto an absolute scale as a measurement of the spher-
ical average of the following two point dynamic correlation function:
S(Q, ω) = |g2F (Q)|21
2
∑αβ
(δαβ − QαQβ)
× 1
2π~
∫ ∞
−∞dt exp(−iωt)
∑rr′
exp(iQ · (r− r′))〈Sαr (t)S
βr′(0)〉 (S9)
HereF (Q) is the magnetic form factor for copper and the spherical average is defined as fol-
lows:
S(Q,ω) ≡∫
dΩQ
4πS(Q, ω) (S10)
Consistent normalization was achieved using Bragg peaks from the sample or incoherent nu-
clear scattering from a vanadium foil sufficiently thin to scatter less than 10 % of the incident
beam.
8
The wave vector dependence of the measured values forS(q) was compared to the following
expression for the equal time correlation function of a spin dimer with spacing,d.
S(q) = |g2F (Q)|21
3〈S2〉(1− sinQd
Qd) (S11)
We used the orientational average of the ESRg-factorg = 2.2 and Ref.[41] as an approximation
for the copper form factor. For an isolated dimer the total moment sum-rule requires〈S2〉 =
S(S+1) = 3/4. However, in our measurements and subsequent analysis a significantly smaller
number was found (Fig. 4E inset), which indicates substantial spectral weight resides outside
the range of energies accessed here.
8. Muon Spin Relaxation
The low T muon spin relaxation rate,λ ≈ 80 kHz, shown in Fig. 2E of the main text, is
consistent with the motionally narrowed regime for Cu spin fluctuations whereλ ≈ 2(γµBfl)2τ .
Hereγµ is the muon gyromagnetic ratio,Bfl is the magnitude of the fluctuating field at the muon
site due to Cu2+ spin, andτ is the correlation time. Estimating the magnitude of the fluctuating
field as√〈B2
fl〉 = 100 mT corresponding to a 5A attenuation radius and the full Cu2+ moment
and neglecting nuclear dipolar relaxation, we obtainτ ≈ 5×10⁻¹⁰ s. The corresponding energy
scale of 2µeV, is consistent with the absence of a gap in neutron scattering data collected with
an energy resolution of 0.1 meV.
9
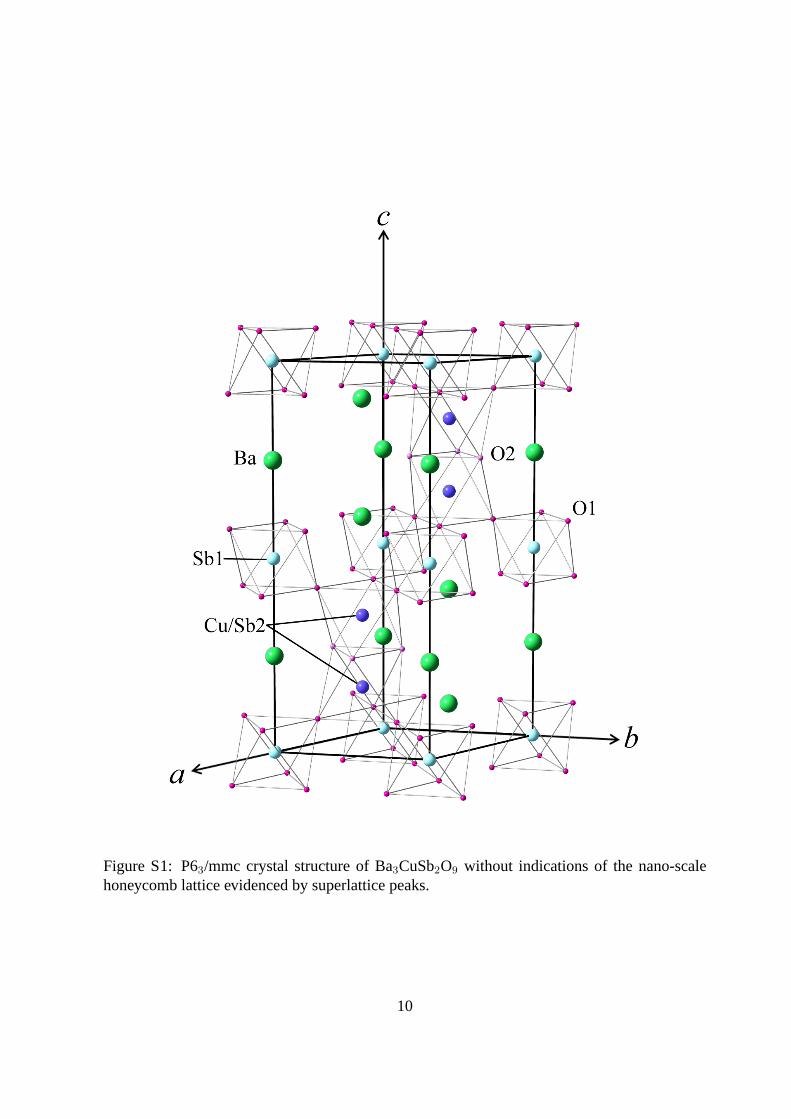
Figure S1: P63/mmc crystal structure of Ba3CuSb2O9 without indications of the nano-scalehoneycomb lattice evidenced by superlattice peaks.
10
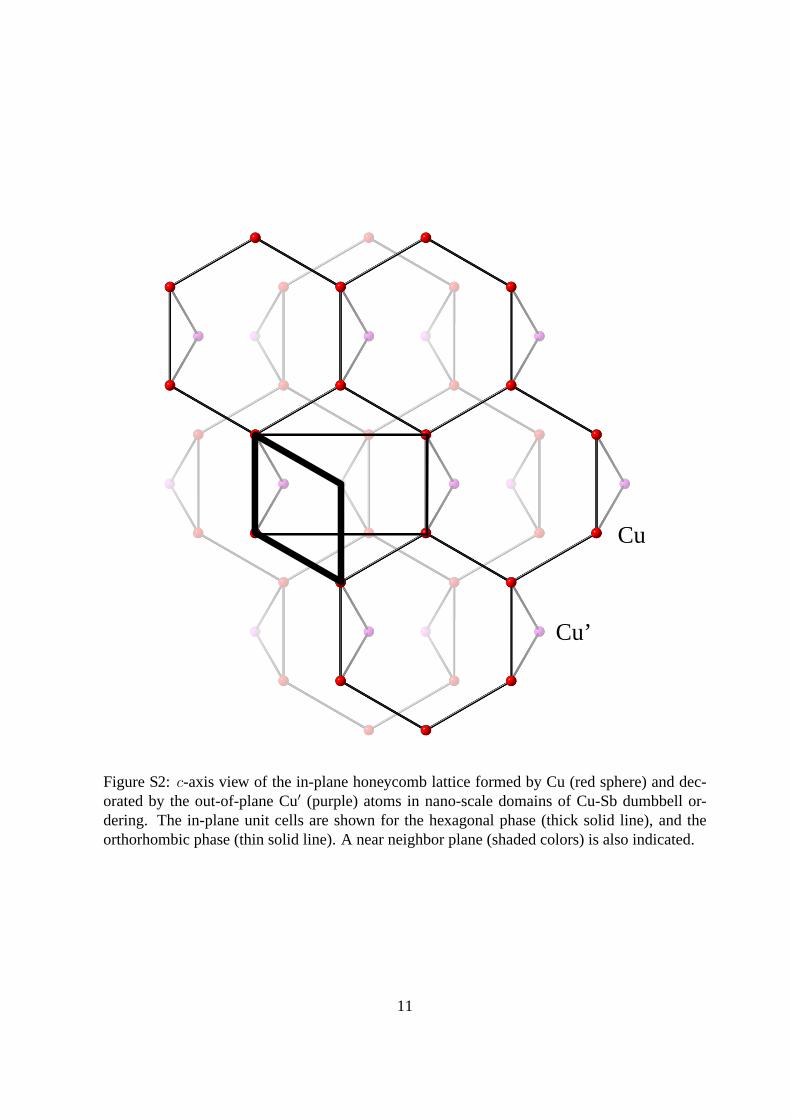
Cu
Cu’
Figure S2:c-axis view of the in-plane honeycomb lattice formed by Cu (red sphere) and dec-orated by the out-of-plane Cu′ (purple) atoms in nano-scale domains of Cu-Sb dumbbell or-dering. The in-plane unit cells are shown for the hexagonal phase (thick solid line), and theorthorhombic phase (thin solid line). A near neighbor plane (shaded colors) is also indicated.
11
5.0 6.0 7.0 8.0 9.0
X-r
ayIn
tens
ity
(arb
. uni
ts)
2θ (deg.)
002
101
102
P63/mmc
P63mc
400 K
Figure S3: X-ray powder diffraction data (orange closed circles) with simulated patterns (blacksolid line) for P63/mmc (upper curve) and P63mc (lower curve) crystal structures.
12
0 100 200 300-2
-1
0
1
2
T (K)
dP
/dT
(m
C/m
2K
) IP || c
Ba3CuSb2O9
single crystal > 95% Ortho.
+0.9
-0.7
Figure S4: Temperature dependence of the pyroelectric coefficientdPdT
≡ 1AIP(
dTdt)−1 for a
single-crystalline orthorhombic sample of Ba3CuSb2O9 obtained through a pyro-current mea-surement as described in the text. Two dashed lines indicate experimental upper limits.
13
0
100
200
300
0 50 100 150 200
CP (
J/m
ol-C
u K
)
T (K)
>95 % Orthorhombic
Ba3CuSb
2O
9
Figure S5: Temperature dependence of the specific heatCP of a single-crystalline orthorhombicsample of Ba3CuSb2O9.
14
0
5
10
15
20
1 10 100
χ (m
emu-
Cu/
mol
e)
T (K)
Ba3CuSb
2O
9
PolycrystalHexagonal 78(5) %
"Total"
"Curie"
"Gap"
Figure S6: Temperature dependence of the “gap” component of the susceptibility, that remainsafter subtracting a Curie component fitted in the temperature range from 2 K to 8 K for apolycrystalline hexagonal sample. The total susceptibility (the same as in Fig. 3A in the maintext) and its Curie component are also shown.
15
−0.4
−0.2
0
0.2
0.4
1 2 3 4
FF
T[k
χ(k
)]
r (Å)
Fit78(5)% Hex.>95% Ortho.
Figure S7: Sb K-edge r-space data (FFT[kχ(k)]) at 10 K for the hexagonal (red squares) andorthorhombic (blue dots) samples. The first peak is Sb-O and the second Sb-Cu. The solidblack line is a fit up to 2.5A.
16
References and Notes
1. P. A. Lee, Physics. An end to the drought of quantum spin liquids. Science 321, 1306 (2008). doi:10.1126/science.1163196 Medline
2. L. Balents, Spin liquids in frustrated magnets. Nature 464, 199 (2010). doi:10.1038/nature08917 Medline
3. S. Sachdev, Kagomé- and triangular-lattice Heisenberg antiferromagnets: Ordering from quantum fluctuations and quantum-disordered ground states with unconfined bosonic spinons. Phys. Rev. B 45, 12377 (1992). doi:10.1103/PhysRevB.45.12377 Medline
4. X.-G. Wen, Quantum orders and symmetric spin liquids. Phys. Rev. B 65, 165113 (2002). doi:10.1103/PhysRevB.65.165113
5. H. Morita, S. Watanabe, M. Imada, Nonmagnetic insulating states near the Mott transitions on lattices with geometrical frustration and implications for κ-(ET)2Cu2(CN)3. J. Phys. Soc. Jpn. 71, 2109 (2002). doi:10.1143/JPSJ.71.2109
6. A. Kitaev, Anyons in an exactly solved model and beyond. Ann. Phys. 321, 2 (2006). doi:10.1016/j.aop.2005.10.005
7. J. S. Helton et al., Spin dynamics of the spin-1/2 kagome lattice antiferromagnet ZnCu3(OH)6Cl2. Phys. Rev. Lett. 98, 107204 (2007). doi:10.1103/PhysRevLett.98.107204 Medline
8. Y. Shimizu, K. Miyagawa, K. Kanoda, M. Maesato, G. Saito, Spin liquid state in an organic Mott insulator with a triangular lattice. Phys. Rev. Lett. 91, 107001 (2003). doi:10.1103/PhysRevLett.91.107001 Medline
9. T. Itou, A. Oyamada, S. Maegawa, M. Tamura, R. Kato, Quantum spin liquid in the spin-1/2 triangular antiferromagnet EtMe3Sb[Pd(dmit)2]2. Phys. Rev. B 77, 104413 (2008). doi:10.1103/PhysRevB.77.104413
10. M. Yamashita et al., Highly mobile gapless excitations in a two-dimensional candidate quantum spin liquid. Science 328, 1246 (2010). doi:10.1126/science.1188200 Medline
11. G. H. Wannier, Antiferromagnetism. The triangular Ising net. Phys. Rev. 79, 357 (1950). doi:10.1103/PhysRev.79.357
12. Supplementary material is available on Science Online.
13. V. P. Köhl, Crystal structure of the hexagonal compounds BaII3MeIISbV
2O9. II. Ba3CuSb2O9. Z. Anorg. Allg. Chem. 442, 280 (1978).
14. H. D. Zhou et al., Spin liquid state in the S = 1/2 triangular lattice Ba3CuSb2O9. Phys. Rev. Lett. 106, 147204 (2011). doi:10.1103/PhysRevLett.106.147204 Medline
15. J. Kaneshiro, S. Kawado, H. Yokota, Y. Uesu, T. Fukui, Three-dimensional observations of polar domain structures using a confocal second-harmonic generation interference microscope. J. Appl. Phys. 104, 054112 (2008). doi:10.1063/1.2975218
16. F. S. Ham, Effect of linear Jahn-Teller coupling on paramagnetic resonance in a 2E state. Phys. Rev. 166, 307 (1968). doi:10.1103/PhysRev.166.307
17. M. Enderle et al., Quantum helimagnetism of the frustrated spin-1/2 chain LiCuVO4. Europhys. Lett. 70, 237 (2005). doi:10.1209/epl/i2004-10484-x
18. P. Schiffer, I. Daruka, Two-population model for anomalous low-temperature magnetism in geometrically frustrated magnets. Phys. Rev. B 56, 13712 (1997). doi:10.1103/PhysRevB.56.13712
19. A. J. Willans, J. T. Chalker, R. Moessner, Disorder in a quantum spin liquid: flux binding and local moment formation. Phys. Rev. Lett. 104, 237203 (2010). doi:10.1103/PhysRevLett.104.237203 Medline
20. T. Aharen et al., Magnetic properties of the geometrically frustrated S=1/2 antiferromagnets, La2LiMoO6 and Ba2YMoO6, with the B-site ordered double perovskite structure: Evidence for a collective spin-singlet ground state. Phys. Rev. B 81, 224409 (2010). doi:10.1103/PhysRevB.81.224409
21. J. P. Carlo et al., Triplet and in-gap magnetic states in the ground state of the quantum frustrated fcc antiferromagnet Ba2YMoO6. Phys. Rev. B 84, 100404 (2011). doi:10.1103/PhysRevB.84.100404
22. Y. Doi, Y. Hinatsu, K. Ohoyama, Structural and magnetic properties of pseudo-two-dimensional triangular antiferromagnets Ba3MSb2O9 (M = Mn, Co, and Ni). J. Phys. Condens. Matter 16, 8923 (2004). doi:10.1088/0953-8984/16/49/009
23. D. S. Fisher, Random antiferromagnetic quantum spin chains. Phys. Rev. B 50, 3799 (1994). doi:10.1103/PhysRevB.50.3799 Medline
24. L. F. Feiner, A. Oleś, J. Zaanen, Quantum melting of magnetic order due to orbital fluctuations. Phys. Rev. Lett. 78, 2799 (1997). doi:10.1103/PhysRevLett.78.2799
25. Y. Q. Li, M. Ma, D. N. Shi, F. C. Zhang, SU(4) theory for spin systems with orbital degeneracy. Phys. Rev. Lett. 81, 3527 (1998). doi:10.1103/PhysRevLett.81.3527
26. F. Vernay, K. Penc, P. Fazekas, F. Mila, Orbital degeneracy as a source of frustration in LiNiO2. Phys. Rev. B 70, 014428 (2004). doi:10.1103/PhysRevB.70.014428
27. F. Reynaud et al., Orbital frustration at the origin of the magnetic behavior in LiNiO2. Phys. Rev. Lett. 86, 3638 (2001). doi:10.1103/PhysRevLett.86.3638 Medline
28. V. Fritsch et al., Spin and orbital frustration in MnSc2S4 and FeSc2S4. Phys. Rev. Lett. 92, 116401 (2004). doi:10.1103/PhysRevLett.92.116401 Medline
29. J. Nasu, A. Nagano, M. Naka, S. Ishihara, Doubly degenerate orbital system in honeycomb lattice: Implication of orbital state in layered iron oxide. Phys. Rev. B 78, 024416 (2008). doi:10.1103/PhysRevB.78.024416
30. B. D. Metcalf, Ground-state spin orderings of triangular Ising-model with nearest and next nearest neighbor interaction. Phys. Lett. A 46, 325 (1974). doi:10.1016/0375-9601(74)90247-3
31. R. H. Blessing, Outlier treatment in data merging. J. Appl. Cryst. 30, 421 (1997). doi:10.1107/S0021889896014628
32. M. C. Burla et al., SIR2004: An improved tool for crystal structure determination and refinement. J. Appl. Cryst. 38, 381 (2005). doi:10.1107/S002188980403225X
33. G. M. Sheldrick, A short history of SHELX. Acta Crystallogr. A 64, 112 (2008). doi:10.1107/S0108767307043930 Medline
34. H. M. Rietveld, A profile refinement method for nuclear and magnetic structures. J. Appl. Cryst. 2, 65 (1969). doi:10.1107/S0021889869006558
35. Inorganic Crystal Structure Database, www.fiz-karlsruhe.de/icsd/. The deposition numbers for the hexagonal and orthorhombic phases of Ba3CuSb2O9 are CSD 424280 and 424279, respectively.
36. C. P. Poole Jr., Electron Spin Resonance -A Comprehensive Treatise on Experimental Techniques- (Dover, Mineola, New York, 1996).
37. C. H. Booth, R-Space X-ray Absorption Package, http://lise.lbl.gov/RSXAP/.
38. A. L. Ankudinov, B. Ravel, J. J. Rehr, S. D. Conradson, Real-space multiple-scattering calculation and interpretation of x-ray-absorption near-edge structure. Phys. Rev. B 58, 7565 (1998). doi:10.1103/PhysRevB.58.7565
39. E. A. Stern, Number of relevant independent points in x-ray-absorption fine-structure spectra. Phys. Rev. B 48, 9825 (1993). doi:10.1103/PhysRevB.48.9825 Medline
40. J. A. Rodriguez et al., MACS - a new high intensity cold neutron spectrometer at NIST. Meas. Sci. Technol. 19, 034023 (2008). doi:10.1088/0957-0233/19/3/034023
41. P. J. Brown, in International Tables for Crystallography, A. J. C. Wilson, Ed. (Kluwer, London, 1995), vol. C.