Embed Size (px)
Citation preview
Supplementary Material online
Population genomics in Bacteria: A case study of
Staphylococcus aureus
Shohei Takuno, Tomoyuki Kado, Ryuichi P. Sugino, Luay Nakhleh & Hideki Innan
Contents
1 Estimating recombination rate 2
2 Inferring demographic history 5
3 Estimating recombination rate under the inferred demography 8
4 Effect of recombination from external source on the elevation of LD 9
5 References 11
1
1 Estimating recombination rate
In eukaryotes, it is a common approach to estimate the recombination rate from the
decay of linkage disequilibrium against distance. This approach usually requires a sample
size> 4, but Ruderfer et al. (2006) recently developed a new method that uses a population
sample with size 3 and an outgroup. We applied this method to the A-B-C trio assuming
D and E as outgroups. Ruderfer et al. (2006) ’s method focuses on the compatibility of the
coalescent patterns at a pair of variable sites. In our analysis, we used 5,289 SNPs at which
the allelic configuration of {A, B, C, D, E} ∈ {{1, 1, 0, 0, 0}, {0, 1, 1, 0, 0}, {1, 0, 1, 0, 0}},
where 0 and 1 represent two variable nucleotides. For these sites, it is very likely that 0
is the ancestral allelic state; therefore, the tree shape can be parsimoniously inferred (i.e.,
((A, B), C), ((B, C), A) and ((A, C), B) are given for {1, 1, 0, 0, 0}, {0, 1, 1, 0, 0}, and
{1, 0, 1, 0, 0}, respectively). It is expected that the probability of tree-shape compatibility
for a pair of completely linked sites is 1 and this probability decreases as the recombination
rate between the two sites increases. When the two sites are completely unlinked, the
probability is 1/3. Thus, the decrease of the probability of tree-shape compatibility against
distance is analogous to the decay of LD (see fig. 5B in the main article).
We used coalescent simulations to determine what recombination parameter gives a
good fit to the observed decay of the probability of tree-shape compatibility. The simulation
was performed by using Hudson’s ms software (Hudson 2002), assuming a constant-size
panmictic population. As mentioned in the main article, bacterial homologous recombi-
nation events should have similar outcome to that of allelic gene conversion rather than
crossing over in eukaryotes (Didelot and Falush 2007, Wiuf and Hein 2000). Therefore,
we set the crossing-over rate = 0 in ms, and investigated how allelic gene conversion alone
could explain the observed decay of the probability of tree-shape compatibility. The model
of gene conversion in the ms software involves two parameters, the initiation rate of gene
conversion event per bp per population, G = 2Ng, where g is initiation rate of an event per
adjacent sites and N is effective population size, and the average length of gene conversion
tract (1/q) (Hudson 2002). Tract length, z, is assumed to be a random variable from a
geometric distribution: q(1 − q)z−1 (Wiuf and Hein 2000). This gene conversion model
has been well incorporated in the coalescent process of bacterial populations to simulate
2
Rec
ombi
natio
n ra
te
Distance (kb)
Effect of G with 1/q = 10 kbA
Distance (kb)
Rec
ombi
natio
n ra
te
Effect of 1/q with G = 0.005B
G = 0.0025G = 0.005
G = 0.00125
G = 0.01
1/q = 1 kb1/q = 10 kb
1/q = 0.1 kb
1/q = 100 kb
Prob
. tre
e-co
mpa
tibilit
y
Distance (kb) Distance (kb)
Prob
. tre
e-co
mpa
tibilit
y
G = 0.0025G = 0.005
G = 0.00125
G = 0.01
1/q = 1 kb1/q = 10 kb
1/q = 0.1 kb
1/q = 100 kb
0 10 20 30 40 500
50
100
150
200
0 10 20 30 40 500
50
100
150
200
0 10 20 30 40 500
0.2
0.4
0.6
0.8
1
0 10 20 30 40 500
0.2
0.4
0.6
0.8
1
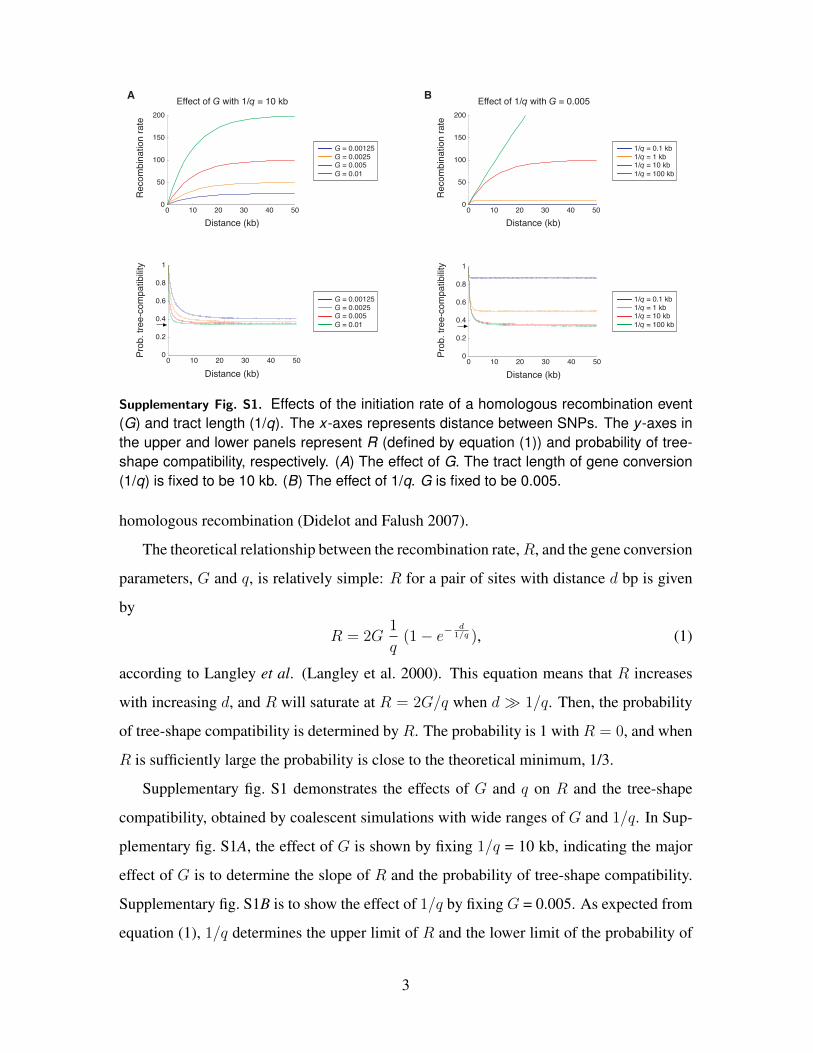
Supplementary Fig. S1. Effects of the initiation rate of a homologous recombination event(G) and tract length (1/q). The x-axes represents distance between SNPs. The y -axes inthe upper and lower panels represent R (defined by equation (1)) and probability of tree-shape compatibility, respectively. (A) The effect of G. The tract length of gene conversion(1/q) is fixed to be 10 kb. (B) The effect of 1/q. G is fixed to be 0.005.
homologous recombination (Didelot and Falush 2007).
The theoretical relationship between the recombination rate,R, and the gene conversion
parameters, G and q, is relatively simple: R for a pair of sites with distance d bp is given
by
R = 2G1
q(1− e−
d1/q ), (1)
according to Langley et al. (Langley et al. 2000). This equation means that R increases
with increasing d, and R will saturate at R = 2G/q when d � 1/q. Then, the probability
of tree-shape compatibility is determined by R. The probability is 1 with R = 0, and when
R is sufficiently large the probability is close to the theoretical minimum, 1/3.
Supplementary fig. S1 demonstrates the effects of G and q on R and the tree-shape
compatibility, obtained by coalescent simulations with wide ranges of G and 1/q. In Sup-
plementary fig. S1A, the effect of G is shown by fixing 1/q = 10 kb, indicating the major
effect of G is to determine the slope of R and the probability of tree-shape compatibility.
Supplementary fig. S1B is to show the effect of 1/q by fixing G = 0.005. As expected from
equation (1), 1/q determines the upper limit of R and the lower limit of the probability of
3
Distance (kb)
Pro
b. tr
ee-c
ompa
tibili
ty
Expectation(panmictic model)
Observation
0 2 4 6 8 100
0.20.40.60.8
1
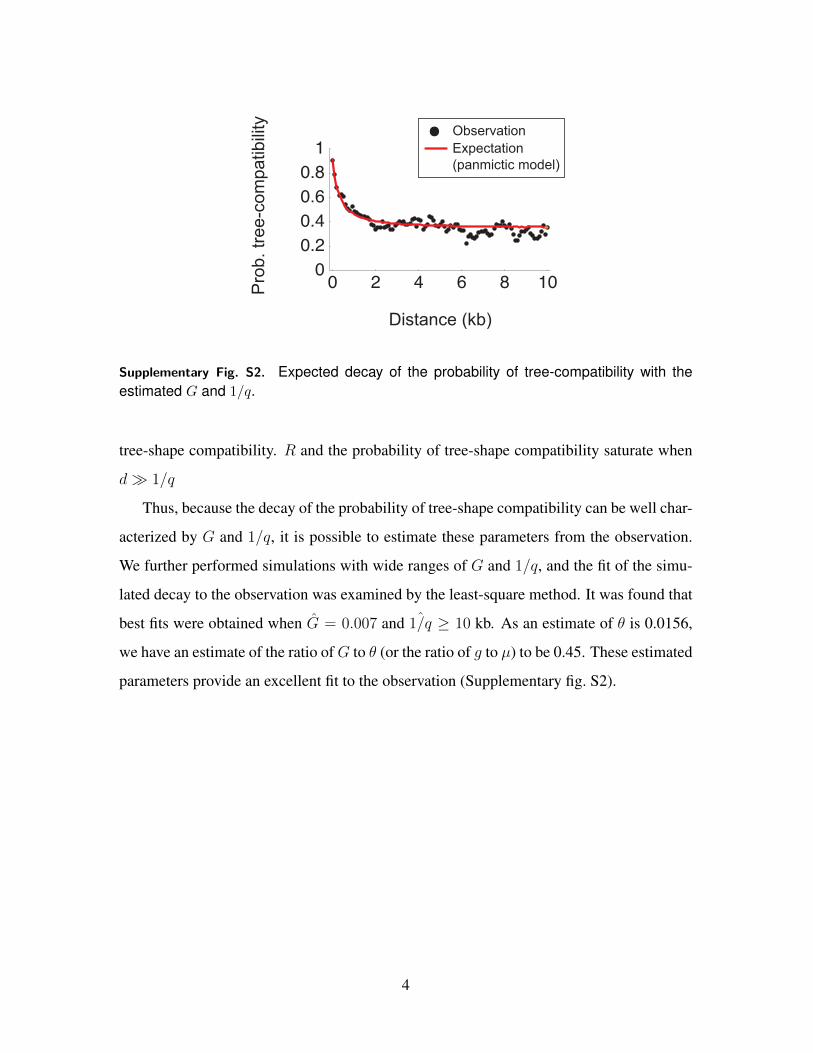
Supplementary Fig. S2. Expected decay of the probability of tree-compatibility with theestimated G and 1/q.
tree-shape compatibility. R and the probability of tree-shape compatibility saturate when
d� 1/q
Thus, because the decay of the probability of tree-shape compatibility can be well char-
acterized by G and 1/q, it is possible to estimate these parameters from the observation.
We further performed simulations with wide ranges of G and 1/q, and the fit of the simu-
lated decay to the observation was examined by the least-square method. It was found that
best fits were obtained when G = 0.007 and ˆ1/q ≥ 10 kb. As an estimate of θ is 0.0156,
we have an estimate of the ratio ofG to θ (or the ratio of g to µ) to be 0.45. These estimated
parameters provide an excellent fit to the observation (Supplementary fig. S2).
4
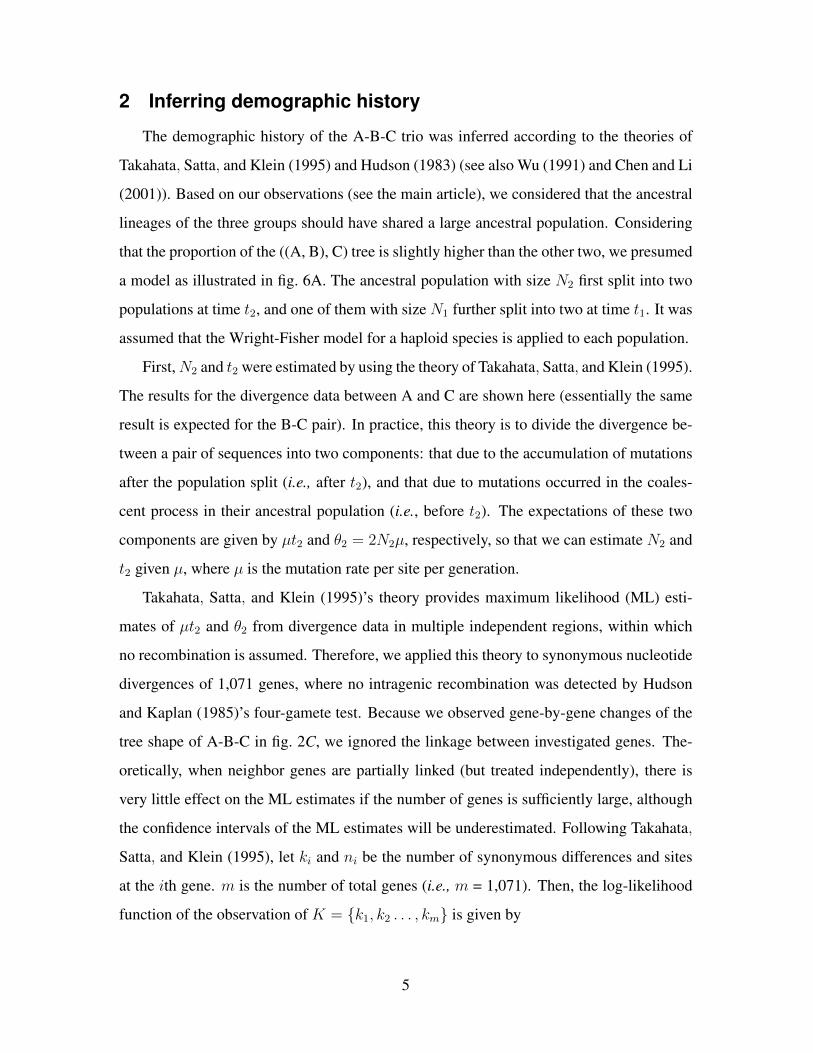
2 Inferring demographic history
The demographic history of the A-B-C trio was inferred according to the theories of
Takahata, Satta, and Klein (1995) and Hudson (1983) (see also Wu (1991) and Chen and Li
(2001)). Based on our observations (see the main article), we considered that the ancestral
lineages of the three groups should have shared a large ancestral population. Considering
that the proportion of the ((A, B), C) tree is slightly higher than the other two, we presumed
a model as illustrated in fig. 6A. The ancestral population with size N2 first split into two
populations at time t2, and one of them with size N1 further split into two at time t1. It was
assumed that the Wright-Fisher model for a haploid species is applied to each population.
First,N2 and t2 were estimated by using the theory of Takahata, Satta, and Klein (1995).
The results for the divergence data between A and C are shown here (essentially the same
result is expected for the B-C pair). In practice, this theory is to divide the divergence be-
tween a pair of sequences into two components: that due to the accumulation of mutations
after the population split (i.e., after t2), and that due to mutations occurred in the coales-
cent process in their ancestral population (i.e., before t2). The expectations of these two
components are given by µt2 and θ2 = 2N2µ, respectively, so that we can estimate N2 and
t2 given µ, where µ is the mutation rate per site per generation.
Takahata, Satta, and Klein (1995)’s theory provides maximum likelihood (ML) esti-
mates of µt2 and θ2 from divergence data in multiple independent regions, within which
no recombination is assumed. Therefore, we applied this theory to synonymous nucleotide
divergences of 1,071 genes, where no intragenic recombination was detected by Hudson
and Kaplan (1985)’s four-gamete test. Because we observed gene-by-gene changes of the
tree shape of A-B-C in fig. 2C, we ignored the linkage between investigated genes. The-
oretically, when neighbor genes are partially linked (but treated independently), there is
very little effect on the ML estimates if the number of genes is sufficiently large, although
the confidence intervals of the ML estimates will be underestimated. Following Takahata,
Satta, and Klein (1995), let ki and ni be the number of synonymous differences and sites
at the ith gene. m is the number of total genes (i.e., m = 1,071). Then, the log-likelihood
function of the observation of K = {k1, k2 . . . , km} is given by
5
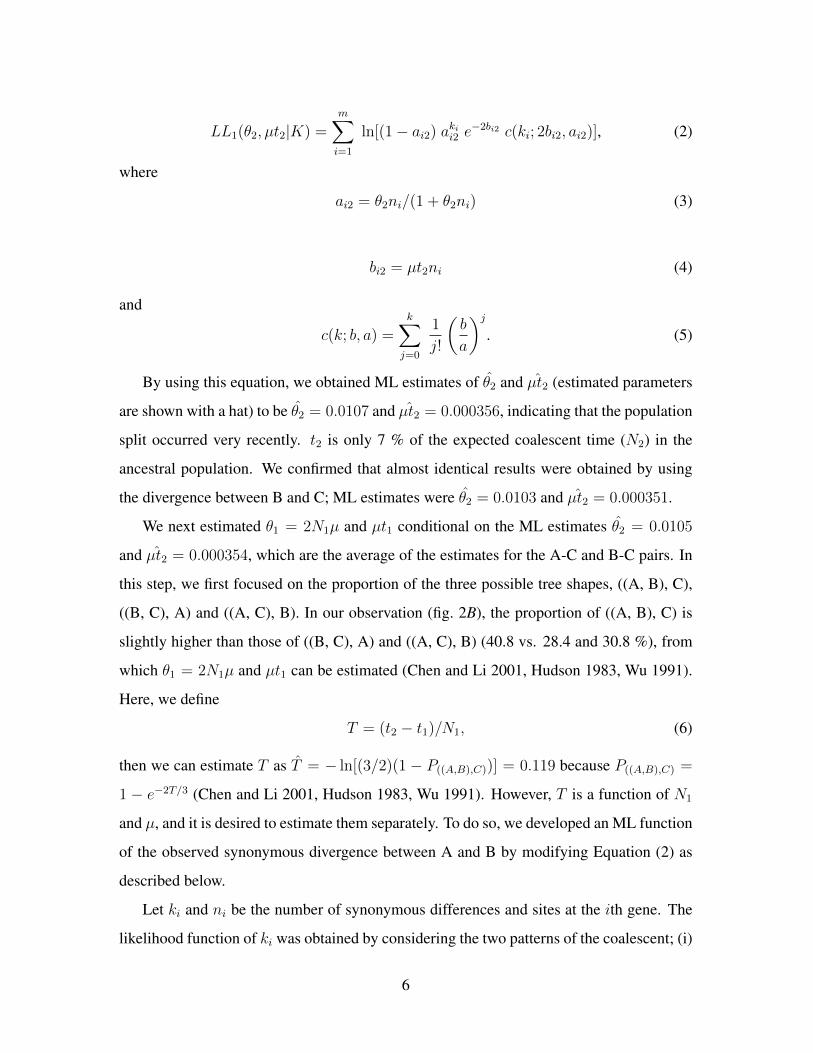
LL1(θ2, µt2|K) =m∑i=1
ln[(1− ai2) akii2 e−2bi2 c(ki; 2bi2, ai2)], (2)
where
ai2 = θ2ni/(1 + θ2ni) (3)
bi2 = µt2ni (4)
and
c(k; b, a) =k∑
j=0
1
j!
(b
a
)j
. (5)
By using this equation, we obtained ML estimates of θ2 and µt2 (estimated parameters
are shown with a hat) to be θ2 = 0.0107 and µt2 = 0.000356, indicating that the population
split occurred very recently. t2 is only 7 % of the expected coalescent time (N2) in the
ancestral population. We confirmed that almost identical results were obtained by using
the divergence between B and C; ML estimates were θ2 = 0.0103 and µt2 = 0.000351.
We next estimated θ1 = 2N1µ and µt1 conditional on the ML estimates θ2 = 0.0105
and µt2 = 0.000354, which are the average of the estimates for the A-C and B-C pairs. In
this step, we first focused on the proportion of the three possible tree shapes, ((A, B), C),
((B, C), A) and ((A, C), B). In our observation (fig. 2B), the proportion of ((A, B), C) is
slightly higher than those of ((B, C), A) and ((A, C), B) (40.8 vs. 28.4 and 30.8 %), from
which θ1 = 2N1µ and µt1 can be estimated (Chen and Li 2001, Hudson 1983, Wu 1991).
Here, we define
T = (t2 − t1)/N1, (6)
then we can estimate T as T = − ln[(3/2)(1 − P((A,B),C))] = 0.119 because P((A,B),C) =
1 − e−2T/3 (Chen and Li 2001, Hudson 1983, Wu 1991). However, T is a function of N1
and µ, and it is desired to estimate them separately. To do so, we developed an ML function
of the observed synonymous divergence between A and B by modifying Equation (2) as
described below.
Let ki and ni be the number of synonymous differences and sites at the ith gene. The
likelihood function of ki was obtained by considering the two patterns of the coalescent; (i)
6
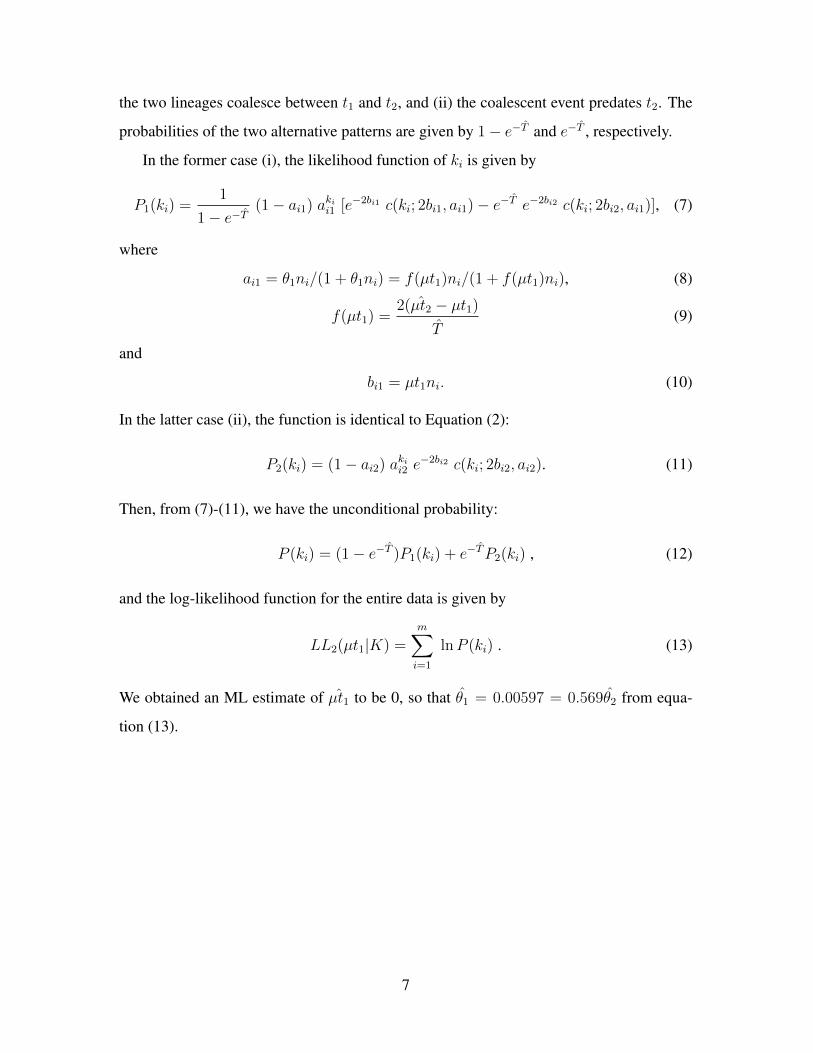
the two lineages coalesce between t1 and t2, and (ii) the coalescent event predates t2. The
probabilities of the two alternative patterns are given by 1− e−T and e−T , respectively.
In the former case (i), the likelihood function of ki is given by
P1(ki) =1
1− e−T(1− ai1) akii1 [e−2bi1 c(ki; 2bi1, ai1)− e−T e−2bi2 c(ki; 2bi2, ai1)], (7)
where
ai1 = θ1ni/(1 + θ1ni) = f(µt1)ni/(1 + f(µt1)ni), (8)
f(µt1) =2(µt2 − µt1)
T(9)
and
bi1 = µt1ni. (10)
In the latter case (ii), the function is identical to Equation (2):
P2(ki) = (1− ai2) akii2 e−2bi2 c(ki; 2bi2, ai2). (11)
Then, from (7)-(11), we have the unconditional probability:
P (ki) = (1− e−T )P1(ki) + e−TP2(ki) , (12)
and the log-likelihood function for the entire data is given by
LL2(µt1|K) =m∑i=1
lnP (ki) . (13)
We obtained an ML estimate of µt1 to be 0, so that θ1 = 0.00597 = 0.569θ2 from equa-
tion (13).
7
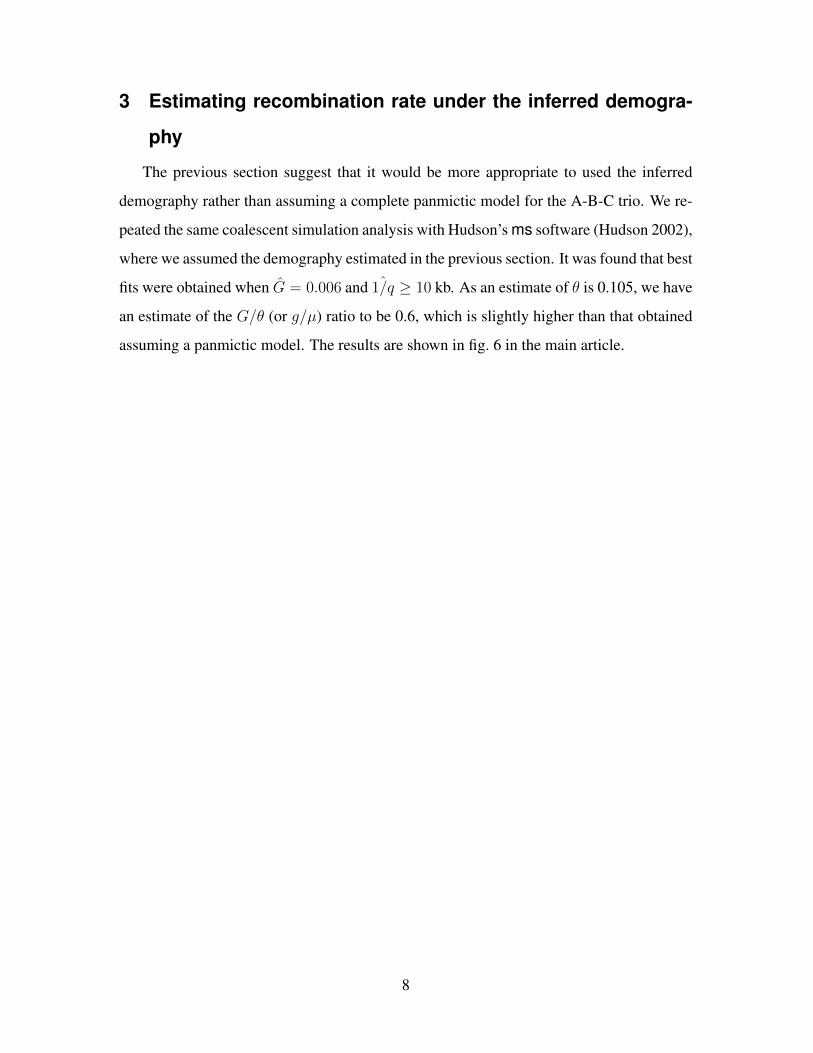
3 Estimating recombination rate under the inferred demogra-
phy
The previous section suggest that it would be more appropriate to used the inferred
demography rather than assuming a complete panmictic model for the A-B-C trio. We re-
peated the same coalescent simulation analysis with Hudson’s ms software (Hudson 2002),
where we assumed the demography estimated in the previous section. It was found that best
fits were obtained when G = 0.006 and ˆ1/q ≥ 10 kb. As an estimate of θ is 0.105, we have
an estimate of the G/θ (or g/µ) ratio to be 0.6, which is slightly higher than that obtained
assuming a panmictic model. The results are shown in fig. 6 in the main article.
8
4 Effect of recombination from external source on the eleva-
tion of LD
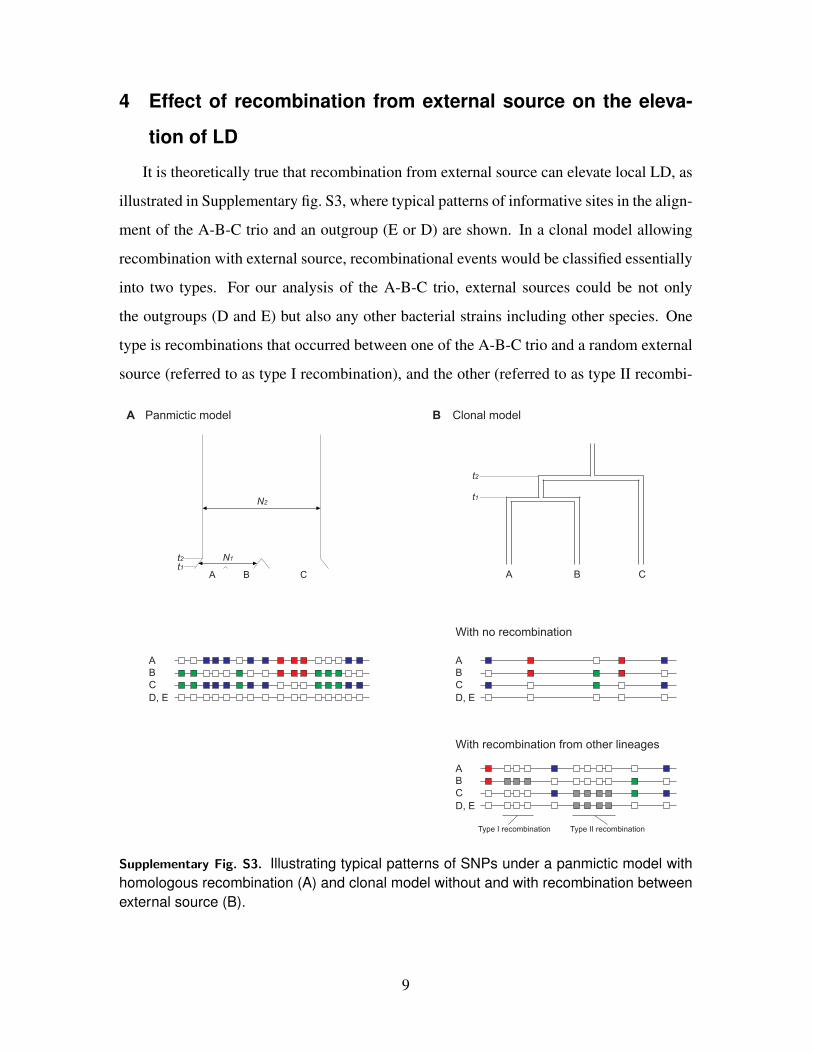
It is theoretically true that recombination from external source can elevate local LD, as
illustrated in Supplementary fig. S3, where typical patterns of informative sites in the align-
ment of the A-B-C trio and an outgroup (E or D) are shown. In a clonal model allowing
recombination with external source, recombinational events would be classified essentially
into two types. For our analysis of the A-B-C trio, external sources could be not only
the outgroups (D and E) but also any other bacterial strains including other species. One
type is recombinations that occurred between one of the A-B-C trio and a random external
source (referred to as type I recombination), and the other (referred to as type II recombi-
A Panmictic model
With no recombination
A
D, ECB
A
D, ECB
With recombination from other lineages
A
D, ECB
Type I recombination Type II recombination
N2
N1
A B Ct1t2
Clonal modelB
A CB
t1
t2
Supplementary Fig. S3. Illustrating typical patterns of SNPs under a panmictic model withhomologous recombination (A) and clonal model without and with recombination betweenexternal source (B).
9
Pro
b. tr
ee-c
ompa
tibili
ty
Distance (kb)
5 %10 %20 %
Expectation(clonal model)2.5 %
Tract length = 200 bp
Pro
b. tr
ee-c
ompa
tibili
ty
Distance (kb)
Tract length = 1 kb
0 2 4 6 8 100
0.20.40.60.8
1
0 2 4 6 8 100
0.20.40.60.8
1
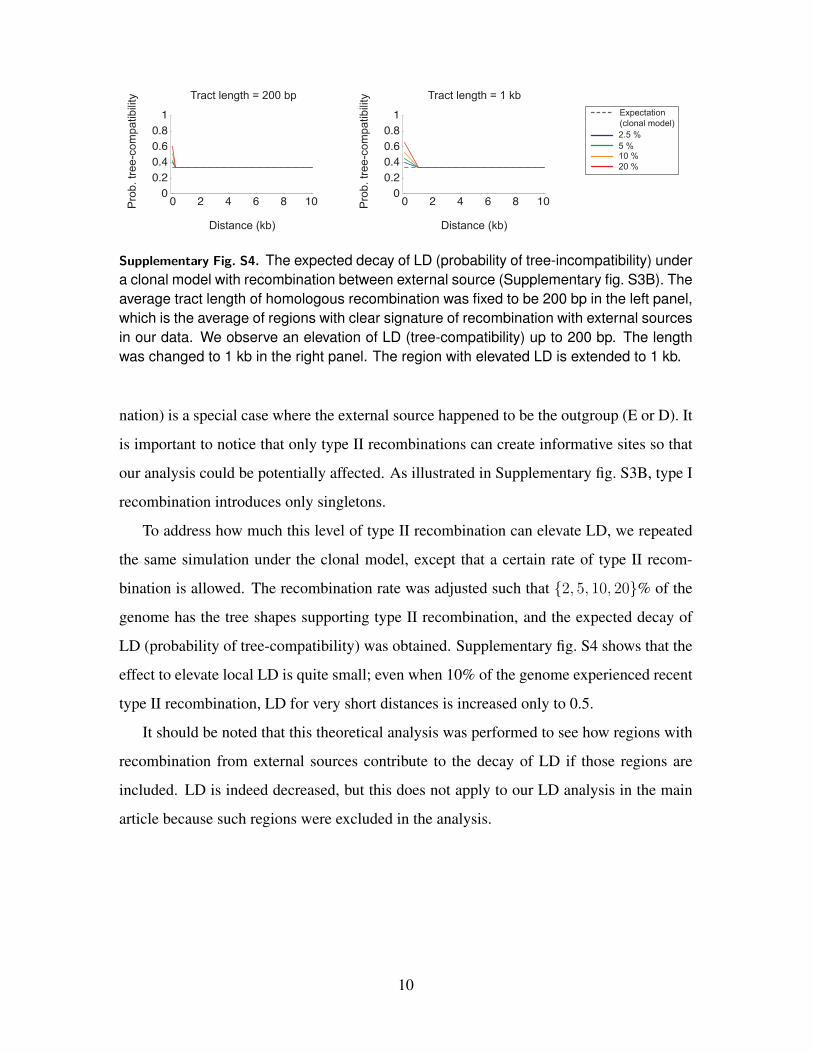
Supplementary Fig. S4. The expected decay of LD (probability of tree-incompatibility) undera clonal model with recombination between external source (Supplementary fig. S3B). Theaverage tract length of homologous recombination was fixed to be 200 bp in the left panel,which is the average of regions with clear signature of recombination with external sourcesin our data. We observe an elevation of LD (tree-compatibility) up to 200 bp. The lengthwas changed to 1 kb in the right panel. The region with elevated LD is extended to 1 kb.
nation) is a special case where the external source happened to be the outgroup (E or D). It
is important to notice that only type II recombinations can create informative sites so that
our analysis could be potentially affected. As illustrated in Supplementary fig. S3B, type I
recombination introduces only singletons.
To address how much this level of type II recombination can elevate LD, we repeated
the same simulation under the clonal model, except that a certain rate of type II recom-
bination is allowed. The recombination rate was adjusted such that {2, 5, 10, 20}% of the
genome has the tree shapes supporting type II recombination, and the expected decay of
LD (probability of tree-compatibility) was obtained. Supplementary fig. S4 shows that the
effect to elevate local LD is quite small; even when 10% of the genome experienced recent
type II recombination, LD for very short distances is increased only to 0.5.
It should be noted that this theoretical analysis was performed to see how regions with
recombination from external sources contribute to the decay of LD if those regions are
included. LD is indeed decreased, but this does not apply to our LD analysis in the main
article because such regions were excluded in the analysis.
10
5 References
Chen FC, Li WH. 2001. Genomic divergences between humans and other hominoids and
the effective population size of the common ancestor of humans and chimpanzees. Am.
J. Hum. Genet. 68:444–456.
Didelot X, Falush D. 2007. Inference of bacterial microevolution using multilocus se-
quence data. Genetics 175:1251–1266.
Hudson RR. 1983. Testing the constant-rate neutral allele model with protein sequence
data. Evolution 37:203–217.
Hudson RR. 2002. Generating samples under a Wright-Fisher neutral model of genetic
variation. Bioinformatics 18:337–338.
Hudson RR, Kaplan NL. 1985. Statistical properties of the number of recombination
events in the history of a sample of DNA sequences. Genetics 111:147–164.
Langley CH, Lazzaro BP, Phillips W, Heikkinen E, Braverman JM. 2000. Linkage disequi-
libria and the site frequency spectra in the su(s) and su(w(a)) regions of the Drosophila
melanogaster X chromosome. Genetics 156:1837–1852.
Ruderfer DM, Pratt SC, Seidel HS, Kruglyak L. 2006. Population genomic analysis of
outcrossing and recombination in yeast. Nat. Genet. 38:1077–1081.
Takahata N, Satta Y, Klein J. 1995. Divergence time and population size in the lineage
leading to modern humans. Theor. Popul. Biol. 48:198–221.
Wiuf C, Hein J. 2000. The coalescent with gene conversion. Genetics 155:451–462.
Wu CI. 1991. Inferences of species phylogeny in relation to segregation of ancient poly-
morphisms. Genetics 127:429–435.
11