Embed Size (px)
Citation preview

Supplementary Material
High-speed high-resolution imaging of intercellular immune synapses
using optical tweezers
Stephane Oddos*, Christopher Dunsby†, Marco A. Purbhoo
‡, Anne Chauveau
‡, Dylan M. Owen*,
Mark A. A. Neil†, Daniel M. Davis
‡ and Paul M. W. French
†
*Chemical Biology Centre; †Department of Physics;
‡Division of Cell and Molecular Biology, Imperial
College London, London SW7 2AZ, UK.
Corresponding authors: Daniel M. Davis, Tel.: +44-207-594-5420; Fax: +44-207-594-3044; E-mail:
[email protected] and Paul M. W. French, Tel.: +44207-594-7706; Fax: +44-207-594-7714; E-
mail: [email protected].

Supporting Figures
Figure S1 Z-stack of a cell pair held vertically by the optical tweezers and imaging of the
interface.
Figure S2 Top: Filopodia length in the plane of the inhibitory NK-cell Bottom: Numerous
filopodial protrusions at the NK cell immune synapse human immune synapse.
Figure S3 Number of sustained (>1min) exclusion areas within the central accumulation at the
inhibitory immune synapse.
Supplementary Methods
Movies
Movie S1 Time-lapse movie of the cells shown in Figure 1
Movie S2 Time-lapse movie of the cell shown in Figure 2
Movie S3 Time-lapse movie of the cell shown in Figure 3

Figure S1
A
B
Red=
DiD
/Gre
en=
DiO
z
x
Z = 0 μm Z = 1.8 μm Z = 3.6 μm Z = 5.4 μm Z = 9 μm
Z = 14.4 μm Z = 16.2 μm
Z = 7.2 μm Z = 10.8 μm Z = 12.6 μm
Z = 18 μm Z = 19.8 μm Z = 21.6 μm Z = 23.4 μm Z = 25.2 μm Z = 27 μm

Figure S2
0
2
4
6
8
10
12
14
2 3 4 5 6 7 8 9 10 11 12 13
Freq
uen
cy
Filopodia length (µm)

Figure S3
0
1
2
3
4
5
6
7
8
0 1 2 3 4 5 6 7
Freq
uen
cy
Number of exclusion areas

SUPPORTING FIGURE LEGENDS
Figure S1
Z-stack of a cell pair held vertically by the optical tweezers and imaging of the interface. One
cell is stained with the membrane dye DiD (red), the other with the membrane dye DiO (green).
(A) Confocal z-stack (20 steps) across the cell pair. The interface between the two cells is where
both green and red appear on the same image (here at z = 12.6 μm). (B) 3D reconstruction of the
z-stack in A showing the vertical arrangement of the cell pair. Scale bar, 5 μm.
Figure S2
Top: Filopodia length in the plane of the inhibitory NK-cell human immune synapse.
(YTS/KIR2DL1-GFP and 721.221/Cw6). A total number of 50 filopodia were analysed (using 3
representative cells over time-series of several minutes each). The indicated numbers refer to the
length of the filopodia within the optical plane of the immune synapse. Only clear protrusions
(i.e. > 2 µm) were considered. The average length of filopodia was ~ 6 µm. Bottom: Numerous
filopodial protrusions at the NK cell immune synapse. The image has been saturated to highlight
these dim structures. Scale bar, 5 μm.
Figure S3
Number of sustained (>1 min) exclusion areas within the central accumulation at the inhibitory
immune synapse (YTS/KIR2DL1-GFP and 721.221/Cw6). Total number of analysed cells, 26.

SUPPLEMENTARY METHODS
Cells
Cell culture: Cells were cultured in R10 media (RPMI1640 medium supplemented with
10% FCS, 100 μg/ml Penicillin-Streptomycin and L-glutamine (Invitrogen)) at 37°C in a
5% CO2 atmosphere. Cells were passaged at a ratio of 10:1 or 10:2 every 3 days.
Experiments were carried out the day after passaging.
Immune cell lines: for experiments with T cells, the immortal T cell line Jurkat E6.1 was
used. For experiments with NK cells, we used the NK cell line YTS stably expressing the
fusion protein KIR2DL1-GFP (green fluorescent protein) (1).
Target cell lines: for experiments with T cells we used Raji B cells pulsed with
Staphylococcal enterotoxin E (SEE) super-antigen. Cells were incubated with SEE (100
ng/mL) for at least 45 min at 37°C, 5% CO2. After incubation, cells were centrifuged
twice at 1200 rpm for 5 minutes and resuspended in R10 media to remove excess SEE.
For experiments with NK cells, the B cell line 721.221 stably expressing MHC class-1-
Cw6 was used (2).
Membrane dye staining: to stain the cells with the membrane-partitioning dye 1,1'-
dioctadecyl-3,3,3',3'-tetramethylindodicarbocyanine perchlorate (DiD) (Molecular
Probes), ~106 cells were incubated for 7 minutes at 37°C in a 5% CO2 atmosphere in 1
μL of R10 media with 1-3 μL of DiD. Cells were then centrifuged at 1200 rpm for 5
minutes and resuspended in R10 media.
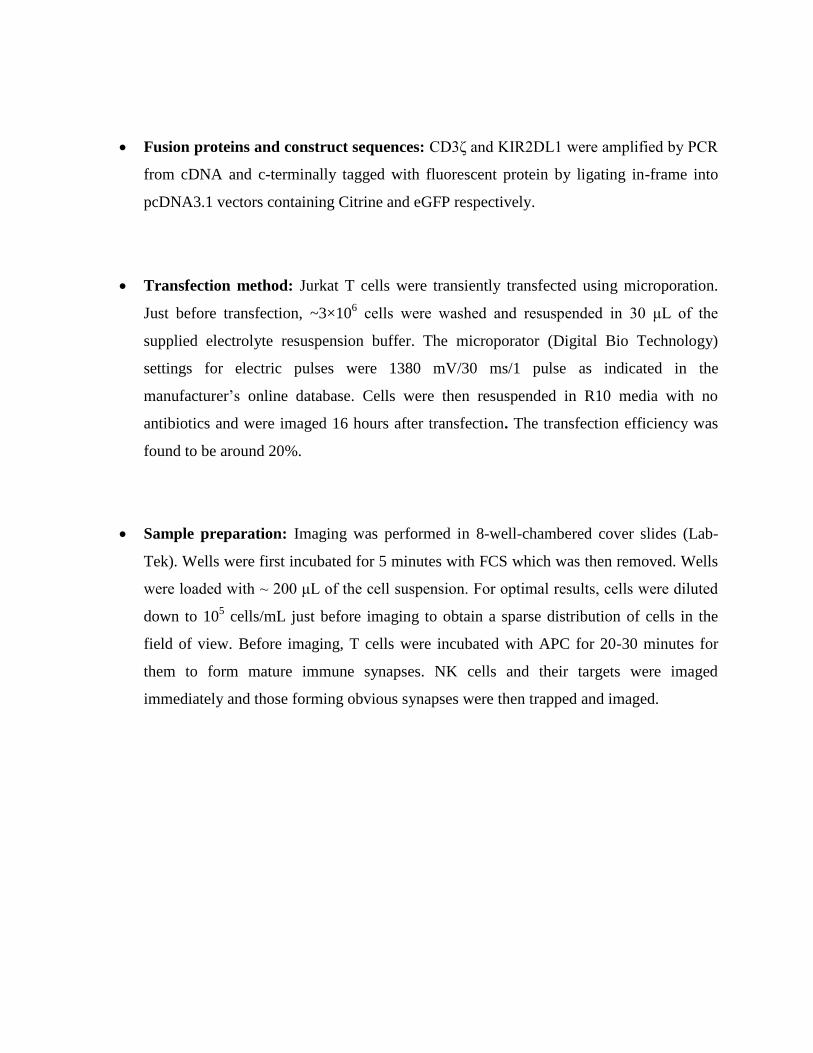
Fusion proteins and construct sequences: CD3ζ and KIR2DL1 were amplified by PCR
from cDNA and c-terminally tagged with fluorescent protein by ligating in-frame into
pcDNA3.1 vectors containing Citrine and eGFP respectively.
Transfection method: Jurkat T cells were transiently transfected using microporation.
Just before transfection, ~3×10⁶ cells were washed and resuspended in 30 μL of the
supplied electrolyte resuspension buffer. The microporator (Digital Bio Technology)
settings for electric pulses were 1380 mV/30 ms/1 pulse as indicated in the
manufacturer’s online database. Cells were then resuspended in R10 media with no
antibiotics and were imaged 16 hours after transfection. The transfection efficiency was
found to be around 20%.
Sample preparation: Imaging was performed in 8-well-chambered cover slides (Lab-
Tek). Wells were first incubated for 5 minutes with FCS which was then removed. Wells
were loaded with ~ 200 μL of the cell suspension. For optimal results, cells were diluted
down to 105 cells/mL just before imaging to obtain a sparse distribution of cells in the
field of view. Before imaging, T cells were incubated with APC for 20-30 minutes for
them to form mature immune synapses. NK cells and their targets were imaged
immediately and those forming obvious synapses were then trapped and imaged.

Optical-tweezer set up
Full set up for two traps/optical elements
Optical-tweezer main elements for two-actuable traps
Source characteristics. To generate the optical tweezers, a fibre-coupled continuous-
wave (CW) solid-state laser diode emitting at 980 nm was used (LC96, Bookham Inc).
The maximum output power of this source is 600 mW. The NA of the output fibre is
0.13. The diode was mounted into a Peltier cooled mount (Thorlabs Ltd) allowing
connections for the temperature controller and driving current controller. The diode
power was controlled using the following calibration curve (provided by the
manufacturer):
Sample
IR coated polarizing beam splitter
IR coated polarizing beam splitter
Actuating mirror
Actuating mirror
Collimator
IR laser diode output
Beam expander / relay lenses
Microscope objective

Power/driving current calibration curve of the tweezer source
IR/visible dichroic characteristics: to couple the IR light used to trap the cells in the
confocal microscope we used a dichroic beam splitter with a cut-off wavelength around
900nm (Chroma Technology Corp). The transmission curve of the dichroic filter is the
following (provided by the manufacturer):
Transmission curve of the IR/visible dichroic
Wavelength (nm)
% T
200 400 600 800 1000 1200
0.0
10.0
20.0
30.0
40.0
50.0
60.0
70.0
80.0
90.0
100.0

Tweezer optics: the output beam from the laser diode was collimated using an IR-coated
lens (diameter = 16 mm, f = 25 mm, Comar) to produce a collimated beam of diameter
~6.5 mm. To produce two independent, actuable traps, the beam were separated into two
beams using a polarising beam splitter cube (bandwidth = 900-1300 nm, dimension =
25.4 mm, Newport Corporation). Actuation of the beams was performed using IR-coated
steering mirrors (diameter = 25.4 mm, bandwidth = 750-1100 nm, Thorlabs). Before
coupling into the microscope, the two beams were recombined using a similar polarising
beam-splitter cube. To avoid vignetting, the microscope-objective pupil was imaged on
the actuating mirrors using a pair of coated relay lenses in a 4f configuration (diameter =
25 mm, f = 200 mm and f = 160 mm, Comar). These lenses also expanded the beam by a
factor 1.25, bringing the beam diameter to ~8.2 mm to slightly overfill the pupil of the
microscope objective.
Cell manipulation: cells were manipulated in the xy plane using the steering mirrors.
Manipulation of cells along the z axis was possible by defocusing the two relay lenses
and thus producing a diverging wavefront in the pupil plane of the microscope objective.
To rotate the cell conjugates, the power required was less than 30 mW for a few seconds.
Once the cells were in the right configuration, less than 15 mW was needed to keep them
balanced. Detrimental effects of such powers at this wavelength are negligible.

Imaging
Confocal microscope: the optical tweezers were coupled into the non-descanned port of
a commercial confocal microscope with galvanometric scanners (TCS SP5, Leica
Microsystems Ltd). A 63×, 1.25NA oil-immersion objective was used.
Detector-bandwidth: detection was performed using an internal photomultiplier tube
(PMT) of the confocal microscope. The detection bandwidth was 500-600 nm for YFP
and GFP. For DiD, the detection bandwidth was 640-700 nm. The photomultiplier gain
voltage was generally set to 1000 V. An internal 715 nm short-pass filter was used to
block reflections from the trapping beam reaching the detectors.
Excitation laser: fluorophore excitation was performed using the internal lasers of
the confocal microscope. To excite YFP and GFP we used the 488 nm line of an Ar+
laser. To excite DiD we used the 633 nm line of a HeNe laser. Driving current was set at
40% of the maximum. Laser attenuation for the 633 nm line was in general set between
80-90%. Laser attenuation for the 488 nm line was generally set between 40-60%.
Adjustment of the laser power during the course of the experiment could occasionally be
performed to compensate for fluorophore photobleaching. The laser power could be
increased to allow small and dim structures to be seen when necessary while allowing
brighter structures to saturate the detector.
Frame rate and size: The scanning rate was generally set at the fastest allowed by the
galvanometric-scanners (400 Hz line-scanning rate). For a 512x512 pixel frame, this
resulted in a frame rate of 1 frame per seconde. To achieve faster frame rates, the frame
size could be reduced to 256×256 pixels, with no loss of resolution (the voxel size

remained below the maximum diffraction limited size) as the field of view was reduced
to image only one pair of cell conjugates.
Image processing
ImageJ: Image processing was performed using the freeware package ImageJ (NIH).
Image brightness and contrast were adjusted to maximise image clarity. For oversampled
images, Fourier filtering could be occasionally used to remove residual noise.
Volocity: Volocity (Improvision) was used to produce 3D reconstructions and en face
views of cell conjugates. Volocity was also used to measure filopodia lengths and
synapse areas.
References
1. Borszcz, P. D., M. Peterson, L. Standeven, S. Kirwan, M. Sandusky, A. Shaw, E. O.
Long, and D. N. Burshtyn. 2003. KIR enrichment at the effector-target cell interface is
more sensitive than signalling to the strength of ligand biding. Eur. J. Immunol.
33:1084:1093.
2. Davis, D. M., I. Chui, M. Fassett, G. B. Cohen, O. Mandelboim, and J. L. Strominger.
1999. The human natural killer cell immune synapse. Proc. Natl. Acad. Sci. U. S. A.
96:15062-15067.