Embed Size (px)
Citation preview

W W W. N A T U R E . C O M / N A T U R E | 1
SUPPLEMENTARY INFORMATIONdoi:10.1038/nature12030
Xiong et al. S1
Supplementary Figure 1 | Glucose-TOR transcription networks mediate inter-organ
dialogues to drive plant growth. Leaf photosynthesis produces sucrose and glucose to fuel
plant growth. Glucose activates TOR kinase via glycolysis and mitochondrial bioenergetic relays
to orchestrate global transcriptional reprogramming, which integrates central and secondary
carbon metabolism with bioenergetics, biosynthesis, signalling, TFs, chromatin modulators,
transporters, autophagy, and cell cycle regulation. Significantly, glucose-TOR signalling is
integrated in local promotion of root meristem activation by transcriptional regulation of genes
for cell cycle entry, root growth factors (RGF), UPBEAT1(UPB1) transcription factor and
glutathione (GSH) synthesis via inter-organ coordination. ETC, electron transport chain.

SUPPLEMENTARY INFORMATION
2 | W W W. N A T U R E . C O M / N A T U R E
RESEARCH Xiong et al. S2
Supplementary Figure 2 | Rapid reactivation of the quiescent root meristem. Cell cycle re-
entry is quickly reactivated by 2 h of glucose (Glc, 15 mM) treatment in seedlings 3 DAG, but is
blocked by rapamycin (Rap) or in the tor mutant. S-phase entry is visualized by EdU in situ
staining. Scale bar: 50 µm.

W W W. N A T U R E . C O M / N A T U R E | 3
SUPPLEMENTARY INFORMATION RESEARCH
Xiong et al. S3
Supplementary Figure 3 | Differential sugar effects on root growth and meristem activation.
a, Root growth activation by different sugars. b, Quiescent root meristem activation by different
sugars. Sugars (15 mM) were added to seedlings grown in liquid medium at 3DAG for 24 h.
Glucose (Glc), sucrose (Suc), fructose (Fru), xylose (Xyl) and galactose (Gal) were examined.
Meristem activation was blocked by 2-DG (2-Deoxyglucose), a glycolysis inhibitor. Scale bar, 1
mm or 25 µm.

SUPPLEMENTARY INFORMATION
4 | W W W. N A T U R E . C O M / N A T U R E
RESEARCH Xiong et al. S4
Supplementary Figure 4 | Reactivation of the quiescent root meristem by photosynthesis
requires glycolysis and mitochondrial bioenergetic relays. Quiescent root meristem cells were
reactivated by 24 h of enhanced photosynthesis (200 μmol/m2 s light in 400 µl liquid medium,
0.5 x MS and 6 mM Na2CO3, pH 5.7), which was prevented by inhibitors targeting
photosynthesis, glycolysis or mitochondria. Glucose (Glc, 15 mM), light (L), DCMU (D, 20
μM), 2-Deoxyglucose (2-DG, 10 mM), and antimycin A (AMA, 5 uM). Scale bar: 25 µm.

W W W. N A T U R E . C O M / N A T U R E | 5
SUPPLEMENTARY INFORMATION RESEARCHXiong et al. S5
Supplementary Figure 5 | Amino acids cannot activate the quiescent root meristem. The
quiescent root meristem was treated with glucose (Glc, 15 mM), amino acid mix (AAs, 0.1 mM
each for 17 amino acids) or glutamine (Gln, 0.1 mM) for 24 h. Up to 1 mM each for the 17-
amino-acid mix and up to 5 mM Gln did not activate the quiescent root meristem. S-phase entry
is visualized by EdU in situ staining. Scale bar: 25 µm.

SUPPLEMENTARY INFORMATION
6 | W W W. N A T U R E . C O M / N A T U R E
RESEARCHXiong et al. S6
Supplementary Figure 6 | Time-course analysis of TOR expression in the inducible tor
mutant. Estradiol treatment (10 µM) triggered quick degradation of TOR proteins in the
inducible tor mutants. DAG, day after germination.

W W W. N A T U R E . C O M / N A T U R E | 7
SUPPLEMENTARY INFORMATION RESEARCHXiong et al. S7
Supplementary Figure 7 | Glucose-TOR signalling promotes root meristem activation. a, b,
Quantitative measurement of root meristem length and cell number in 3DAG WT (Col or Ler),
tor and gin2 seedlings after 24 h treatment without or with glucose (Glc), and without or with
rapamycin (Rap, 10 ) or AMA (5 M). For tor seedlings, estradiol (10 M) was added at the
beginning of germination. Values represent means; error bars are s.d. (n>30). Unpaired Student's
t test was used to identify significant differences (*P<0.05) when compared with the data from
samples treated with glucose.

SUPPLEMENTARY INFORMATION
8 | W W W. N A T U R E . C O M / N A T U R E
RESEARCHXiong et al. S8
Supplementary Figure 8 | Reactivation of the quiescent root meristem by photosynthesis
requires TOR signalling. Quiescent root meristem cells were reactivated by 24 h of enhanced
photosynthesis (200 μmol/m2 s light in 400 µl liquid medium, 0.5 x MS and 6 mM Na2CO3, pH
5.7), which was blocked by rapamycin (Rap, 10 μM) or in the tor mutant. Scale bar: 50 µm.

W W W. N A T U R E . C O M / N A T U R E | 9
SUPPLEMENTARY INFORMATION RESEARCHXiong et al. S9
Supplementary Figure 9 | TOR kinase but not glucose sensor (gin2) controls root meristem activation and S-phase entry. Glucose (Glc, 15 mM); Rapamycin (Rap, 10 µM). Scale bar, 25 µm.

SUPPLEMENTARY INFORMATION
1 0 | W W W. N A T U R E . C O M / N A T U R E
RESEARCH Xiong et al. S10
Supplementary Figure 10 | Rapamycin, AMA and tor do not interfere cytokinin and auxin signalling. a, Auxin signalling does not require TOR signalling and mitochondrial energy relay. b, Cytokinin signalling does not require TOR signalling and mitochondrial energy relay. Primary auxin and cytokinin marker genes were activated by 1h of indole-3-acetic acid (IAA) or trans-Zeatin (tZ) treatment in seedlings at 3DAG, and analysed by quantitative RT-PCR. Error bars are s.d., n=3. IAA29: INDOLE-ACIDIC ACID29; Saur62: Small-Auxin-Up-Regulated62; ARR7: Arabidopsis Response Regulator7; ARR16: Arabidopsis Response Regulator16.

W W W. N A T U R E . C O M / N A T U R E | 1 1
SUPPLEMENTARY INFORMATION RESEARCHXiong et al. S11
Supplementary Figure 11 | Glucose-TOR signalling activates the cell cycle in stem and
progenitor cells in the root meristem. a, Reactivation of the quiescent root meristem by 24 h
glucose treatment. S-phase entry is visualized by EdU staining. Red circles indicate quiescent-
centre cells and the white outline marks the stem cell initials. Scale bar: 10 µm. b, A schematic
diagram representing cell types in Arabidopsis root meristem. EdU staining was observed in all
cell types in the root meristem after glucose stimulation, except the quiescent centre.

SUPPLEMENTARY INFORMATION
1 2 | W W W. N A T U R E . C O M / N A T U R E
RESEARCHXiong et al. S12
Supplementary Figure 12 | Glucose-TOR signalling controls the expression of UPB1, RGF
and S-assimilation genes. Glucose activates genes for root growth factors (RGF) and S-
assimilation but inhibits the gene encoding UPBEAT (UPB1) transcription factor in WT but not
in the tor mutant. RGF6, At4g16515; RGF9, At5g64770; APS1 (At3g22890), ATP sulfurylase1;
APK2 (At4g39940), APS kinase 2; APR1 (At4g04610), Adenosine-5’-phosphosulfate reductase1;
APR2, At1g62180; APR3, At4g21990. Results are means from ATH1 GeneChip analyses. Error
bars are s.d. (n=3). Unpaired Student's t test was used to identify significant differences
(*P<0.05) when compared with the data from WT samples treated with glucose.

W W W. N A T U R E . C O M / N A T U R E | 1 3
SUPPLEMENTARY INFORMATION RESEARCHXiong et al. S13
Supplementary Figure 13 | Glucose-TOR signalling activates transcript levels of glycolysis and TCA cycle genes. Simplified schemes for the sucrose and starch metabolism pathways based on Mapman1. Genes with elevated transcript levels in glucose-TOR signalling are highlighted by red letters (see Supplementary Table 1, 5 for details). Sucrose and starch are hydrolysed to glucose. Pyruvate is generated via glycolysis and converted to acetyl-CoA to enter the TCA (tricarboxylic acid) cycle in the mitochondria. UGP1 (At3g03250), UDP-glucose pyrophosphorylase1; PGM3 (At1g23190), phosphoglucomutase3; PFK, phosphofructokinase; GAPC1 (At3g04120), glyceraldehydes-3-phosphate dehydrogenase C; PGK (At1g79550), phosphoglycerate kinase; IPGAM1 (At1g09780), 2,3- biphosphoglycerate-independent phosphoglycerate mutase 1; IPGAM2 (At3g08590), 2,3- biphosphoglycerate-independent phosphoglycerate mutase 2; ENO1 (At1g74030), enolase 1; ENO2 (At2g36530), enolase 2; ENOC (At2g29560), enoloase C; ACO2 (At4g26970), aconitase 3; ACO3 (At2g05710), aconitase 3; IDH1 (At4g35260), isocitrate dehydrogenase 1; SDH1-1 (At5g66760), succinate dehydrogenase 1-1; SDH4 (At2g46505), succinate dehydrogenase 4; FUM1 (At2g47510), fumarase 1; mMDH1 (At1g53240), mitochondrial malate dehydrogenase 1, mMDH2 (At3g15020), mitochondrial malate dehydrogenase 2.

SUPPLEMENTARY INFORMATION
1 4 | W W W. N A T U R E . C O M / N A T U R E
RESEARCHXiong et al. S14
Supplementary Figure 14 | Glucose-TOR signalling activates transcript levels of genes involved in glucosinolate synthesis and S-assimilation. Simplified diagrams of the glucosinolate synthetic pathway and S-assimilation pathway, which provide the co-substrates glutathione and PAPS (3’-phosphoadenosine-5’-phosphosulfate), are shown. Genes with elevated transcript levels in glucose-TOR signalling are highlighted by red letters (see Supplementary Table 1, 5 for details). MYB34 (At5g60890), MYB34 transcription factor; MYB28 (At5g61420); SUR1 (At2g20610), superroot1; CYP79B2 (At4g39950), cytochrome P450 79B2; CYP83B1 (At4g31500), cytochrome P450 83B1; UGT74B1 (At1g24100), UDP-glucosyltransferase 74B1; SOT16 (At1g74100), sulfotransferase 16; SOT17 (At1g18590), sulfotransferase 17; SOT18 (At1g74090), sulfotransferase 18; BCAT4 (At3g19710), branched-chain aminotransferase 4; BAT5 (At4g12030), bile acid transporter 5; MAM3 (At5g23020), methythioalkymalate synthase-like 3; IPMI1 (At3g58990), isopropylmalate isomerase 1; IPMI2 (At2g43100), isopropylmalate isomerase 2; IPMDH1 (At1g31180), isopropylmalate dehydrogenase 1; BCAT3 (At3g49680), branched-chain aminotransferase 3; APS1 (At3g22890), ATP sulfurylase 1; APS3 (At4g14680), ATP sulfurylase 3; APK1 (At2g14750), APS kinase 1; APK2 (At4g39940), APS kinase 2; APR1 (At4g04610), APS reductase 1, APR2 (At1g62180), APS reductase 2; APR3 (At4g21990), APS reductase 3; SIR (At5g04590), sulfite reductase. The genes controlled by MYB34 or MYB28 are indicated by green arrows.

W W W. N A T U R E . C O M / N A T U R E | 1 5
SUPPLEMENTARY INFORMATION RESEARCHXiong et al. S15
Supplementary Figure 15 | Glucose-TOR signalling activates the transcript levels of
essential genes for lignin and flavonoid synthesis. Simplified schemes for monolignol and
flavonoid synthetic pathways are based on Mapman1. Genes with elevated transcript levels in
glucose-TOR signalling are highlighted by red letters (see Supplementary Table 1, 5 for details).
PAL1 (At2g37040), phenylalanine ammonia lyase 1; PAL3 (At5g04230), phenylalanine ammonia
lyase 3; 4CL1 (At1g51680), 4-coumarate-CoA ligase 1; 4CL2 (At3g21240), 4-coumarate-CoA
ligase 2; 4CL3 (At1g65060), 4-coumarate-CoA ligase 3; 4CL5 (At3g21230), 4-coumarate-CoA
ligase 5; HCT (At5g48930), quinate-hydroxycinnamoyl transferase; CCoAOMT1 (At4g34050),
caffeoyl coenzyme A O-methyltransferase 1; CCR1 (At1g15950), cinnamoyl CoA reductase 1;
CAD5 (At4g34230), cinnamyl alcohol dehydrogenase 5; CAD9 (At4g39330), cinnamyl alcohol
dehydrogenase 9; OMT1 (At5g54160), O-methyltransferase 1; FAH1 (At4g36220), ferulic acid 5-
hydroxylase 1; TT4 (At5g13930), chalcone synthase; TT5 (At3g55120), chalcone isomerase; TT6
(At3g51240), flavanone 3-hydroxylase; FLS1 (At5g08640), flavonol synthase 1; UGT78D1
(At1g30530), UDP-glucosyl transferase 78D1.

SUPPLEMENTARY INFORMATION
1 6 | W W W. N A T U R E . C O M / N A T U R E
RESEARCH Xiong et al. S16
Supplementary Figure 16 | Bio-computational strategies for defining putative E2Fa target
genes. E2Fa co-expression genes were generated by Genevestigator. E2Fa-binding motif
containing genes were identified as described2. E2Fa up-regulated genes were identified from
seedlings that ectopically express E2Fa and DPa transcription factors driven either by the 35S
constitutive promoter2,3 or the DEX-inducible promoter4. The genes presented in all of these
three categories were defined by Venn diagram5, and used for comparison with glucose-TOR-
activated genes (Fig. 4f). See supplementary Table 7 for complete gene sets.

W W W. N A T U R E . C O M / N A T U R E | 1 7
SUPPLEMENTARY INFORMATION RESEARCHXiong et al. S17
Supplementary Figure 17 | Activation of S-phase genes by glucose is independent of the
HXK1-mediated signalling pathway. Ler and gin2 seedlings (3DAG) were treated with
glucose (15 mM) for 2 h. Total RNA was isolated and quantitative RT-PCR was performed to
analyse S-phase genes activation. Values represent means; error bars indicate s.d. (n=3).

SUPPLEMENTARY INFORMATION
1 8 | W W W. N A T U R E . C O M / N A T U R E
RESEARCHXiong et al. S18
Supplementary Figure 18 | Differential sugar effects on the activation of S-phase genes. WT
seedlings (3DAG) were treated with different sugars (15 mM) for 2 h. Total RNA was isolated
and quantitative RT-PCR was performed to analyse S-phase genes activation. Values represent
means; error bars indicate s.d. (n=3). Glucose (Glc), sucrose (Suc), fructose (Fru), xylose (Xyl)
and galactose (Gal) were examined. Gene activation was blocked by 2-DG (2-Deoxyglucose), a
glycolysis inhibitor.
W W W. N A T U R E . C O M / N A T U R E | 1 9
SUPPLEMENTARY INFORMATION RESEARCHXiong et al. S19
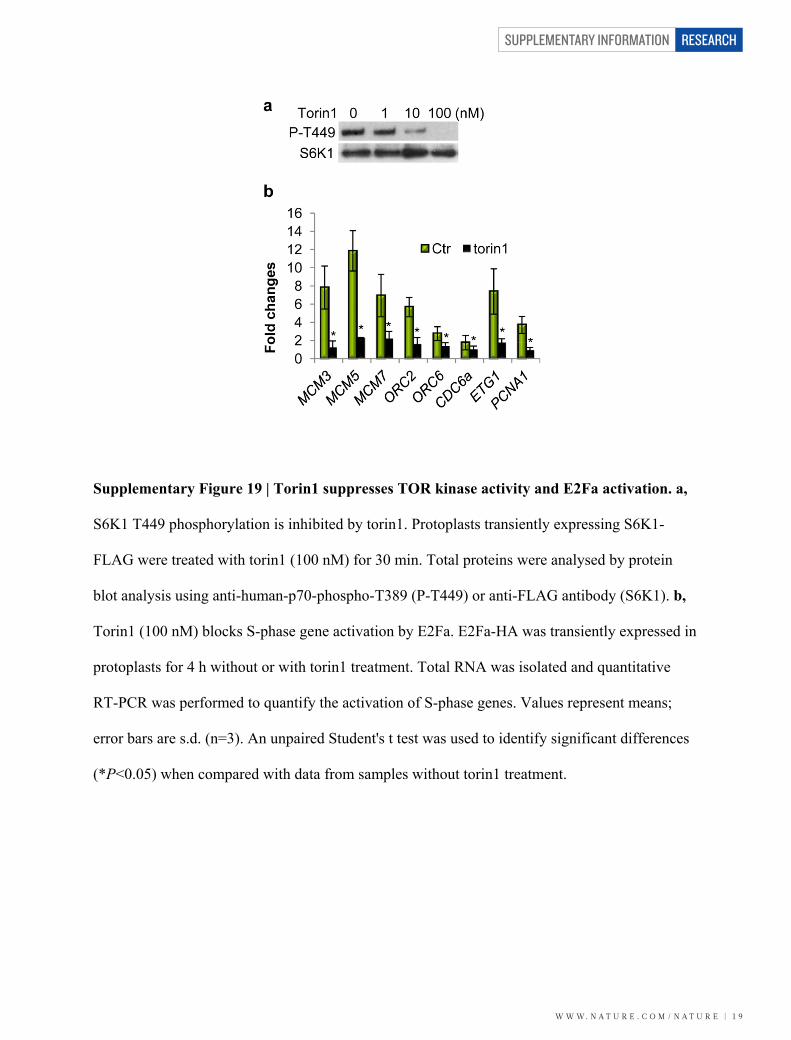
Supplementary Figure 19 | Torin1 suppresses TOR kinase activity and E2Fa activation. a,
S6K1 T449 phosphorylation is inhibited by torin1. Protoplasts transiently expressing S6K1-
FLAG were treated with torin1 (100 nM) for 30 min. Total proteins were analysed by protein
blot analysis using anti-human-p70-phospho-T389 (P-T449) or anti-FLAG antibody (S6K1). b,
Torin1 (100 nM) blocks S-phase gene activation by E2Fa. E2Fa-HA was transiently expressed in
protoplasts for 4 h without or with torin1 treatment. Total RNA was isolated and quantitative
RT-PCR was performed to quantify the activation of S-phase genes. Values represent means;
error bars are s.d. (n=3). An unpaired Student's t test was used to identify significant differences
(*P<0.05) when compared with data from samples without torin1 treatment.

SUPPLEMENTARY INFORMATION
2 0 | W W W. N A T U R E . C O M / N A T U R E
RESEARCH Xiong et al. S20
Supplementary Figure 20 | Putative TOR phosphorylation sites in E2Fa. a, The putative
TOR phosphorylation sites were located in the N-terminal 80 residues of E2Fa. The 16 amino
acids systematically tested by mutagenesis analyses (S or T to A) for TOR-dependent E2Fa
activity in target gene activation were marked in red. b, The mutation of all 16 Ser/Thr residues
(E2Fa (16A) significantly diminished E2Fa activity. E2Fa-HA or E2Fa (16A)-HA was
transiently expressed in protoplasts for 4 h. Total RNA was isolated and quantitative RT-PCR
was performed to quantify the activation of S-phase genes. Values represent means; error bars
are s.d. (n=3). Unpaired Student's t test was used to identify significant differences (*P<0.05)
when compared with the data from E2Fa samples.

W W W. N A T U R E . C O M / N A T U R E | 2 1
SUPPLEMENTARY INFORMATION RESEARCHXiong et al. S21
Supplementary Figure 21 | Molecular analyses of the e2fa mutant. a, T-DNA insertion in the E2Fa gene was in the 11th exon in the WiscDsLox434F1 mutant line. Total RNA was isolated from 7-day-old seedlings. The upstream (F1+R2) but not the full-length E2Fa (F1+R1) transcript was detected in e2fa by RT-PCR. b, The e2fa mutant sequence. Green letters indicate the DNA sequence derived from E2Fa, and red letters indicate the DNA sequence derived from the T-DNA insertion. The residue E323 is the last amino acid from E2Fa. c, The truncated e2fa protein cannot activate S-phase target genes. E2Fa-HA or e2fa-HA was transiently expressed in protoplasts for 4 h. Total RNA was isolated and quantitative RT-PCR was performed to analyse the activation of S-phase genes. Values represent means; error bars are s.d. (n=3).

SUPPLEMENTARY INFORMATION
2 2 | W W W. N A T U R E . C O M / N A T U R E
RESEARCHXiong et al. S22
Supplementary Figure 22 | E2Fa plays a key role in the glucose promotion of root meristem
activation and growth. a-b, Quantitative measurement of the root meristem cell number and
root length in WT and e2fa seedlings. Seedlings at 3DAG were treated with 15 mM glucose
(Glc) for 24 h. Values represent means; error bars are s.d. (n≥30). Unpaired Student's t test was
used to identify significant differences (*P<0.05) when compared with the data from WT
samples treated with glucose. c-d, Predominant expression of E2Fa in root meristems. Total
RNA was isolated from root meristem tissues or leaf protoplasts. Quantitative RT-PCR was
performed to analyse the relative expression level of E2Fa, E2Fb and TUB4. Comparable primer
efficiency for E2Fa and E2Fb was confirmed by quantitative PCR using 0.01 pg plasmid DNA
as templates. Values represent means; error bars are s.d. (n=3).

W W W. N A T U R E . C O M / N A T U R E | 2 3
SUPPLEMENTARY INFORMATION RESEARCHXiong et al. S23
SUPPLEMENTARY TABLES
Supplementary Table 1 | Glucose-TOR target genes. The data in Supplementary Table 1
include both up-regulated (P value < 0.01; signal log2 ratio ≥1) and down-regulated (P value <
0.01; signal log2 ratio ≤ -1) glucose-TOR target genes, which are visualized in Fig. 4a, c and
available as a Microsoft Excel file. Functional classification is based on Mapman1. Some genes
appear in multiple classes.
Supplementary Table 2 | Novel glucose regulated genes. These genes are specifically defined
in our experimental conditions, but not in prior studies using seedlings treated with glucose or
sucrose, or 5-week-old leaves at low CO2 conditions6-8. The data in Supplementary Table 2 is
highlighted in Fig. 4a-d and available as a Microsoft Excel file. Functional classification is based
on Mapman1.

SUPPLEMENTARY INFORMATION
2 4 | W W W. N A T U R E . C O M / N A T U R E
RESEARCHXiong et al. S24
Functional categories Gene count Fold enrichment P-value Protein synthesis 109 1.5 1.1E-06
Cell cycle and DNA synthesis 105 1.5 5.3E-06 Protein folding 78 1.7 3.9E-06
Cell wall 60 2.2 4.4E-09 RNA synthesis 38 1.9 4.0E-05
Amino acid metabolism 31 2.4 4.0E-06 Nucleotide synthesis 29 3.2 1.8E-08
TCA and ETC 26 1.9 1.2E-03 Redox 19 1.7 7.0E-03
Glucosinolate synthesis 17 5.4 4.3E-09 Lignin synthesis 11 5.3 3.1E-06
Glycolysis 9 2.5 6.7E-03 S-assimilation 6 8.0 4.2E-05
Supplementary Table 3 | Over-represented functional categories up-regulated by glucose-
TOR signalling. The genes were functionally classified using Mapman1. The enriched/over-
represented fold changed is calculated as follows: (Number of Classifiedinput_set/ Number of
totalinput_set)/ (Number of Classifiedreference_set/ Number of totalreference_set). The P-value is calculated
in Excel using a hypergeometric distribution test.

W W W. N A T U R E . C O M / N A T U R E | 2 5
SUPPLEMENTARY INFORMATION RESEARCH
Xiong et al. S25
Functional categories Gene count Fold enrichment P-value Protein degradation 96 1.3 2.2E-03
Development 44 1.5 3.3E-03 Lipid degradation 29 1.7 2.2E-03
Amino acid degradation 27 2.6 3.6E-06 CHO metabolism 25 2.5 1.8E-05
Redox 19 2.2 7.6E-04 Autophagy 7 7.6 1.8E-05
Biodegradation of Xenobiotics 5 4.0 5.8E-03 Glyoxylate cycle 4 8.7 7.1E-04
Supplementary Table 4 | Over-represented functional categories down-regulated by
glucose-TOR signalling. Genes were functionally classified using Mapman1. The enriched/over-
represented fold changed was calculated as follows: (Number of Classifiedinput_set/ Number of
totalinput_set)/ (Number of Classifiedreference_set/ Number of totalreference_set). The P-value was
calculated in Excel using a hypergeometric distribution test.

SUPPLEMENTARY INFORMATION
2 6 | W W W. N A T U R E . C O M / N A T U R E
RESEARCHXiong et al. S26
Supplementary Table 5 | Glucose-TOR target gene list (P value <0.01). The data in
Supplementary Table 5 include both up- and down-regulated glucose-TOR target genes (P value
< 0.01), which was used for hierarchical clustering analysis with cell cycle related genes9 (Fig.
4e) and putative E2Fa target genes (Fig. 4f), and available as a Microsoft Excel file.
Supplementary Table 6 | Glucose-TOR target genes involved in cell cycle. The data in
Supplementary Table 6 include glucose-TOR target genes (P value < 0.01) and the putative G1-,
S-, G2- and M-phase genes9. The overlaps between glucose-TOR target genes and cell cycle
genes are indicated with signal ratio > or < 0, presented in Fig. 4e, and available as a Microsoft
Excel file.
Supplementary Table 7 | Putative E2Fa target genes. The 84 putative E2Fa target genes are
defined by stringent overlap (Venn diagram in Supplementary Fig. 12) among E2Fa co-
expression genes generated by Genevestigator (www.genevestigator.com), genes possessing
putative E2Fa-binding motifs in the promoter regions2, and genes up-regulated by E2Fa
identified from seedlings that ectopically express E2Fa and DPa transcripiton factors driven
either by the 35S constitutive promoter2,3 or the DEX-inducible promotor4. The 84 putative E2Fa
target genes were used for comparison with glucose-TOR target genes (Fig. 4f), and are available
as a Microsoft Excel file. Genes used for qRT-PCR verification are highlighted.

W W W. N A T U R E . C O M / N A T U R E | 2 7
SUPPLEMENTARY INFORMATION RESEARCHXiong et al. S27
Supplementary Table 8 | Primers used for qRT-PCR. F: forward; R: reverse
Name AGI Number Primers
E2FA At2g36010 AGGCCAAAGGAAACAAGTCAACTCC
TGCAGCTTTGTTTAGGTCCAGCATT
E2FB At5g22220 GAGGAAAGCACCGAAAGAAACATGG
TGACTTCGCCTACCTCTGATCGAA
TUB4 At5g44340 F: AGGGAAACGAAGACAGCAAG
R: GCTCGCTAATCCTACCTTTGG
EIF4E At3g13920 F: TCATAGATCTGGTCCTTGAAACC
R: GGCAGTCTCTTCGTGCTGAC
IAA1 At4g14560
F: CACAGAGCTTCGTTTGGGATTACCC
R: GCCATCCAACGATTTGTGTTTTTGC
IAA29 At4g32280 F: GGGAAAGAGGGTGACTGGCTACTTC
R: TGGTCCGATTTGAACGCCTATCCTT
SAUR62 At1g29430 F: ACAAAGAGCAGCCCTCAAGA
R: ACGGATCTTATCAGCCGTGT
ARR4 At1g10470 F: TTAGCCGTTGATGACAGTCTCGTTG
R: CAGAGCACGCCATCCACTATCTACC
ARR7 At1g19050 F: CCGGTGGAGATTTGACTGTT
R: ACTGCAAAGCCCTAGTTCCA
ARR16 At2g40670 F: TGCCTGGAATGACAGGTTTT
R: TGAGCTCCACTCGCTAAACA
MCM3 At5g46280 F: CTTCGCCACAAGCGAGATTTTATCC
R: TGGCTGCGTCACAAAATGACTG

SUPPLEMENTARY INFORMATION
2 8 | W W W. N A T U R E . C O M / N A T U R E
RESEARCHXiong et al. S28
MCM5 At2g07690 F: CAATTCGCCAGCCTTATATCCGAGT
R: GGAGCGATCTTGGTGCAAATGTTC
MCM7 At4g02060 F: GCCGACGCTAATGGCAGATCTAA
R: GCGGCGGAGAAAATTGAAACATATC
ORC2 At2g37560 F: TGGGTGGGGCGAGTAAGCGT
R: AGGCCAAAGCCACACCTGAGC
ORC6 At1g26840 F: CGCCGCCACTAGGTTGCAGATTA
R: ACAGCCAAATTGAACCGCCAATTC
CDC6 At2g29680 F: ATGCCTGCAATCGCCGGACC
R: GGCAACACCACCGTCGCTGA
ETG1 At2g40550 F: CCCACGCCTCCATTGTCTTATCC
R: GAACTGTGCGGCAATGTGATCATTC
PCNA1 At1g07370 F: CCTGATGCTGAGTACCACTCAATCG
R: TGAGCACAATGTTAGCGGTTCCA
Supplementary Table 9 | Primers used for the E2Fa and RPS6 constructs. F: forward; R: reverse. Name Primer sequence
E2Fa-F1 CGGGATCCATGTCCGGTGTCGTACGATC
E2Fa-R1 AAGGCCTTCTCGGGGTTGAGTCAACA
E2Fa-R2 TGCAGCTTTGTTTAGGTCCAGCATT
E2Fa-Δ1-R AAGGCCTTCCTCCTACTTGCTCTTGCAA
E2Fa-Δ2-F CGGGATCCATGCCATCAGGAAGTTGTCGTTATG

W W W. N A T U R E . C O M / N A T U R E | 2 9
SUPPLEMENTARY INFORMATION RESEARCHXiong et al. S29
E2Fa-Δ4-F CGGGATCCATGGATCGGGAGGAAGATGCTG
RPS6-F CATGCCATGGGAAAAGAGGATGATGTGAGGA
RPS6-R AAGGCCTAGCAGCAACGGGTTTAGC
Supplementary Table 10 | Primers used E2Fa mutagenesis analyses F: forward; R: reverse
Name Primers
E2Fa(7, 8AA) F: CGGTGTCGTACGAGCTGCTCCCGGTTCTTCTC
R:GAGAAGAACCGGGAGCAGCTCGTACGACACCG
E2Fa(11, 12AA) F: ATCTTCTCCCGGTGCTGCTCAGCCGCCACCGC
R: GCGGTGGCGGCTGAGCAGCACCGGGAGAAGAT
E2Fa(24, 25AA) F: CACCATCCACCGGCAGCTCCGGTTCCGGTTA
R:TAACCGGAACCGGAGCTGCCGGTGGATGGTGC
E2Fa(30, 31, 32AA) F: TCCGGTTCCGGTTGCAGCTGCGCCGGTTATAC
R: GTATAACCGGCGCAGCTGCAACCGGAACCGGA
E2Fa(46, 47AA) F: CTTAGCTTTCGCCGCAGCAAAACCTCCGTTTC
R: AAACGGAGGTTTTGCTGCGGCGAAAGCTAAG
E2Fa(54A) F: TCCGTTTCATCCTGCCGATGATTACCATC
R: GATGGTAATCATCGGCAGGATGAAACGGA
E2Fa(63, 64, 66AAA) F: ATTTAACCCTGCTGCGCTCGCTAATAATA
R: TATTATTAGCGAGCGCAGCAGGGTTAAAT
E2Fa(72A) F: TAATAACGACAGGGCCTTCGTTCATGGTT
R: AACCATGAACGAAGGCCCTGTCGTTATTA

SUPPLEMENTARY INFORMATION
3 0 | W W W. N A T U R E . C O M / N A T U R E
RESEARCH
Xiong et al. S30
Supplementary Table 11 | Primers used for ChIP-qPCR assays. F: forward; R: reverse; P: promoter; G: gene body Name Primer sequence
CAB1-G-F TCCCTGAGCTTTTGGCTAGA
CAB1-G-R AACGGCTCCCATCAAAATAA
MCM5-P-F AGAAAGAAAGACCCAATAACCAAC
MCM5-P-R TCTAAACGAAGAGAGAGAGTGGG
MCM5-G-F CTACAGGAGAATCCGGAGGT
MCM5-G-R ACGAAGCTTGGAAAATGCTG
ETG1-P-F GTTGGAAGTTGGAGAATGGG
ETG1-P-R CGAATTAAGGGCAATGTCAA
ETG1-G-F AAAACAGGGAAAAGCGTGTG
ETG1-G-R CCATTACGCCCAGCTTCTAA

W W W. N A T U R E . C O M / N A T U R E | 3 1
SUPPLEMENTARY INFORMATION RESEARCHXiong et al. S31
SUPPLEMENTARY METHODS
Antibodies and protein blot analysis. Phospho-p70 S6 Kinase (p-Thr389) polyclonal antibody
(Cell Signalling) was used to detect TOR kinase phosphorylation of p-T449 in Arabidopsis S6K1.
HA- or FLAG-tagged proteins were detected by anti-HA (Roche) or anti-FLAG (Sigma)
monoclonal antibodies using standard techniques. Polyclonal Arabidopsis TOR antibody was
generated as described10.
Plasmid constructs. The construct of S6K1-FLAG for protoplast transient expression has been
previously described10. The construct of 4E-BP1-6HIS was from Addgene. For constructs of
E2fa (At2g36010) and its truncated variants (Δ1, amino acids 1-420; Δ2, amino acids 162-420;
Δ3, amino acids 162-485; Δ4, amino acids 81-420; e2fa, amino acids 1-323) or RPS6B (amino
acids 150-249), the coding regions were amplified from Arabidopsis Col-0 complementary DNA,
then fused to the HA tag and cloned between the 35S-drived promoter and NOS terminator11,12
for protoplast transient expression, or fused to the 6HIS tag in the pet14b plasmid (Addgene) for
E. coli expression and purification as in vitro TOR kinase or S6K1 kinase substrates. All primers
used are listed in Supplementary Table 9. The E2Fa (16A) mutant were generated by PCR-based
site-specific mutagenesis10 and primers used are listed in Supplementary Table 10.
E2Fa-6HIS, 4E-BP1-6HIS and RPS6B-6HIS protein expression and purification.
Transfected E. coli cells in 500 ml LB medium with ampicillin (100 µg/ml) were grown at 37°C
until A600 = 0.7. The cell culture was then cooled to 18°C before IPTG was added to a final
concentration of 0.3 mM, and cells were incubated for an additional 12 h at 18°C to induce the
expression of 6HIS tagged protein. Cells were harvested by centrifugation at 4,000xg for 20 min

SUPPLEMENTARY INFORMATION
3 2 | W W W. N A T U R E . C O M / N A T U R E
RESEARCHXiong et al. S32
and stored at -80°C. The 6HIS tagged protein was purified using Ni-NTA agarose (Qiagen)
under native condition according to the manufacturer’s instructions. Briefly, using the
Qproteome Bacterial Protein Prep Kit (Qiagen) with 1X cocktail inhibitors, cells were lysed and
then incubated for 30 min on ice. The lysed solution was centrifuged at 10,000xg for 30 min and
the supernatant was incubated with 100 µl Ni-NTA agarose for 2 h at 4oC. The Ni-NTA agarose
was washed 3 times with washing buffer (50 mM NaH2PO4, pH 8.0, 300 mM NaCl, 40 mM
imidazole), and the 6HIS fusion protein was eluted with 3 ml elution buffer (50 mM NaH2PO4,
pH 8.0, 300 mM NaCl, 250 mM imidazole) and concentrated by Amicon Ultra filter (Millpore).
In vitro TOR protein kinase assays. For in vitro TOR kinase assays, seedlings were lysed in
500 µl immunoprecipitation (IP) buffer (400 mM HEPES, pH 7.4, 2 mM EDTA, 10 mM
pyrophosphate, 10 mM glycerol phosphate, 0.3% CHAPS and 1X cocktail inhibitors [Roche]).
To immunoprecipitate endogenous TOR, protein extracts were incubated with anti-TOR
antibody at 4oC for 2 h, and additional 1 h after adding 15 µl protein G sepharose beads (GE
healthcare). The immunoprecipitated TOR kinase was washed twice with low salt wash buffer
(400 mM HEPES, pH 7.4, 150 mM NaCl, 2 mM EDTA, 10 mM pyrophosphate, 10 mM glycerol
phosphate, 0.3% CHAPS) and once with kinase wash buffer (25 mM HEPES, pH 7.4, 20 mM
KCl). Kinase reaction was performed for 30 min in 30 µl kinase buffer (25 mM HEPES, pH 7.4,
50 mM KCl, 10 mM MgCl2, 10 μM cold ATP, 2 μCi [γ-32P] ATP and 1 μg E2Fa-6HIS or 4E-
BP1-6HIS substrates without/with torin1 (1μM) or staurosporine (1μM) at 25oC. The reaction was
stopped by adding SDS-PAGE loading buffer. After separation on 10% SDS-PAGE and
subsequent gel drying, radiolabelled E2Fa-6HIS or 4E-BP1-6HIS was detected on the dried gel
by the Typhoon imaging system (GE Healthcare).

W W W. N A T U R E . C O M / N A T U R E | 3 3
SUPPLEMENTARY INFORMATION RESEARCHXiong et al. S33
In vitro S6K1 protein kinase assays. In vitro S6K1 kinase assay was performed as described13.
Protoplasts (105) were transfected with 50 µg S6K1-HA and incubated for 6 h in 5 ml of
mannitol (0.5 M) and KCl (20 mM) buffer (4 mM MES, pH 5.7) in Petri dish (100 mm x 20 mm).
The collected protoplasts were lysed in 500 µl immunoprecipitation (IP) buffer (50 mM Tris-HCl,
pH 7.5, 150 mM NaCl, 5 mM EDTA, 1% Triton X-100, 1 mM DTT, 1 mM NaVO3, 5 mM NaF
and 1X cocktail inhibitors [Roche]). To immunoprecipitate S6K1-HA, protein extracts were
incubated with anti-HA antibody at 4oC for 2 h, and additional 1 h after adding 15 µl protein G
sepharose beads (GE healthcare). The immunoprecipitated S6K1 kinase was washed 3 times
with IP buffer. Kinase reaction was performed for 30 min in 30 µl kinase buffer (20 mM HEPES,
pH 7.4, 125 mM NaCl, 10 mM MgCl2, 5 mM MnCl2, 10 μM cold ATP, 2 μCi [γ-32P] ATP and
1μg RPS6B-6HIS substrates without/with torin1 (1μM) or staurosporine (1μM) at 25oC. The
reaction was stopped by adding SDS-PAGE loading buffer. After separation on 10% SDS-PAGE
and subsequent gel drying, radiolabelled S6K1-6HIS was detected on the dried gel by the
Typhoon imaging system (GE Healthcare).
Co-immunoprecipitation (Co-IP) for the E2Fa-TOR interaction assay. Protoplasts (5 X 10⁵)
were transformed with 25 µg E2Fa-FLAG and incubated in 5 ml of mannitol (0.5 M) and KCl
(20 mM) buffer (4 mM MES, pH 5.7) in Petri dishes (100 mm x 20 mm, 105 cells/each) for 4
hours. Collected protoplasts were lysed in 500 µl Co-IP buffer (400 mM HEPES pH 7.4, 2 mM
EDTA, 10 mM pyrophosphate, 10 mM glycerol phosphate, 0.3% CHAPS and 1X cocktail
inhibitors [Roche]). To immunoprecipitate TOR, protein extracts were incubated without/with
anti-Flag antibody at 4oC for 2 h, and additional 2 h after adding 15 µl protein G sepharose beads

SUPPLEMENTARY INFORMATION
3 4 | W W W. N A T U R E . C O M / N A T U R E
RESEARCHXiong et al. S34
(GE healthcare). The immunoprecipitated proteins were washed four times with low salt wash
buffer (400 mM HEPES pH 7.4, 150 mM NaCl, 2 mM EDTA, 10 mM pyrophosphate, 10 mM
glycerol phosphate, 0.3% CHAPS) before SDS-PAGE separation and protein blot analyses.
Chromatin immunoprecipitation (ChIP) assays. Protoplasts (5 X 10⁵) were transformed with
25 µg E2Fa-HA or E2Fa-Δ4-HA construct and incubated in 5 ml of mannitol (0.5 M) and KCl
(20 mM) buffer (4 mM MES, pH 5.7) in Petri dishes (100 mm x 20 mm, 105 cells/each) for 4 h.
For experiments analysing the effect of rapamycin, and torin1, protoplasts were pretreated with
rapamycin (1 µM), or torin1 (100 nM) for 1 h before E2Fa transfection. Cells were then
crosslinked by 1% formaldehyde for 20 min and quenched by glycine (0.2 M) for 5 min. Nuclei
were extracted freshly as described previously14 and the rest of ChIP steps was then performed
essentially as described in the Pikaard lab protocol
(http://sites.bio.indiana.edu/~pikaardlab/Protocols%20page.html) with some modifications.
Bioruptor (Diagenode) was used for chromatin sonication. DNA was eluted by 1% SDS and 0.1
M NaHCO3 at 65 oC for overnight. Anti-HA antibody (Roche) was used in this study. All the
qPCR primers showed similar efficiency tested with the input DNA as controls. The final
relative enrichment fold changes were calculated by normalizing % input of each primer pair
against the control gene (CAB1), which is not an E2Fa target gene. Values are mean with error
bars derived from two independent biological replicates. All primers used are listed in
Supplementary Table 11.
Microarray analysis. Three-day-old quiescent WT and tor seedlings were treated without or
with glucose (15 mM) for 2 h. Total RNA was extracted using RNeasy Plant Mini kit (Qiagen)

W W W. N A T U R E . C O M / N A T U R E | 3 5
SUPPLEMENTARY INFORMATION RESEARCHXiong et al. S35
according to the manufacturer’s protocol. Total RNA (4 µg) was converted to cDNA, and
amplified and biotinylated using the BioArray Highyield RNA transcript labeling kit (Enzo)
according to the manufacturer’s instructions. The cRNAs were fragmented in fragmentation
buffer (40 mM Tris-Acetate, pH 8.1, 100 mM KOAc, 30 mM MgOAc), 94 oC for 35 minutes.
Hybridization to Arabidopsis ATH1 GeneChip arrays (Affymetrix) and scanning were conducted
by the Advanced Genomics and Genetics Core microarray facility of Joslin Diabetes Centre.
Quality assessment. Before analysing for expression differences, the quality of raw arrays were
assessed with the aid of the BioConductor packages arrayQualityMetrics15, simpleaffy16,
affyPLM17, and Harshlight18. Harshlight was used to assess for possible physical defects of the
arrays and/or hybridization problems. The other BioConductor packages provide an array of
metrics, which were used in making a judgment of the quality of the microarray chips.
Expression analysis. Expression analysis was performed using both RMA19,20 and dChip21 in
FlexArray 1.6.122. Affymetrix CEL files were imported into FlexArray, and both dChip (subtract
MM from PM) and RMA (correct background and normalize) analyses were performed. Each
analysis was followed by cyber-T (window size 101, Confidence ratio of 10) to statistically test
for differences in expression. Results from both the dChip and RMA analysis were exported out
of FlexArray and into Excel. In Excel, the RMA and dChip analysis were separately filtered in
two or three steps depending on the analysis. The first step eliminated genes with a p-value of
less than 0.01 and was done in all the analyses. The second step, not employed in generating
gene lists for comparison with cell cycle data and E2Fa target data (Fig. 4e and f; and
Supplementary Table 5), eliminated genes with a signal log ratio of between -0.99 and 0.99. A

SUPPLEMENTARY INFORMATION
3 6 | W W W. N A T U R E . C O M / N A T U R E
RESEARCHXiong et al. S36
final step, done in all analyses, eliminated genes not present in both the RMA and dChip analysis
after the first or both of the two above filters had been applied. The resulting gene list
(Supplementary Table 5) used for cell cycle comparison and E2Fa targeted gene comparison
contains genes with a p-value of 0.01 or less, and were present in both the RMA and dChip
analysis (Fig. 4e, f). The resulting gene list (Supplementary Table 1) used for comparison with
glucose, sucrose and low CO2 data (Fig. 4a, c) or for functional classification (Fig. 4b, d)
contains genes with a p-value of 0.01 or less, as well as a two-fold or more increase or decrease
in expression, and were present in both the RMA and dChip analysis.
Generation of glucose regulated gene list. The expression analysis described above was used to
analyse gene expression changes between untreated wild-type plants (wt-ctr) and glucose treated
wild-type plants (wt-glc), or untreated tor plants (tor-ctr) and glucose treated tor plants (tor-glc).
The set of genes resulting from this analyse was used for comparison with all public microarray
data. When the signal log ratio cutoff was used, this set of genes contained 2368 genes
(Supplementary Table 1). When the signal log ratio cutoff was not used, this set contained 4778
genes (Supplementary Table 5). Estradiol itself and the inducible system did not result in any
significant changes in gene expression in microarray analysis, which was confirmed using the
estradiol-inducible-GUS transgenic lines (Data not shown).
Analyses of public microarray data. Analyses of all publically available microarray data used
in Fig. 4 were accomplished as described above in the Expression Analysis section. The signal

W W W. N A T U R E . C O M / N A T U R E | 3 7
SUPPLEMENTARY INFORMATION RESEARCHXiong et al. S37
log2 ratio filter was used for Figure 4a and c, and Supplementary Table 1. The list of cell cycle
genes was taken from Supplementary Table 12 in Menges et al., 20039.
Clustering analyses. Gene lists resulting from microarray analyses were imported into Cluster
3.023 where hierarchical agglomerative clustering was performed. The results were visualized in
Java TreeView24. Figure 4a and c were generated using absolute correlation (uncentered) as the
distance metric with centroid linkage, and correlation (uncentered) was used as the distance
metric with single linkage to generate Figure 4e.
Functional classification. Functional classification of glucose-TOR regulated genes was carried
out by Mapman1 and BAR25 (http://bar.utoronto.ca). The results were sorted in Excel to draw the
pie charts for Fig. 4b and d. Specifically, the cell cycle & DNA synthesis category contains both
cell cycle, cell division, and DNA synthesis genes; the metabolism category contains genes
involved in primary and secondary metabolic pathways but not specifically classified in Fig. 4b
and d (See Supplementary Table1 for details).
E2Fa co-expression analysis. E2Fa co-expression analysis was carried out by Genevestigator
(www.genevestigator.com) using the perturbations option. The Pearson correlation coefficient
was used as a measure of similarity between gene expression patterns. The score is calculated on
log2-scaled expression data that is processed from the Genevestigator database.

SUPPLEMENTARY INFORMATION
3 8 | W W W. N A T U R E . C O M / N A T U R E
RESEARCHXiong et al. S38
Definition of putative E2Fa target genes. E2Fa co-expression genes were generated as
described above. E2Fa_binding_motif containing genes were identified by Naouar et al., 20092.
E2Fa up-regulated genes were identified from three microarray data sets using seedlings that
ectopically express E2Fa and DPa transcription factors driven either by the 35S constitutive
promoter2,3 or the DEX-inducible promoter4 (6 h treatment). The putative E2Fa target genes
presented in all of these three categories were selected and used for comparison with glucose-
TOR target genes (Fig. 4f). See Supplementary Table 7 for complete gene sets.
SUPPLEMENTARY REFERENCES
1. Thimm, O. et al. MAPMAN: a user-driven tool to display genomics data sets onto diagrams of
metabolic pathways and other biological processes. Plant J 37, 914-939 (2004).
2. Naouar, N. et al. Quantitative RNA expression analysis with Affymetrix Tiling 1.0R arrays
identifies new E2F target genes. Plant J 57, 184-194 (2009).
3. Vandepoele, K. et al. Genome-wide identification of potential plant E2F target genes. Plant
Physiol 139, 316-328 (2005).
4. de Jager, S. M. et al. Dissecting regulatory pathways of G1/S control in Arabidopsis: common
and distinct targets of CYCD3;1, E2Fa and E2Fc. Plant Mol Biol 71, 345-365 (2009).
5. Oliveros, J.C. VENNY. An interactive tool for comparing lists with Venn Diagrams (2007).
http://bioinfogp.cnb.csic.es/tools/venny/index.html.
6. Li, Y. et al. Establishing glucose- and ABA-regulated transcription networks in Arabidopsis
by microarray analysis and promoter classification using a Relevance Vector Machine. Genome
Res 16, 414-427 (2006).

W W W. N A T U R E . C O M / N A T U R E | 3 9
SUPPLEMENTARY INFORMATION RESEARCHXiong et al. S39
7. Blasing, O. E. et al. Sugars and circadian regulation make major contributions to the global
regulation of diurnal gene expression in Arabidopsis. Plant Cell 17, 3257-3281 (2005).
8. Gonzali, S. et al. Identification of sugar-modulated genes and evidence for in vivo sugar
sensing in Arabidopsis. J Plant Res 119, 115-123 (2006).
9. Menges, M., Hennig, L., Gruissem, W. & Murray, J. A. Genome-wide gene expression in an
Arabidopsis cell suspension. Plant Mol Biol 53, 423-442 (2003).
10. Xiong, Y. & Sheen, J. Rapamycin and glucose-target of rapamycin (TOR) protein signaling
in plants. J Biol Chem 287, 2836-2842 (2012).
11. Kovtun, Y., Chiu, W. L., Zeng, W. & Sheen, J. Suppression of auxin signal transduction by a
MAPK cascade in higher plants. Nature 395, 716-720 (1998).
12. Hwang, I. & Sheen, J. Two-component circuitry in Arabidopsis cytokinin signal transduction.
Nature 413, 383-389 (2001).
13. Mahfouz, M. M., Kim, S., Delauney, A. J. & Verma, D. P. Arabidopsis TARGET OF
RAPAMYCIN interacts with RAPTOR, which regulates the activity of S6 kinase in response to
osmotic stress signals. Plant Cell 18, 477-490 (2006).
14. Sheen, J. Protein phosphatase activity is required for light-inducible gene expression in maize.
EMBO J 12, 3497-3505 (1993).
15. Kauffmann, A., Gentleman, R. & Huber, W. arrayQualityMetrics--a bioconductor package
for quality assessment of microarray data. Bioinformatics 25, 415-416 (2009).
16. Wilson, C. L. & Miller, C. J. Simpleaffy: a BioConductor package for Affymetrix Quality
Control and data analysis. Bioinformatics 21, 3683-3685 (2005).
17. Jones, L. et al. Assessment of the relationship between pre-chip and post-chip quality
measures for Affymetrix GeneChip expression data. BMC Bioinformatics 7, 211 (2006).

SUPPLEMENTARY INFORMATION
4 0 | W W W. N A T U R E . C O M / N A T U R E
RESEARCHXiong et al. S40
18. Suarez-Farinas, M., Pellegrino, M., Wittkowski, K. M. & Magnasco, M. O. Harshlight: a
"corrective make-up" program for microarray chips. BMC Bioinformatics 6, 294 (2005).
19. Irizarry, R. A. et al. Summaries of Affymetrix GeneChip probe level data. Nucleic Acids Res
31, e15 (2003).
20. Irizarry, R. A. et al. Exploration, normalization, and summaries of high density
oligonucleotide array probe level data. Biostatistics 4, 249-264 (2003).
21. Li, C. & Hung Wong, W. Model-based analysis of oligonucleotide arrays: model validation,
design issues and standard error application. Genome Biol 2, (2001).
22. Michal Blazejczyk, M. M., Robert Nadon FlexArray: A statistical data analysis software for
gene expression microarrays. Genome Quebec (2007).
23. de Hoon, M. J., Imoto, S., Nolan, J. & Miyano, S. Open source clustering software.
Bioinformatics 20, 1453-1454 (2004).
24. Saldanha, A. J. Java Treeview--extensible visualization of microarray data. Bioinformatics 20,
3246-3248 (2004).
25. Toufighi, K., Brady, S. M., Austin, R., Ly, E. & Provart, N. J. The Botany Array Resource:
e-Northerns, Expression Angling, and promoter analyses. Plant J 43, 153-163 (2005).