Embed Size (px)
Citation preview
1
Supplementary information to “Optimized mixed ionic-electronic conductivity in two-phase
ceria - zirconia composite with cobalt oxide and Na2CO3 as suitable additives” by Aditya Maheshwari
and Hans-Dieter Wiemhöfer
1. Densities of the samples
The experimental densities for pure 3TDC and 8YSZ were evaluated as described in the experimental
section of the main text (cf. Tab S1a). For estimating the net composite densities from those of the
constituent phases, the density values for carbonates and cobalt oxide were taken from the literature
neglecting changes after treatment of the composite. In case of the main constituents 3TDC and 8YSZ, we
used the experimental densities ρexp as determined for the starting materials. The following formula was used
to calculate the net composite density from the weight fractions and densities given in Tables S1a and S1b:
ρ = (w1 + w2 +…) / (V1 + V2 + …) = (w1 + w2 + …) / (w1/ρ1 + w2/ρ2 +…)
Table S1a
Starting materials Abbreviation
ρth ρexp % ρth
composition (g/cm3) (g/cm3)
Ce0.97Ta0.03O2-δ 3TDC 7.30 6.96 95%
Zr0.92Y0.08O2-δ 8YSZ 6.13 5.84 95%
CoO 1) Co 6.44
Na2CO3 1) NC 2.54
SrCO3 1) SC 3.50
BaCO3 1) BC 4.28
1) CRC Handbook of Chemistry and Physics, CRC Press LLC. 2006
TABLE S1b
Sample Abbreviation
ρth 2) w(3TDC) w(8YSZ) w(CoO) w(Na2CO3) w(SrCO3) w(BaCO3) ρexp % ρth
(g/cm3) composition (expressed as weight fractions) (g/cm3)
CZC11 6.35 0.50 0.50 0 0 0 0 6.04 95%
CZC12 6.17 0.33 0.67 0 0 0 0 5.67 92%
CZC12Co 6.18 0.33 0.66 0.016 0 0 0 6.15 100%
CZC12NC 4.80 0.27 0.53 0 0.2 0 0 5.22 109%
CZC12SC 5.35 0.27 0.53 0 0 0.2 0 5.17 97%
CZC12BC 5.67 0.27 0.53 0 0 0 0.2 5.31 94%
CZC12CoNC 4.82 0.26 0.52 0.016 0.2 0 0 4.97 103%
CZC12CoNC8:1 5.34 0.29 0.58 0.016 0.1 0 0 5.2 97%
CZC12CoNC6:1 5.14 0.28 0.56 0.016 0.1 0 0 5.09 99%
4.50 3) 88%
CZC12Co1.5NC6:1 5.35 0.29 0.58 0.022 0.1 0 0 5.28 99%
4.58 3) 86% 2) calculated using exp for pure 3TDC and 8YSZ, 3) sintered at 900 °C for 20 h (causing lower experimental densities).
Electronic Supplementary Material (ESI) for Journal of Materials Chemistry A.This journal is © The Royal Society of Chemistry 2016
2
2. Ta5+ doped zirconia (TDZ)
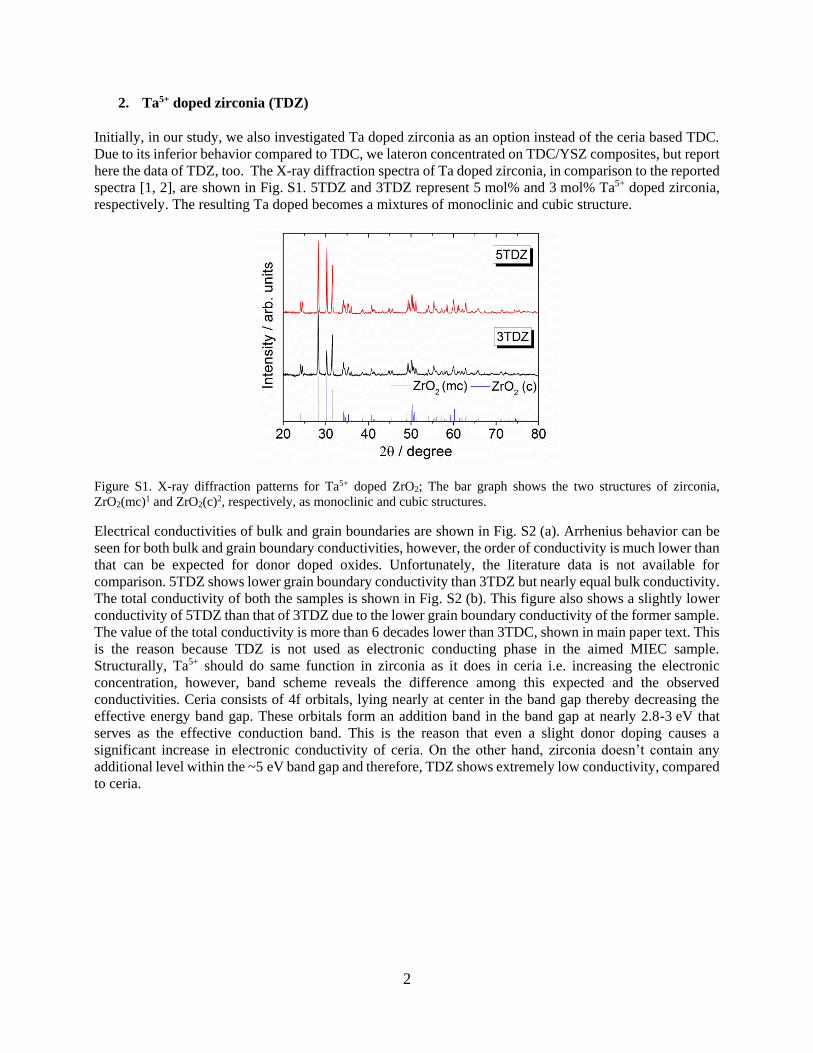
Initially, in our study, we also investigated Ta doped zirconia as an option instead of the ceria based TDC.
Due to its inferior behavior compared to TDC, we lateron concentrated on TDC/YSZ composites, but report
here the data of TDZ, too. The X-ray diffraction spectra of Ta doped zirconia, in comparison to the reported
spectra [1, 2], are shown in Fig. S1. 5TDZ and 3TDZ represent 5 mol% and 3 mol% Ta5+ doped zirconia,
respectively. The resulting Ta doped becomes a mixtures of monoclinic and cubic structure.
Figure S1. X-ray diffraction patterns for Ta5+ doped ZrO2; The bar graph shows the two structures of zirconia,
ZrO2(mc)1 and ZrO2(c)2, respectively, as monoclinic and cubic structures.
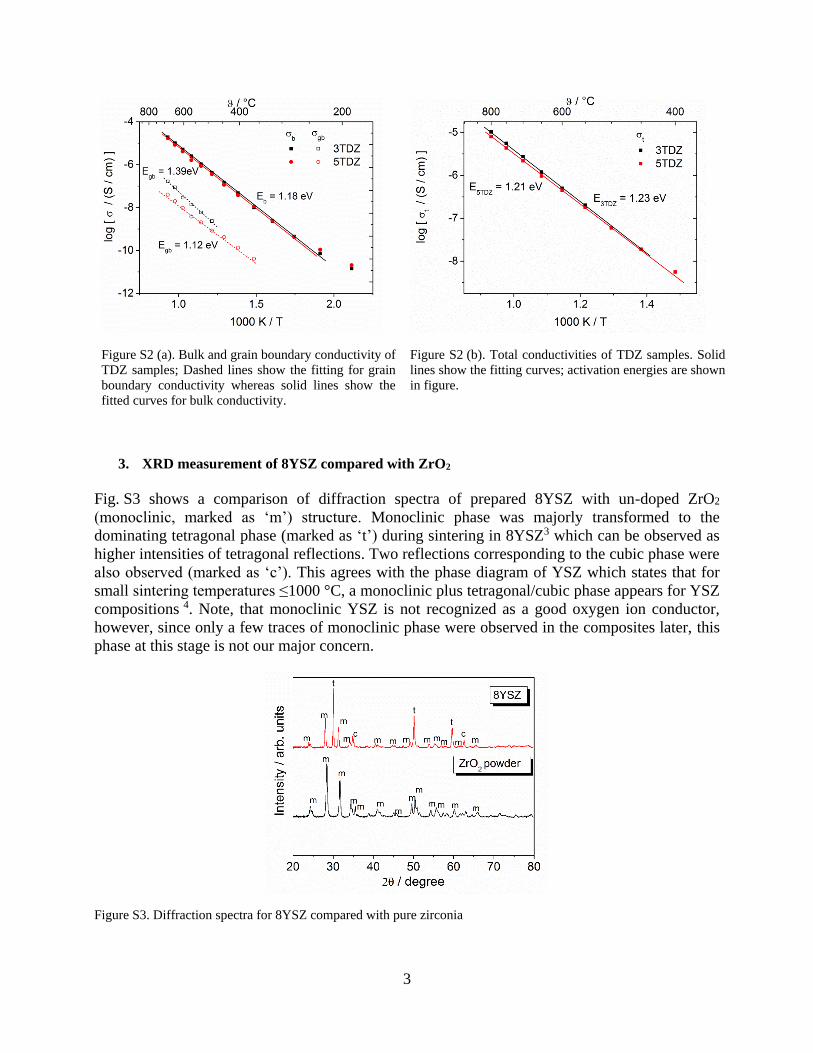
Electrical conductivities of bulk and grain boundaries are shown in Fig. S2 (a). Arrhenius behavior can be
seen for both bulk and grain boundary conductivities, however, the order of conductivity is much lower than
that can be expected for donor doped oxides. Unfortunately, the literature data is not available for
comparison. 5TDZ shows lower grain boundary conductivity than 3TDZ but nearly equal bulk conductivity.
The total conductivity of both the samples is shown in Fig. S2 (b). This figure also shows a slightly lower
conductivity of 5TDZ than that of 3TDZ due to the lower grain boundary conductivity of the former sample.
The value of the total conductivity is more than 6 decades lower than 3TDC, shown in main paper text. This
is the reason because TDZ is not used as electronic conducting phase in the aimed MIEC sample.
Structurally, Ta5+ should do same function in zirconia as it does in ceria i.e. increasing the electronic
concentration, however, band scheme reveals the difference among this expected and the observed
conductivities. Ceria consists of 4f orbitals, lying nearly at center in the band gap thereby decreasing the
effective energy band gap. These orbitals form an addition band in the band gap at nearly 2.8-3 eV that
serves as the effective conduction band. This is the reason that even a slight donor doping causes a
significant increase in electronic conductivity of ceria. On the other hand, zirconia doesn’t contain any
additional level within the ~5 eV band gap and therefore, TDZ shows extremely low conductivity, compared
to ceria.
3
Figure S2 (a). Bulk and grain boundary conductivity of
TDZ samples; Dashed lines show the fitting for grain
boundary conductivity whereas solid lines show the
fitted curves for bulk conductivity.
Figure S2 (b). Total conductivities of TDZ samples. Solid
lines show the fitting curves; activation energies are shown
in figure.
3. XRD measurement of 8YSZ compared with ZrO2
Fig. S3 shows a comparison of diffraction spectra of prepared 8YSZ with un-doped ZrO2
(monoclinic, marked as ‘m’) structure. Monoclinic phase was majorly transformed to the
dominating tetragonal phase (marked as ‘t’) during sintering in 8YSZ3 which can be observed as
higher intensities of tetragonal reflections. Two reflections corresponding to the cubic phase were
also observed (marked as ‘c’). This agrees with the phase diagram of YSZ which states that for
small sintering temperatures ≤1000 °C, a monoclinic plus tetragonal/cubic phase appears for YSZ
compositions 4. Note, that monoclinic YSZ is not recognized as a good oxygen ion conductor,
however, since only a few traces of monoclinic phase were observed in the composites later, this
phase at this stage is not our major concern.
Figure S3. Diffraction spectra for 8YSZ compared with pure zirconia
4
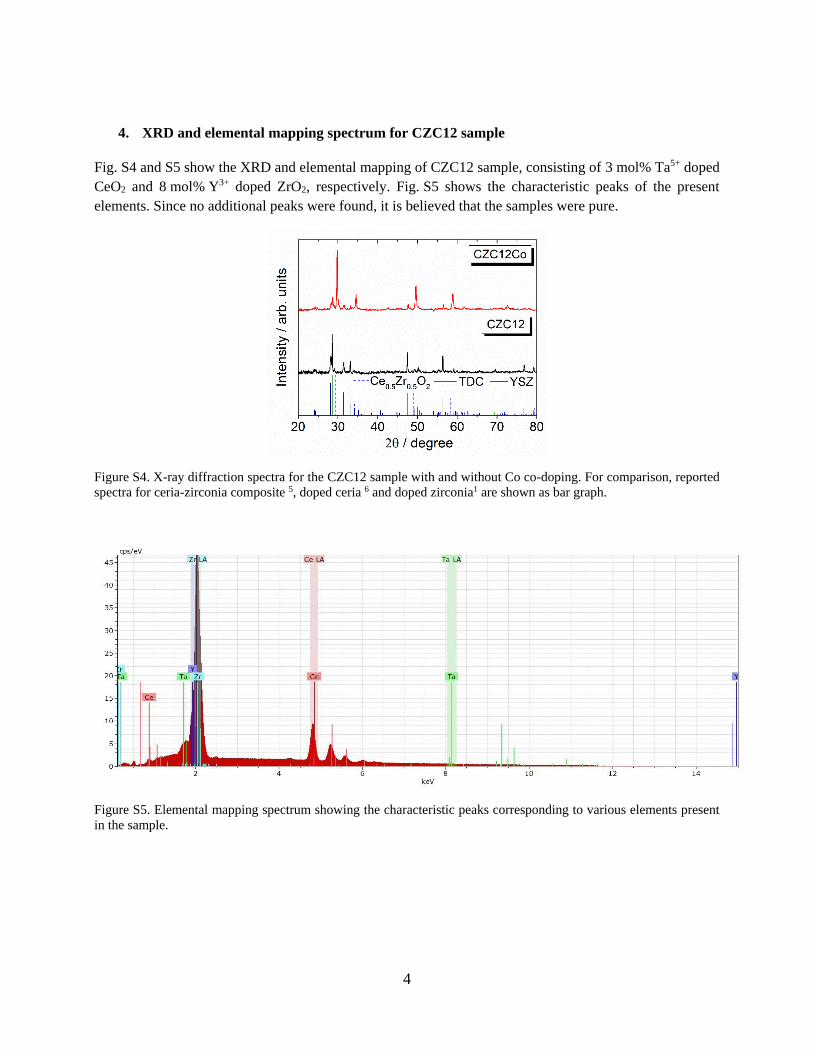
4. XRD and elemental mapping spectrum for CZC12 sample
Fig. S4 and S5 show the XRD and elemental mapping of CZC12 sample, consisting of 3 mol% Ta5+ doped
CeO2 and 8 mol% Y3+ doped ZrO2, respectively. Fig. S5 shows the characteristic peaks of the present
elements. Since no additional peaks were found, it is believed that the samples were pure.
Figure S4. X-ray diffraction spectra for the CZC12 sample with and without Co co-doping. For comparison, reported
spectra for ceria-zirconia composite 5, doped ceria 6 and doped zirconia1 are shown as bar graph.
Figure S5. Elemental mapping spectrum showing the characteristic peaks corresponding to various elements present
in the sample.
5
5. XRD spectra of CZC12CoNC sample compared to CZC12
Fig. S6. X-ray diffraction pattern for Co and Na2CO3 added CZC12 sample, compared with CZC12 sample and other
reported spectra.
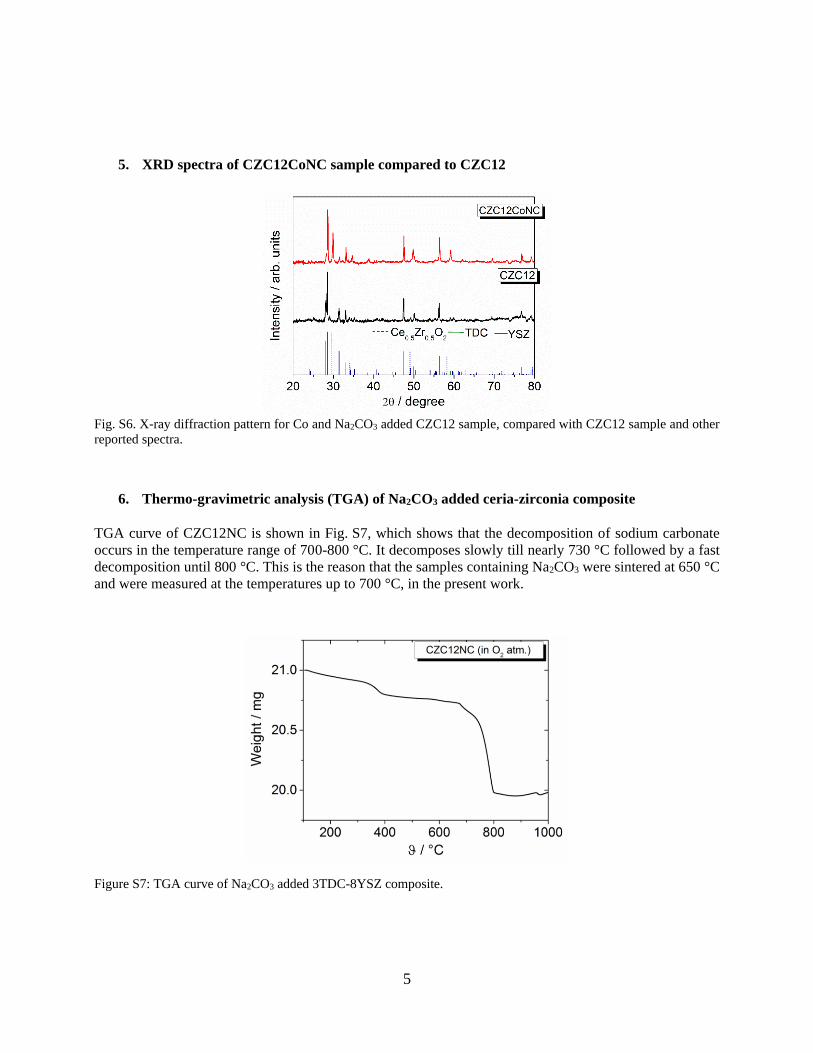
6. Thermo-gravimetric analysis (TGA) of Na2CO3 added ceria-zirconia composite
TGA curve of CZC12NC is shown in Fig. S7, which shows that the decomposition of sodium carbonate
occurs in the temperature range of 700-800 °C. It decomposes slowly till nearly 730 °C followed by a fast
decomposition until 800 °C. This is the reason that the samples containing Na2CO3 were sintered at 650 °C
and were measured at the temperatures up to 700 °C, in the present work.
Figure S7: TGA curve of Na2CO3 added 3TDC-8YSZ composite.
6
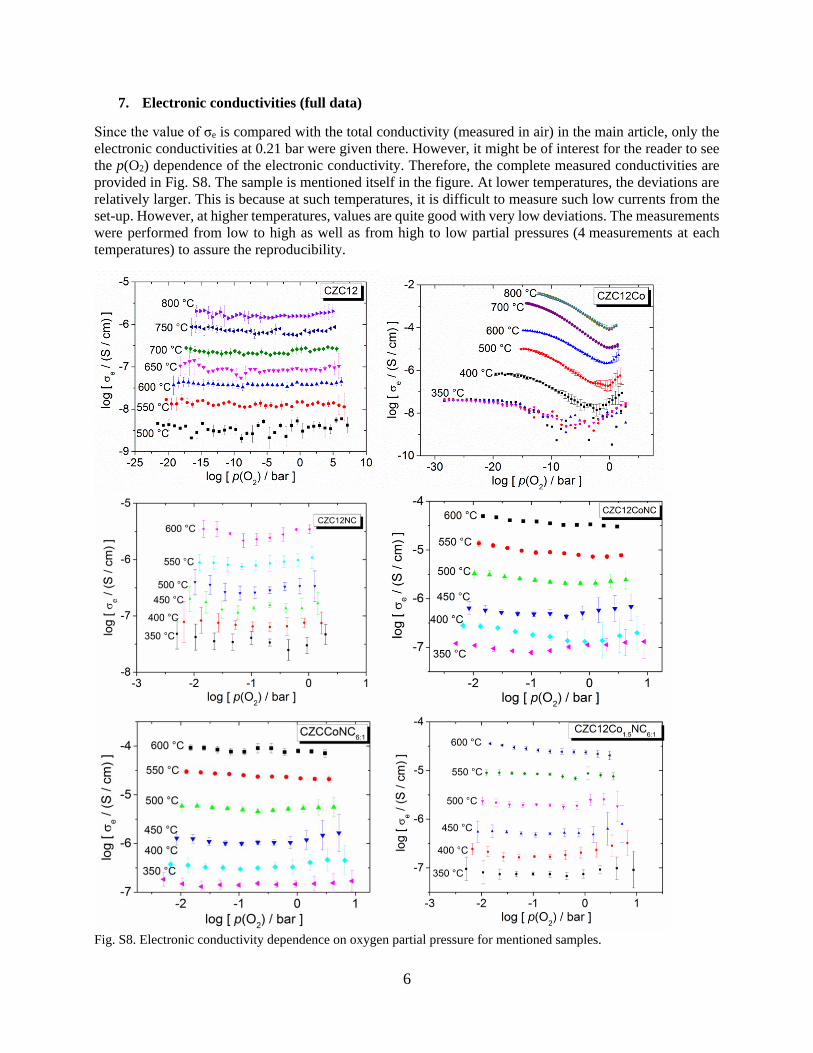
7. Electronic conductivities (full data)
Since the value of σe is compared with the total conductivity (measured in air) in the main article, only the
electronic conductivities at 0.21 bar were given there. However, it might be of interest for the reader to see
the p(O2) dependence of the electronic conductivity. Therefore, the complete measured conductivities are
provided in Fig. S8. The sample is mentioned itself in the figure. At lower temperatures, the deviations are
relatively larger. This is because at such temperatures, it is difficult to measure such low currents from the
set-up. However, at higher temperatures, values are quite good with very low deviations. The measurements
were performed from low to high as well as from high to low partial pressures (4 measurements at each
temperatures) to assure the reproducibility.
Fig. S8. Electronic conductivity dependence on oxygen partial pressure for mentioned samples.
7
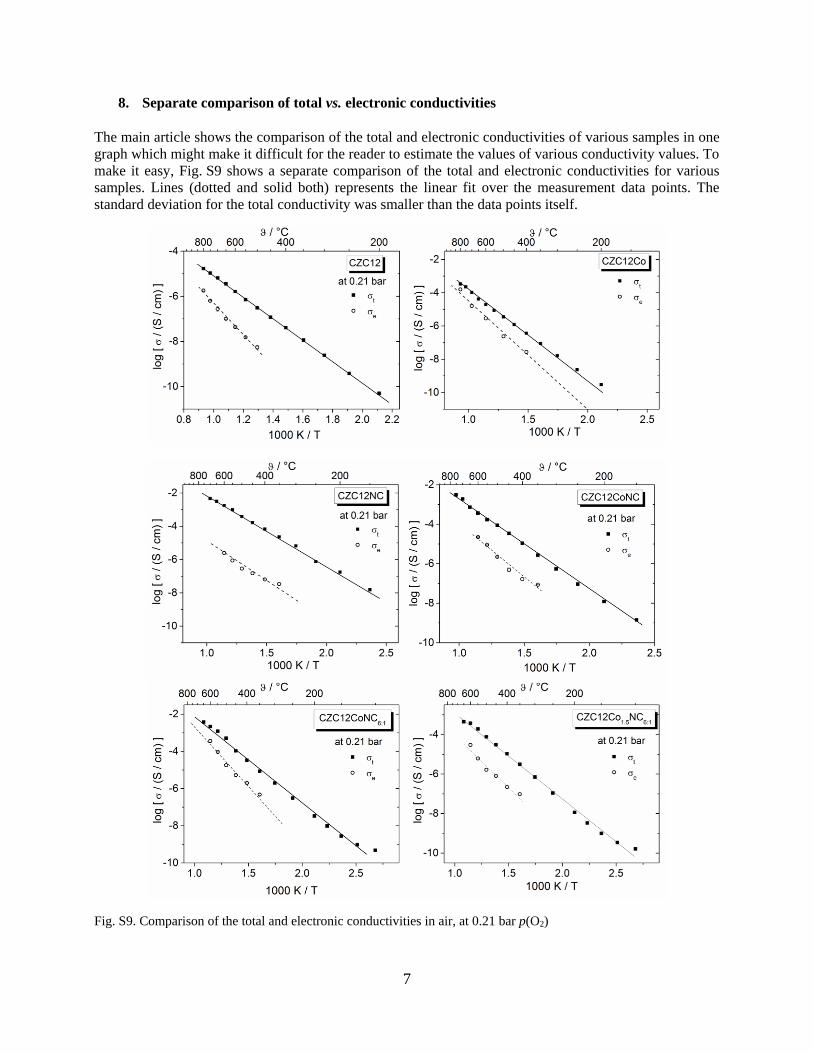
8. Separate comparison of total vs. electronic conductivities
The main article shows the comparison of the total and electronic conductivities of various samples in one
graph which might make it difficult for the reader to estimate the values of various conductivity values. To
make it easy, Fig. S9 shows a separate comparison of the total and electronic conductivities for various
samples. Lines (dotted and solid both) represents the linear fit over the measurement data points. The
standard deviation for the total conductivity was smaller than the data points itself.
Fig. S9. Comparison of the total and electronic conductivities in air, at 0.21 bar p(O2)
8
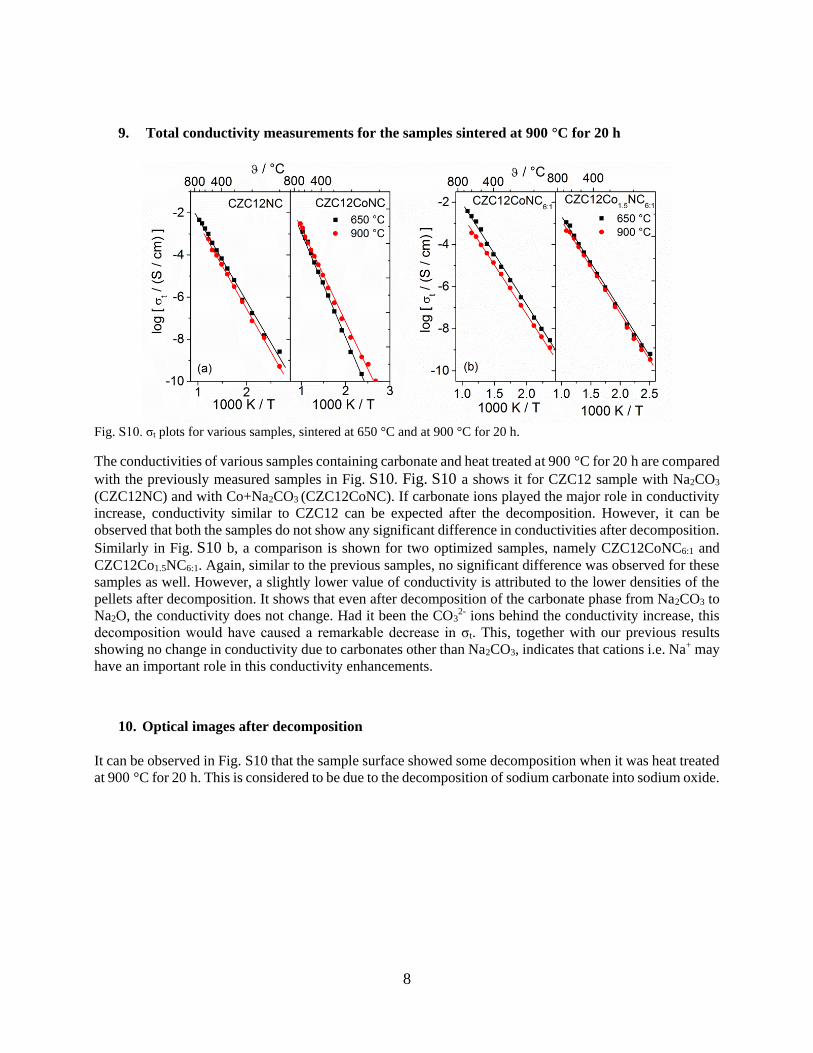
9. Total conductivity measurements for the samples sintered at 900 °C for 20 h
Fig. S10. σt plots for various samples, sintered at 650 °C and at 900 °C for 20 h.
The conductivities of various samples containing carbonate and heat treated at 900 °C for 20 h are compared
with the previously measured samples in Fig. S10. Fig. S10 a shows it for CZC12 sample with Na2CO3
(CZC12NC) and with Co+Na2CO3 (CZC12CoNC). If carbonate ions played the major role in conductivity
increase, conductivity similar to CZC12 can be expected after the decomposition. However, it can be
observed that both the samples do not show any significant difference in conductivities after decomposition.
Similarly in Fig. S10 b, a comparison is shown for two optimized samples, namely CZC12CoNC6:1 and
CZC12Co1.5NC6:1. Again, similar to the previous samples, no significant difference was observed for these
samples as well. However, a slightly lower value of conductivity is attributed to the lower densities of the
pellets after decomposition. It shows that even after decomposition of the carbonate phase from Na2CO3 to
Na2O, the conductivity does not change. Had it been the CO32- ions behind the conductivity increase, this
decomposition would have caused a remarkable decrease in σt. This, together with our previous results
showing no change in conductivity due to carbonates other than Na2CO3, indicates that cations i.e. Na+ may
have an important role in this conductivity enhancements.
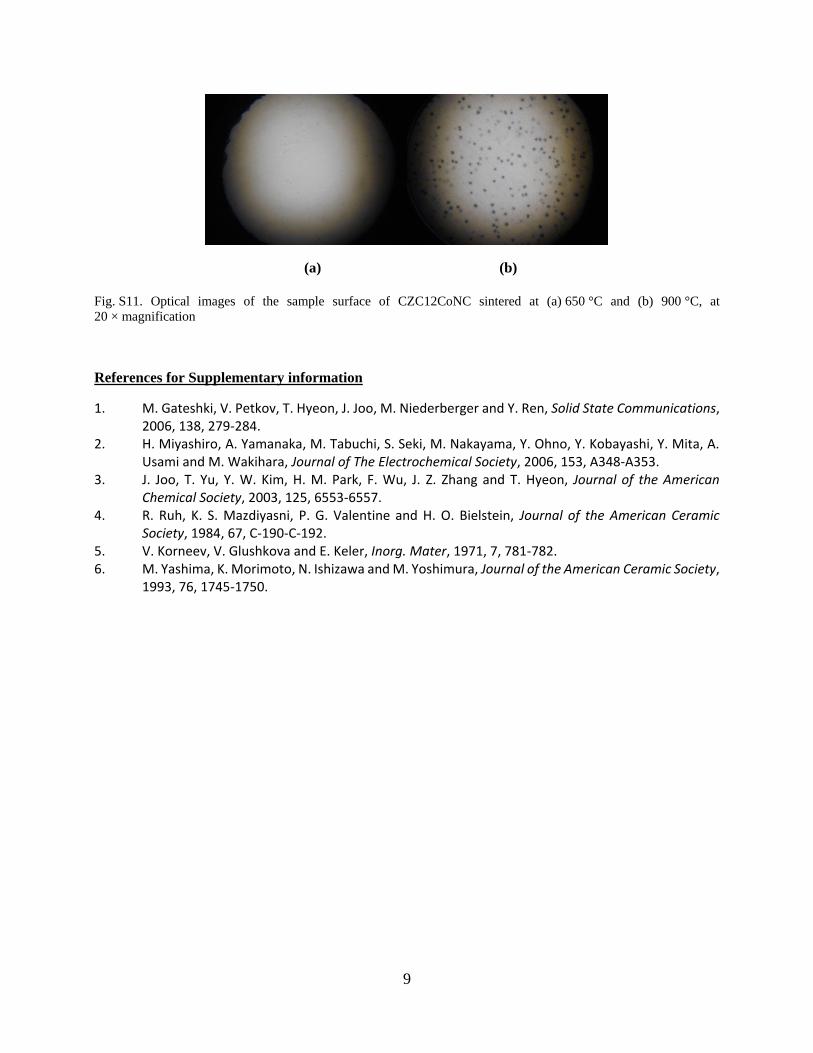
10. Optical images after decomposition
It can be observed in Fig. S10 that the sample surface showed some decomposition when it was heat treated
at 900 °C for 20 h. This is considered to be due to the decomposition of sodium carbonate into sodium oxide.
9
(a) (b)
Fig. S11. Optical images of the sample surface of CZC12CoNC sintered at (a) 650 °C and (b) 900 °C, at
20 × magnification
References for Supplementary information
1. M. Gateshki, V. Petkov, T. Hyeon, J. Joo, M. Niederberger and Y. Ren, Solid State Communications, 2006, 138, 279-284.
2. H. Miyashiro, A. Yamanaka, M. Tabuchi, S. Seki, M. Nakayama, Y. Ohno, Y. Kobayashi, Y. Mita, A. Usami and M. Wakihara, Journal of The Electrochemical Society, 2006, 153, A348-A353.
3. J. Joo, T. Yu, Y. W. Kim, H. M. Park, F. Wu, J. Z. Zhang and T. Hyeon, Journal of the American Chemical Society, 2003, 125, 6553-6557.
4. R. Ruh, K. S. Mazdiyasni, P. G. Valentine and H. O. Bielstein, Journal of the American Ceramic Society, 1984, 67, C-190-C-192.
5. V. Korneev, V. Glushkova and E. Keler, Inorg. Mater, 1971, 7, 781-782. 6. M. Yashima, K. Morimoto, N. Ishizawa and M. Yoshimura, Journal of the American Ceramic Society,
1993, 76, 1745-1750.


![Metastable monoclinic [110] layered perovskite Dy2Ti2O7 ...mimp.materials.cmu.edu/rohrer/papers/2019_06.pdf · 6 octa-hedra network. In the monoclinic layered perovskite structure,](https://img.pdfslide.us/doc/110x75/5e88ba593f2a6242127ea256/metastable-monoclinic-110-layered-perovskite-dy2ti2o7-mimp-6-octa-hedra-network.jpg)


![Ab initio investigation of monoclinic phase stability and martensitic … · In the present work we consider two types of martensitic transformations: T1 2 and T2 1 [16,22,23] (hereafter](https://img.pdfslide.us/doc/110x75/5feb69e7bc3bec4f82071273/ab-initio-investigation-of-monoclinic-phase-stability-and-martensitic-in-the-present.jpg)