Embed Size (px)
Citation preview
Handoko L*, Han X*, Li G* et. al., Chromatin interactome in ES cells
1
SUPPLEMENTARY INFORMATION
CTCF-Mediated Functional Chromatin Interactome in Pluripotent Cells
Lusy Handoko1,*, Han Xu1,*, Guoliang Li1,*, Chew Yee Ngan1, Elaine Chew1, Marie Schnapp1,
Charlie Wah Heng Lee1, Chaopeng Ye1, Joanne Lim Hui Ping, Fabianus Mulawadi1, Eleanor
Wong1, 2, Jianpeng Sheng3, Yubo Zhang1, Thompson Poh1, Chee Seng Chan1, Galih Kunarso4,
Atif Shahab1, Guillaume Bourque1, Valere Cacheux-Rataboul1, Wing-Kin Sung1, 3, Yijun Ruan1,
#, Chia-Lin Wei1, 2, #, ¥
1 Genome Institute of Singapore, Singapore 138672. 2 National University of Singapore, Singapore 117543. 3 Nanyang Technological University, Singapore 637551. 4 Duke-NUS Graduate Medical School Singapore, Singapore 169857
# Corresponding authors
Chia-Lin Wei Yijun Ruan
Tel: 1 (925) 927-2593 (65) 68088073
Email: [email protected] [email protected]
* These authors contributed equally ¥ Current address: Joint Genome Institute, Walnut Creek, California, U.S.A.
Keyword: insulator, enhancer, chromatin organization, epigenetic regulation, nuclear lamina
Nature Genetcs: doi:10.1038/ng.857
Handoko L*, Han X*, Li G* et. al., Chromatin interactome in ES cells
2
Supplementary Note
1. ChIA-PET analysis
1.1 Determine cutoff fragment size between self ligation and inter ligation PETs
1.2 Chimeric ChIA-PETs represent non-specific random inter-molecular ligation
1.3 Reproducibility between biological and technical replicates of ChIA-PET libraries
Supplementary Figures
Supplementary Figure 1. CTCF ChIA-PET analysis
Supplementary Figure 2. Molecular and cytogenetic validation of CTCF directed inter- and
intra-chromosomal interactions
Supplementary Figure 3. Clustering of inter-chromosomal interactions
Supplementary Figure 4. Specificity of chromatin domains defined by CTCF-mediated
DNA looping
Supplementary Figure 5. Probability of loop span in each category and reduction of
H3K4me1 signal intensities after CTCF knock-down
Supplementary Figure 6. Histone modification and RNAP II profiles in each chromatin
domain and neighboring regions
Supplementary Figure 7. Examples of loops from category I-IV
Supplementary Figure 8. p300 association with cell specific open chromatin marks and
enhancer signals
Supplementary Figure 9. DNA loop brings promoter and p300 enhancer into close proximity
and affects expression of the corresponding genes
Supplementary Figure 10. Characterization of Lamin B-binding regions
Supplementary Figure 11. Model of CTCF directed chromatin domains (category I-IV), their
associated gene activities and sub-nuclear chromatin localizations
Supplementary Tables
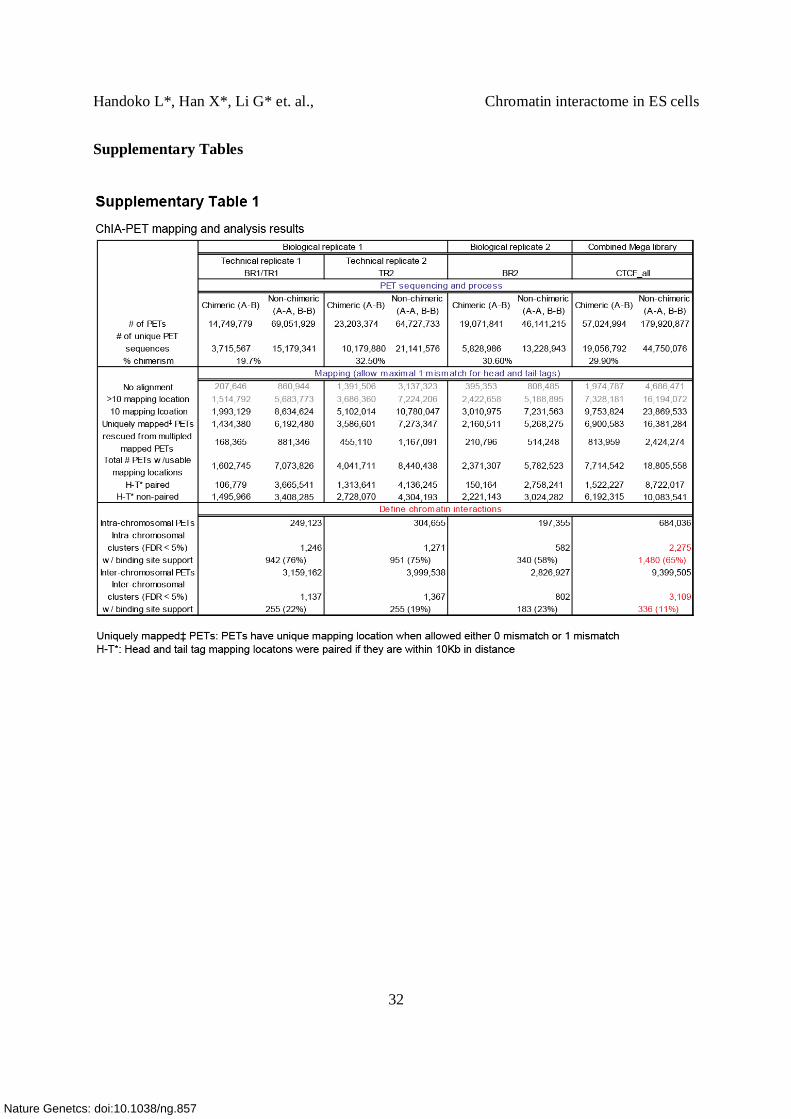
Supplementary Table 1. ChIA-PET sequencing processing and mapping summary
Supplementary Table 2. CTCF binding sites (Excel file)
Supplementary Table 3. Intra-and inter-chromosomal interactions detected by CTCF ChIA-
PET (Excel file)
Supplementary Table 4. 4C, FISH and 3C validation results
Nature Genetcs: doi:10.1038/ng.857
Handoko L*, Han X*, Li G* et. al., Chromatin interactome in ES cells
3
Supplementary Table 5. List of 5 categories assigned to intra-chromosomal interactions
(Excel File)
Supplementary Table 6. RNA Pol II, p300 and LADs sites defined by ChIP-Seq (Excel file)
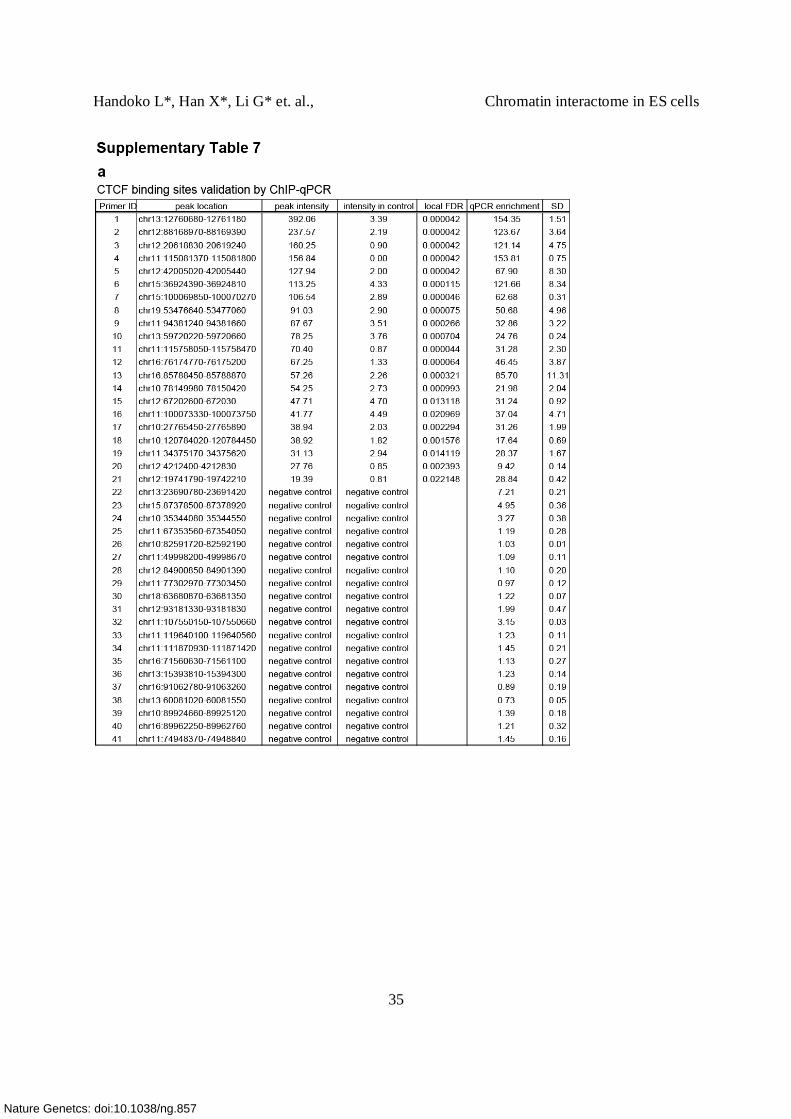
Supplementary Table 7. ChIP-qPCR of CTCF, Lamin B, p300
Supplementary Table 8. RNAP II interactions defined by ChIA-PET (Excel File)
Supplementary Table 9. SALL4 interactions defined by ChIA-PET (Excel File)
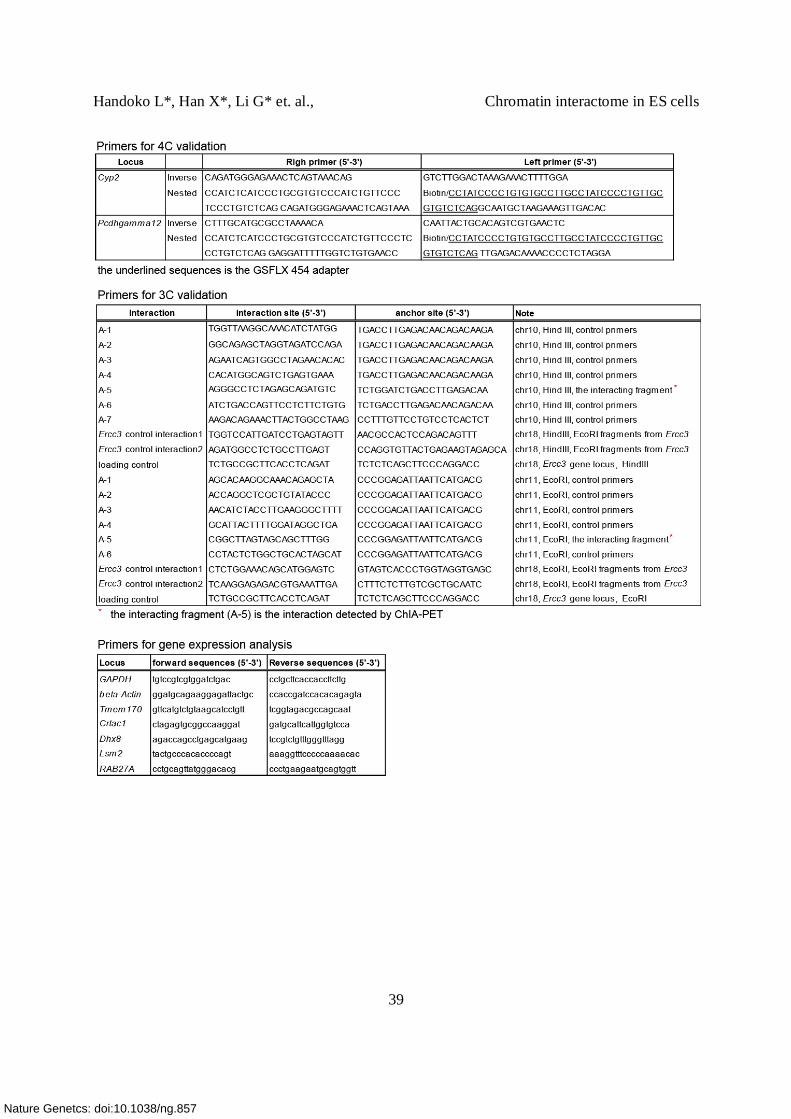
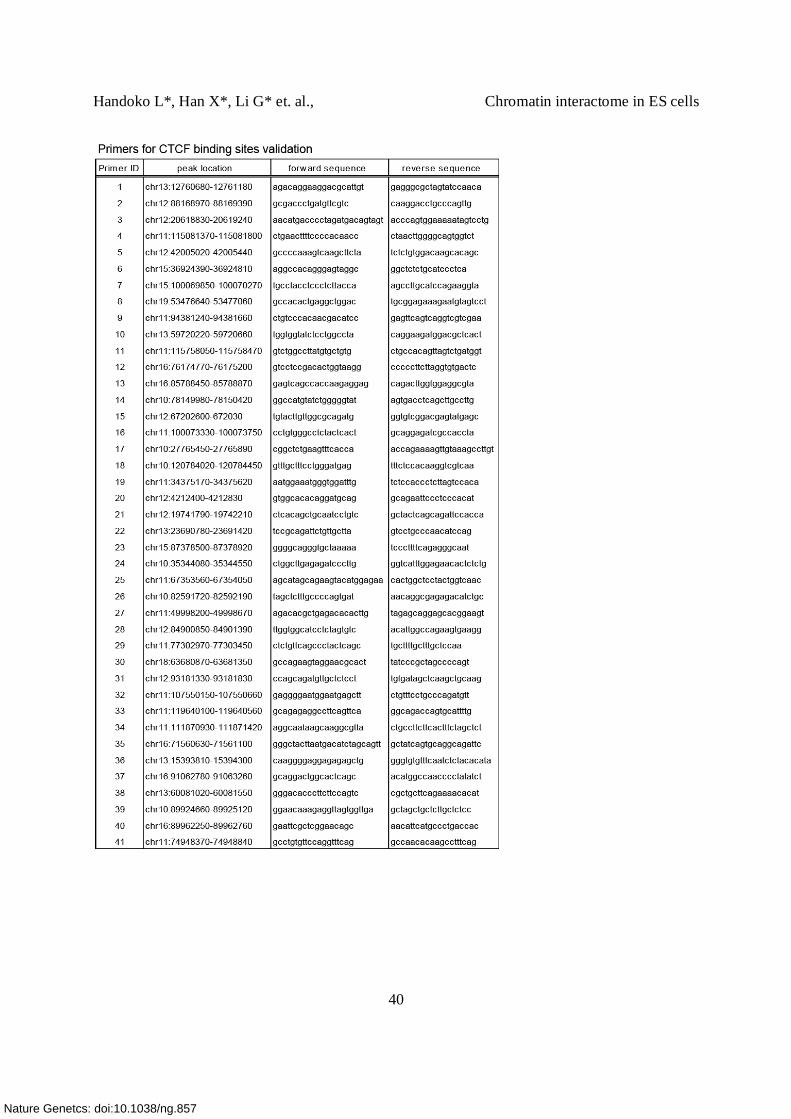
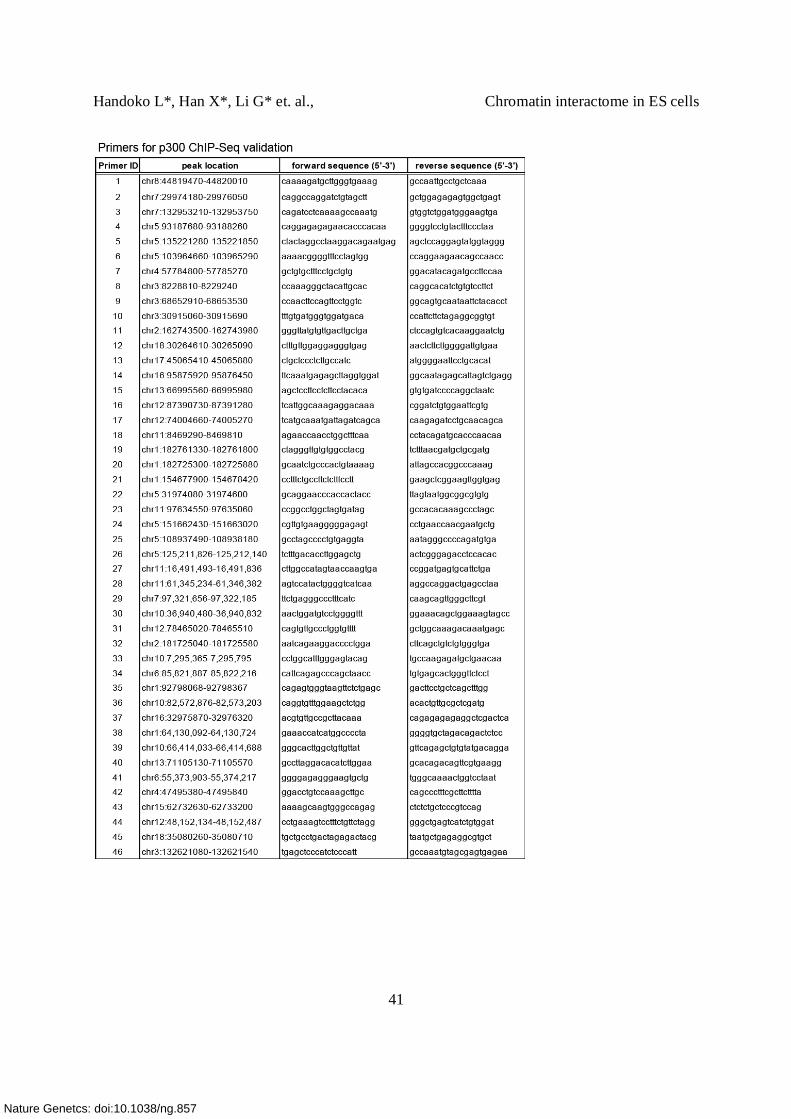
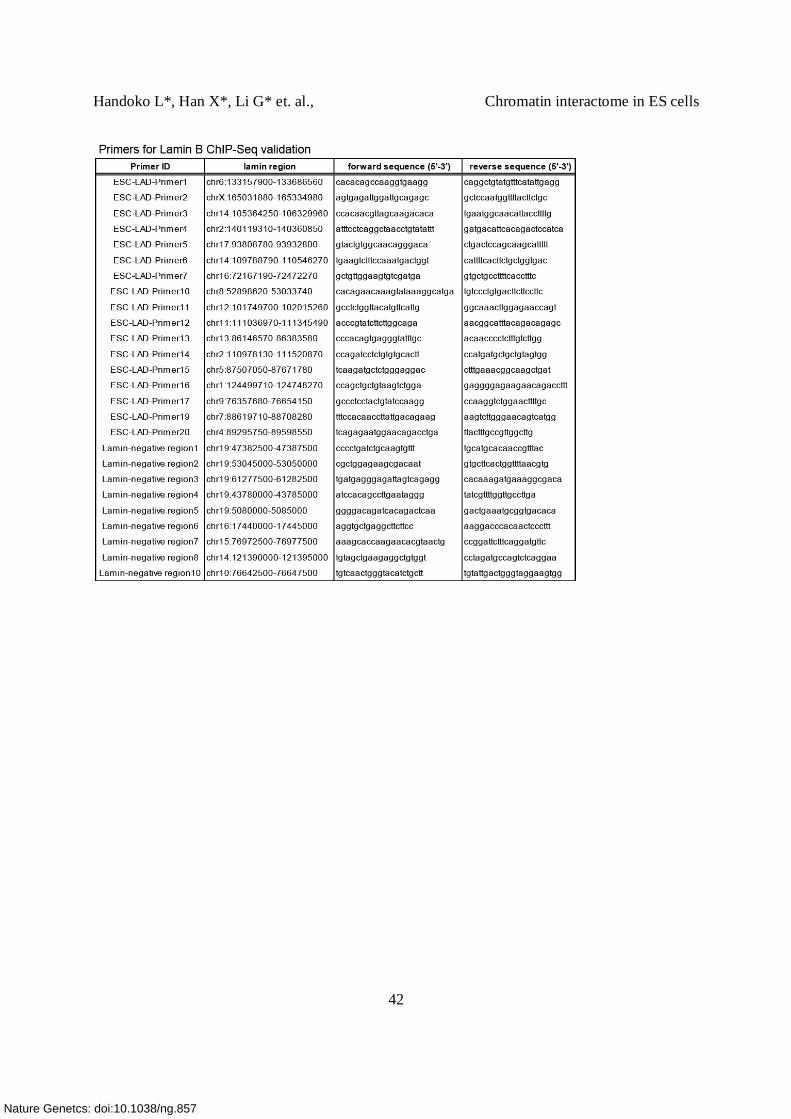
Supplementary Table 10. Sequences of ChIA-PET linkers, siRNA, primers (qPCR, 3C, 4C)
and list of BAC clones
Nature Genetcs: doi:10.1038/ng.857
Handoko L*, Han X*, Li G* et. al., Chromatin interactome in ES cells
4
Supplementary Note 1. ChIA-PET analysis
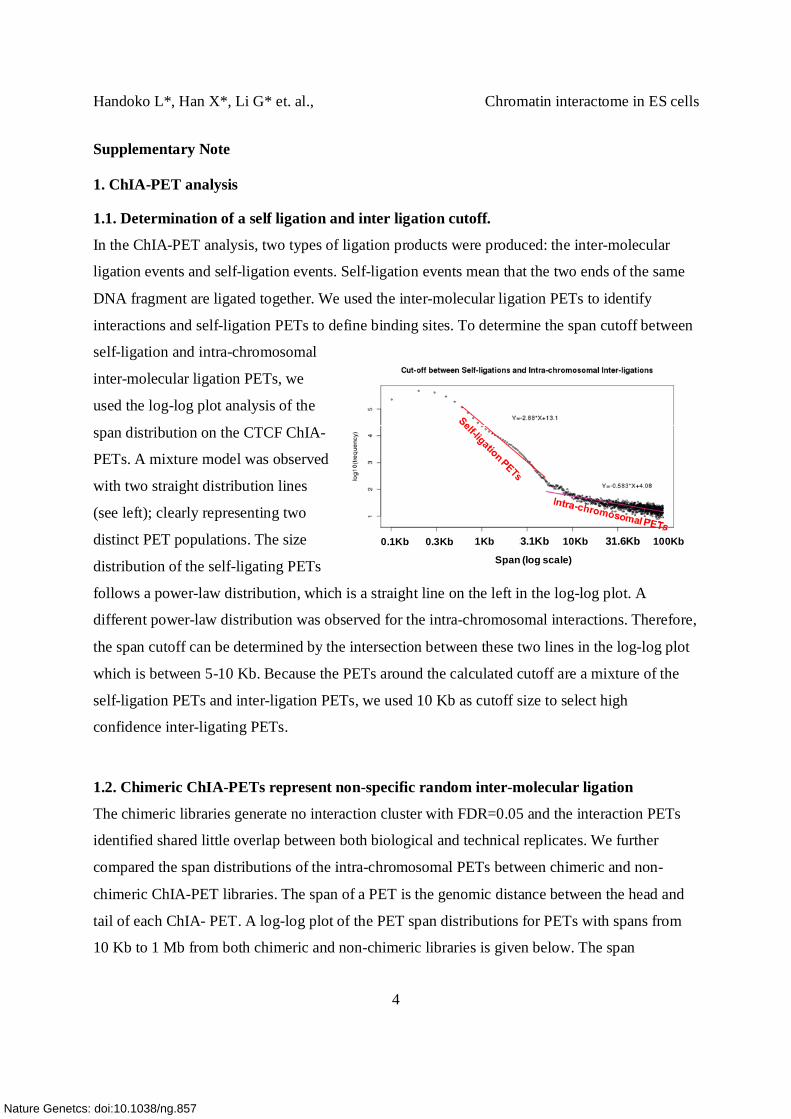
1.1. Determination of a self ligation and inter ligation cutoff.
In the ChIA-PET analysis, two types of ligation products were produced: the inter-molecular
ligation events and self-ligation events. Self-ligation events mean that the two ends of the same
DNA fragment are ligated together. We used the inter-molecular ligation PETs to identify
interactions and self-ligation PETs to define binding sites. To determine the span cutoff between
self-ligation and intra-chromosomal
inter-molecular ligation PETs, we
used the log-log plot analysis of the
span distribution on the CTCF ChIA-
PETs. A mixture model was observed
with two straight distribution lines
(see left); clearly representing two
distinct PET populations. The size
distribution of the self-ligating PETs
follows a power-law distribution, which is a straight line on the left in the log-log plot. A
different power-law distribution was observed for the intra-chromosomal interactions. Therefore,
the span cutoff can be determined by the intersection between these two lines in the log-log plot
which is between 5-10 Kb. Because the PETs around the calculated cutoff are a mixture of the
self-ligation PETs and inter-ligation PETs, we used 10 Kb as cutoff size to select high
confidence inter-ligating PETs.
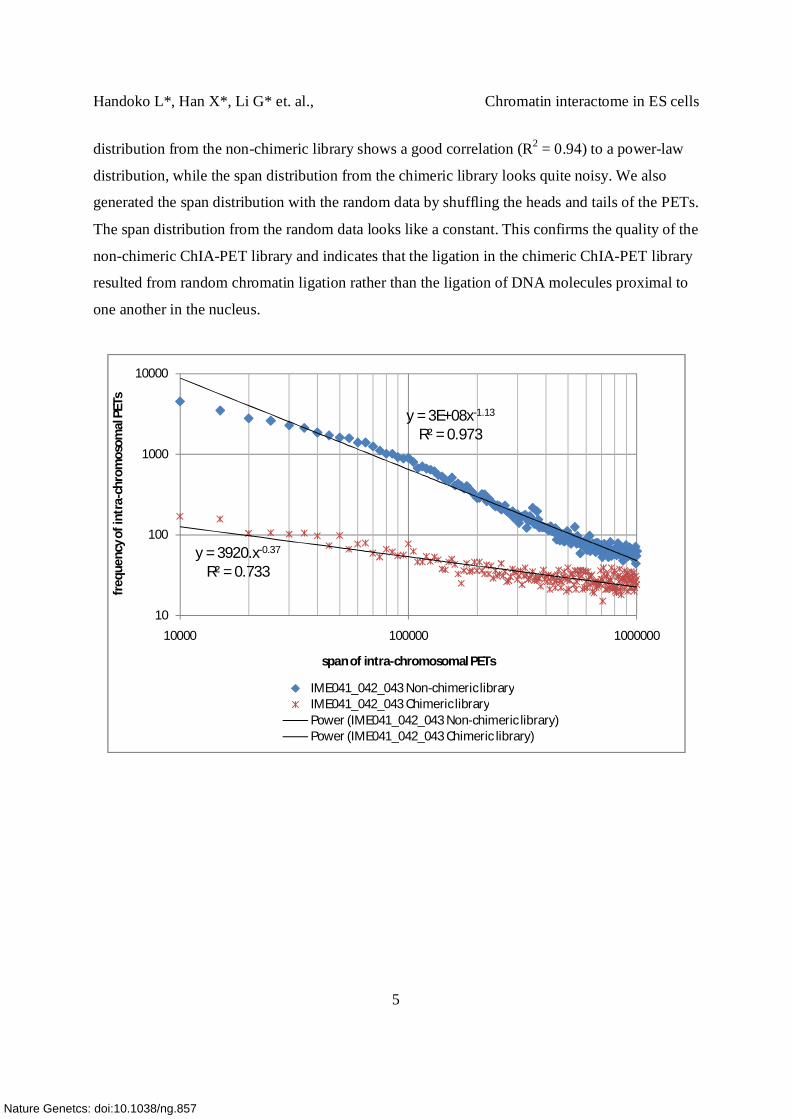
1.2. Chimeric ChIA-PETs represent non-specific random inter-molecular ligation
The chimeric libraries generate no interaction cluster with FDR=0.05 and the interaction PETs
identified shared little overlap between both biological and technical replicates. We further
compared the span distributions of the intra-chromosomal PETs between chimeric and non-
chimeric ChIA-PET libraries. The span of a PET is the genomic distance between the head and
tail of each ChIA- PET. A log-log plot of the PET span distributions for PETs with spans from
10 Kb to 1 Mb from both chimeric and non-chimeric libraries is given below. The span
Span (log scale)
1Kb 10Kb 100Kb0.1Kb 3.3Kb 33Kb0.3Kb 3.1Kb 31.6Kb
Nature Genetcs: doi:10.1038/ng.857
Handoko L*, Han X*, Li G* et. al., Chromatin interactome in ES cells
5
distribution from the non-chimeric library shows a good correlation (R2 = 0.94) to a power-law
distribution, while the span distribution from the chimeric library looks quite noisy. We also
generated the span distribution with the random data by shuffling the heads and tails of the PETs.
The span distribution from the random data looks like a constant. This confirms the quality of the
non-chimeric ChIA-PET library and indicates that the ligation in the chimeric ChIA-PET library
resulted from random chromatin ligation rather than the ligation of DNA molecules proximal to
one another in the nucleus.
y = 3E+08x-1.13
R² = 0.973
y = 3920.x-0.37
R² = 0.733
10
100
1000
10000
10000 100000 1000000
freq
uenc
y of i
ntra
-chr
omos
omal
PET
s
span of intra-chromosomal PETs
IME041_042_043 Non-chimeric libraryIME041_042_043 Chimeric libraryPower (IME041_042_043 Non-chimeric library)Power (IME041_042_043 Chimeric library)
Nature Genetcs: doi:10.1038/ng.857
Handoko L*, Han X*, Li G* et. al., Chromatin interactome in ES cells
6
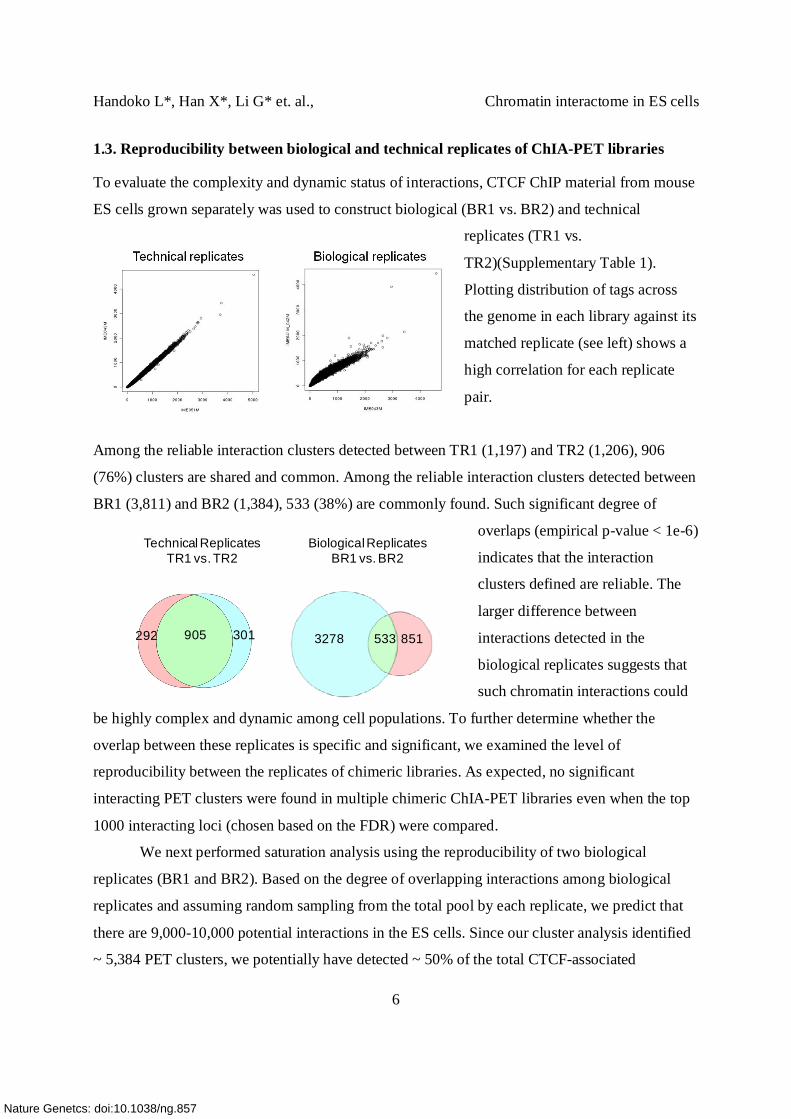
1.3. Reproducibility between biological and technical replicates of ChIA-PET libraries
To evaluate the complexity and dynamic status of interactions, CTCF ChIP material from mouse
ES cells grown separately was used to construct biological (BR1 vs. BR2) and technical
replicates (TR1 vs.
TR2)(Supplementary Table 1).
Plotting distribution of tags across
the genome in each library against its
matched replicate (see left) shows a
high correlation for each replicate
pair.
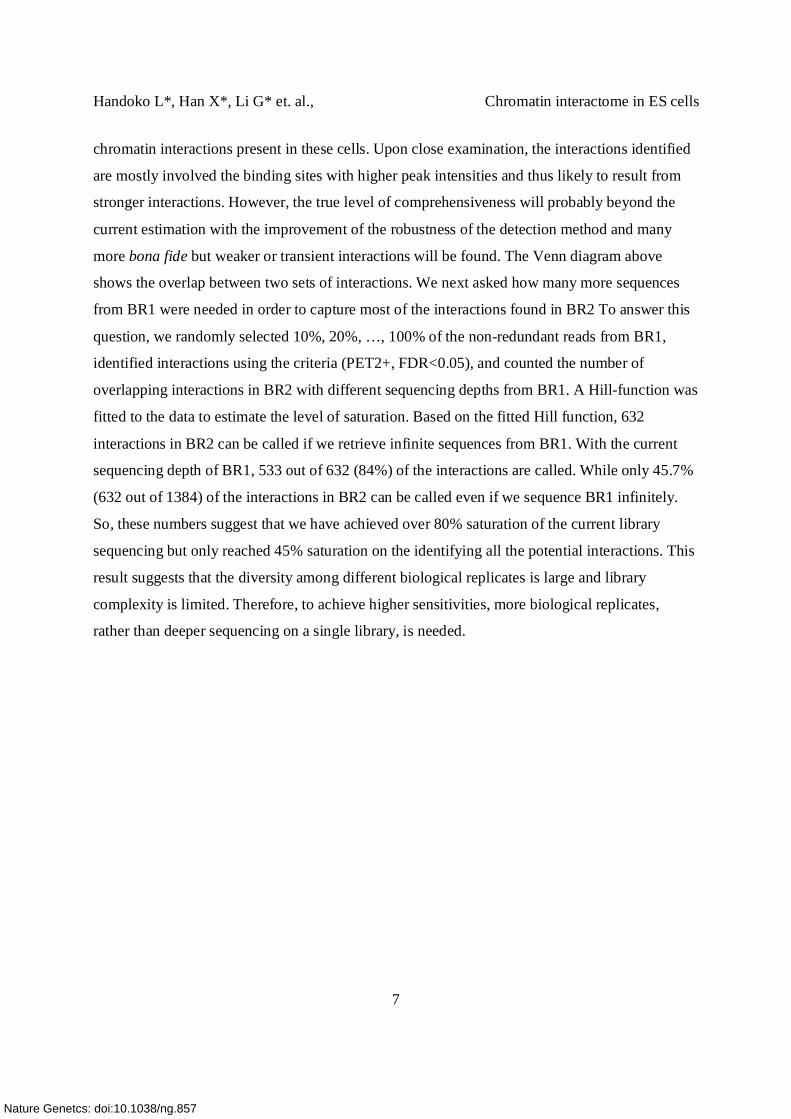
Among the reliable interaction clusters detected between TR1 (1,197) and TR2 (1,206), 906
(76%) clusters are shared and common. Among the reliable interaction clusters detected between
BR1 (3,811) and BR2 (1,384), 533 (38%) are commonly found. Such significant degree of
overlaps (empirical p-value < 1e-6)
indicates that the interaction
clusters defined are reliable. The
larger difference between
interactions detected in the
biological replicates suggests that
such chromatin interactions could
be highly complex and dynamic among cell populations. To further determine whether the
overlap between these replicates is specific and significant, we examined the level of
reproducibility between the replicates of chimeric libraries. As expected, no significant
interacting PET clusters were found in multiple chimeric ChIA-PET libraries even when the top
1000 interacting loci (chosen based on the FDR) were compared.
We next performed saturation analysis using the reproducibility of two biological
replicates (BR1 and BR2). Based on the degree of overlapping interactions among biological
replicates and assuming random sampling from the total pool by each replicate, we predict that
there are 9,000-10,000 potential interactions in the ES cells. Since our cluster analysis identified
~ 5,384 PET clusters, we potentially have detected ~ 50% of the total CTCF-associated
292 905 301
Technical ReplicatesTR1 vs. TR2
8515333278
Biological ReplicatesBR1 vs. BR2
Nature Genetcs: doi:10.1038/ng.857
Handoko L*, Han X*, Li G* et. al., Chromatin interactome in ES cells
7
chromatin interactions present in these cells. Upon close examination, the interactions identified
are mostly involved the binding sites with higher peak intensities and thus likely to result from
stronger interactions. However, the true level of comprehensiveness will probably beyond the
current estimation with the improvement of the robustness of the detection method and many
more bona fide but weaker or transient interactions will be found. The Venn diagram above
shows the overlap between two sets of interactions. We next asked how many more sequences
from BR1 were needed in order to capture most of the interactions found in BR2 To answer this
question, we randomly selected 10%, 20%, …, 100% of the non-redundant reads from BR1,
identified interactions using the criteria (PET2+, FDR<0.05), and counted the number of
overlapping interactions in BR2 with different sequencing depths from BR1. A Hill-function was
fitted to the data to estimate the level of saturation. Based on the fitted Hill function, 632
interactions in BR2 can be called if we retrieve infinite sequences from BR1. With the current
sequencing depth of BR1, 533 out of 632 (84%) of the interactions are called. While only 45.7%
(632 out of 1384) of the interactions in BR2 can be called even if we sequence BR1 infinitely.
So, these numbers suggest that we have achieved over 80% saturation of the current library
sequencing but only reached 45% saturation on the identifying all the potential interactions. This
result suggests that the diversity among different biological replicates is large and library
complexity is limited. Therefore, to achieve higher sensitivities, more biological replicates,
rather than deeper sequencing on a single library, is needed.
Nature Genetcs: doi:10.1038/ng.857
Handoko L*, Han X*, Li G* et. al., Chromatin interactome in ES cells
8
Supplementary Figures
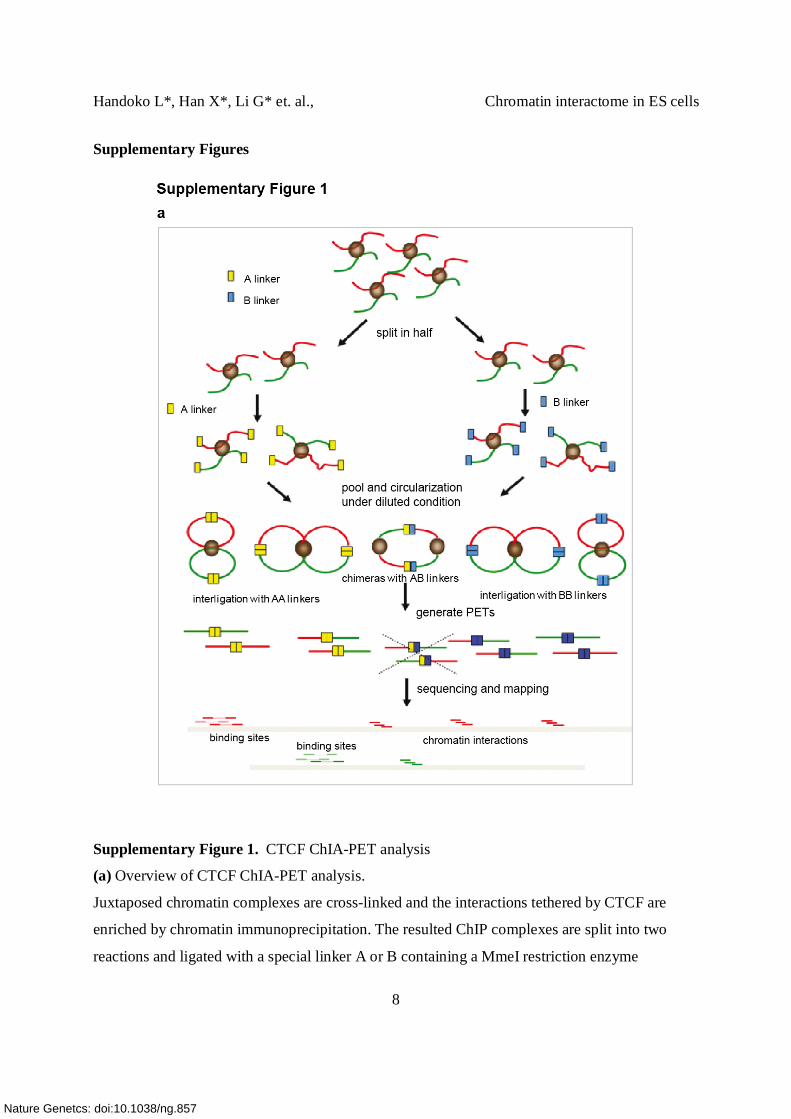
Supplementary Figure 1. CTCF ChIA-PET analysis
(a) Overview of CTCF ChIA-PET analysis.
Juxtaposed chromatin complexes are cross-linked and the interactions tethered by CTCF are
enriched by chromatin immunoprecipitation. The resulted ChIP complexes are split into two
reactions and ligated with a special linker A or B containing a MmeI restriction enzyme
Nature Genetcs: doi:10.1038/ng.857
Handoko L*, Han X*, Li G* et. al., Chromatin interactome in ES cells
9
recognition site and biotin label. Intra-molecular ligation is then carried out to join the ends of
proximal chromatin fragment. Three different types of ligation products are obtained: self-ligated
DNA fragments (very left and very right), intra molecular ligations from chromatin fragments
containing either A-A or B-B linkers (2nd to the right and left), and inter-molecular chimeric
ligations obtained from two non specifically-interacting chromatin complexes carrying A-B
linker (middle). Ligation products (self-circularization of individual DNA fragment or intra-
molecular ligation of multiple DNA fragments within one interacting chromatin complex) are
digested with MmeI to release PETs and selected by streptavidin conjugated magnetic beads.
Ultrahigh throughput sequencing analysis is then performed to reveal long range chromatin
interaction loci. The DNA fragments with either A-A or B-B linkers will be used as non-
chimeric PETs to determine binding sites or chromatin interaction loci. The fragments with A-B
linkers (chimeric PETs) are used as an indicator to estimate the level of noise in the ChIA-PET
library. From the 10.1 million uniquely mapped inter-ligating PETs, we then defined the inter-
ligation PET clusters. Using occurrence frequency to distinguish real interaction signals
(multiple overlapping clusters) from random noise (PET singletons); we obtained 2,275 intra-
and 3,109 inter-ligation PET clusters (Supplementary Table 3a, b). We further checked for
homology between anchors and found that the majority of the sequences from the paired
interaction anchor regions show no homology and thus are unlikely to have resulted from
mapping errors of segmental duplications and homologous sequences. Furthermore, most of
these interaction loci are supported by CTCF binding. 2,115 of the 2,275 intra-chromosomal
(93%) and 2,648 of the 3,109 inter-chromosomal interactions (85%) harbor CTCF binding sites
on either or both anchors of the interaction loci.
Nature Genetcs: doi:10.1038/ng.857
Handoko L*, Han X*, Li G* et. al., Chromatin interactome in ES cells
10
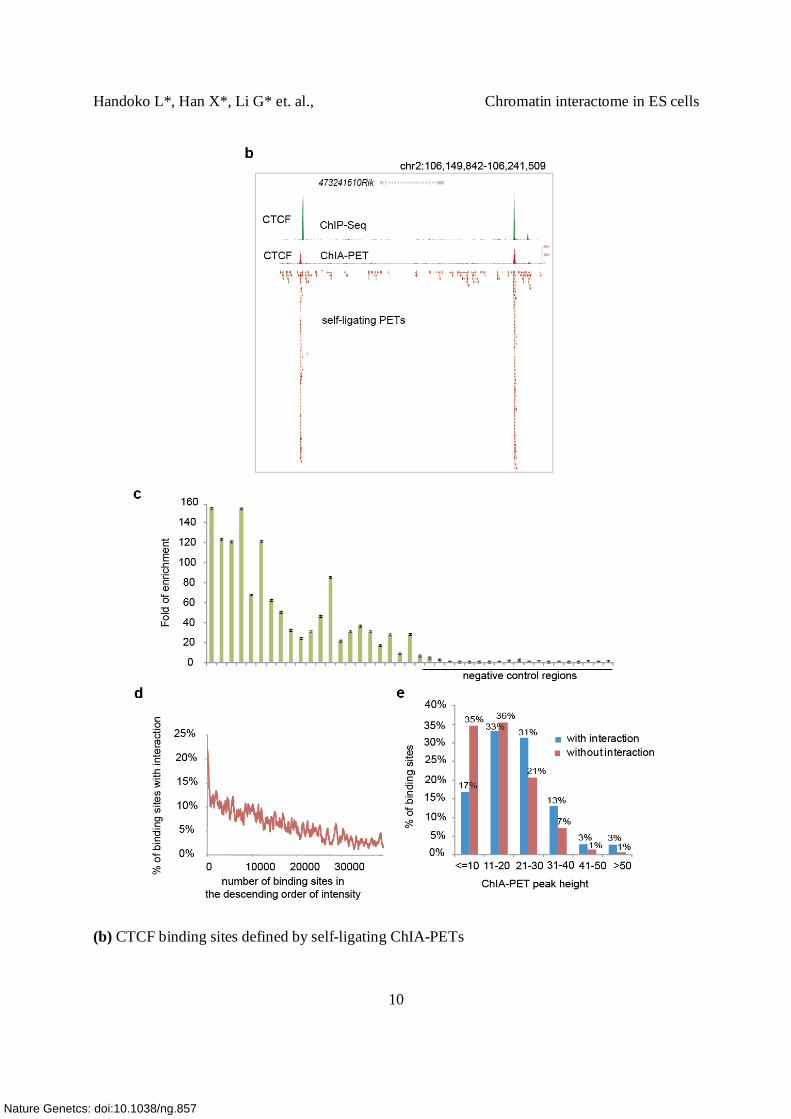
(b) CTCF binding sites defined by self-ligating ChIA-PETs
Nature Genetcs: doi:10.1038/ng.857
Handoko L*, Han X*, Li G* et. al., Chromatin interactome in ES cells
11
An example is shown here in a 92 Kb interval around chr2:106,149,842-106,241,509
surrounding the gene 4732421G10Rik. Two strong CTCF binding sites are detected by ChIP-Seq
analysis (green track). Self-ligating ChIA-PETs shown as overlapping red connecting lines are
also found to be accumulated at the same locations. The intensity profile resulting from these
self-ligating ChIA-PETs is highly similar to the profile generated from ChIP-Seq.
(c) ChIP-qPCR validation of CTCF binding sites detected by ChIP-Seq. 21 CTCF binding sites
were chosen based on the peak intensities (decreasing from the left to the right). Negative control
regions (22-41) represent regions with no CTCF binding sites. The fold of enrichment is shown
in the Y-axis for the list of 1-21 sites selected (Supplementary Table 7a).
(d) Correlation of binding intensities of CTCF and their involvement in the interactions. In total,
3,306 CTCF binding sites are involved in these chromatin interactions. Compared with the
binding sites that are not involved in the interactions, these 3,306 sites have higher binding
intensities (p<10E-308 in KS-test). The plot shows the ratio of binding sites found to anchor
chromatin interactions ranked by the binding site intensities. 20% of the top 200 CTCF binding
peaks are found in the interaction anchors while only 2% of the bottom 200 binding peaks are
detected in the anchors.
(e) The distributions of peak heights for binding sites involved in interactions (blue) and those
not involved in interactions (red). It appears that the detected interactions are mediated through
the stronger binding events.
Nature Genetcs: doi:10.1038/ng.857
Handoko L*, Han X*, Li G* et. al., Chromatin interactome in ES cells
12
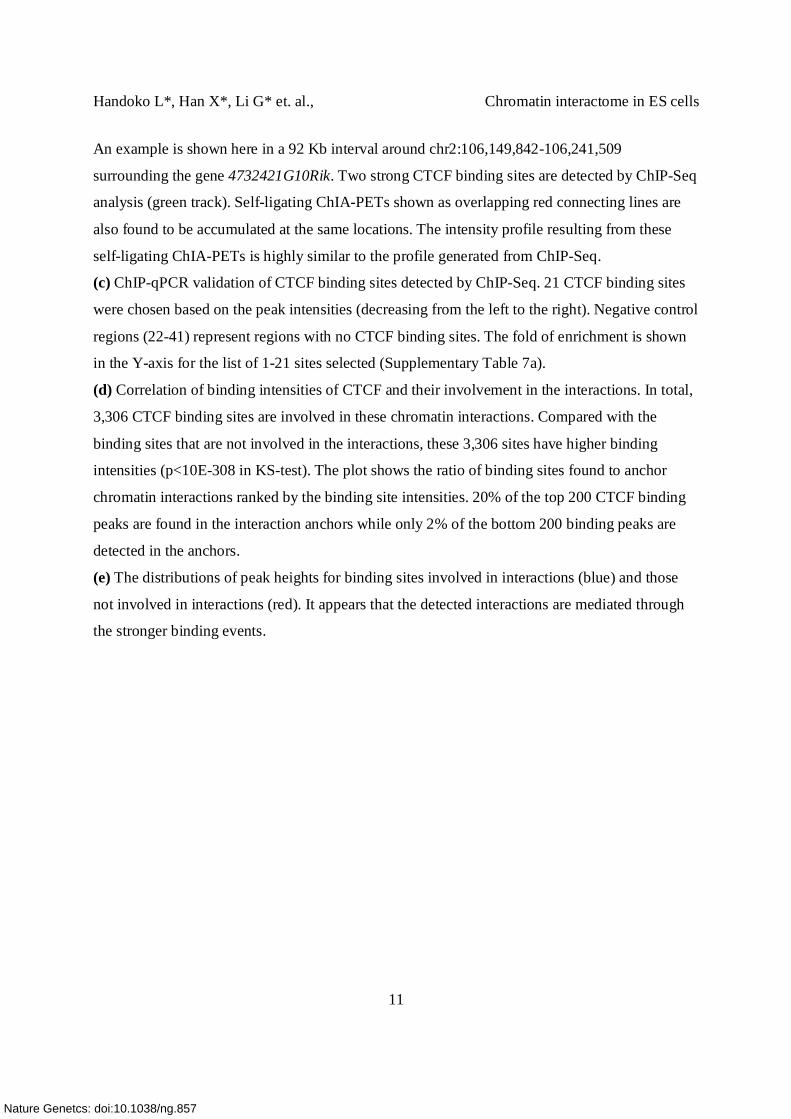
Supplementary Figure 2. Molecular and cytogenetic validation of CTCF directed inter- and
intra-chromosomal interactions.
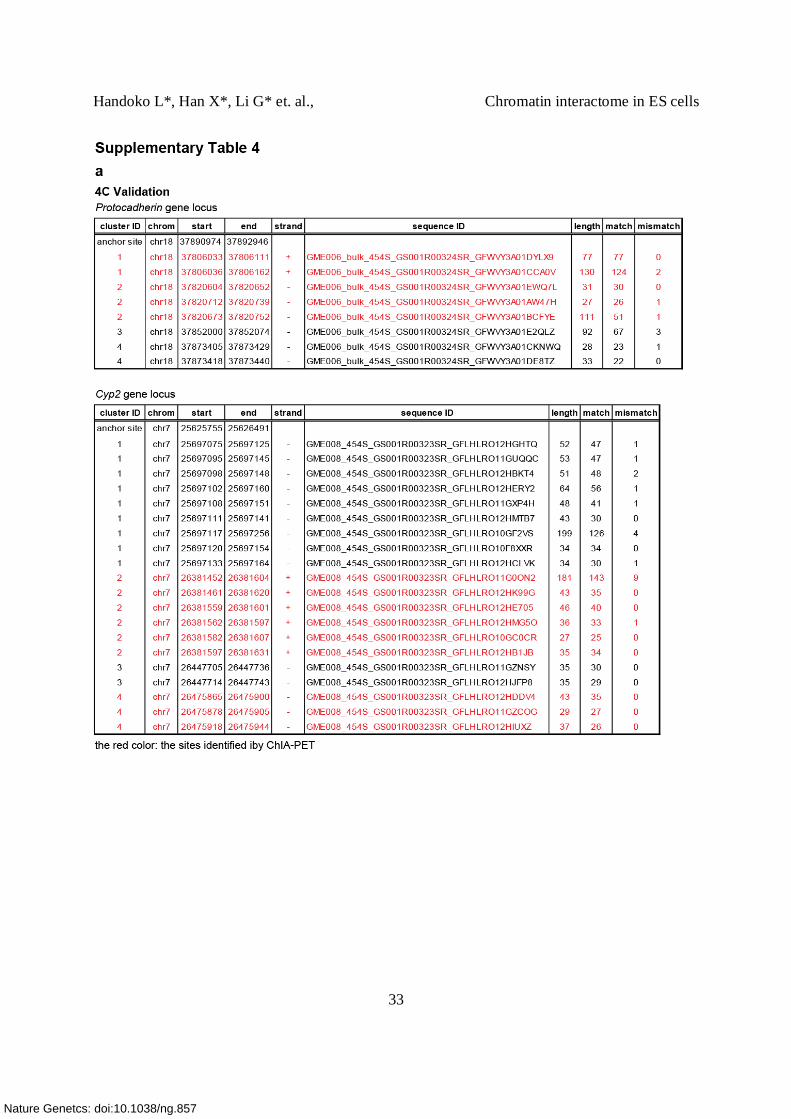
(a) Validation of intra-chromosomal interaction by 4C assay. In the Pcdhga and b locus
(chr18:37792576-37895559), ChIA-PET detected 5 interactions. Using Protocadherin
subfamily A12 promoter (chr18: 37,890,974- 37,892,946) as a 4C bait region or anchor point
(green triangle, ), 4 different intra-chromosomal interactions were detected. Among these 4
clusters, 2 confirmed the interactions detected by ChIA-PET (dashed circles). One interaction is
detected between the Pcdhga12 promoter and the Pcdhgb1 promoter (chr18:37,806,000)
approximately 85 kb upstream. The other interaction (~ 71 kb) is found between the promoter of
Pcdhga12 and Pcdhga4 (chr18: 37,820,000). 4C also detected 2 more intra-chromosomal
interactions anchored by CTCF binding which were missed by ChIA-PET analysis. One of them
occurs between the anchor site, Pcdhga12 promoter, and the promoter of Pcdhga8 which are 40
kb in apart, while the other loop with 20 kb span connects the promoter of Pcdhga12 and of
Pcdhga10 (see Supplementary Table 4a for a list of sites detected by 4C).
Nature Genetcs: doi:10.1038/ng.857
Handoko L*, Han X*, Li G* et. al., Chromatin interactome in ES cells
13
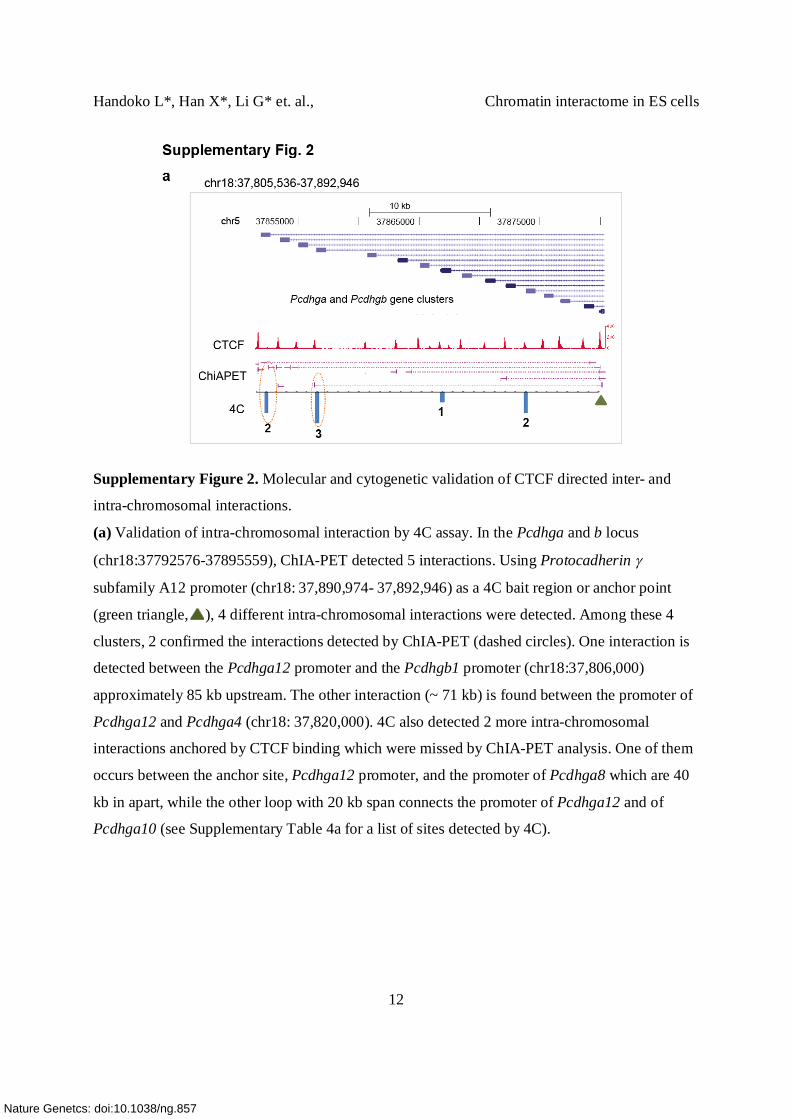
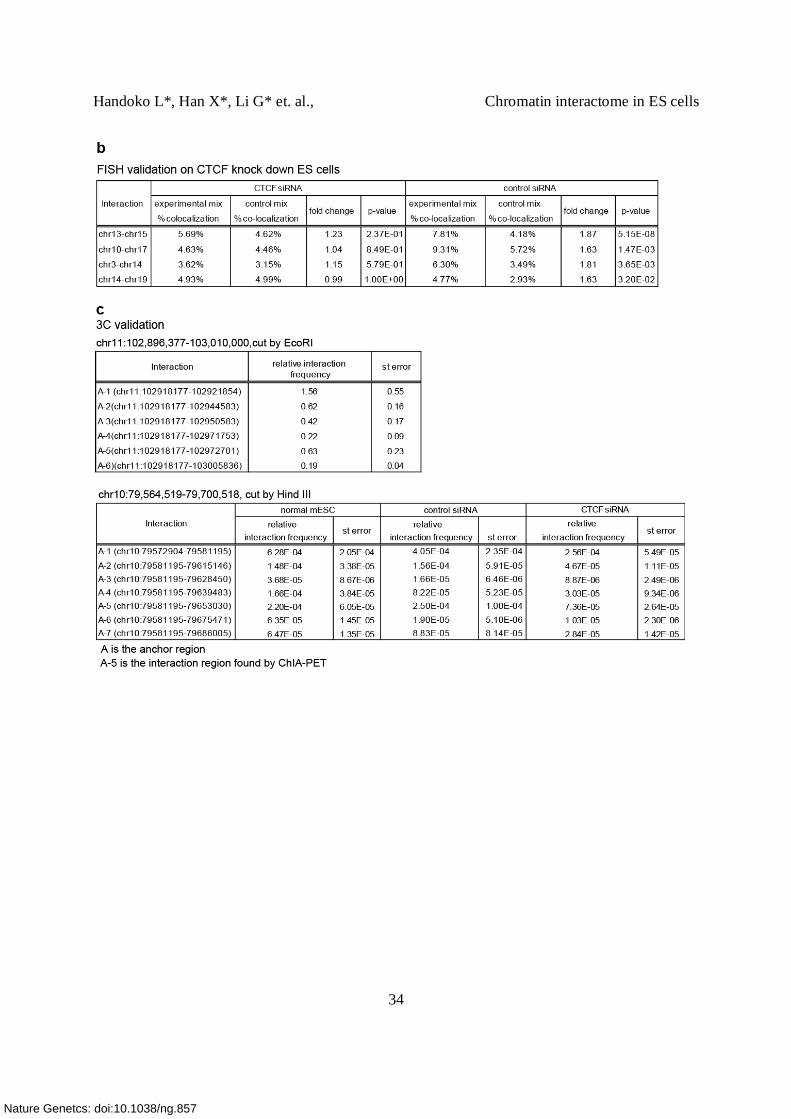
(b) List of inter-chromosomal interaction validated by FISH (Fluorescent In Situ Hybridization)
To validate the inter-chromosomal interactions, we performed DNA FISH cytogenetic assays on
the ES cells. The table shows fourteen inter-chromosomal interactions with cluster size 3
selected for FISH validation. 2 of them have CTCF binding site at one interaction anchor only.
(c) Co-localization ratio distribution (fold change between fusion of two interacting loci and
fusion of the control region) among all sites validated. As a negative control region, we
randomly chose a region on chr16 (chr16:52,100,818-52,400,160) which is > 1 Mb in distance
from any interaction site detected by ChIA-PET. 9 of 14 inter-chromosomal interactions have p-
value <0.05, co-localization ratio > 1.5 and were considered successfully validated. Interactions
1-14 indicate the interactions listed in the table (b).
Nature Genetcs: doi:10.1038/ng.857
Handoko L*, Han X*, Li G* et. al., Chromatin interactome in ES cells
14
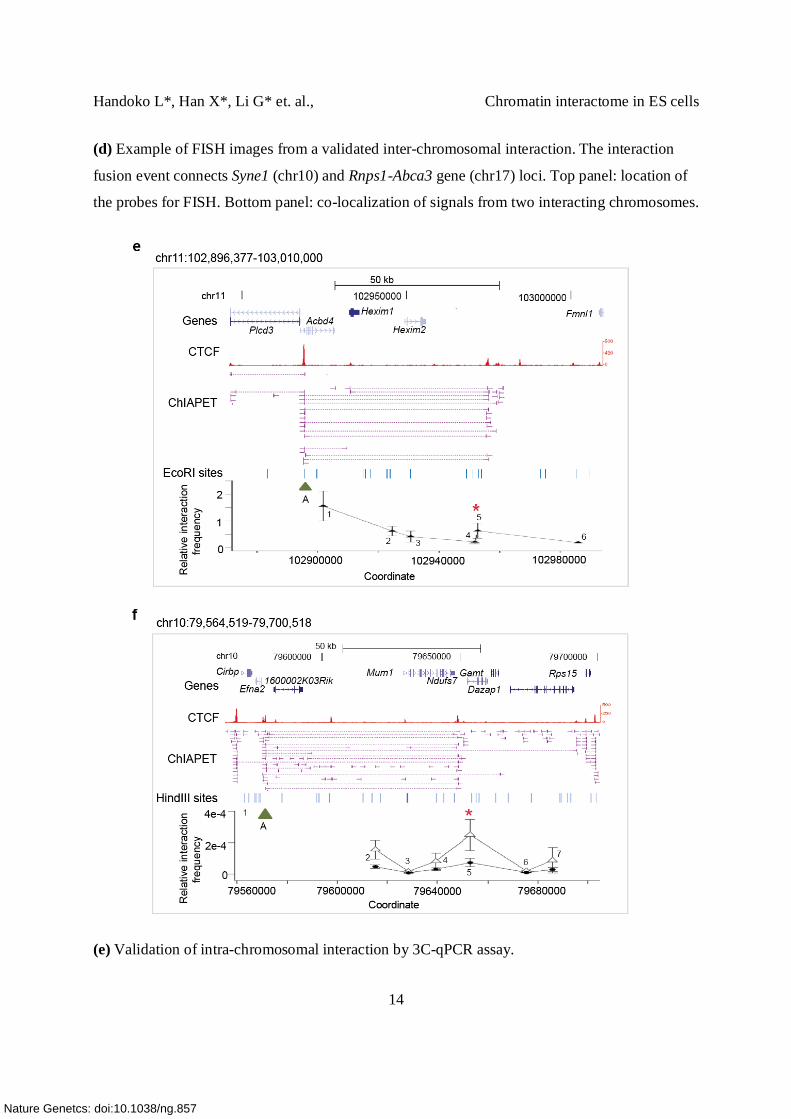
(d) Example of FISH images from a validated inter-chromosomal interaction. The interaction
fusion event connects Syne1 (chr10) and Rnps1-Abca3 gene (chr17) loci. Top panel: location of
the probes for FISH. Bottom panel: co-localization of signals from two interacting chromosomes.
(e) Validation of intra-chromosomal interaction by 3C-qPCR assay.
Nature Genetcs: doi:10.1038/ng.857
Handoko L*, Han X*, Li G* et. al., Chromatin interactome in ES cells
15
DNA looping mediated by CTCF was detected between Acbd4 gene and Hexim1
(chr11:102918935-102975295) (top panel). Chromatin from mouse ES cells was digested with
EcoRI ( EcoRI digestion map is shown in the middle panel, A, 1, 2, …,6 represent the region ~
100 bp from the digested sites and were used to design the primers). As expected, the interaction
formed between the anchor A (green triangle, ) and the nearest region (A-1) which is 4 kb
downstream from the anchor was found to occur at high frequency. Interaction frequency
decreased with the distance to the anchor region, but increased at the region where the loop was
detected (A-5, interaction frequency of 0.6) (all 3C results can be found in Supplementary Table
4c).
(f) Validation of intra-chromosomal interaction by 3C-qPCR assay on CTCF knock down cells.
DNA looping mediated by CTCF was detected between the promoter region of Efna2 and 3’ end
of the Mim1 gene (top panel). In this 3C assay, chromatin from mouse ES cells was digested
with HindIII (middle panel). In the control cells, we observe a high interaction frequency
between A-5 where the loop was detected. In contrast, the interaction between A and 5 was
reduced 3 fold in the CTCF knock down cell (relative interaction frequency in CTCF kd vs.
control cells= 0.000073 vs. 0.00025) (Supplementary Table 4c). This result suggests that the
DNA loop detected here was indeed CTCF-specific. We did however find an overall reduction of
interaction frequency in the other ligated fragments A-1, A-2, A-4 and A-7. Since we used an
independent locus on another chromosome for normalization (Ercc3, chr18), we could exclude
the possibility that the changes resulted from technique variation between samples (digestion and
ligation efficiency). Furthermore, FACS analysis on CTCF kd cells suggests that no changes in
cell cycle or cell death were observed in the CTCF knock down cells, when compared to the
control cells and untreated cells (data not shown). This further ruled out the possibility that the
overall reduction of interaction frequency was due to cell cycle arrest or cell death.
Nature Genetcs: doi:10.1038/ng.857
Handoko L*, Han X*, Li G* et. al., Chromatin interactome in ES cells
16
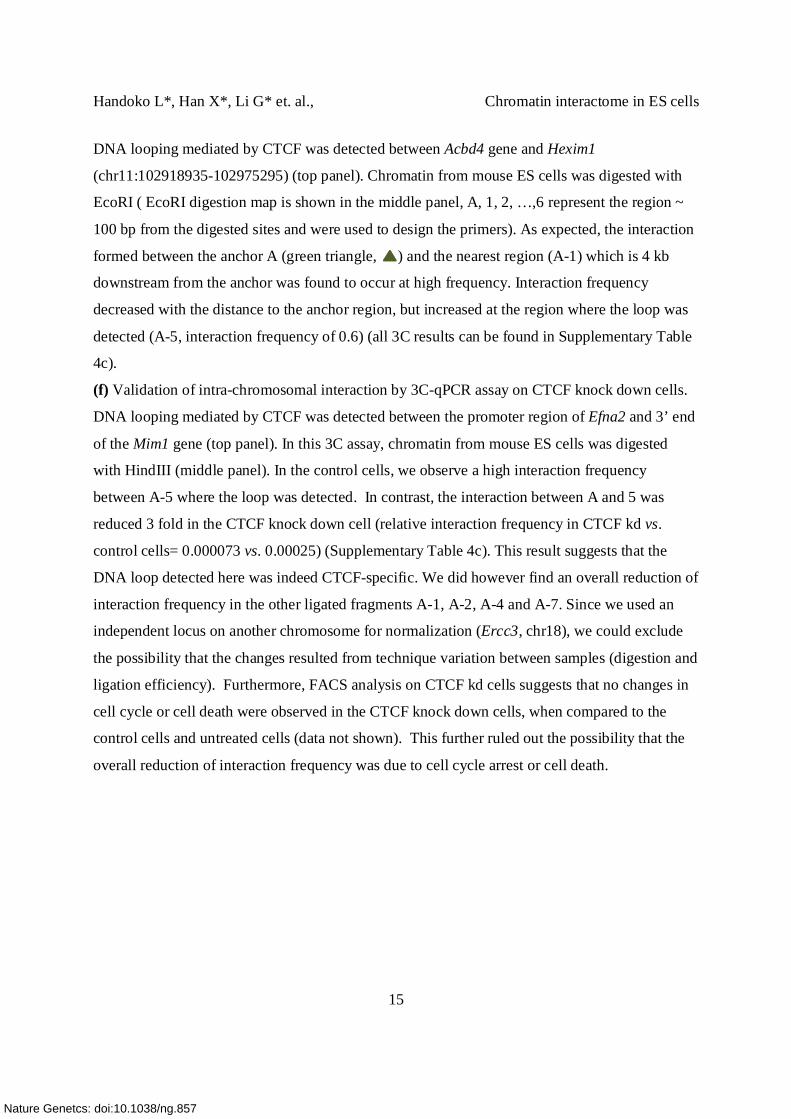
Supplementary Figure 3. Clustering of inter-chromosomal interactions.
(a) Normalized inter-chromosomal interaction frequency matrix between different chromosome
pairs. The normalized frequency is plotted as a heat map and the enriched pairs of high
frequency interactions are displayed here as intense color regions. Significant enrichments are
observed above background between specific chromosome pairs.
(b) Hierarchical clustering of each chromosome pair indicates the spatial relation between
chromosomes. Two or more chromosomes are assumed to be spatially closer to each other if they
interact more frequently. Height represents distance between chromosomes. The clustering
shows that chromosomes 8, 15, 16, 18, which belong to the same subcluster, have more
Nature Genetcs: doi:10.1038/ng.857
Handoko L*, Han X*, Li G* et. al., Chromatin interactome in ES cells
17
interactions and are spatially closer to each other than to the other remaining chromosomes, as
indicated by having the lowest distance/height.
(c) Interaction density matrix of each pair of chromosomes (as shown in a), from two biological
replicates (BR1 and BR2).
Nature Genetcs: doi:10.1038/ng.857
Handoko L*, Han X*, Li G* et. al., Chromatin interactome in ES cells
18
Nature Genetcs: doi:10.1038/ng.857
Handoko L*, Han X*, Li G* et. al., Chromatin interactome in ES cells
19
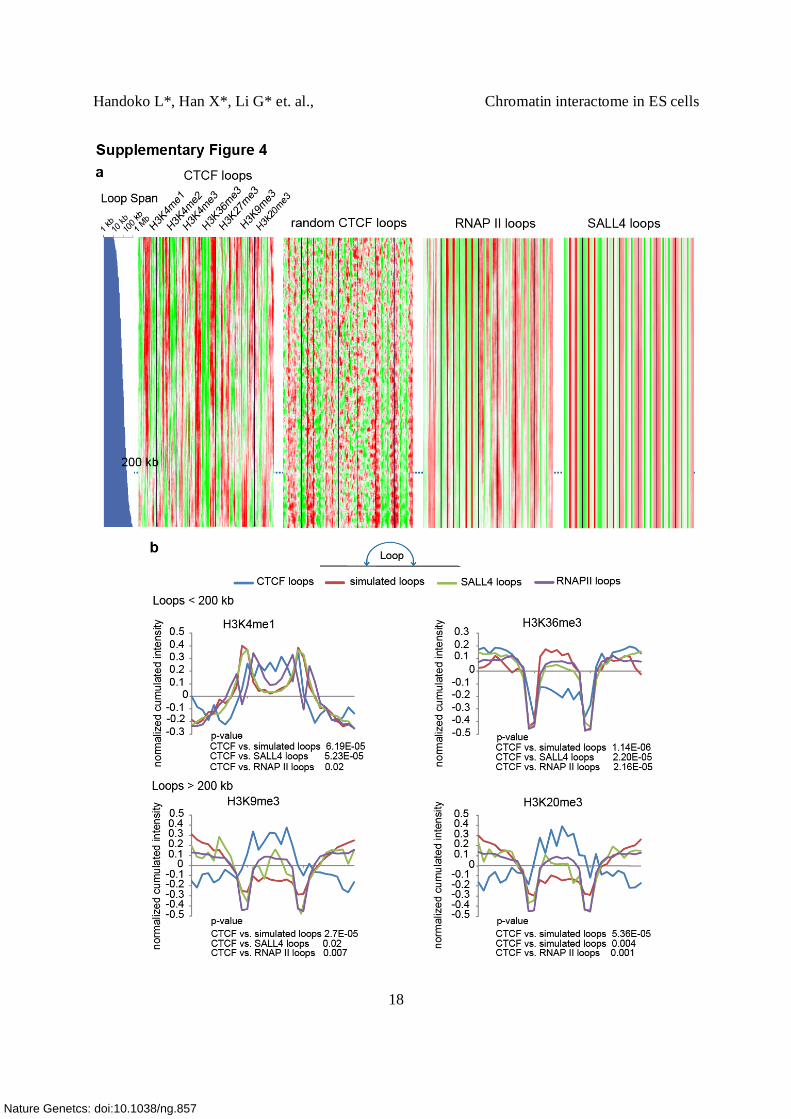
Supplementary Figure 4. Specificity of chromatin domains defined by CTCF-mediated DNA
looping.
(a) Three different sets of control loops were used to determine whether the different chromatin
domains determined from the clustering analysis are specific to CTCF. Histone profiling derived
from CTCF-mediated loops (left), randomly simulated loops (second from the left), SALL4
loops (second from the right) and RNAP II loop (right). 1,622 of RNAP II-associated intra-
chromosomal interactions with cluster size 5 (PET5+ RNAP II) (Supplementary Table 8), 1,636
SALL4-associated intra-chromosomal interaction loops (PET-4+ SALL4) (Supplementary Table
9) and simulated loops randomly paired by CTCF binding sites spanning between 10 Kb to 1 Mb
were selected. Loops were sorted in ascending order of span, and we examined the histone
pattern associated with different span. Each column corresponds to an aligned bin, and each row
corresponds to a loop. A window containing 100 loops was moved vertically to average the
signal. CTCF Loops with span < 200k are mostly active domains (indicated by H3K4me1, and to
lesser degree H3K36me3 enrichments. CTCF loops with span > 200k has clearly different
pattern (K9 and K20 me3). Loops > 200K are mostly repressive domains indicated by H3K9 and
K20 me3 enrichment. As shown, the histone signal intensity patterns defined from CTCF
interactions are unique to the CTCF and not found in RNAP II and SALL4-associated
interactions. Furthermore, the loop span correlation, particularly around 200 Kb, is not observed
in the RNAP II, SALL4 and simulated control interactions.
(b) Histone modification patterns within the chromatin domains are CTCF loop-specific. Top
panel: in CTCF loops less than 200 Kb in size, K4me1 shows significant enrichment (left) and
K36me3 shows significant depletion (right) relative to three different sets of control interactions
(p-values are shown below each graph). Bottom panel: In the CTCF interactions > 200 Kb,
H3K9 (left) & K20 me3 (right) are found to be significantly enriched inside of the loops
compared with the signals found in other control interactions. Therefore, we conclude the histone
modification patterns and chromatin domains uncovered here are unique to the CTCF-associated
interactions.
Nature Genetcs: doi:10.1038/ng.857
Handoko L*, Han X*, Li G* et. al., Chromatin interactome in ES cells
20
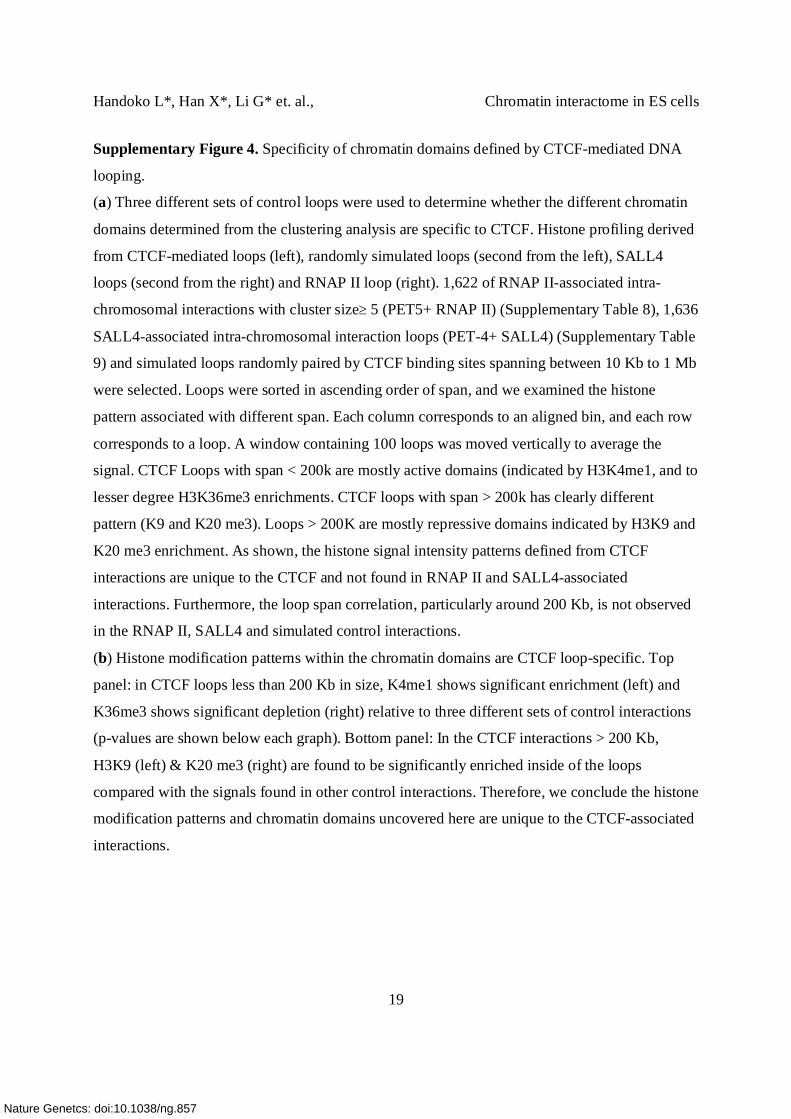
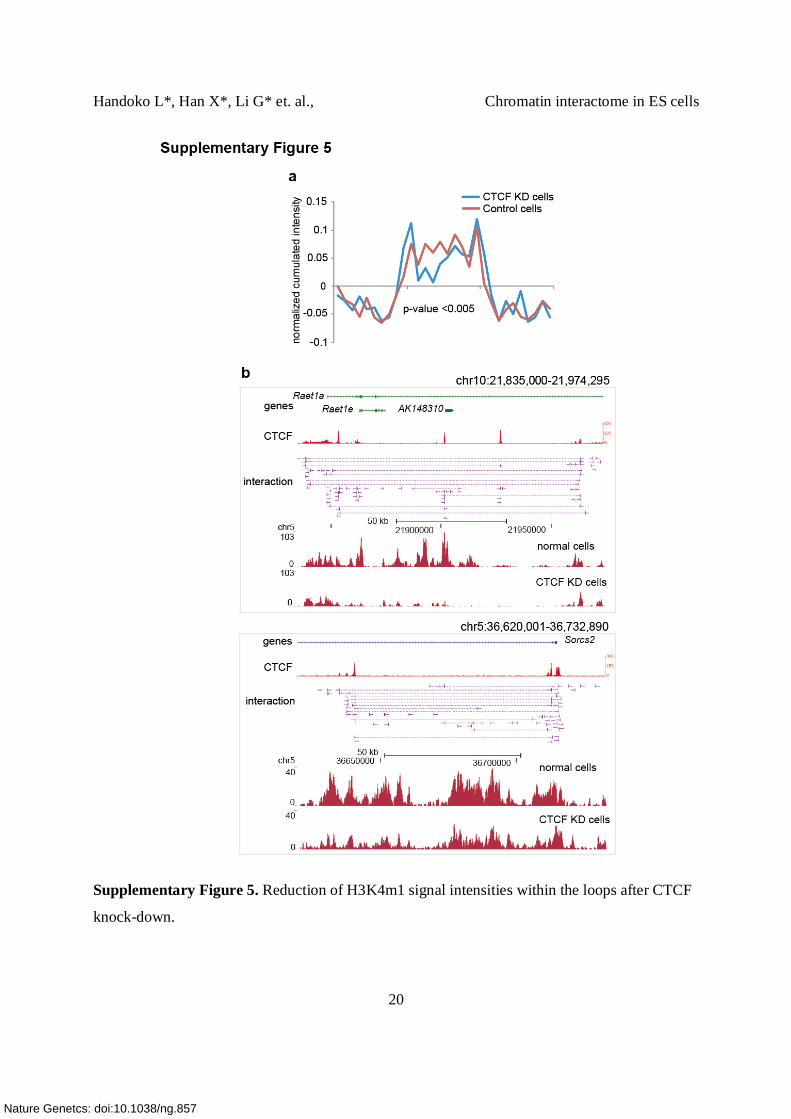
Supplementary Figure 5. Reduction of H3K4m1 signal intensities within the loops after CTCF
knock-down.
Nature Genetcs: doi:10.1038/ng.857
Handoko L*, Han X*, Li G* et. al., Chromatin interactome in ES cells
21
(a) Reduction of CTCF led to decrease in signal intensities of H3K4me1 within active domain
defined by CTCF-associated DNA loop. The accumulated normalized intensity of H3K4me1 is
plotted along the CTCF demarcated chromatin loops and their neighboring regions. The blue line
represents the signals from the CTCF kd cells and the red line represents the signals from the
control siRNA transfected cells.
(b) Examples of the active domains with decreased H3K4me1 level in the CTCF kd cells. Top
panel: DNA looping detected by CTCF, H3K4me1 signals represented by ChIP-seq tag count
distribution are plotted in the middle (control cells) and in the bottom (CTCF kd cells) panels.
The scale was normalized based on the sequencing depth.
Nature Genetcs: doi:10.1038/ng.857
Handoko L*, Han X*, Li G* et. al., Chromatin interactome in ES cells
22
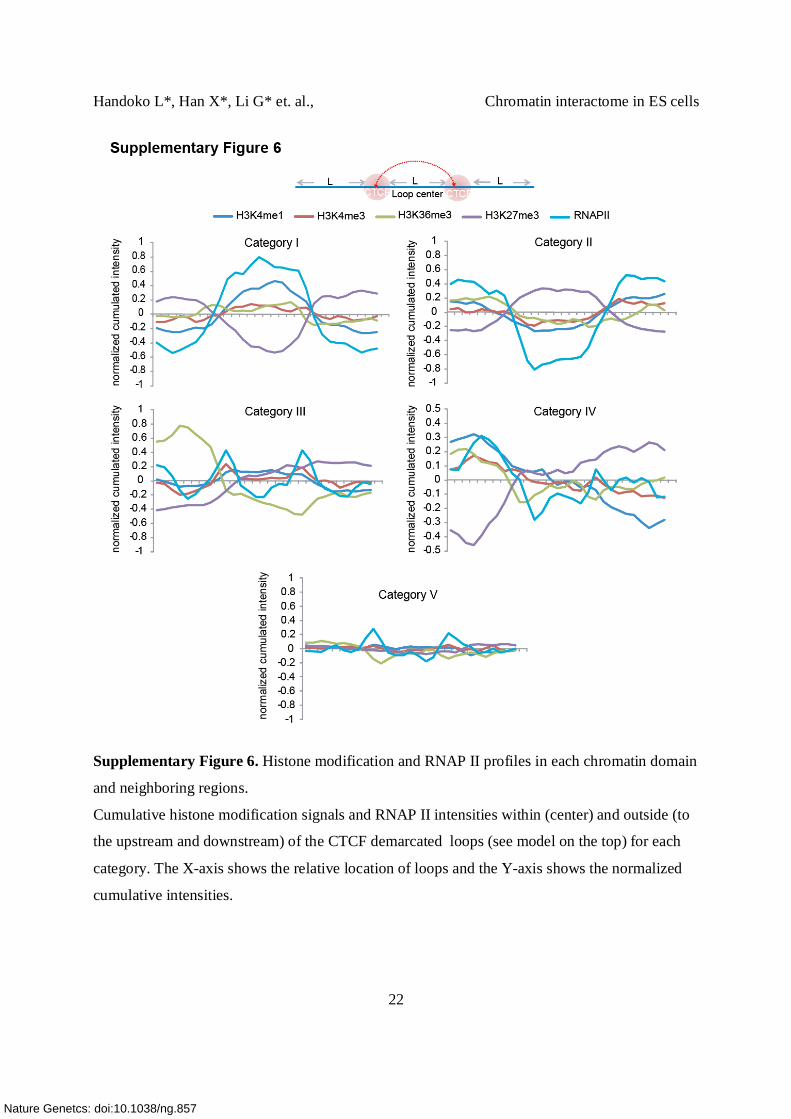
Supplementary Figure 6. Histone modification and RNAP II profiles in each chromatin domain
and neighboring regions.
Cumulative histone modification signals and RNAP II intensities within (center) and outside (to
the upstream and downstream) of the CTCF demarcated loops (see model on the top) for each
category. The X-axis shows the relative location of loops and the Y-axis shows the normalized
cumulative intensities.
Nature Genetcs: doi:10.1038/ng.857

Handoko L*, Han X*, Li G* et. al., Chromatin interactome in ES cells
23
Supplementary Figure 7. Examples of loops from category I-IV.
Examples of loops found in category I-IV at genomic coordinates chr14:53,899,359-54,135,506,
chr19:43,484,753-43,776,079, chr6:83,807,453-83,917,825 and chr7:99,844,767-99,896,702,
respectively. The categories are labeled on the top left corner. The order of the tracks shown
from the top is: genes, CTCF binding peaks, observed interactions and active histone marks
(H3K4m1, m3, H3K36m3), RNAP II profiles and repressive histone marks (H3K27m3 and
H3K9m3).
Nature Genetcs: doi:10.1038/ng.857
Handoko L*, Han X*, Li G* et. al., Chromatin interactome in ES cells
24
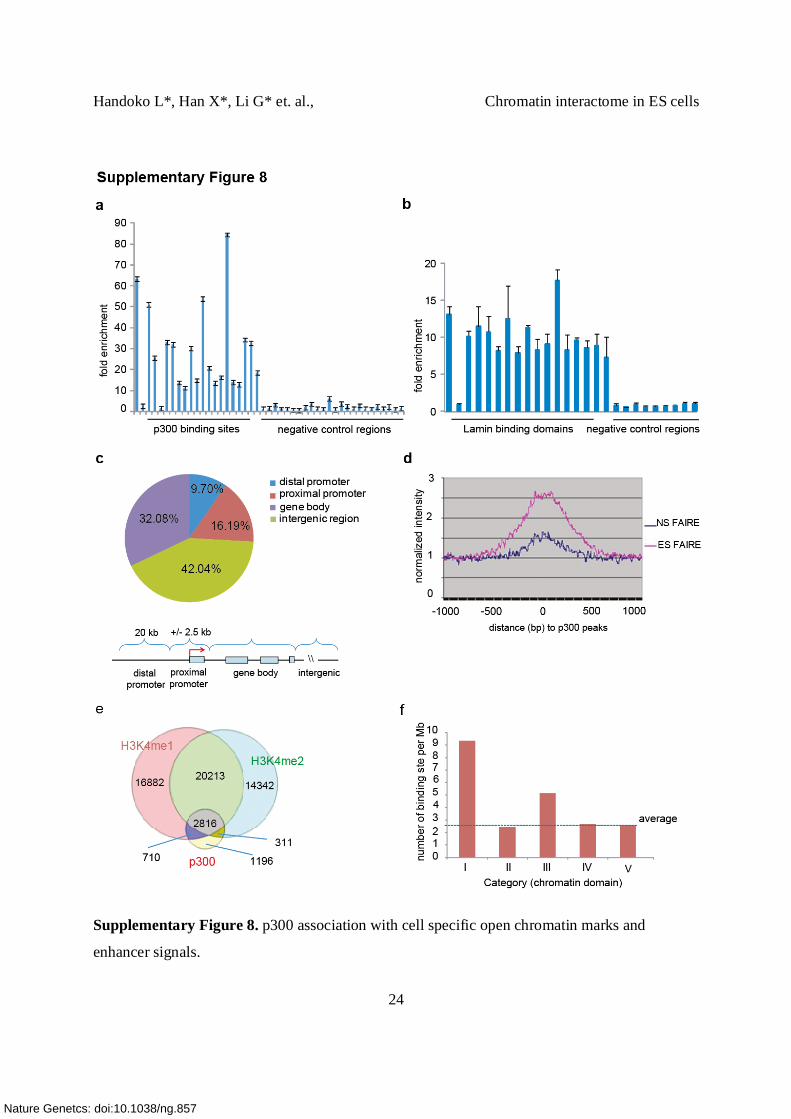
Supplementary Figure 8. p300 association with cell specific open chromatin marks and
enhancer signals.
Nature Genetcs: doi:10.1038/ng.857
Handoko L*, Han X*, Li G* et. al., Chromatin interactome in ES cells
25
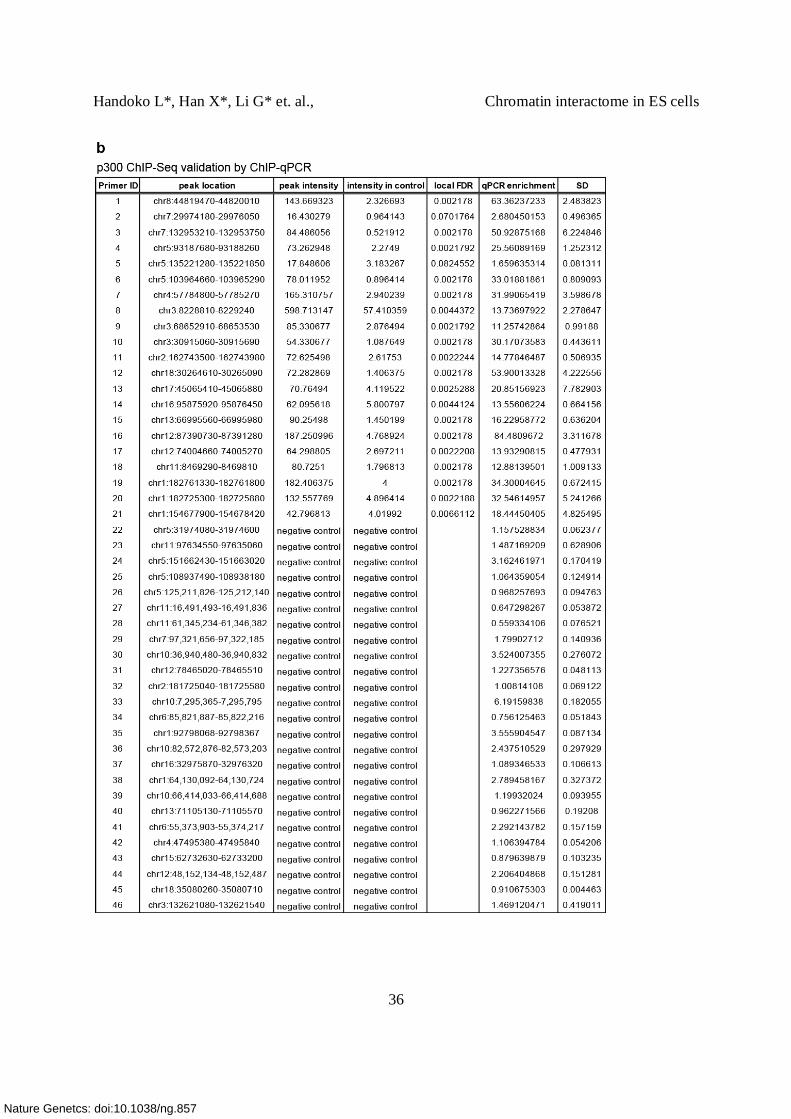
(a) ChIP-qPCR validation of p300 binding sites. The level of enrichment is shown.
21 p300 sites and 25 negative control regions were chosen (Supplementary Table 7b).
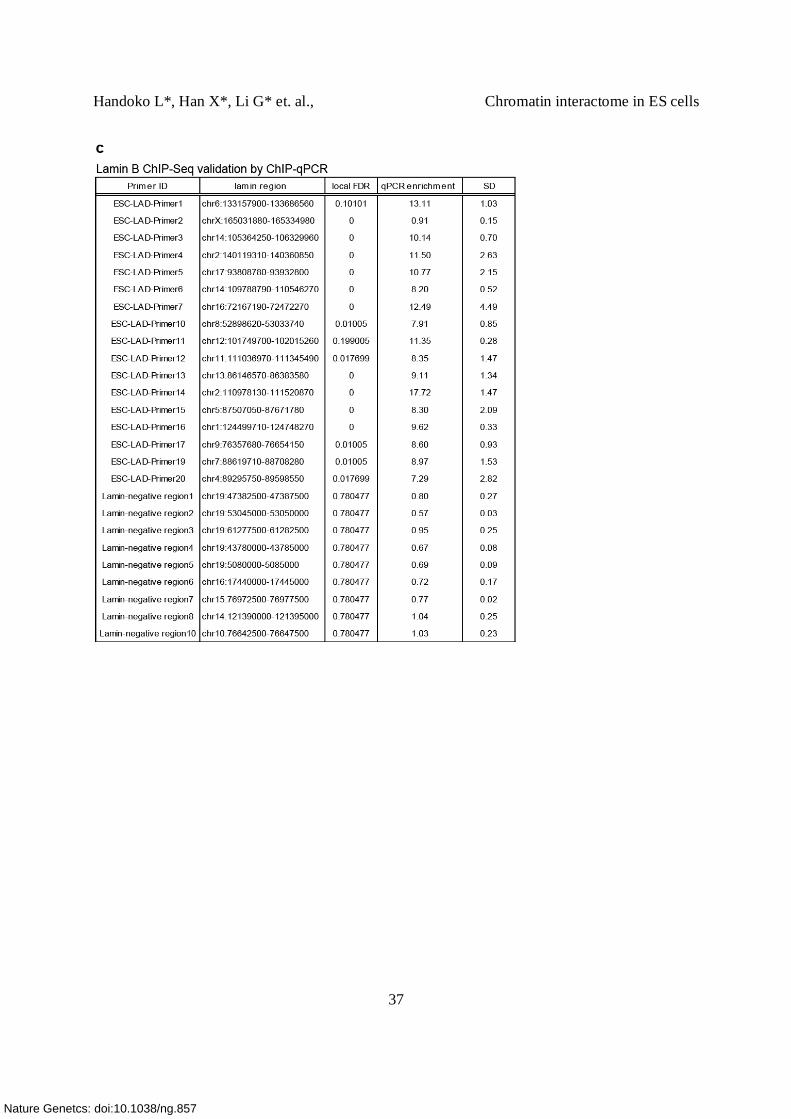
(b) ChIP-qPCR validation of Lamin associated domains (LADs). LADs were selected based on
fold change. 16 of 17 LADs were successfully validated. Nine sites outside LAD were used as
negative controls (Supplementary Table 7c).
(c) Genomic distribution of p300 binding relative to gene locations. The genome was divided
into 4 distinct regions: proximal promoter (± 2.5 kb from well-annotated transcription start
sites/TSS), distal promoter (a region lies between 2.5 kb – 20 kb upstream from TSS), gene body
or intragenic region (2.5 kb downstream from TSS – 2.5 kb downstream from transcription stop
sites) and intergenic region (>20 kb distal from TSS or transcription stop site). ~60% of the p300
sites are associated with gene regions, but largely (>80%) located distal from the proximal
promoters. Only 16 % of p300 binding sites occur in proximal promoter regions.
(d) FAIRE, an open chromatin indicator, signal intensities from ES cells are plotted ± 1Kb of ES
specific p300 binding peaks. ES specific p300 sites were associated with cell specific FAIRE
signals. p300 associated genomic regions exhibited cell specific open chromatin states as
indicated by FAIRE signal.
(e) Venn diagraphs of the overlaps between p300, H3K4me1 and me2 sites in ES cells. Majority
of the p300 binding sites overlap with a subset of enhancer marks H3K4me1 and me2 marks.
70% (3,526/5,033) of ESC-p300 sites overlap with only 9% and 12% of the H3K4me1 sites
found in ES cells. Similarly, only 8% of the H3K4me2 sites found overlap with 62%
(3,127/5,033) of the p300 sites. Therefore, it appears that the repertoire of whole genome p300
sites only represents a subset of enhancers defined by H3K4 methylations. When dissecting
which state(s) of H3K4 methylation best correlate with p300 occupancy, we found that the
majority of the p300 sites overlap with cell specific H3K4me1&me2 co-modified regions. Out of
5,033 p300 sites, 3,837 (76%) overlap with either me1 or me2 and 2,816 (56%) overlap with
regions modified by both H3K4me1&me2.
(f) The enrichment of p300 binding sites in active and enhancer loops
The # of p300 binding sites found per Mb among different categories of CTCF tethered intra-
chromosomal interaction loops. The genomic length of each different category of loop is
normalized.
Nature Genetcs: doi:10.1038/ng.857
Handoko L*, Han X*, Li G* et. al., Chromatin interactome in ES cells
26
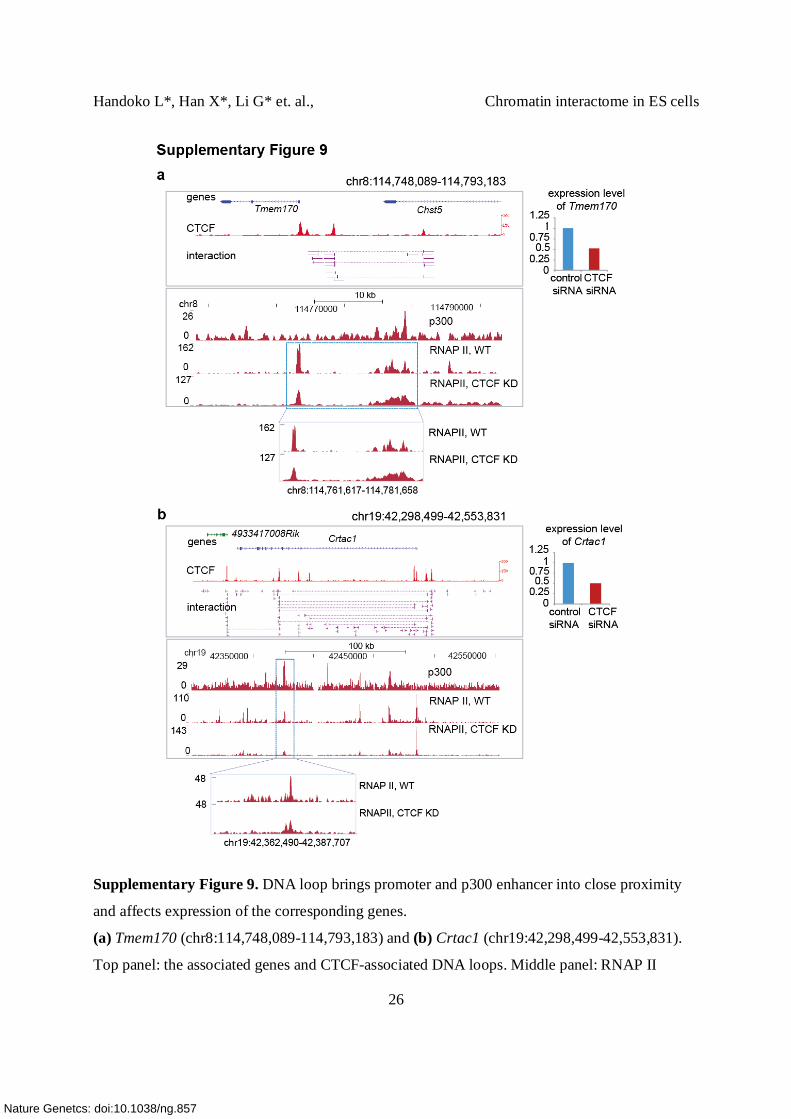
Supplementary Figure 9. DNA loop brings promoter and p300 enhancer into close proximity
and affects expression of the corresponding genes.
(a) Tmem170 (chr8:114,748,089-114,793,183) and (b) Crtac1 (chr19:42,298,499-42,553,831).
Top panel: the associated genes and CTCF-associated DNA loops. Middle panel: RNAP II
Nature Genetcs: doi:10.1038/ng.857
Handoko L*, Han X*, Li G* et. al., Chromatin interactome in ES cells
27
binding was detected at the promoter and the p300 site in the normal cells. Reduced CTCF levels
decreased the binding intensities of RNAP II at the p300 sites and the relative gene expression
(right top panel). Bottom panel: the box shows a detailed view of RNAP II binding at p300 in the
normal control and CTCF kd cells.
Nature Genetcs: doi:10.1038/ng.857
Handoko L*, Han X*, Li G* et. al., Chromatin interactome in ES cells
28
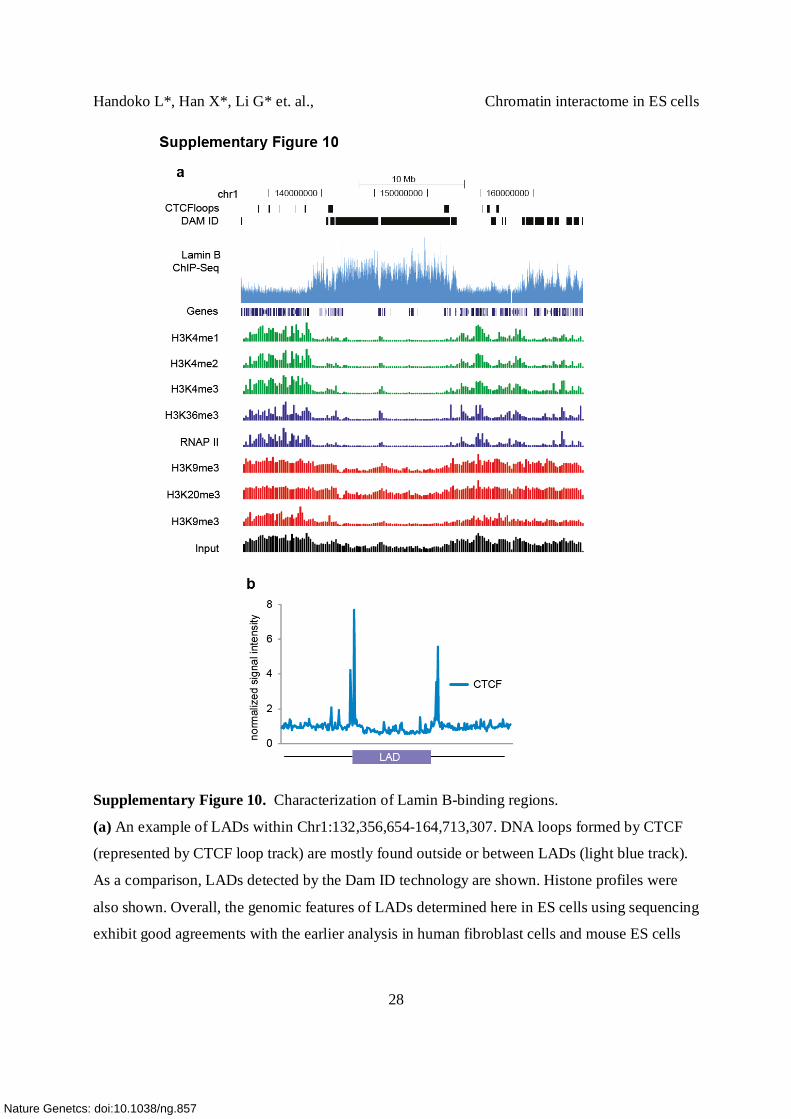
Supplementary Figure 10. Characterization of Lamin B-binding regions.
(a) An example of LADs within Chr1:132,356,654-164,713,307. DNA loops formed by CTCF
(represented by CTCF loop track) are mostly found outside or between LADs (light blue track).
As a comparison, LADs detected by the Dam ID technology are shown. Histone profiles were
also shown. Overall, the genomic features of LADs determined here in ES cells using sequencing
exhibit good agreements with the earlier analysis in human fibroblast cells and mouse ES cells
Nature Genetcs: doi:10.1038/ng.857
Handoko L*, Han X*, Li G* et. al., Chromatin interactome in ES cells
29
using DamID technology; indicating that ChIP-Seq can result in equivalent resolution and should
be feasible to apply for genome wide Lamin study in other cells.
(b) CTCF signals distribution across the LAD borders. Strong enrichment of CTCF signal is
found at the borders of LADs.
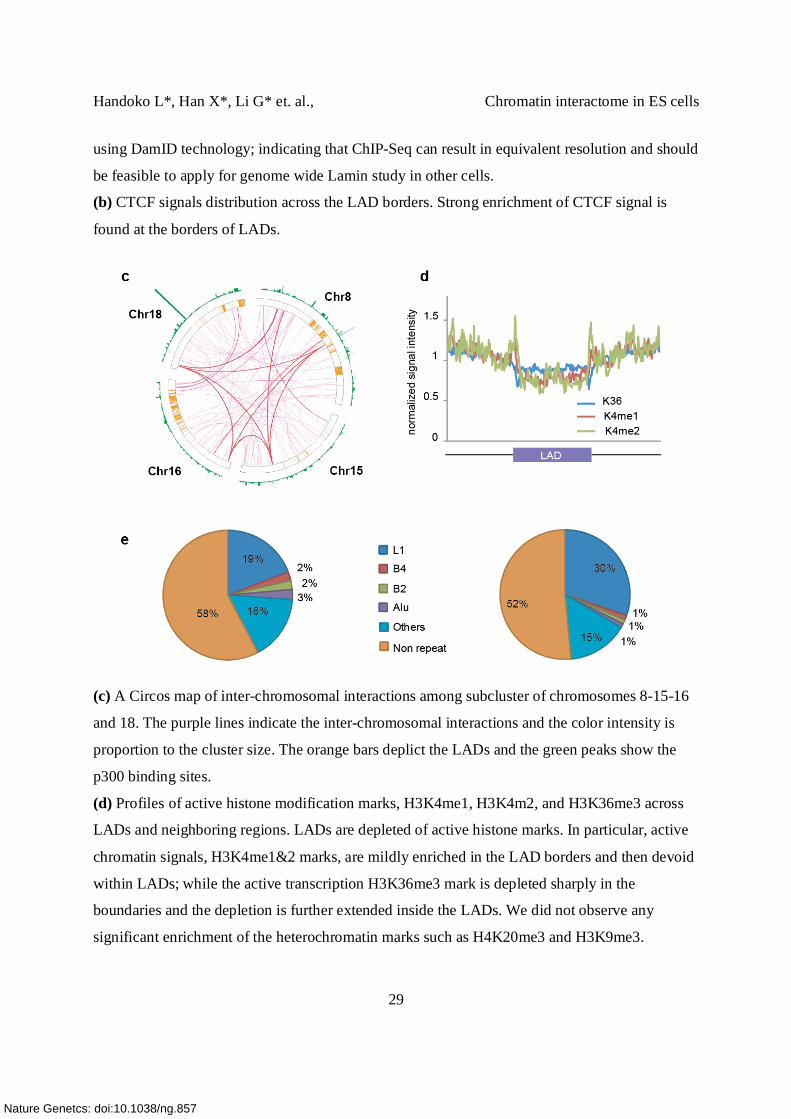
(c) A Circos map of inter-chromosomal interactions among subcluster of chromosomes 8-15-16
and 18. The purple lines indicate the inter-chromosomal interactions and the color intensity is
proportion to the cluster size. The orange bars deplict the LADs and the green peaks show the
p300 binding sites.
(d) Profiles of active histone modification marks, H3K4me1, H3K4m2, and H3K36me3 across
LADs and neighboring regions. LADs are depleted of active histone marks. In particular, active
chromatin signals, H3K4me1&2 marks, are mildly enriched in the LAD borders and then devoid
within LADs; while the active transcription H3K36me3 mark is depleted sharply in the
boundaries and the depletion is further extended inside the LADs. We did not observe any
significant enrichment of the heterochromatin marks such as H4K20me3 and H3K9me3.
Nature Genetcs: doi:10.1038/ng.857
Handoko L*, Han X*, Li G* et. al., Chromatin interactome in ES cells
30
(e) LADs are enriched with repeats. 48.5% of LADs contain repeat sequences. Among the 53
known repeat families, the L1 repeats are significantly enriched within LADs (Z-score 24, 30%
of LADs). The L1 repeat family is one of the largest and most common repeats in the genome.
As a comparison, the repeat distribution in overall genome is shown. Repeat sequences enriched
in LADs could also be involved in regulating the dynamics of transcription factor binding or
gene regulation.
Nature Genetcs: doi:10.1038/ng.857
Handoko L*, Han X*, Li G* et. al., Chromatin interactome in ES cells
31
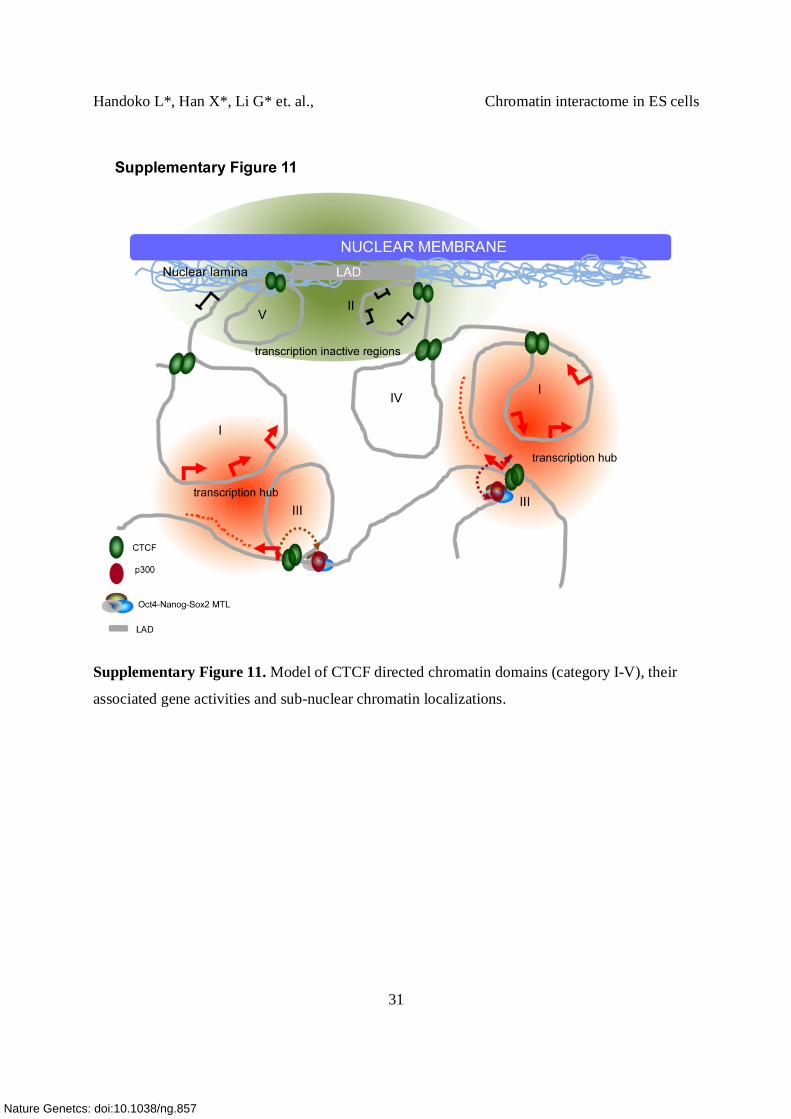
Supplementary Figure 11. Model of CTCF directed chromatin domains (category I-V), their
associated gene activities and sub-nuclear chromatin localizations.
Nature Genetcs: doi:10.1038/ng.857
Handoko L*, Han X*, Li G* et. al., Chromatin interactome in ES cells
32
Supplementary Tables
Nature Genetcs: doi:10.1038/ng.857
Handoko L*, Han X*, Li G* et. al., Chromatin interactome in ES cells
33
Nature Genetcs: doi:10.1038/ng.857
Handoko L*, Han X*, Li G* et. al., Chromatin interactome in ES cells
34
Nature Genetcs: doi:10.1038/ng.857
Handoko L*, Han X*, Li G* et. al., Chromatin interactome in ES cells
35
Nature Genetcs: doi:10.1038/ng.857
Handoko L*, Han X*, Li G* et. al., Chromatin interactome in ES cells
36
Nature Genetcs: doi:10.1038/ng.857
Handoko L*, Han X*, Li G* et. al., Chromatin interactome in ES cells
37
Nature Genetcs: doi:10.1038/ng.857
Handoko L*, Han X*, Li G* et. al., Chromatin interactome in ES cells
38
Nature Genetcs: doi:10.1038/ng.857
Handoko L*, Han X*, Li G* et. al., Chromatin interactome in ES cells
39
Nature Genetcs: doi:10.1038/ng.857
Handoko L*, Han X*, Li G* et. al., Chromatin interactome in ES cells
40
Nature Genetcs: doi:10.1038/ng.857
Handoko L*, Han X*, Li G* et. al., Chromatin interactome in ES cells
41
Nature Genetcs: doi:10.1038/ng.857
Handoko L*, Han X*, Li G* et. al., Chromatin interactome in ES cells
42
Nature Genetcs: doi:10.1038/ng.857


![SUPPLEMENTARY INFORMATION - images.nature.com · PROTHEUS [5] under the A1b scenario for the period 1950-2050. The second regional simulation is the one performed in the framework](https://img.pdfslide.us/doc/110x75/5be36dab09d3f2f02d8ce154/supplementary-information-protheus-5-under-the-a1b-scenario-for-the-period.jpg)