Embed Size (px)
Citation preview

W W W. N A T U R E . C O M / N A T U R E | 1
SUPPLEMENTARY INFORMATIONdoi:10.1038/nature10360
340470
200 pA
10s
387 406 427 445 470 494 520 542 560 590 630 690 470
d
e
c
470 590 470 4055s
200 pA
a
* * ∆ A
bsor
banc
e
b380nm
C128S D156A C128S/D156A480nm
25mOD5min
25mOD2min
25mOD5min
ChR2-EYFP ChR2(D156A)-EYFP ChR2(C128S/D156A)-EYFP
Supplementary Figure 1. Spectral properties of ChR2 mutants C128S, D156A and C128S/D156A.
(a) Sequence comparison showing homology in transmembrane helix 3 of ChR1 (AAL08946), ChR2 (XP_001701725), BR (YP_001689404), VChR1 (ACD70142) and VChR2 (ABZ90903). ChR2 residues C128 and D156 are in red and starred. (b) Monochromatic absorption changes recorded at the indicated wavelength before, during and after illumination with 450 nm light for all three variants, highlighting the distinct stability of the double mutant. (c) Confocal images of cultured hippocampal neurons expressing ChR2-EYFP, ChR2(D156A)-EYFP and ChR2(C128S/D156A)-EYFP (SSFO). (d) Spectral exploration of activation and deactivation of SSFO. The light stimulation protocol consisted of 100ms pulses of blue (470 nm) light interspersed with long (10 s) pulses at various wavelengths during one continuous recording. 590 nm deactivates the channel most e�ectively, but violet light (390-427 nm) deactivates the channel while reducing subsequent capacity to undergo reactivation (compare reactivation pulse marked with red box to reactivation pulse marked with green box). (e) Individual voltage-clamp traces from a cultured hippocampal pyramidal neuron demonstrating SSFO reactivation following a yellow (590 nm) deactivating pulse (left) and following a violet (405 nm) deactivating pulse (right). The reduced capacity for reactivation following the 405 nm light pulse points to a possible photochemical conversion into an inactive side product56 which is not reached with 590nm illumination, consistent with the two-photocycle model described in Stehfest et al.70. These results indicate that in experiments utilizing SSFO, 590 nm light would reset the SSFO channel population to the dark (inactive) state and enable subsequent e�cient reactivation with 470 nm light.
ChR2 LLTCPVILIHLSNLTGLSNDYSRRTMGLLVSDIGT 159ChR1 LLTCPVILIHLSNLTGLANDYNKRTMGLLVSDIGT 198
VChR1LLTCPVLLIHLSNLTGLKDDYSKRTMGLLVSDVGC 154VChR2LLTCPVILIHLSNLTGLKDDYNKRTMRLLVSDVGT 154BR LFTTPLLLLDLALLVDAD---QGTILALVGADGIM 131

SUPPLEMENTARY INFORMATION
2 | W W W. N A T U R E . C O M / N A T U R E
RESEARCH
Cg
PL
IL
DP
midline
ba PV::cre/DIO-SSFO-EYFPSSFO-EYFP
α-PV Ab
Merge c
0
100
PV+cells
50
PV &
YFP
Dou
ble-
labe
led
(%)
YFP+cells
25μm
200μm
Bregma + 1.8mm
Supplementary Figure 2. Targeting SSFO to cortical parvalbumin neurons
(a) High magni�cation confocal images of a 40 µm coronal brain slice from a PV::Cre mouse bilaterally injected with Cre-dependent AAV5-EF1α-DIO-SSFO-EYFP virus (green), and stained with anti-parvalbumin antibody (red). Arrows indicate double-labeled PV neurons identi�ed by membrane-bound EYFP labeling; arrowhead shows PV-positive neuron that did not express detectable levels of SSFO-EYFP. (b) Low-power confocal image of the same slice shown in a, demonstrating spatially restricted expression of the DIO-SSFO virus in mPFC. (c) Percent double-labeled cells out of the entire PV+ cell population, and out of the entire YFP+ cell population as counted from high-magni�cation confocal z-stacks (n = 7 slices from 4 mice; total of 617 PV+ cells counted, 191 YFP+ cells, 169 double-labeled cells). This number is consistent with ~40% PV neurons expressing Cre recombinase in this line and approximately 50% transduction e�ciency of the virus5. Since expression of PV is not uniform across cells, some PV+ neurons might express undetectable levels of PV but still contain su�cient levels of Cre for activating DIO-SSFO expression.
W W W. N A T U R E . C O M / N A T U R E | 3
SUPPLEMENTARY INFORMATION RESEARCH
fe
200μV500μs
10s200 μV
1
Neuron 1
Neuron 2
Neuron 1
Neuron 2
2
CaMKIIα::SSFO
473nm 561nm5
152535
Base
Spik
efr
eque
ncy
(Hz)
Active Inactive
CaMKIIα::SSFOPV::SSFO
a
Bregma +1.8mm
PLIL
BluelaserGreenlaser
Fibersplitter
Tungstenelectrode
-1mm-2mm-3mm-4mm
Optic �berM2Cg
c
10s
CaMKIIα::SSFO
-2.66
D/V(mm)
-2.71
-2.76
-2.81
-2.86
473nm 561nm
*
*
0Spike frequency
Max=14.4Hz
2s20 μV
d
10s Max = 37.2Hz0Spike frequency
-2.1
D/V(mm)
-2.3
-2.5
-2.7
-2.8
473nm 561nm
*
*
PV::SSFO
50 μV2s
50μV500μs
10µV10s
CaMKIIα::SSFOSSFO WPRECaMKIIα eYFP
PV::SSFOWPRESSFO
loxP
lox2722eYFPEF1α
b
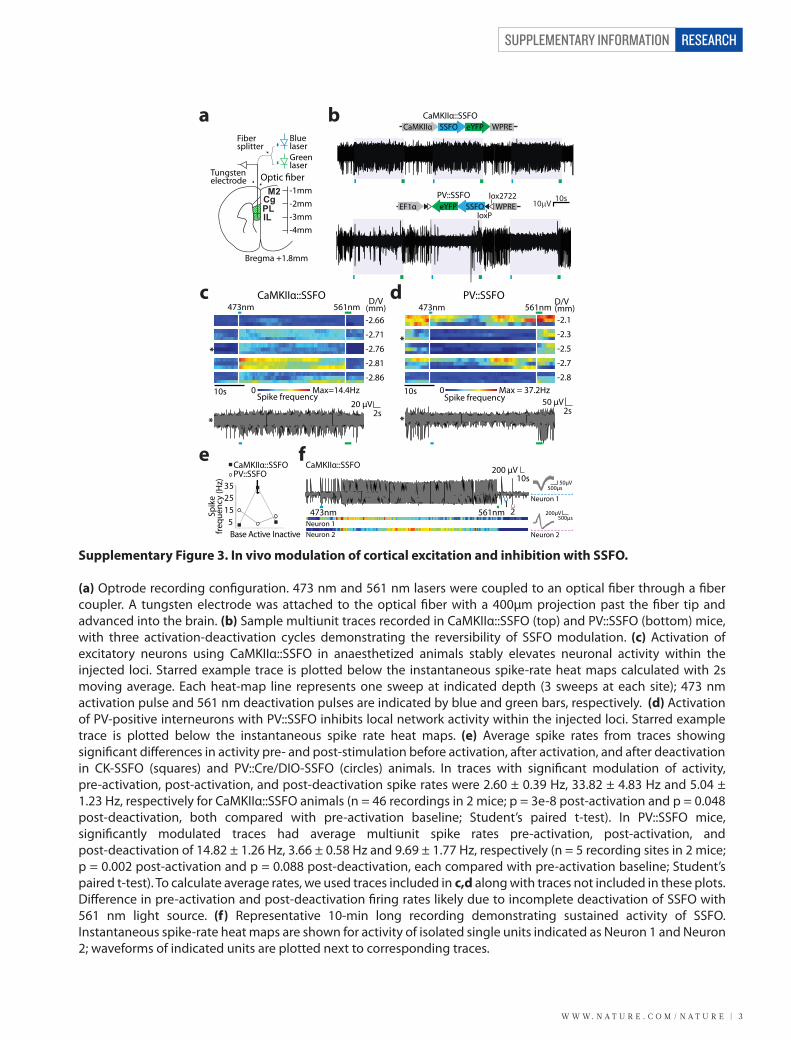
Supplementary Figure 3. In vivo modulation of cortical excitation and inhibition with SSFO.
(a) Optrode recording con�guration. 473 nm and 561 nm lasers were coupled to an optical �ber through a �ber coupler. A tungsten electrode was attached to the optical �ber with a 400μm projection past the �ber tip and advanced into the brain. (b) Sample multiunit traces recorded in CaMKIIα::SSFO (top) and PV::SSFO (bottom) mice, with three activation-deactivation cycles demonstrating the reversibility of SSFO modulation. (c) Activation of excitatory neurons using CaMKIIα::SSFO in anaesthetized animals stably elevates neuronal activity within the injected loci. Starred example trace is plotted below the instantaneous spike-rate heat maps calculated with 2s moving average. Each heat-map line represents one sweep at indicated depth (3 sweeps at each site); 473 nm activation pulse and 561 nm deactivation pulses are indicated by blue and green bars, respectively. (d) Activation of PV-positive interneurons with PV::SSFO inhibits local network activity within the injected loci. Starred example trace is plotted below the instantaneous spike rate heat maps. (e) Average spike rates from traces showing signi�cant di�erences in activity pre- and post-stimulation before activation, after activation, and after deactivation in CK-SSFO (squares) and PV::Cre/DIO-SSFO (circles) animals. In traces with signi�cant modulation of activity, pre-activation, post-activation, and post-deactivation spike rates were 2.60 ± 0.39 Hz, 33.82 ± 4.83 Hz and 5.04 ± 1.23 Hz, respectively for CaMKIIα::SSFO animals (n = 46 recordings in 2 mice; p = 3e-8 post-activation and p = 0.048 post-deactivation, both compared with pre-activation baseline; Student’s paired t-test). In PV::SSFO mice, signi�cantly modulated traces had average multiunit spike rates pre-activation, post-activation, and post-deactivation of 14.82 ± 1.26 Hz, 3.66 ± 0.58 Hz and 9.69 ± 1.77 Hz, respectively (n = 5 recording sites in 2 mice; p = 0.002 post-activation and p = 0.088 post-deactivation, each compared with pre-activation baseline; Student’s paired t-test). To calculate average rates, we used traces included in c,d along with traces not included in these plots. Di�erence in pre-activation and post-deactivation �ring rates likely due to incomplete deactivation of SSFO with 561 nm light source. (f) Representative 10-min long recording demonstrating sustained activity of SSFO. Instantaneous spike-rate heat maps are shown for activity of isolated single units indicated as Neuron 1 and Neuron 2; waveforms of indicated units are plotted next to corresponding traces.

SUPPLEMENTARY INFORMATION
4 | W W W. N A T U R E . C O M / N A T U R E
RESEARCH
0
800-74 mV
Inje
cted
Curr
ent
(pA
)
16 Hz 8 Hz 16 Hz 8 Hz 32 Hz 32 Hz 24 Hz 24 Hz 8 Hz 0 Hz 304 Hz 296 Hz 304 Hz 288 Hz 496 Hz 480 Hz 480 Hz 464 Hz 280 Hz 280 Hz
40 ms20 mV
Output (spike) rateInput (sEPSC) rate
20 40 60 80 100
e
h i
Time Bin Width (ms) Input Rate Bin Width (Hz)
Mea
n M
utua
lIn
form
atio
n (b
its)
Mea
n M
utua
lIn
form
atio
n (b
its)
100 200 300 400 5000
0.2
0.6
1
0
0.2
0.6
1
******
** **** ** ***
*
*
CaMKIIα::SSFO CaMKIIα::SSFO
Baseline 1s 470 nmBaseline 1s 470 nm
a b
c
d
f g
Non-expressing L2/3 PYR (in 20µM Cch)
1
1
2
2
3
3
CNQX+APV
20 mV1s
470nm 590nm
470nm 590nm
-70 mV
PYR PYR
4 mV0.2 s
SSFO L2/3 PYR (in 20mM Cch)
2s10 mV
12
473nm 590 nm-72 mV
PYR
AverageExpressing PYRBase 1s 470nm
Mut
ual
info
rmat
ion
(bits
)
0
0.4
0.8
1.2**
sEPSC Rate (Hz)
Spik
e Ra
te (H
z)
Baseline 1s 470nm
05
10152025
251252253254250
200
400
600
Satu
rati
on
po
int (
Hz)
Dyn
amic
ran
ge
(Hz)
0
10
20
30
40
*
*
PYR
Baseline-70 mv
-60.8 mvAfter 1s 470nm
20 mV0.2s
4 mV0.2 s
1
2
3
3
Supplementary Figure 4. SSFO activation in pyramidal cells increases network activity and impairs information transmission through principal neurons.
(a) Whole cell recording from a layer 2/3 pyramidal neuron expressing SSFO in a prefrontal cortical slice from a mouse injected with AAV5-CaMKIIα-SSFO-EYFP. Activation with 470 nm light (blue bar) triggered depolarization of the recorded cell. Inset compares expanded 2s periods pre-activation (1), post-activation (2) and post-deactivation (3). (b) Whole cell recording in a non-expressing pyramidal neuron from a slice expressing CaMKIIα-SSFO-EYFP shows increased synaptic activity (top) following a 1 s 470 nm light pulse, which is eliminated by excitatory synaptic blockers CNQX (10 µM) and APV (25 µM; bottom). Inset compares activity pre-activation (1), post-activation (2), and post-deactivation (3). (c) Quanti�cation of input-output (IO) transformations in cortical pyramidal cells using injected sEPSCs. Injected current trace shows sEPSCs delivered to patched neuron. Upper trace shows current clamp recording with spikes resulting from injected sEPSCs. Bottom row shows the input sEPSC (blue) and output spike (red) rates within the corresponding 125 ms time bins. Input-output samples from the full protocol were used to construct an IO curve and to compute the mutual information between input and output rate. (d) Representative traces showing response of a CaMKIIα::SSFO-EYFP expressing cell to injection of an identical de�ned pattern of sEPSCs before (top) and after (bottom) blue light activation. Resting membrane potential for each trace is indicated. Average depolarization of the recorded cells during SSFO activation was 9.8 ± 1.4 mV (n = 7 cells) and this depolarization was stably maintained throughout the experiment. (e) Input-output curve for a pyramidal neuron expressing SSFO, showing reduced response to higher sEPSC rates after SSFO activation (pre-stimulation: black; post-stimulation: blue; error bars show s.e.m). (f) Quanti�cation of IO curve dynamic range and saturation at baseline and after 1 s blue light activation. Dynamic range was de�ned as the range of spike rates exhibited by recorded neurons; saturation was de�ned as the sEPSC rate for which spike rates in individual curves reached 90% of within-condition maximum. The decrease in both these measures likely resulted from increased synaptic activity and plateau depolarization by SSFO. (g) Cell-by-cell reduction in transmitted mutual (EPSC-spike) information in 6 individual pyramidal cells expressing SSFO following the 1s 470 nm pulse. Average MI is shown in black (mean ± s.e.m; p = 0.0063, Student’s t-test; reduction in mutation information between spike rate and injected sEPSC rate obtained within 125 ms windows). (h) Mean mutual information across cells in baseline vs. SSFO-activated conditions across a range of time bin widths used for calculating mutual information (see Supplementary Methods). For these comparisons, the bin width of input sEPSC rate was kept constant at 50 Hz. Asterisks indicate the signi�cance of the change in mutual information in SSFO-activated conditions (paired t-test). (i) Same as in h, but with varying input sEPSC rate bins. Here the time bin width was kept constant at 125 ms. All graphs depict mean ± s.e.m. (* p < 0.05; ** p < 0.01).
W W W. N A T U R E . C O M / N A T U R E | 5
SUPPLEMENTARY INFORMATION RESEARCH
0 100 200 300 400 500-1
-0.8-0.6-0.4-0.2
0
f g
h20 40 60 80 100
Input Rate Bin Width (Hz)
Mea
n M
utua
lIn
form
atio
n (b
its)
0
Input Rate Bin Width (Hz)20 40 60 80 1000
0.2
0.6
1
100 200 300 400 5000
0.2
0.6
1
Time Bin Width (ms)
Time Bin Width (ms)
Mea
n M
utua
lIn
form
atio
n (b
its)
Mea
n Ch
ange
in M
utua
lIn
form
atio
n (b
its)
-1-0.8-0.6-0.4-0.2
0
Mea
n Ch
ange
in M
utua
lIn
form
atio
n (b
its)
*
* *
** * * *
**
*****
PV::SSFO PV::SSFO
CK::SSFO PV::SSFOCK::SSFO PV::SSFO
a
b
Non-expressing L2/3 PYR (in 20µM Cch)
2s20 mV 0.2s
2 mV1
2
31 2 3
473nm 590nm-65 mV
PV
PYR
ec d
Baseline 1s 470nmAverageNon-Expressing PYR
Base 1s 470nm
Mut
ual
info
rmat
ion
(bits
)
p > 0.05
0
0.4
0.8
1.2
Spik
e Ra
te (H
z)
251252253254250
10
20
30
40
sEPSC Rate (Hz)
Dyn
amic
ran
ge
(Hz)
0
10
20
30
40
0
200
400
600
Satu
rati
on
po
int (
Hz)
*
-70 mv
-72.4 mv
Baseline
After 1s 470nm
20 mV0.2s
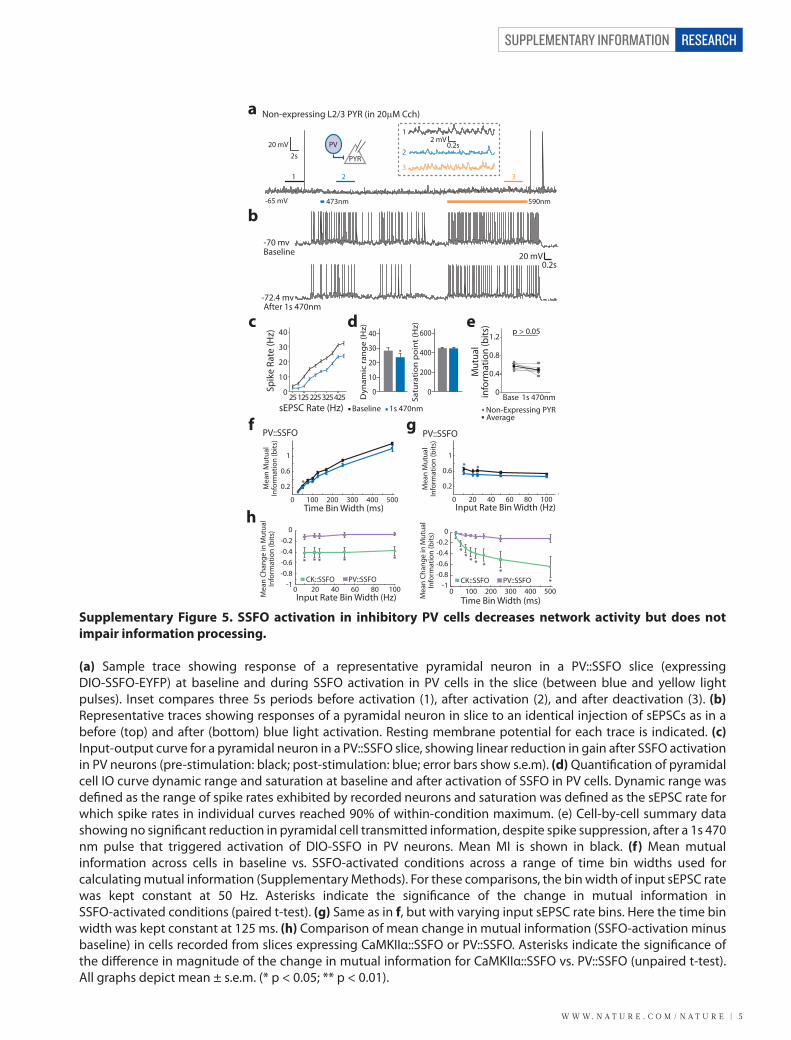
Supplementary Figure 5. SSFO activation in inhibitory PV cells decreases network activity but does not impair information processing.
(a) Sample trace showing response of a representative pyramidal neuron in a PV::SSFO slice (expressing DIO-SSFO-EYFP) at baseline and during SSFO activation in PV cells in the slice (between blue and yellow light pulses). Inset compares three 5s periods before activation (1), after activation (2), and after deactivation (3). (b) Representative traces showing responses of a pyramidal neuron in slice to an identical injection of sEPSCs as in a before (top) and after (bottom) blue light activation. Resting membrane potential for each trace is indicated. (c) Input-output curve for a pyramidal neuron in a PV::SSFO slice, showing linear reduction in gain after SSFO activation in PV neurons (pre-stimulation: black; post-stimulation: blue; error bars show s.e.m). (d) Quanti�cation of pyramidal cell IO curve dynamic range and saturation at baseline and after activation of SSFO in PV cells. Dynamic range was de�ned as the range of spike rates exhibited by recorded neurons and saturation was de�ned as the sEPSC rate for which spike rates in individual curves reached 90% of within-condition maximum. (e) Cell-by-cell summary data showing no signi�cant reduction in pyramidal cell transmitted information, despite spike suppression, after a 1s 470 nm pulse that triggered activation of DIO-SSFO in PV neurons. Mean MI is shown in black. (f) Mean mutual information across cells in baseline vs. SSFO-activated conditions across a range of time bin widths used for calculating mutual information (Supplementary Methods). For these comparisons, the bin width of input sEPSC rate was kept constant at 50 Hz. Asterisks indicate the signi�cance of the change in mutual information in SSFO-activated conditions (paired t-test). (g) Same as in f, but with varying input sEPSC rate bins. Here the time bin width was kept constant at 125 ms. (h) Comparison of mean change in mutual information (SSFO-activation minus baseline) in cells recorded from slices expressing CaMKIIα::SSFO or PV::SSFO. Asterisks indicate the signi�cance of the di�erence in magnitude of the change in mutual information for CaMKIIα::SSFO vs. PV::SSFO (unpaired t-test). All graphs depict mean ± s.e.m. (* p < 0.05; ** p < 0.01).
SUPPLEMENTARY INFORMATION
6 | W W W. N A T U R E . C O M / N A T U R E
RESEARCH
ControlCK::YFP
0
1
2
3
4
5
Velo
city
(cm
/s)
0
5
10
15
20
Tim
e in
cen
ter (
%)
CK::YFPCK::SSFO
CaMKIIα::YFP Open Fieldb
2s 470nmNo light 2s 470nmNo light
No light 2s 470nm
Open armClosed Arm
Elevated Plus Maze
c
0
200
400
600
800
Tim
e (s
)
PFCCK::SSFO
V1CK::SSFO
d
Condition Test24h
Context Tone
Tim
e fr
eezi
ng (%
)
0
60
80
594nm on
Conditioned LearningCK::eNpHR3.0
PV::eNpHR3.0Control
**
0
100
200
300
400
500
600
c-fo
s po
sitiv
e ce
lls (#
)
a
IL M2 M1 Nacc S1 S2 BLA CA1 V1PL
*
CaMKIIα::EYFP IpsilateralCaMKIIα::SSFO
CaMKIIα::EYFPCaMKIIα::SSFO
Contralateral
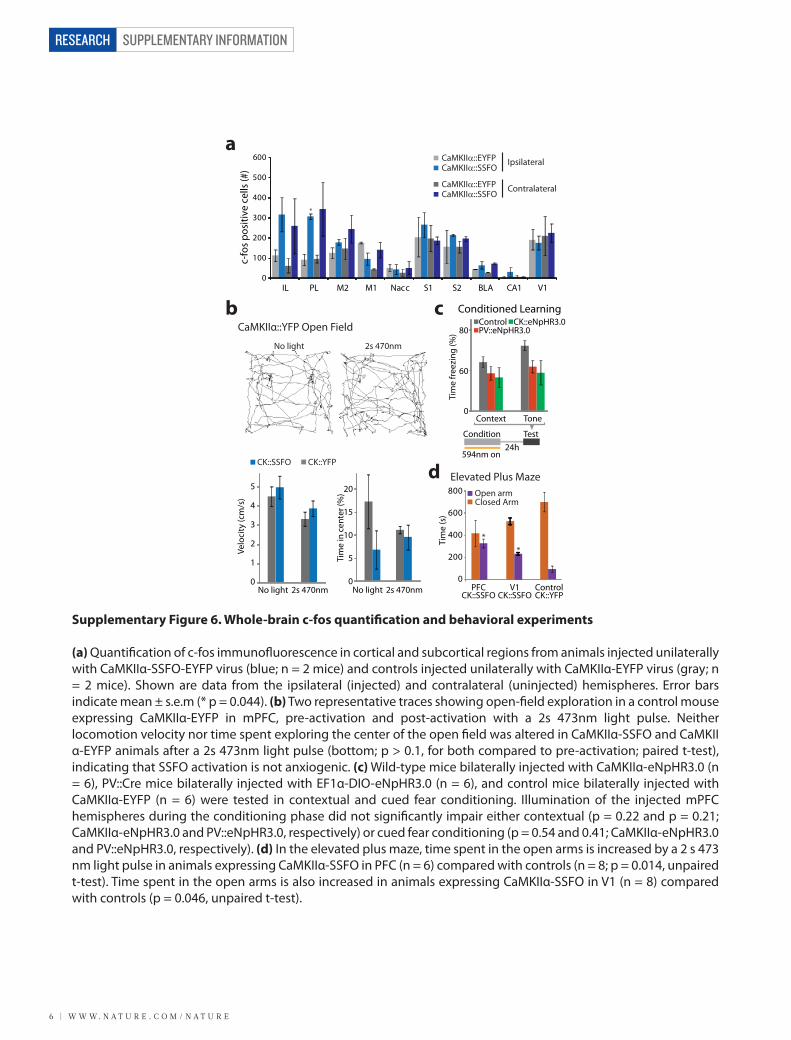
Supplementary Figure 6. Whole-brain c-fos quanti�cation and behavioral experiments
(a) Quanti�cation of c-fos immuno�uorescence in cortical and subcortical regions from animals injected unilaterally with CaMKIIα-SSFO-EYFP virus (blue; n = 2 mice) and controls injected unilaterally with CaMKIIα-EYFP virus (gray; n = 2 mice). Shown are data from the ipsilateral (injected) and contralateral (uninjected) hemispheres. Error bars indicate mean ± s.e.m (* p = 0.044). (b) Two representative traces showing open-�eld exploration in a control mouse expressing CaMKIIα-EYFP in mPFC, pre-activation and post-activation with a 2s 473nm light pulse. Neither locomotion velocity nor time spent exploring the center of the open �eld was altered in CaMKIIα-SSFO and CaMKIIα-EYFP animals after a 2s 473nm light pulse (bottom; p > 0.1, for both compared to pre-activation; paired t-test), indicating that SSFO activation is not anxiogenic. (c) Wild-type mice bilaterally injected with CaMKIIα-eNpHR3.0 (n = 6), PV::Cre mice bilaterally injected with EF1α-DIO-eNpHR3.0 (n = 6), and control mice bilaterally injected with CaMKIIα-EYFP (n = 6) were tested in contextual and cued fear conditioning. Illumination of the injected mPFC hemispheres during the conditioning phase did not signi�cantly impair either contextual (p = 0.22 and p = 0.21; CaMKIIα-eNpHR3.0 and PV::eNpHR3.0, respectively) or cued fear conditioning (p = 0.54 and 0.41; CaMKIIα-eNpHR3.0 and PV::eNpHR3.0, respectively). (d) In the elevated plus maze, time spent in the open arms is increased by a 2 s 473 nm light pulse in animals expressing CaMKIIα-SSFO in PFC (n = 6) compared with controls (n = 8; p = 0.014, unpaired t-test). Time spent in the open arms is also increased in animals expressing CaMKIIα-SSFO in V1 (n = 8) compared with controls (p = 0.046, unpaired t-test).
W W W. N A T U R E . C O M / N A T U R E | 7
SUPPLEMENTARY INFORMATION RESEARCH
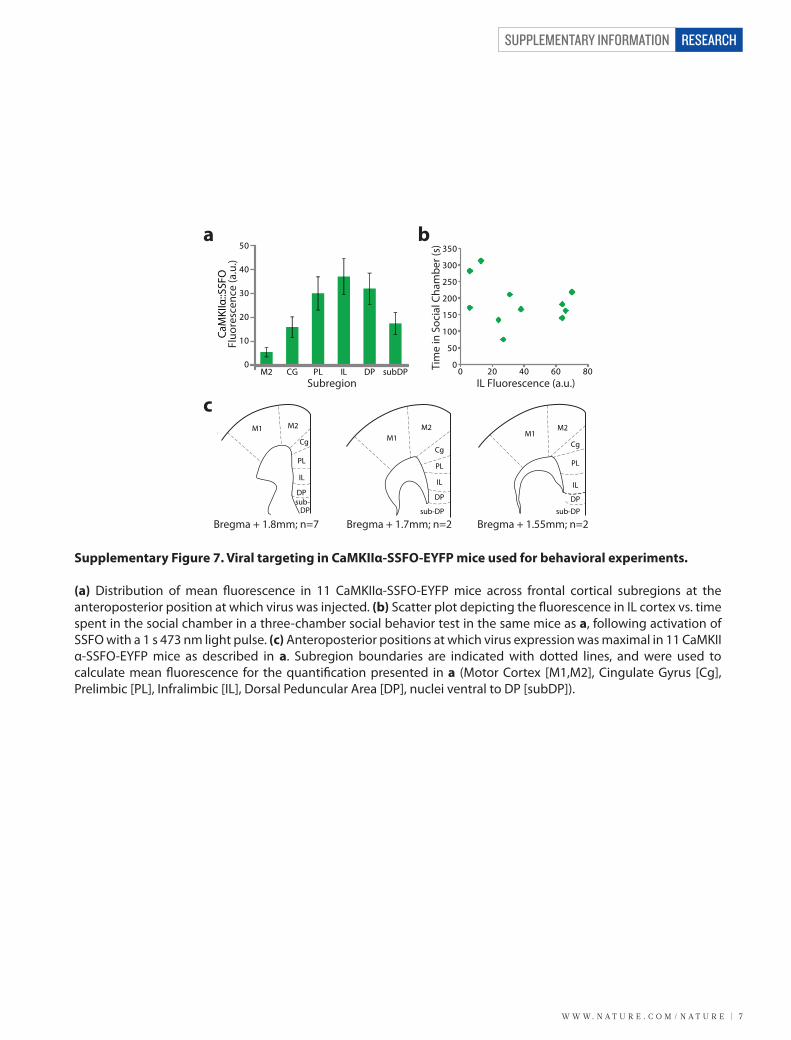
Supplementary Figure 7. Viral targeting in CaMKIIα-SSFO-EYFP mice used for behavioral experiments.
(a) Distribution of mean �uorescence in 11 CaMKIIα-SSFO-EYFP mice across frontal cortical subregions at the anteroposterior position at which virus was injected. (b) Scatter plot depicting the �uorescence in IL cortex vs. time spent in the social chamber in a three-chamber social behavior test in the same mice as a, following activation of SSFO with a 1 s 473 nm light pulse. (c) Anteroposterior positions at which virus expression was maximal in 11 CaMKIIα-SSFO-EYFP mice as described in a. Subregion boundaries are indicated with dotted lines, and were used to calculate mean �uorescence for the quanti�cation presented in a (Motor Cortex [M1,M2], Cingulate Gyrus [Cg], Prelimbic [PL], Infralimbic [IL], Dorsal Peduncular Area [DP], nuclei ventral to DP [subDP]).
a
c
b
0
50
100
150
200
250
300
350
0 20 40 60 80
PL
Cg
M2M1
IL
DP
DPsub-
sub-DPsub-DP
Bregma + 1.8mm; n=7 Bregma + 1.7mm; n=2 Bregma + 1.55mm; n=2
0
10
20
30
40
50
M2 CG PL IL DP subDP
CaM
KIIα
::SSF
OFl
uore
scen
ce (a
.u.)
Tim
e in
Soc
ial C
ham
ber (
s)
Subregion IL Fluorescence (a.u.)
Cg
M2M1
IL
DP
PL
Cg
M2M1
IL
PL
DP
SUPPLEMENTARY INFORMATION
8 | W W W. N A T U R E . C O M / N A T U R E
RESEARCH
Frequency (Hz)
0
20
40
60
Social behaviorj
Pow
er
20 40 60 80 100 120
Frequency (Hz)
Novel object behaviork
0
20
40
60
Pow
er
20 40 60 80 100 120
Open �eld behavior
Modulated channel spectra during behavioral tests:
f
i
Pow
er
0
20
40
60
Frequency (Hz)0 50 100
0
200
400
600
800
1000
1200
Trac
k le
ngth
(cm
)
0
10
20
30
Cent
er ti
me
(%)
0
50
25
75
100
Surr
ound
tim
e (%
)Pre-light 1s 470nm
No light1s 470nm
No light1s 470nm
Pre-light1s 470nmDeactivated
g
Time (s)350300500 100 150 200 250
1s 473nm 30s 594nm
1s 473nm 30s 594nm
60
30
0
140
80
20
MU
A fr
eq (H
z)M
UA
freq
(Hz)
Unmodulated channel
Modulated channel
h100
50
0
% C
hang
e M
UA
freq
uenc
y
Modulated Unmodulated
*
1000
a
0
20
40
60
Soci
al e
xplo
ratio
n (s
)
Test 1 Test 2
e
2h2s 470nm
UnconditionedSocial Behavior
**
0
d
20
40
60
80
Tim
e fr
eezi
ng (%
)
ContextImmediate Tone Context Tone
2s 470nm
Condition Test 1 Test 2Recondition
24h 24h24h
Conditioned Learning
****
Extra-cerebralFiber
c
ControlCaMKIIα::SSFO
c-FosActivation
0
200
400
600
800
mPF
C c-
fos+
cel
ls
Bregma +1.8mm
-1mm-2mm-3mm-4mm
PLCgM2
IL
RemovableFiber
Bluelaser
PC
b
Bregma +1.8mm
PL
Cg
IL
M2
Extra-cerebralFiber
CaMKIIα::SSFO
500um
*
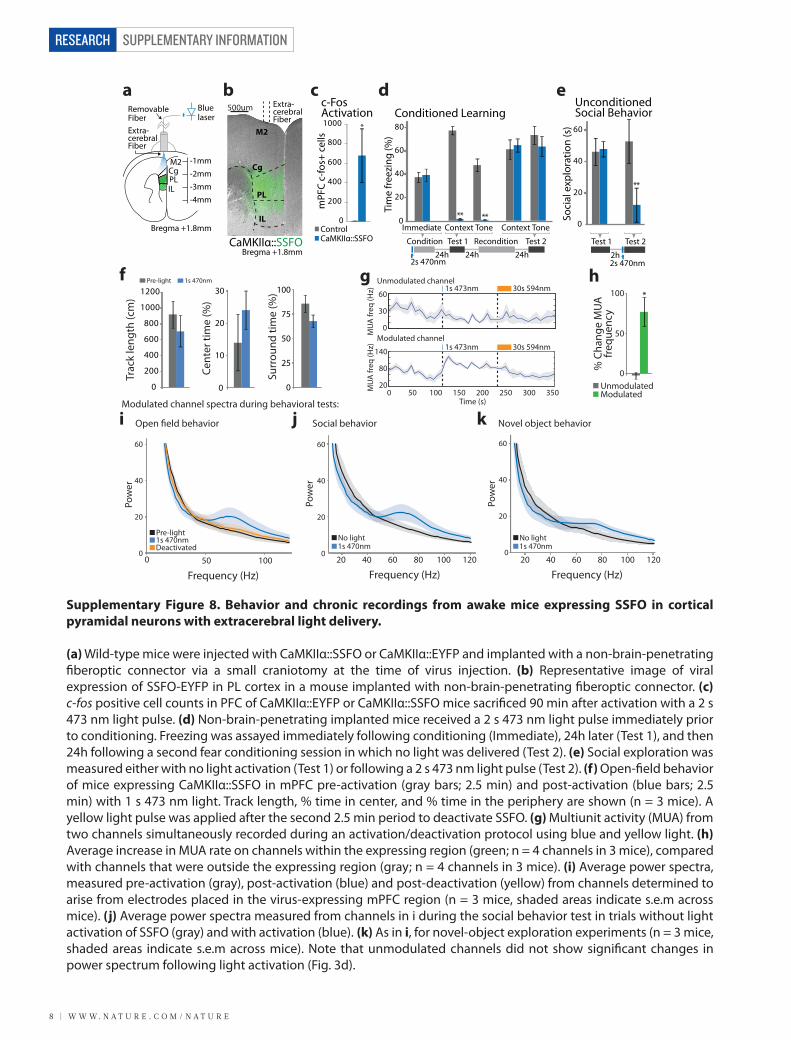
Supplementary Figure 8. Behavior and chronic recordings from awake mice expressing SSFO in cortical pyramidal neurons with extracerebral light delivery.
(a) Wild-type mice were injected with CaMKIIα::SSFO or CaMKIIα::EYFP and implanted with a non-brain-penetrating �beroptic connector via a small craniotomy at the time of virus injection. (b) Representative image of viral expression of SSFO-EYFP in PL cortex in a mouse implanted with non-brain-penetrating �beroptic connector. (c) c-fos positive cell counts in PFC of CaMKIIα::EYFP or CaMKIIα::SSFO mice sacri�ced 90 min after activation with a 2 s 473 nm light pulse. (d) Non-brain-penetrating implanted mice received a 2 s 473 nm light pulse immediately prior to conditioning. Freezing was assayed immediately following conditioning (Immediate), 24h later (Test 1), and then 24h following a second fear conditioning session in which no light was delivered (Test 2). (e) Social exploration was measured either with no light activation (Test 1) or following a 2 s 473 nm light pulse (Test 2). (f) Open-�eld behavior of mice expressing CaMKIIα::SSFO in mPFC pre-activation (gray bars; 2.5 min) and post-activation (blue bars; 2.5 min) with 1 s 473 nm light. Track length, % time in center, and % time in the periphery are shown (n = 3 mice). A yellow light pulse was applied after the second 2.5 min period to deactivate SSFO. (g) Multiunit activity (MUA) from two channels simultaneously recorded during an activation/deactivation protocol using blue and yellow light. (h) Average increase in MUA rate on channels within the expressing region (green; n = 4 channels in 3 mice), compared with channels that were outside the expressing region (gray; n = 4 channels in 3 mice). (i) Average power spectra, measured pre-activation (gray), post-activation (blue) and post-deactivation (yellow) from channels determined to arise from electrodes placed in the virus-expressing mPFC region (n = 3 mice, shaded areas indicate s.e.m across mice). (j) Average power spectra measured from channels in i during the social behavior test in trials without light activation of SSFO (gray) and with activation (blue). (k) As in i, for novel-object exploration experiments (n = 3 mice, shaded areas indicate s.e.m across mice). Note that unmodulated channels did not show signi�cant changes in power spectrum following light activation (Fig. 3d).
W W W. N A T U R E . C O M / N A T U R E | 9
SUPPLEMENTARY INFORMATION RESEARCH
a
b
c
pHo 7.5
1.0
H+ K+Na+ Ca2+
0.5
0
VLGNYLRVKI HEHILLYGDI RKKQKITIAG QEMEVETLVA EEED
VRVMAWTFFV AWGMFPVLFL LGTEGFGHIS PYGSAIGHSI LDLIAKNMWG
WGATSAMCTG WTKILFFLIS LSYGMYTYFH AAKVYIEAFH TVPKGICREL
VChR1 SGNGVVWMRY GEW
ChR1 MSRRPWLLAL ALAVALAAGS AGASTGSDAT VPVATQDGPD YVFHRAHERM ChR2 .......... .....MDYGG ALSAVG.... .......... .......REL VChR1 .......... .......... .......... .......... ..MDYPVARS
ChR1 LFQTSYTLEN NGSVICIPNN GQCFCLAWLK SNGTNAEKLA ANILQWITFA ChR2 LFVTNPVVVN .GSVLVP..E DQCYCAGWIE SRGTNGAQTA SNVLQWLAAG VChR1 LIVRYPTDLG NGTVCMP..R GQCYCEGWLR SRGTSIEKTI AITLQWVVFA
ChR1 LSALCLMFYG YQTWKSTCGW EEIYVATIEM IKFIIEYFHE FDEPAVIYSS ChR2 FSILLLMFYA YQTWKSTCGW EEIYVCAIEM VKVILEFFFE FKNPSMLYLA
VChR1 LSVACLGWYA YQAWRATCGW EEVYVALIEM MKSIIEAFHE FDSPATLWLS
ChR1 NGNKTVWLRY AEWLLTCRVI LIHLSNLTGL ANDYNKRTMG LLVSDIGTIV ChR2 TGHRVQWLRY AEWLLTCPVI LIHLSNLTGL SNDYSRRTMG LLVSDIGTIV LLTCPVL LIHLSNLTGL KDDYSKRTMG LLVSDVGCIV
ChR1 WGTTAALSKG YVRVIFFLMG LCYGIYTFFN AAKVYIEAYH TVPKGICRDL ChR2 WGATSAMATG YVKVIFFCLG LCYGANTFFH AAKAYIEGYH TVPKGRCRQV VChR1
ChR1 VRYLAWLYFC SWAMFPVLFL LGPEGFGHIN QFNSAIAHAI LDLASKNAWS ChR2 VTGMAWLFFV SWGMFPILFI LGPEGFGVLS VYGSTVGHTI IDLMSKNCWG VChR1
ChR1 MMGHFLRVKI HEHILLYGDI RKKQKVNVAG QEMEVETMVH EEDD..... ChR2 LLGHYLRVLI HEHILIHGDI RKTTKLNIGG TEIEVETLVE DEAEAGAVP VChR1 .....
TM1
TM2
TM3 TM4
TM5 TM6
TM7TM6
TM7
Splice 1
Splice 2
100
50148
6156
150
200
250
300
344
111
161
211
261
311
106
156
206
256
300
C1V1(Splice1)
C1V1(Splice2)
Mea
n�u
ores
cenc
e (a
.u.)
ChR2(H134R)
VChR1
100
50
0
C1V1 Splice1
e
C1V1 Splice2
ChR2(H134R) VChR1
CytoplasmMembrane
d
g h
0.5
0
1
1.5
Splic
e1
Splic
e2
I max
(nA
)I m
ax (n
A)
n.s.
n.s.*
**
f
N
CE122T
E162TChR1 sequenceVChR1 sequence
I max
(pA
)
0
400
800
1200
1600
0 50 100Fluorescence (a.u.)
150
VChR1-YFPVChR1-ts-YFPC1V1-YFP
C1V1-ts-YFPC1V1(E162T)-ts-YFPC1V1(E122T/E162T)-ts-YFP
1000
750
500
250
1250
0
I max
(pA
)
VChR1 C1V1
n.s.
YFP
9
ts-Y
FP
11
*
YFP
11
ts-Y
FP
**
12
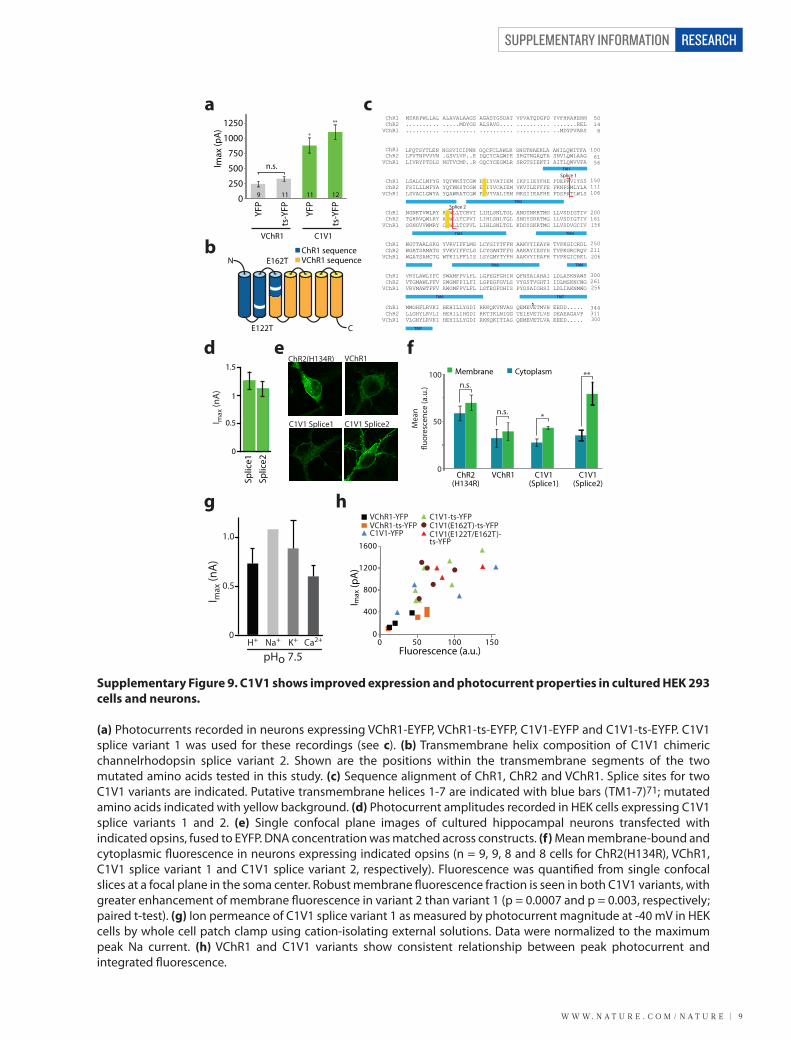
Supplementary Figure 9. C1V1 shows improved expression and photocurrent properties in cultured HEK 293 cells and neurons.
(a) Photocurrents recorded in neurons expressing VChR1-EYFP, VChR1-ts-EYFP, C1V1-EYFP and C1V1-ts-EYFP. C1V1 splice variant 1 was used for these recordings (see c). (b) Transmembrane helix composition of C1V1 chimeric channelrhodopsin splice variant 2. Shown are the positions within the transmembrane segments of the two mutated amino acids tested in this study. (c) Sequence alignment of ChR1, ChR2 and VChR1. Splice sites for two C1V1 variants are indicated. Putative transmembrane helices 1-7 are indicated with blue bars (TM1-7)71; mutated amino acids indicated with yellow background. (d) Photocurrent amplitudes recorded in HEK cells expressing C1V1 splice variants 1 and 2. (e) Single confocal plane images of cultured hippocampal neurons transfected with indicated opsins, fused to EYFP. DNA concentration was matched across constructs. (f) Mean membrane-bound and cytoplasmic �uorescence in neurons expressing indicated opsins (n = 9, 9, 8 and 8 cells for ChR2(H134R), VChR1, C1V1 splice variant 1 and C1V1 splice variant 2, respectively). Fluorescence was quanti�ed from single confocal slices at a focal plane in the soma center. Robust membrane �uorescence fraction is seen in both C1V1 variants, with greater enhancement of membrane �uorescence in variant 2 than variant 1 (p = 0.0007 and p = 0.003, respectively; paired t-test). (g) Ion permeance of C1V1 splice variant 1 as measured by photocurrent magnitude at -40 mV in HEK cells by whole cell patch clamp using cation-isolating external solutions. Data were normalized to the maximum peak Na current. (h) VChR1 and C1V1 variants show consistent relationship between peak photocurrent and integrated �uorescence.
SUPPLEMENTARY INFORMATION
1 0 | W W W. N A T U R E . C O M / N A T U R E
RESEARCH
7.2 mW mm-2
2.2 mW mm-2
0.8 mW mm-2
0.2 mW mm-2
0 20 40Frequency (Hz)
60 80 1000
0.5
Spik
es E
licite
dSp
ikes
Elic
ited
at 5
42nm
1Injectedcurrent
0 20 40Frequency (Hz)
60 80 1000
0.5
1
6.0 mW mm-2
1.8 mW mm-2
6.9 mW mm-2
2.0 mW mm-2
0.8 mW mm-2
0.2 mW mm-2
Spik
es E
licite
d at
590
nm
0 20 40Frequency (Hz)
60 80 1000
0.5
1
0 20 40Frequency (Hz)
60 80 1000
0.5
Spik
es E
licite
d at
560
nm1
500ms40 mV
5Hz
10Hz
20Hz
40Hz
60Hz
80Hz
a
b
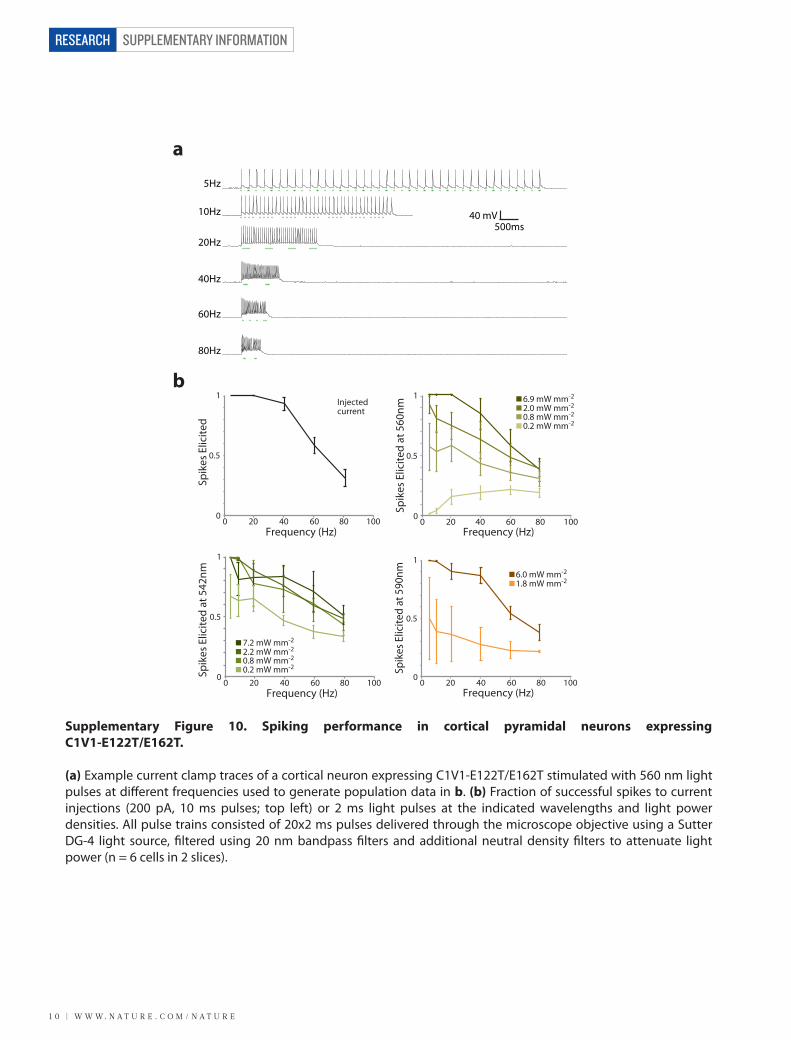
Supplementary Figure 10. Spiking performance in cortical pyramidal neurons expressing C1V1-E122T/E162T.
(a) Example current clamp traces of a cortical neuron expressing C1V1-E122T/E162T stimulated with 560 nm light pulses at di�erent frequencies used to generate population data in b. (b) Fraction of successful spikes to current injections (200 pA, 10 ms pulses; top left) or 2 ms light pulses at the indicated wavelengths and light power densities. All pulse trains consisted of 20x2 ms pulses delivered through the microscope objective using a Sutter DG-4 light source, �ltered using 20 nm bandpass �lters and additional neutral density �lters to attenuate light power (n = 6 cells in 2 slices).
W W W. N A T U R E . C O M / N A T U R E | 1 1
SUPPLEMENTARY INFORMATION RESEARCH
b
d e
cE122T
100 pA50ms
a
E122TE122T
20 mV
0.5s
5Hz 630nm 50ms
-70 mV
-70 mV
E122T 542 / 630nm
200 pA
0.5s
E122T/E162T 542 / 630nm
500 pA
0.5s
5ms 630nm
15ms 630nm
50ms 630nm
150ms 630nm
τ on
(ms)
5ms 630nm
50ms 630nm
540
7.7 3.2
0
20
40
60
80
Wavelength (nm)Light power
(mW mm-2)
630
20ms 630nm
40 mV 200ms
p < 0.001
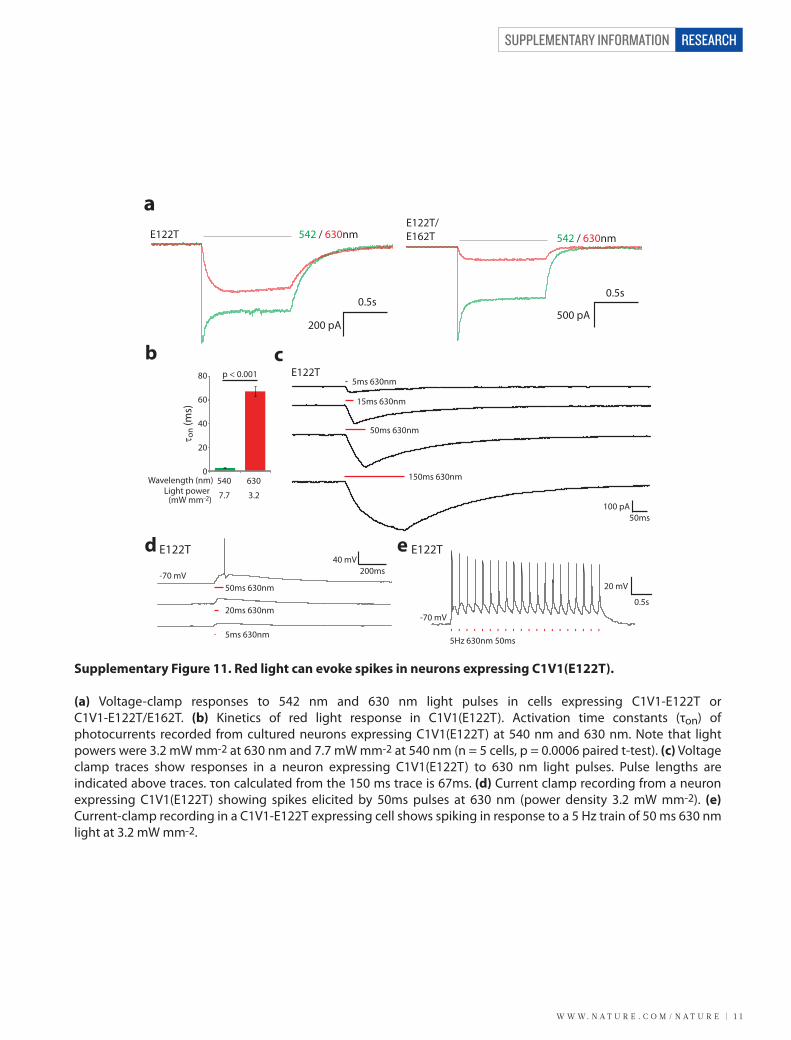
Supplementary Figure 11. Red light can evoke spikes in neurons expressing C1V1(E122T).
(a) Voltage-clamp responses to 542 nm and 630 nm light pulses in cells expressing C1V1-E122T or C1V1-E122T/E162T. (b) Kinetics of red light response in C1V1(E122T). Activation time constants (τon) of photocurrents recorded from cultured neurons expressing C1V1(E122T) at 540 nm and 630 nm. Note that light powers were 3.2 mW mm-2 at 630 nm and 7.7 mW mm-2 at 540 nm (n = 5 cells, p = 0.0006 paired t-test). (c) Voltage clamp traces show responses in a neuron expressing C1V1(E122T) to 630 nm light pulses. Pulse lengths are indicated above traces. τon calculated from the 150 ms trace is 67ms. (d) Current clamp recording from a neuron expressing C1V1(E122T) showing spikes elicited by 50ms pulses at 630 nm (power density 3.2 mW mm-2). (e) Current-clamp recording in a C1V1-E122T expressing cell shows spiking in response to a 5 Hz train of 50 ms 630 nm light at 3.2 mW mm-2.
SUPPLEMENTARY INFORMATION
1 2 | W W W. N A T U R E . C O M / N A T U R E
RESEARCH
ChR2PV cells
ChR2PV cells
C1V1PYR cells
C1V1PYR cells
PYR
PYR
PV
PV
PYR
50 pA20ms
200 pA20ms
40 pA20ms
(Cell clamped to 0 mV)
2ms 405nm
2ms 560nm
2ms 560nm
2ms 405nm
Inhibitory synaptic currents(Cell clamped to -65 mV)Excitatory synaptic currentscb
e
a
d
5Hz 405nm5Hz 560nm
5Hz 405nm
20 mV0.5s
PYR cell expressing C1V1 PYR cell expressing ChR2(H134R)
20 mV0.5s
5Hz 560nm
PYR PYR
40 µV0.2 ms
Single unit waveforms:
561 nm
405 nm20 µV
0.2 s
Optic�ber
405nmlaser
561nmlaser
Fiber splitter
Electrode
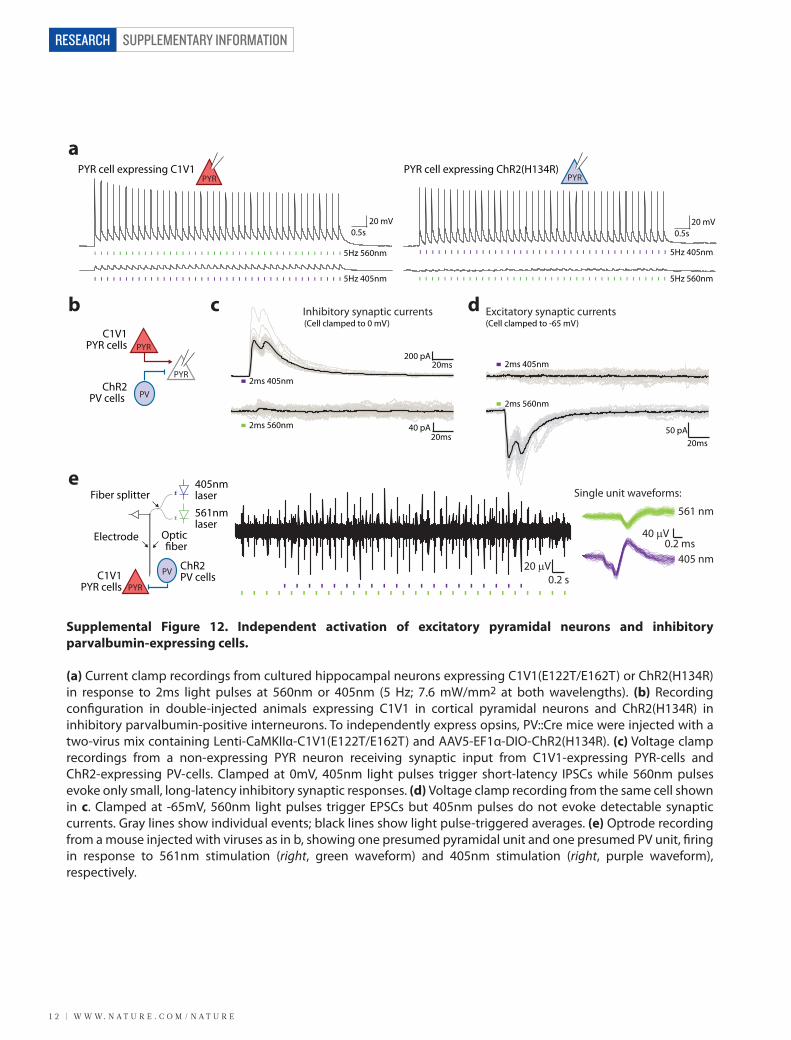
Supplemental Figure 12. Independent activation of excitatory pyramidal neurons and inhibitory parvalbumin-expressing cells.
(a) Current clamp recordings from cultured hippocampal neurons expressing C1V1(E122T/E162T) or ChR2(H134R) in response to 2ms light pulses at 560nm or 405nm (5 Hz; 7.6 mW/mm2 at both wavelengths). (b) Recording con�guration in double-injected animals expressing C1V1 in cortical pyramidal neurons and ChR2(H134R) in inhibitory parvalbumin-positive interneurons. To independently express opsins, PV::Cre mice were injected with a two-virus mix containing Lenti-CaMKIIα-C1V1(E122T/E162T) and AAV5-EF1α-DIO-ChR2(H134R). (c) Voltage clamp recordings from a non-expressing PYR neuron receiving synaptic input from C1V1-expressing PYR-cells and ChR2-expressing PV-cells. Clamped at 0mV, 405nm light pulses trigger short-latency IPSCs while 560nm pulses evoke only small, long-latency inhibitory synaptic responses. (d) Voltage clamp recording from the same cell shown in c. Clamped at -65mV, 560nm light pulses trigger EPSCs but 405nm pulses do not evoke detectable synaptic currents. Gray lines show individual events; black lines show light pulse-triggered averages. (e) Optrode recording from a mouse injected with viruses as in b, showing one presumed pyramidal unit and one presumed PV unit, �ring in response to 561nm stimulation (right, green waveform) and 405nm stimulation (right, purple waveform), respectively.

W W W. N A T U R E . C O M / N A T U R E | 1 3
SUPPLEMENTARY INFORMATION RESEARCH
a b2 31 4
100 pA0.2 s
470nm 590nm
0 mV
C1V1 activeSSFO active
PYR(C1V1)
PV(SSFO)
PYRPV
PYR
20
10
0
IPSC
Fre
q. (H
z)
Base
line
Aft
er 5
90
c d
590nm 590nm
0 mV
C1V1 activeSSFO active
20
10
0
IPSC
Fre
q. (H
z)
Base
line
Aft
er 4
70
*
Frequency (Hz)0 50 100
Pow
er
Frequency (Hz)0 50 100
Pow
er
2s100 pA
100 pA2s
2 31 4
Supplementary Figure 13. Spectrotemporal separation and combinatorial control: circuit modulation and emergent patterns in altered E/I states under ongoing synaptic activity.
(a) Experimental paradigm for SSFO activation of PV neurons and C1V1 activation in pyramidal neurons. (b) Voltage clamp recording at 0 mV from a pyramidal neuron in an acute slice preparation from a PV::Cre mouse expressing CaMKIIα::C1V1(E162T) and DIO-SSFO. SSFO and C1V1 are activated by a blue light pulse (2) and IPSC frequency is increased by sustained SSFO activity (3; compare upper and lower traces in inset for pre- and post-activation IPSC activity). A sustained yellow light pulse deactivates SSFO and activates C1V1 and transiently increases IPSC frequency (4). Population power spectra (right) show gamma frequency activity during optical excitatory neuron activation (590 nm pulse) that is increased during coactivation of excitatory and PV neurons (470 nm pulse). Diagrams below traces show predicted activity of C1V1 and SSFO during the experiment. (c) The observed gamma frequency peak was not dependent on prior PV neuron stimulation via SSFO. (d) Summary IPSC frequencies from b and c at baseline and after the initial blue or orange pulse. Diagrams below traces show predicted activity of C1V1 and SSFO during the experiment.

SUPPLEMENTARY INFORMATION
1 4 | W W W. N A T U R E . C O M / N A T U R E
RESEARCH
e f
a
c
b
-70 mV
CT (561nm)TC (405nm)
50ms10 mV
VB PYRTC CT
Cortex (C1V1)
nRT cellVB (ChR2)
SD = 0.637ms
∆t=0ms
APs
(#) 1
0.5
0
∆t (ms)-40 -20 0 20 40 60 80
-70 mV10ms
10 mV
CT
∆t = +20ms
∆t = 0ms
70 pA
372 pA
302 pA200 pA5ms
∆t = 0 ms
∆t = -5 ms
∆t = -15 ms
∆t = -20 ms
AP
5mV10ms
CTTC
CTTC
CT TC CTTC∆t = +10 ms
∆t = +30 ms
d
Supplemental Figure 14. Separable control of cortical and thalamic axons.
(a) Experimental layout for activation of C1V1 and ChR2 in cortico-thalamic (CT) and ventrobasal (VB) thalamo-cortical cells (TC), respectively. Evoked responses were recorded in a nRT cell while optically stimulating CT and TC axons presynaptic to the nRT cell. All TC and CT somata were cut from the slices prior to the recording (dashed rectangle, see Methods for details). (b) Voltage-clamp recording from an nRT cell receiving both CT and TC projections. Simultaneous stimulation (Δt = 0ms) leads to a linear summation of evoked EPSCs from both projections. (c-d) Individual subthreshold inputs from TC and CT �bers lead to spiking in a nRT neuron only when inputs are precisely co-incident. Horizontal dashed line in d indicates a truncated action potential. (e) Superimposition of evoked responses (n=21) obtained for coincident CT and TC inputs. Note the reproducibility of e�ective integration and the high temporal precision of �ring (�ring range = 2.4 ± 0.637 ms, SD). (f) Normalized number of action potentials (APs #, from 6 nRT cells) evoked by CT and TC �bers activated with variable latencies (Δt) indicates that CT and TC inputs lead to e�ective integration only if coincident within 5 ms. Quantitative data represent mean ± s.e.m. Traces depicted in b-e are from the same cell. Delays (Δt) between TC and CT inputs are indicated in b, d and e.
W W W. N A T U R E . C O M / N A T U R E | 1 5
SUPPLEMENTARY INFORMATION RESEARCH
Soci
al e
xplo
ratio
n (s
)
0
20
40
a b
Test 2Test 1
594nm on
Tim
e in
cha
mbe
r (s)
Non-social
Center Social0
200
400
10 min Test
594nm on
UnconditionedSocial Behavior
UnconditionedSocial Behavior
CK::eNpHR3.0PV::eNpHR3.0Control
Supplementary Figure 15. Inhibition of PFC excitatory or inhibitory cells.
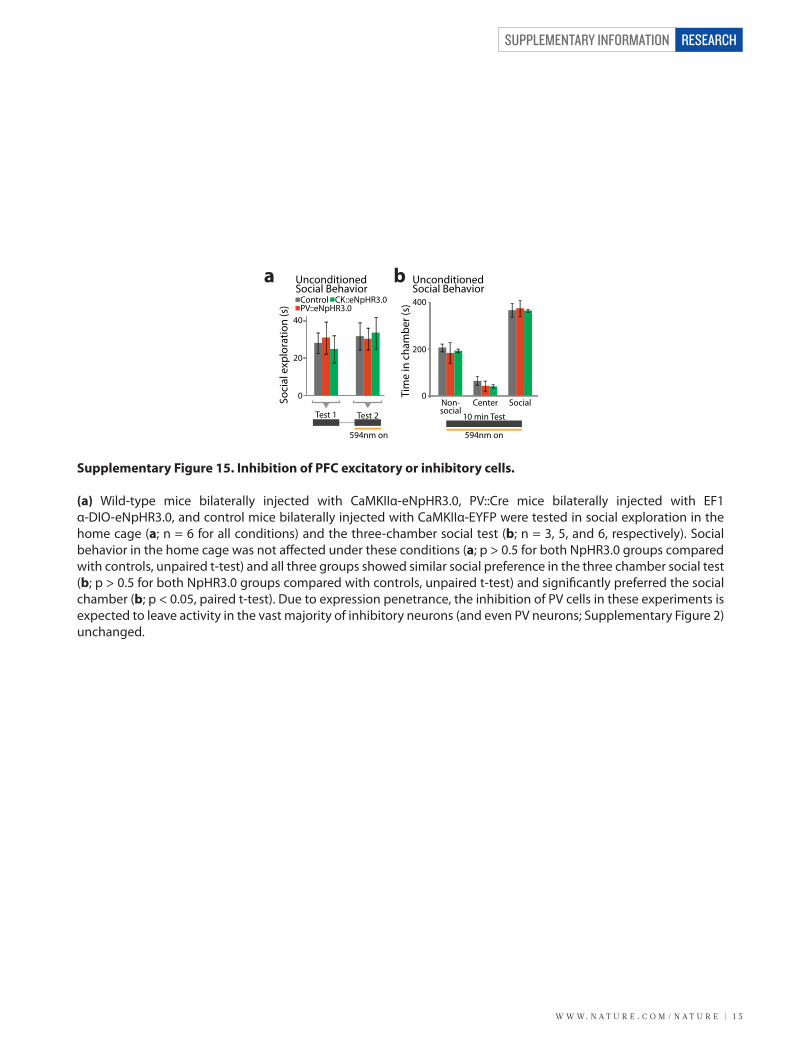
(a) Wild-type mice bilaterally injected with CaMKIIα-eNpHR3.0, PV::Cre mice bilaterally injected with EF1α-DIO-eNpHR3.0, and control mice bilaterally injected with CaMKIIα-EYFP were tested in social exploration in the home cage (a; n = 6 for all conditions) and the three-chamber social test (b; n = 3, 5, and 6, respectively). Social behavior in the home cage was not a�ected under these conditions (a; p > 0.5 for both NpHR3.0 groups compared with controls, unpaired t-test) and all three groups showed similar social preference in the three chamber social test (b; p > 0.5 for both NpHR3.0 groups compared with controls, unpaired t-test) and signi�cantly preferred the social chamber (b; p < 0.05, paired t-test). Due to expression penetrance, the inhibition of PV cells in these experiments is expected to leave activity in the vast majority of inhibitory neurons (and even PV neurons; Supplementary Figure 2) unchanged.

SUPPLEMENTARY INFORMATION
1 6 | W W W. N A T U R E . C O M / N A T U R E
RESEARCH
Supplementary Figure 16. Combinatorial optical control of mPFC cellular E/I balance: control experiments. Diagrams illustrate the light-stimulation protocols used in 4 di�erent experiments using CaMKIIα-YFP mice. In all four experiments, light stimulation had no e�ect on the signi�cant preference of these control mice to spend time in the chamber in which the novel conspeci�c mouse was located (n = 8 mice).
CaMKIIα::YFP
0
400
200
0
400
200
**
No light
*
2s470nm
*
10Hz470nm
*
10Hz590nm
Tim
e in
cha
mbe
r (s)
10min habituation 10min social test
2s 470nmSSFO Active
10min habituation 10min social testNo Light
10min habituation 10min social test
10hz 470nm
SSFO + C1V1Active
10min habituation 10min social testC1V1 Active
10hz 590nm
Social ChamberCenterNeutral Chamber

W W W. N A T U R E . C O M / N A T U R E | 1 7
SUPPLEMENTARY INFORMATION RESEARCH
�
� Peak�activation�
wavelength�(nm)�
�off�Kinetics�
pH7.2�(ms)*�
Peak�current�(pA)�
at��60�mv*�
Ratio�
405/560�
Desensitization
(�%�)�
ChR2(H134R)� 460�±�6(N�=�5)� 25�±�3�(N�=�5)� 816�±�181�(N�=�5)� 60%�:��8%�
(N�=�7)�
65±8�(N�=�5)�
VChR1� 543�±�7�(N�=�7)� 132�±�12�(N�=�5)� 284�±�54�(N�=�5)� 9%�:�82%�
(N�=�7)�
40±10�(N�=�18)�
C1V1� 539�±�4�(N�=�10)� 156�±�12�(N�=�4)� 1035�±�158�(N�=�6)� 28%�:�86%�
(N�=�10)�
46±6�(N�=�14)�
C1V1(E162T)� 530�±�4�(N�=�6)� 58�±�5�(N�=�5)� 1183�±�53�(N�=�6)� 20%�:�71%�
(N�=�6)�
41±12�(N�=�7)�
C1V1(E122T)� 546�±�5�(N�=�4)� 105�±�22�(N�=�4)� 572�±�21�(N�=�5)� 14%�:�94%�
(N�=�4)�
37±6�(N�=�8)�
C1V1(E122T/�
E162T)�
535�±�5�(N�=�7)� 34�±�4�(N�=�5)� 1072�±�89�(N�=�9)� 11%��:�72%�
(N�=�7)�
20±9�(N�=�10)�
Supplementary Table 1. Spectral/kinetic properties of ChR2, VChR1 and C1V1 variants. Peak activation wavelength was recorded in HEK cells using 2 ms light pulses at the peak activation wavelength. Deactivation kinetics (�off) and peak photocurrents were recorded in cultured hippocampal neurons using 2 ms light pulses at the maximal activation wavelength. To identify the optimal variants for combinatorial activation with ChR2, the percent response at 405 nm and 560 nm was recorded in HEK cells. Desensitization of the photocurrent was recorded using 300 ms light pulses, quantifying the decay of the peak photocurrent (Imax) to the steady state (Iss; Supplementary Figure 2e). Desensitization is expressed as�
max(I )max SS(I - I )
100 x�
18��

SUPPLEMENTARY INFORMATION
1 8 | W W W. N A T U R E . C O M / N A T U R E
RESEARCH
�
VChR1�YFP�VChR1�ts�YFP� C1V1�YFP�
C1V1�ts�YFP�
C1V1�(E162T)�ts�Y�
C1V1�(E162T/E122T)��ts�YFP�
ChR2(H134R)�YFP� �
1.0000� 0.5770� 0.0188� 0.0029� 6.5E�06� 1.1E�05� 0.0448� VChR1�YFP�
� 1.0000� 0.0266� 0.0039� 1.1E�06� 0.0015� 0.0579� VChR1�ts�YFP�
� � 1.0000� 0.3372� 0.0399� 0.0788� 0.8175� C1V1�YFP�
� � � 1.0000� 0.4099� 0.8442� 0.4222� C1V1�ts�YFP�
� � � � 1.0000� 0.3254� 0.1490� C1V1(E162T)�ts�Y�
� � � � � 1.0000� 0.3001�C1V1(E162T/E122T)�ts�YFP�
� � � � � � 1.0000� ChR2(H134R)�YFP�
�
Supplementary Table 2. Summary of pairwise t-test p-values for peak photocurrent amplitude across all opsins shown in Fig. 3f and Table 1. Photocurrents were recorded in cultured neurons using a 2 ms light pulse at 540 nm (VChR1 and C1V1 variants) or 470 nm (ChR2(H134R)). Shown in red are comparisons that were significant at � = 0.01 level after correction for multiple comparisons using the Tukey-Kramer post-hoc test. Data were tested for normality using the Shapiro-Wilk test.
19��
W W W. N A T U R E . C O M / N A T U R E | 1 9
SUPPLEMENTARY INFORMATION RESEARCH
Supplementary Methods
Plasmid construction and neuronal expression
ChR2(D156A) and SSFO were generated by introducing point mutations into the pLenti-
CaMKII�-ChR2-EYFP-WPRE vector51 using site-directed mutagenesis (Quikchange II XL;
Stratagene). Chimeric channelrhodopsin C1V1 was generated by fusing either a wild-type or
human codon-optimized channelrhodopsin-1 with a human codon-adapted VChR1 (GenBank™
accession number ACD70142.1) by overlap extension PCR with two different splice sites.
Variant one contained the first 145 amino acids of ChR1 fused in-frame with amino acids 102 to
316 of VChR1. Variant two contained the first 162 amino acids of ChR1 fused in-frame with
amino acids 119 to 316 of VChR1. The resulting chimeric PCR fragments were cloned into
pECFP-N1 (Clontech, Mountain View, CA) for HEK cell experiments and as EYFP-fusions into
lentiviral expression vectors under the CaMKII� promoter52 for neuronal experiments. Although
addition of the fluorophore could potentially interfere with channel function, EYFP fusions were
used since they enable direct visualization of opsin distribution in the cell and specifically,
membrane targeting. All point mutations in C1V1 vectors were generated in the plasmids by site-
directed mutagenesis (Agilent Technologies, Palo Alto, CA). The membrane trafficking signal
was derived from the Kir2.1 channel53,54. Mutations were confirmed by sequencing the coding
sequence and splice sites. For AAV-mediated gene delivery, opsin-EYFP fusions along with the
CaMKII� promoter were subcloned into a modified version of the pAAV2-MCS vector. Cre-
dependent opsin expression was achieved by cloning the opsin-EYFP cassette in the reverse
orientation between pairs of incompatible lox sites (loxP and lox2722) to generate a
doublefloxed inverted open reading frame (DIO)55 under the control of the elongation factor 1�
(EF-1�) promoter52. All constructs are available from the Deisseroth Lab
(www.optogenetics.org).
Absorbance measurements
For heterologous expression of ChRs in Pichia pastoris cells (strain 1168H, Invitrogen), the
human codon-optimized synthetic ChR-fragment encoding aminoacids 1-315 (see accession no.
20��
SUPPLEMENTARY INFORMATION
2 0 | W W W. N A T U R E . C O M / N A T U R E
RESEARCH
AF461397) was cloned in the pPICZ vector (Invitrogen) via its EcoRI and NotI restriction sites.
The C-terminal polyhistidine tag encoded on the vector was modified to a 12His sequence.
Mutants of ChR were generated by site-directed mutagenesis (QuickChange kit, Stratagene).
Transformation, cell culture and protein purification were performed as described in Bamann et
al. (2008) with some modifications. After induction of protein expression for 24 h, cells were
harvested and gently lysed using a high pressure homogenizer (Avestin). The membrane fraction
was collected, homogenized and solubilized in 1 % (w/v) dodecylmaltoside. After binding of
ChR protein to a Ni-NTA resin (Qiagen) and washing of the column with 200 mM imidazole,
ChR was eluted with 500 mM imidazole. Fractions that contained the protein were pooled,
desalted (Float-a-lyzer, Roth) and concentrated (Amicon Ultra, Millipore) to an optical density of
1 at 480 nm. Spectra were recorded in a Cary 50 Bio spectrophotometer (Varian Inc). Further
details are found in Stehfest et al.56.
HEK cell electrophysiology
HEK293 cells were cultured in Dulbecco’s minimal essential medium supplemented with 10%
fetal bovine serum, 2mM glutamine (Biochrome, Berlin, Germany), and 1% (w/w)
penicillin/streptomycin. Cells were seeded onto coverslips at a concentration of 0.175 x 10⁶
cells/ml and supplemented with 1 µM all-trans retinal. Transient transfection was performed with
Fugene 6 (Roche, Mannheim, Germany) and recordings were done 20-28 hours later.
Photocurrents in transiently transfected HEK293 cells were recorded by conventional whole-cell
patch-clamp. The external solution contained [mM]: 140 NaCl, 2 CaCl2, 2 MgCl2, 2 KCl, 10
HEPES (pH 7.2). The internal solution contained [mM]: 110 NaCl, 10 EGTA, 2 MgCl2, 1 CaCl2,
5 KCl, 10 HEPES (pH was adjusted to 7.2 either using CsOH or HCl). Patch pipettes were pulled
with micropipette puller model P-97 (Sutter Instrument Co., Novato, CA) from micro-
haematocrit-tubes (Hecht-Assistant, Sondheim, Germany) with 1.5-2 M� resistance. HEK cell
whole-cell patch-clamping was performed with an EPC 7 (HEKA, Elektronik GmbH,
Lambrecht, Germany) amplifier. Analog data was sampled at 20kHz, digitized with
Digidata1440 (Molecular Devices, Foster City, CA) and displayed using pClamp10.1 Software
(Molecular Devices, Foster City, CA). For recording wavelength dependence, a light guide from
a Polychrome V unit (TILL Photonics, Planegg, Germany) was mounted on the epiluminescence
port of an Olympus IX70 microscope. For reflecting light into the objective a beam splitter (70%
21��
W W W. N A T U R E . C O M / N A T U R E | 2 1
SUPPLEMENTARY INFORMATION RESEARCH
R / 30% T) was used resulting in a final photon density of ~ 1 x 10²² photons m–2 s–1 at 470 nm
on the coverslip. For recording the action spectra only 50% of the light intensity was used. The
polychrome V Unit was controlled with Tillvision Software (TILL Photonics, Planegg,
Germany) synchronized with the pClamp Software.
Animals
Wild-type or transgenic Parvalbumin::Cre C57BL/6J male mice were group housed three to five
to a cage and kept on a reverse 12 hour light/dark cycle with ad libitum food and water.
Experimental protocols were approved by Stanford University IACUC and meet guidelines of
the National Institutes of Health guide for the Care and Use of Laboratory Animals.
Virus Preparation and Injection
Stereotactic viral injections were carried out under protocols approved by Stanford University
IACUC. Lentiviral- and AAV-mediated gene delivery was used for heterologous expression of
opsins in mice. Lentivirus was prepared as previously described57,58. Recombinant AAV vector
was packaged by University of North Carolina Vector Core (Chapel Hill, NC, USA). Stereotactic
viral injections were carried out as previously described55. Briefly, juvenile (4-6 week old) male
mice kept under isoflurane anesthesia were arranged in a stereotactic frame (Kopf Instruments)
and leveled using bregma and lambda skull landmarks. Craniotomies were performed so as to
cause minimal damage to cortical tissue. Medial prefrontal cortex (mPFC; from bregma: 1.8mm
anterior, 0.35mm lateral, -2.85mm ventral) was targeted using a 10µL syringe and 35g beveled
needle (World Precision Instruments). 250 nl of the virus suspension was infused at a rate of 100
nl/min. Subjects injected with virus for behavioral had an implanted fiberoptic lightguide59 (IFL)
affixed to facilitate light delivery either with or without an attached penetrating cerebral fiber for
local delivery to target cortical region as noted (Doric Lenses, Canada). Penetrating IFLs were
stereotactically inserted to a depth of -2.0mm from the same anterior and lateral coordinates and
affixed using adhesive luting cement (C&B MetaBond) prior to adhesive closure of the scalp
(Vetbond, 3M). Minimally-invasive implants were performed by inserting the fiberoptic element
through the craniotomy to immediately below the skull, without penetrating the brain tissue.
Animals were administered analgesic relief following recovery from surgery. Viral titers of AAV
vectors were between 1-2*1012 viral genomes per milliliter. Lentiviral vector titers were 108 to
22��
SUPPLEMENTARY INFORMATION
2 2 | W W W. N A T U R E . C O M / N A T U R E
RESEARCH
109 per milliliter. All experiments were conducted 2-3 weeks after surgery, to limit the excitation
imposed by SSFO activation and avoid the possibility of seizure activity, which is a common
outcome of excessive cortical stimulation with various methods.
Optrode recordings
Simultaneous optical stimulation and electrical recording in the prefrontal cortex of wildtype
adult C57BL/6J male mice previously transduced with indicated viral constructs was carried out
as described previously60. Clampex software was used for both recording field signals and
controlling 405 nm (Crystalaser, Inc.), 473 nm (Crystalaser, Inc.), and 561 nm (Crystalaser, Inc.)
100mW solid state laser diode sources coupled to the optrode. Electrophysiological recordings
were initiated at the Cg/PL boundary (1.8mm anterior, 0.35mm lateral, -2.0mm ventral) after
lowering isoflurane anesthesia to a constant level of 1.2% in CaMKII�::SSFO recordings and
0.8% in PV::SSFO recordings (to acquire higher baseline activity and detect inhibitory effects of
PV cell activation). The optrode was lowered ventrally in 0.05 mm steps and 3 continuous
sweeps were acquired at each site, each with activation and deactivation light pulses. 561 nm
light was chosen for deactivation due to the more rapid effect of its output on SSFO deactivation
and the superior analog control of the 561 nm laser compared with existing 593 nm lasers. We
now recommend using 593 nm light in series with a shutter9, as it delivers more complete
deactivation and should be utilized when possible in SSFO experiments. Events were isolated
using a custom algorithm in Matlab (MathWorks) with the threshold set above baseline noise (25
to 40 �V). Significant changes in multiunit activity were defined as changes that exceeded the
standard deviation of the baseline firing rates by more than 2-fold. Sweeps in which significant
change (two standard deviations above baseline) occurred in multiunit activity frequency
following the 473 nm pulse were used for recording the average MUA frequency at baseline,
following the 473 nm pulse and following the 561 nm pulse. For combinatorial experiments with
C1V1 and ChR2, the illumination protocol consisted of 60 10 ms pulses of 561nm light at 5 Hz.
During the first 20 pulses no 405 nm light was delivered. During the following 20 pulses, 405nm
pulses preceded the 561nm pulses with varying inter-pulse intervals (between 0 ms and 100 ms).
The last 20 pulses in each sweep were again only 561 nm pulses. This protocol was repeated at
each recording site. Spike detection and quantification was done in Matlab.
23��
W W W. N A T U R E . C O M / N A T U R E | 2 3
SUPPLEMENTARY INFORMATION RESEARCH
Whole cell patch-clamp electrophysiology in hippocampal and cortical neurons
Primary hippocampal cultures were isolated from P0 Sprague-Dawley rats, plated on Matrigel
(Invitrogen)-coated glass coverslips and treated with FUDR to inhibit glia overgrowth.
Endotoxin-free plasmid DNA was transfected in cultured neurons using a HEPES buffered
Saline/CaPO4 mix. Electrophysiological recordings from individual neurons identified by
fluorescent protein expression were obtained in Tyrode media ([mM] 150 NaCl, 4 KCl, 2
MgCl2, 2 MgCl2, 10 D-glucose, 10 HEPES, pH 7.35 with NaOH) using a standard internal
solution ([mM] 130 KGluconate, 10 KCl, 10 HEPES, 10 EGTA, 2 MgCl2, pH 7.3 with KOH) in
3-5 M� glass pipettes. For cortical slice physiology, acute 300 �m coronal slices from 8-9 week
old wild-type C57BL/6J or PV::Cre mice previously injected with virus were obtained in ice-
cold sucrose cutting solution ([mM] 11 D-glucose, 234 sucrose, 2.5 KCl, 1.25 NaH2PO4, 10
MgSO4, 0.5 CaCl2, 26 NaHCO3) using a Vibratome (Leica). Slices were recovered in
oxygenated Artificial Cerebrospinal Fluid (ACSF; [mM] 124 NaCl, 3 KCl, 1.3 MgCl2, 2.4
CaCl2, 1.25 NaH2PO4, 26 NaHCO3, 10 D-glucose) at 32ºC for one hour. Individual neuron
patches were obtained after identifying fluorescent protein expression from indicated prefrontal
cortical layer under constant ACSF perfusion. Filtered light from a broad-wavelength xenon
lamp source (Sutter Instruments DG-4) was coupled to the fluorescence port of the microscope
(Leica DM-LFSA). Band pass filters (Semrock) had 20 nm bandwidth, and were adjusted with
additional neutral density filters (ThorLabs) to equalize light power output across the spectrum.
While handling cells or tissues expressing SSFO, care was taken to minimize light exposure to
prevent activation by ambient light. Before each experiment, a 20s pulse of 590 nm light was
applied to convert all of the SSFO channels to the dark state and prevent run-down of
photocurrents61,62. For acquisition of SSFO activation and deactivation spectra, we recorded from
cultured neurons in voltage clamp mode. For recording activation spectra, we applied a 1 s pulse
of varying wavelength, followed by a 10 s 590 nm pulse. Deactivation spectra were acquired by
first applying a 1 s 470 nm pulse to activate SSFO, followed by a 10 s pulse of varying
wavelength. Net activation or deactivation was calculated by dividing the photocurrent change
after the first or second pulse, respectively, by the maximum photocurrent change induced by the
peak wavelength for that cell. Negative values in deactivation spectra resulted from traces in
which, for example, a 10 s 470nm pulse led to a slight increase in photocurrent rather than
deactivate the channels. This could be the result of the relatively wide (20 nm) band-pass filter
24��
SUPPLEMENTARY INFORMATION
2 4 | W W W. N A T U R E . C O M / N A T U R E
RESEARCH
width used for these recordings with the Sutter DG-4. Intermediate wavelengths (between 470nm
and 520nm) are expected to have a mixed effect on the channel population for the same reasons.
Cultured cell images were acquired on the same microscope using a Retiga Exi CCD camera
(Qimaging, Inc.) at 100 ms exposure with 30 gain. Illumination power density was 12 mW mm-2
at 500 nm with a standard EYFP filter set. Quantification of fluorescence was performed with
ImageJ software by marking a region containing the soma and proximal neurites and calculating
for each cell the total integrated pixel intensity in that region, rather than average fluorescence,
since photocurrents are likely to be related to the total number of membrane-bound channels
rather than average channel expression per area. Photon flux calculations for SSFO integration
properties were conducted by calculating the photon flux through the microscope objective at
each light power, and then dividing to reach the photon flux across the cell surface, based on the
diameter of the recorded cells and approximating cell shape as a spheroid.
Whole-cell patch-clamp recordings from thalamic slices
C57BL/6J wild-type (postnatal days 90-120) were anesthetized with pentobarbital (100 mg/kg,
i.p.) and decapitated. The thalamic slice preparation and whole-cell patch-clamp recordings were
performed using previously described techniques63,64. Recordings were obtained from nRT
(reticular thalamic) and TC (relay thalamocortical) neurons visually identified using differential
contrast optics with a Zeiss (Oberkochen, Germany), Axioskop microscope, and an infrared
video camera. For EPSCs and current-clamp recordings, the internal solution contained (in mM):
120 K-gluconate, 11 KCl, 1 MgCl2, 1 CaCl2, 10 Hepes, 1 EGTA. pH was adjusted to 7.4 with
KOH (290 mOsm). ECl- was estimated ~ -60 mV based on the Nernst equation. Potentials were
corrected for -15 mV liquid junction potential. For voltage-clamp experiments neurons were
clamped at -80 mV and EPSCs were pharmacologically isolated by bath application of the
GABAA receptor antagonist picrotoxin (50 �M, Tocris). In all recording conditions, access
resistance was monitored and cells were included for analysis only if the access resistance was
<18 M� and the change of resistance was <25% over the course of the experiment.
Optogenetic approach for thalamic recordings
25��

W W W. N A T U R E . C O M / N A T U R E | 2 5
SUPPLEMENTARY INFORMATION RESEARCH
600 nL rAAV5/CamKII�-hChR2(H134R)-EYFP or 900 nL rAAV5-CaMKIIa-
C1V1(E122T/E162T)-TS-mCherry virus was injected stereotaxically into ventrobasal thalamus
(VB) or barrel cortex, respectively, of C57BL/6J wild-type mice in vivo, between post-natal days
30-35. Intra-cortical and intra-thalamic (VB) injections were performed in the same mice (n=6).
Intra-cortical injections were preformed (from bregma) 1.3 mm posterior, 3 mm lateral, 1.15 mm
below the cortical surface. Intra-thalamic injections were 1.7 mm posterior, 1.5 mm lateral, 3.5
mm below the cortical surface. Mice were sacrificed ~2-3 months following injections and
horizontal brain thalamic slices were made for optical stimulation and in vitro recordings as
described above. VB thalamus was removed to avoid disynaptic activation of nRT neurons via
the CT-TC-nRT pathway63. Cutting VB thalamus from slices removed all photosensitive cell
bodies from the preparation (J.P. and J.H., unpublished data), enabled direct examination of CT-
nRT and TC-nRT projections, and did not affect the electrical membrane properties of nRT
neurons (not shown). Optical activation of ChR2-expressing TC and C1V1-expressing CT axons
were performed with 405 nm and 560 nm laser stimuli, respectively (5 ms duration light pulses,
2-3 mW) (OEM Laser Systems, MI) delivered with optic fiber (BFL 37-300, ThorLabs)
upstream along the CT and TC pathways projecting to nRT. We used minimal stimulation
intensity, defined as the light power that resulted in 50 to 70% failures (30 – 50% successes),
fixed response kinetics and low response amplitude variability. Consequent minimal evoked
EPSCs presumably resulted from selective optical activation of single CT or TC axons
presynaptic to the recorded cell. The stimulation light power was slightly increased (~5% above
minimal stimulation) until the number of failures became 0. CT and TC inputs were
(simultaneously) stimulated and minimal evoked EPSCs and EPSPs (each individually
subthreshold for action potential firing) were recorded in nRT cells (Supplementary Fig. 14).
Spectral analysis
Slice physiology data were imported into Matlab and analyzed using custom-written software.
Power spectra were calculated using the wavelet method as described by Sohal et al.55. Briefly, for
each frequency f we first filtered the recorded traces with a bandpass filter between f ± 5 Hz. We
then convolved the filtered traces with the wavelet function:
W(f,t) = s(t) * g(f,t)
26��
SUPPLEMENTARY INFORMATION
2 6 | W W W. N A T U R E . C O M / N A T U R E
RESEARCH
g(f,t) = e (2σ e-π ift )-12 2(-t )
where * denotes convolution, � = 5/(6f). We then used the squared amplitude of W(f,t) over a 500
msec window to measure the power at various frequencies. All power spectra from slice recordings
were normalized to 1/f.
Mutual information calculations
To study the effects of SSFO on sEPSC-spike rate information, we conducted whole-cell patch
recordings from visually identified pyramidal cells in layer V of mPFC. Using current clamp, we
stimulated a single pyramidal cell with a train of simulated EPSC waveforms. Individual sEPSC
events had peak current magnitudes of 200 pA and decayed with a time constant of 2 ms. Each
experiment was divided into 10 sweeps, each 10 seconds long and separated by 5 seconds to
minimize rundown. Each sweep was divided into 500 ms segments. The total number of sEPSCs
in each 500 ms segment was randomly chosen from a uniform distribution between 0 and 250.
Then, the times of the sEPSCs within the 500 ms segment were randomly selected from a
uniform distribution extending across the entire segment, simulating excitatory input from a
population of unsynchronized neurons. Empirically, these stimulation parameters reliably drove
pyramidal neurons at firing rates from 0 - 30 Hz (Supplementary Fig. 4c-e). In conditions
marked as baseline, a 10 sec pulse of 590 nm light was delivered to completely inactivate the
opsin before running the sEPSC protocol. In conditions where the opsin was activated, a 1 sec
pulse of 470 nm light preceded the sEPSC protocol.
To understand the net effect of altered E/I balance on information processing, we computed the
mutual information between each neuron’s input sEPSC rate and output spike rate, which
captures relevant changes in the shape of the IO curve and in the response variability55. First, we
estimated the joint distribution of sEPSC rate and spike rate by binning in time, sEPSC rate, and
spike rate and building a joint histogram. Time bins were 125 ms wide, and sEPSC rate was
divided into 10 equally spaced bins from 0 to 500 Hz, although the mutual information results
were consistent across a wide range of binning parameters. Spike rate was binned using the
smallest meaningful bin width given the time bin width (e.g. 8 Hz bin width for 125 ms time
27��
W W W. N A T U R E . C O M / N A T U R E | 2 7
SUPPLEMENTARY INFORMATION RESEARCH
bins). From this joint histogram, we compute mutual information, as previously described26
equaling the difference between response entropy and noise entropy. Response entropy
quantifies the total amount of uncertainty in the output spike rate of the neuron. Noise entropy
quantifies the uncertainty that remains in the output spike rate given the input rate. Note that the
maximum information that neural responses can transmit about the input stimulus is the entropy
of the stimulus set. For 10 equally spaced input sEPSC rate bins and a uniform distribution of
input rate over these bins, the entropy of the input rate is log2(10) = 3.322 bits. Mutual
information calculated from undersampled probability distributions can be biased upwards.
Consequently, all reported values of mutual information, response entropy and noise entropy
were corrected for bias due to undersampling. This correction is done by computing values from
smaller fractions (from one-half to one-eighth) of the full data and extrapolating to the limit of
infinite data65,66. Using 125 ms time windows, the correction factors were always less than 0.07
bits.
We also estimated the input-output transfer function for each neuron by averaging the output
spike rate across time bins with similar input sEPSC rates. We quantified the shape of the input-
output function by computing the dynamic range and saturation point of each neuron, treating the
baseline and opsin-activated conditions separately. Dynamic range was defined as the difference
between maximal and minimal output spiking rate across the range of input sEPSC rates.
Saturation point was defined as the lowest input sEPSC rate which drove the neuron at 90% of
its maximal output spike rate within that condition. A reduced saturation point cannot result from
a multiplicative reduction in gain or dynamic range, but instead indicates that the input-output
function becomes flatter at higher input sEPSC rates.
Behavioral testing
All animals undergoing behavioral experiments were acclimated to a 12-hour reverse light/dark
cycle. Prior to behavioral testing, animals were allowed to acclimate to the room in which
experiments were to be conducted for at least 1 hour before the experiments started.
The fear conditioning apparatus consisted of a square conditioning cage (18x18x30 cm) with a
grid floor wired to a shock generator and a scrambler, surrounded by an acoustic chamber
28��
SUPPLEMENTARY INFORMATION
2 8 | W W W. N A T U R E . C O M / N A T U R E
RESEARCH
(Coulburn instruments, PA, USA). The apparatus was modified to enable light delivery during
training and/or testing. To induce fear-conditioning mice were placed in the cage for 120
seconds, and then a pure tone (2.9 kHz) was played for 20 sec, followed by a 2 sec foot-shock
(0.5 mA). This procedure was then repeated, and immediate freezing behavior was monitored for
an additional 30 sec after the delivery of the second shock before the mice were returned to their
home cage. Fear conditioning was assessed 24 hours later by a continuous measurement of
freezing (complete immobility), the dominant behavioral fear response67. To test contextual fear
conditioning mice were placed in the original conditioning cage and freezing was measured for 5
min. To test auditory-cued fear conditioning mice were placed in a different context - a
pyramid-shaped cage with a smooth floor. As a control for the influence of the novel
environment, freezing was measured for 2.5 min in this new cage, and then a 2.9 kHz tone was
played for 2.5 min, during which conditioned freezing was measured. Light stimulation through
the fiberoptic connector was administered by delivering light through a custom patch-cord
connected to a 473 nm laser. The light pulse was delivered for 2 seconds at a power of 98 mW
mm-2 at the fiber tip. The results of the contextual- and cued-conditioning tests were analyzed by
a Student’s t-test.
Social interaction in the home cage was analyzed as previously described68. Briefly, a single
mouse in the homecage was allowed to freely roam in the absence of the cage top for one
minute. A novel juvenile (3-4 week old) male intruder was introduced to the opposite corner as
the resident male subject and allowed to roam freely for two minutes. Total physical interaction
between the two mice was quantified visually, scoring social interaction as the time during which
the resident mouse actively explored the intruder. Stimulation trials were conducted with the
addition of a two second pulse of 473nm light delivered via a fiber optic cable (Doric Lenses)
coupled to a chronically implanted fiber optic cable or chronically implanted non-invasive skull
fiber coupling device as indicated. Fiber was decoupled prior to experimentation and one-minute
acclimation period.
The three-chamber social test was conducted as described69. The test mice were introduced into
the center chamber of the three-chambered apparatus and allowed to acclimate for 10 minutes
with the doors to the two side chambers closed. Light pulses were applied at the beginning and
29��
W W W. N A T U R E . C O M / N A T U R E | 2 9
SUPPLEMENTARY INFORMATION RESEARCH
end of the 10 minute acclimation period. At the end of the acclimation period a novel conspecific
male mouse was introduced to the “social” chamber, inside a wire mesh cup (Galaxy
Pencil/Utility cup, Spectrum Diversified Designs). In the other (non-social) chamber, an identical
empty cup was placed. The designations of the social and non-social chambers were randomly
chosen in each test to prevent chamber bias. Between tests, the chambers were cleaned with 20
% ethanol and allowed to dry completely before initiating the next test. The time spent in the
non-social, center, and social chambers was quantified using automated tracking software
Viewer II (BiObserve, Fort Lee, NJ). Mice not exhibiting social exploration preference at
baseline were excluded from analysis.
The novel object exploration experiment was performed in the same three-chamber apparatus
used for the social behavior tests, and using the same general method. Mice were placed in the
center chamber with the doors to both side chambers closed. Light pulses were delivered during
the 10 minute acclimation period, after which the doors were opened and the mice were allowed
to explore the entire apparatus. In place of the wire mesh cups, novel objects were presented at
random in either of the two end-chambers. Exploration of the novel objects was scored over a
period of 10 minutes for each mouse as the time in which the mouse spent actively exploring the
object. Objects used were either plastic balls, cubes or porcelain figurines, all of approximately
similar size. Objects were thoroughly cleaned between tests to prevent odor traces.
The open-field chamber (50 × 50 cm) was divided into a central field (center, 23 × 23 cm) and an
outer field (periphery). Individual mice were placed in the periphery of the field and the paths of
the animals were recorded by a video camera. The total distance traveled was analyzed using the
Viewer2 software (BiObserve, Fort Lee, NJ). The open field test for each mouse consisted of a
5-min session divided into two 2.5 minute segments, with a 2 s 473nm light pulse delivered
between the two segments. Track length, velocity and % time in the center were scored for each
mouse and averaged across mice for each condition.
The elevated plus maze was made of plastic and consisted of two light gray open arms (30 × 5
cm), two black enclosed arms (30 × 5 × 30 cm) extending from a central platform (5 × 5 × 5 cm)
30��

SUPPLEMENTARY INFORMATION
3 0 | W W W. N A T U R E . C O M / N A T U R E
RESEARCH
at 90 degrees in the form of a plus. The maze was placed 30 cm above the floor. For each mouse,
a 2 s 473 nm light pulse was delivered when the mouse was in the home cage. 5 minutes later,
the fiberoptic connector was detached and the mice were individually placed in the center of the
maze for a test duration of 15 minutes. Video tracking software (ViewerII, BiObserve, Fort Lee,
NJ) was used to track mouse location. All measurements displayed were relative to the entire
mouse body.
Chronic electrophysiological recordings in awake mice
To simultaneously record from sites both within the virally-transduced tissue and outside of the
transduced region, we designed a novel chronic multisite optrode (CMO) for awake animal
recordings in combination with light delivery. We used arrays of four 25 µm tungsten wires
(California Fine Wire Company, Grover Beach, CA), wound together and cut at approximately
500 µm increments, and coupled these 4-wire bundles to an implantable fiberoptic lightguide
(IFL; Doric Lenses, Quebec, Canada) that consisted of a 2.5 mm diameter metal ferrule from
which a 200 µm-core fiberoptic cable extended. The four-wire bundle was back-fed into a 250
µm-diameter guide tube into which the fiberoptic cable was inserted. The wires were connected
using gold pins to a Mill-Max connector, to which a stainless steel ground wire was also
connected. The device was implanted stereotactically following virus injection (see above) such
that the fiber tip only extended past the skull but not into brain tissue. The ground wire was
inserted through a small craniotomy above cerebellum. Mice were allowed to recover for two
weeks before experiments began.
To record neural activity during behavior, the mice were first acclimated over several days to the
attachment of the headstage and the fiberoptic cable. The mice were allowed to explore the home
cage with the headstage attached for 1-2 hours each day. Recordings were carried out 2-4 weeks
after surgery. Signals were multiplexed at the head-stage into a 3-wire cable that was passed
through an electrical commutator (PlasticsOne), demultiplexed using a demultiplexing board
(Triangle BioSystems, Inc.) and digitized using Neuralynx Digital Cheetah. The fiberoptic and
electrical commutators were suspended from a weighted arm (Harvard Apparatus) to allow the
mouse to freely explore a large region (such as in the open field test). This configuration also
prevented both the recorded mouse and juvenile intruders (during the social interaction test)
31��

W W W. N A T U R E . C O M / N A T U R E | 3 1
SUPPLEMENTARY INFORMATION RESEARCH
access to any excess wire or optical fiber and minimized damage to the hardware. Videos were
recorded using Neuralynx Cheetah software and analyzed offline with Viewer II (BiObserve,
Fort Lee, NJ) to quantify open-field behavior. Social interactions and novel object exploration
were manually scored, as in other behavioral experiments. LFPs were filtered at 1 to 500 Hz and
sampled at a frequency of 6.5 kHz. Multiunit activity was recorded at 32 kHz and individual
events were collected with a threshold of 40 µV on all channels.
Wavelet power spectrograms of LFP recordings were analyzed as described above by sampling
the power spectrum every 2 s for the duration of the recording. Power was calculated between 2
Hz and 120 Hz with a bin width of 2 Hz. In all mice, the effects of SSFO activation were
recorded using a protocol of 2 minutes baseline recording, followed by a 1 s 473 nm pulse at an
irradiance of 56 mW mm-2 at the fiber tip. Following the blue pulse, activity was recorded for 2
minutes, followed by a 30 s deactivating light pulse at a wavelength of 594 nm light with similar
intensity. Activity was then recorded for 2 additional minutes. For each mouse this protocol was
repeated at least 4 times, and power spectra for each of the three periods (pre-activation, post-
activation and post-deactivation) were averaged across the 4 repetitions.
Social behavior experiments with the electrode-implanted mice were performed using the home-
cage paradigm68, as described above. No-light and light trials were separated by at least 24 hours,
using novel juvenile mice in each test. The test consisted of 2 minutes of baseline recording, then
1 minute of recording after the 1 s activation light pulse, after which the juvenile intruder was
introduced. Social behavior was scored for 2 minutes, followed by removal of the juvenile and a
30 s 594 nm light pulse to deactivate SSFO. Recordings were acquired during the entire time and
analyzed in the same way as described for the home-cage recordings above. Power spectra for
the 2 min social interaction period were averaged across mice for both the no-light and light
trials (Supplementary Fig. 8j). The novel object experiment in these mice was conducted in an
identical manner, replacing the novel juvenile mouse with an inanimate object.
Data analysis
Statistical significance was calculated using paired or unpaired two-tailed t-tests, as applicable.
For multiple comparisons of photocurrent amplitude, data were assessed for normality using the
32��
SUPPLEMENTARY INFORMATION
3 2 | W W W. N A T U R E . C O M / N A T U R E
RESEARCH
33��
Shapiro-Wilk test and pairwise t-tests were followed by Tukey’s post-hoc tests with � = 0.05.
Data were analyzed using the Matlab Statistics toolbox.
Immunohistochemistry
Animals that had undergone behavioral analysis were anesthetized with ketamine/xylazine and
perfused transcardially with ice-cold PBS followed by 4% paraformaldehyde in PBS (4% PFA).
Isolated brains were post-fixed in 4% PFA overnight at 4C and subsequently immersed in a
sterile cryoprotectant consisting of 30% sucrose in PBS until settling (2 to 3 days at 4ºC). 40µm
coronal slices were collected using a freezing microtome (Leica), washed in PBS, permeabilized
in 0.3% Triton X-100 (PBST) and blocked in 3% normal donkey serum dissolved in PBS for one
hour at room temperature. Nuclear localization of c-fos was determined using rabbit anti-c-fos
(Calbiochem) on animals that had undergone 1 s 473 nm light stimulation 90 minutes prior to
perfusion; parvalbumin targeting was confirmed using colocalization of mouse anti-parvalbumin
(Sigma Aldrich) and fluorescent protein. Stained slices were visualized on a Leica SP5 confocal
microscope. To calculate average fluorescence in different anatomical sub-regions, histology
images were analyzed using ImageJ. Individual subregion images were thresholded at a fixed
threshold level. Mean fluorescence above threshold was calculated and averaged per region
between mice. c-fos counts were performed using standardized landmarks to identify regions and
were anonymized prior to counting. Counting was done on z-stacks of the entire slice volume.
Data were only compared across experimental conditions in experiments where c-fos induction
was performed on the same day and in the same physical conditions, and where tissue
preparation, staining and imaging were done under standardized conditions.
W W W. N A T U R E . C O M / N A T U R E | 3 3
SUPPLEMENTARY INFORMATION RESEARCH
35��
References�
51� Boyden,� E.� S.,� Zhang,� F.,� Bamberg,� E.,� Nagel,� G.� &� Deisseroth,� K.� Millisecond�timescale,�genetically�targeted�optical�control�of�neural�activity.�Nat�Neurosci�8,�1263�1268�(2005).�
52� Dittgen,�T.�et�al.�Lentivirus�based�genetic�manipulations�of�cortical�neurons�and�their�optical�and�electrophysiological�monitoring�in�vivo.�Proc�Natl�Acad�Sci�U�S�A�101,�18206�18211�(2004).�
53� Hofherr,�A.,�Fakler,�B.�&�Klocker,�N.�Selective�Golgi�export�of�Kir2.1�controls�the�stoichiometry�of�functional�Kir2.x�channel�heteromers.�J�Cell�Sci�118,�1935�1943�(2005).�
54� Gradinaru,� V.� et� al.� Molecular� and� cellular� approaches� for� diversifying� and� extending�optogenetics.�Cell�141,�154�165�(2010).�
55� Sohal,�V.� S.,� Zhang,� F.,� Yizhar,�O.�&�Deisseroth,�K.�Parvalbumin�neurons� and� gamma� rhythms�enhance�cortical�circuit�performance.�Nature�459,�698�702�(2009).�
56� Stehfest,�K.,�Ritter,�E.,�Berndt,�A.,�Bartl,�F.�&�Hegemann,�P.�The�branched�photocycle�of�the�slow�cycling�channelrhodopsin�2�mutant�C128T.�J�Mol�Biol�398,�690�702�(2010).�
57� Zhang,�F.�et�al.�Multimodal� fast�optical� interrogation�of�neural� circuitry.�Nature�446,�633�639�(2007).�
58� Zhang,�F.�et�al.�Optogenetic�interrogation�of�neural�circuits:�technology�for�probing�mammalian�brain�structures.�Nat�Protoc�5,�439�456�(2010).�
59� Yizhar,�O.,�Fenno,�L.,�Davidson,�T.�J.,�Mogri,�M.�&�Deisseroth,�K.�Optogenetics�in�neural�systems.�Neuron�In�press�(2011).�
60� Gradinaru,�V.�et�al.�Targeting�and�readout�strategies�for�fast�optical�neural�control�in�vitro�and�in�vivo.�J�Neurosci�27,�14231�14238�(2007).�
61� Schoenenberger,� P.,� Gerosa,� D.�&� Oertner,� T.� G.� Temporal� control� of� immediate� early� gene�induction�by�light.�PLoS�One�4,�e8185�(2009).�
62� Schultheis,� C.,� Liewald,� J.� F.,� Bamberg,� E.,� Nagel,� G.�&� Gottschalk,� A.�Optogenetic� long�term�manipulation� of� behavior� and� animal� development.� PLoS� One� 6,� e18766,�doi:10.1371/journal.pone.0018766�(2011).�
63� Paz,� J.� T.� et� al.�A�new�mode�of� corticothalamic� transmission� revealed� in� the�GluA4� knockout�model�of�absence�epilepsy.�Nat�Neurosci�(2011).�
64� Paz,�J.�T.,�Christian,�C.�A.,�Parada,�I.,�Prince,�D.�A.�&�Huguenard,�J.�R.�Focal�cortical�infarcts�alter�intrinsic� excitability� and� synaptic� excitation� in� the� reticular� thalamic� nucleus.� J� Neurosci� 30,�5465�5479�(2010).�
65� Gollisch,�T.�&�Meister,�M.�Rapid�neural�coding�in�the�retina�with�relative�spike�latencies.�Science�319,�1108�1111�(2008).�
66� Strong,� S.�P.,�de�Ruyter� van� Steveninck,�R.�R.,�Bialek,�W.�&�Koberle,�R.�On� the� application�of�information�theory�to�neural�spike�trains.�Pac�Symp�Biocomput,�621�632�(1998).�
67� Fanselow,�M.�S.�Contextual�fear,�gestalt�memories,�and�the�hippocampus.�Behav�Brain�Res�110,�73�81�(2000).�
68� Winslow,�J.�T.�Mouse�social�recognition�and�preference.�Curr�Protoc�Neurosci�Chapter�8,�Unit�8�16�(2003).�
69� Moy,�S.�S.�et�al.�Sociability�and�preference�for�social�novelty�in�five�inbred�strains:�an�approach�to�assess�autistic�like�behavior�in�mice.�Genes�Brain�Behav�3,�287�302�(2004).�
70� Stehfest,� K.� &� Hegemann,� P.� Evolution� of� the� channelrhodopsin� photocycle� model.�Chemphyschem�11,�1120�1126,�doi:10.1002/cphc.200900980�(2010).�
71� Suzuki,�T.�et�al.�Archaeal�type�rhodopsins�in�Chlamydomonas:�model�structure�and�intracellular�localization.�Biochem�Biophys�Res�Commun�301,�711�717,�doi:S0006291X02030796�[pii]�(2003).�
�