Embed Size (px)
Citation preview

Ubiquitin binds the Amyloid β peptide and interferes with its clearance pathways
By
F. Bellia, V. Lanza, S. García-Viñuales, I. M. M. Ahmed, A. Pietropaolo, C. Iacobucci, G. Malgieri,
G. D’Abrosca, R. Fattorusso, V. G. Nicoletti, D. Sbardella, G. R. Tundo, M. Coletta, D. Calcagno,
L. Pirone, E. Pedone, G. Grasso, D. Milardi.
Supplementary information.
Electronic Supplementary Material (ESI) for Chemical Science.This journal is © The Royal Society of Chemistry 2019

Materials and Methods
Chemicals. Aβ40 (HFIP treated) was purchased from Bachem. Aβ1-16 was purchased form
Genscript. PBS (phosphate buffer saline), Tween 20, ubiquitin, and other chemicals were purchased
from Sigma-Aldrich. Carboxy-methyl-dextrane functionalized gold sensor slide (CMD3D) was
obtained from Bionavis Company.
IDE-dependent hydrolysis. Aβ40 (Genscript) was properly treated in order to enrich the sample of
monomer species according an experimental procedure previously reported.1 The amyloid peptide
(2 µM) was then incubated in phosphate buffer (1 mM, pH 7.4) with Ub (1-6 µM) IDE (5 nM).
Time-course experiments were carried out for 1 or 2 hours. The reaction of each sample aliquots
was stopped by adding TFA (1 %).
LC-MS measurements. Ultra-High Performance Liquid chromatography (UHPLC) analyses were
performed using a Ultimate 3000 (Thermo Electron Corporation, USA), and Q-Exactive hybrid
quadrupole-Orbitrap mass spectrometer (Thermo Electron Corporation, USA) was coupled to the
LC system for the high resolution detection of the amyloid peptide fragments. Capillary temperature
and voltage were 300 °C and 2 kV, respectively. The chromatographic analyses were performed
with solvents A (H2O:CH3CN 5:95, 0.01% TFA) and B (H2O:CH3CN 20:80, 0.01% TFA) on a
Easy Spray Accucore® C4 (75 µm × 150 mm, 2.6-μm particle size) column, at a flow rate of 300
nl/min. Peak detection for quantitative evaluation was carried out using the extracted ion
chromatogram (XIC) related to the most abundant charged species detected for each peptide
fragment. MS and MS–MS (HCD) spectra were used for identification and unambiguous
assignment of the peptide fragments (see Table S1).
MALDI-TOF measurements. MALDI-TOF MS experiments were performed using an AB SCIEX
MALDI-TOF/TOF 5800 Analyzer (AB SCIEX, Foster City, CA) equipped with a nitrogen UV
laser (λ = 337 nm) pulsed at a 20 Hz frequency. The mass spectrometer operated in the linear mode
was also, which consisted of an accelerating potential of 25 kV, a grid percentage of 93% and an
extraction delay of 800 ns. Mass spectra were recorded with the laser intensity set just above the
ionization threshold (4500 in arbitrary units) to avoid fragmentation and labile group losses, to
maximize the resolution, and to result in a strong analyte signal with minimal matrix interference.
Mass spectra were obtained by accumulation 800–1000 laser shots and processed using Data
Explorer 4.11 software (Applied Biosystems). A saturated solution of sinapinic acid in
water/acetonitrile 70:30 with 0.1% TFA was used as the matrix with the sample concentration
ranging from 0.2 to 1 μM. Experimental spectra were analysed using Data Explorer software.
Aβ aggregation assay. The monomerized Aβ peptide (20µM) was suspended in phosphate buffer 10
mM (pH 7.4), along with ThT (40 μM) and ubiquitin (from 4 µM to 60 µM); they were then
incubated in a black 96-well plate (Nalge-Nunc, Rochester, NY) for 65 hours at 37 °C in the
Varioskan plate reader (Thermo Scientific). The kinetics of amyloid aggregation was followed by
measuring the ThT fluorescence emission at 480 nm with an excitation wavelength of 450 nm. All
the measurements were carried out in triplicate and the experimental data were fitted to equation
(1):
𝑭(𝒕) = 𝑭𝟎 +𝒎𝒕 +𝑭𝒎𝒂𝒙−𝑭𝟎
𝟏+𝒆−
𝒕−𝒕𝟏𝟐⁄
𝒌
(1)
in which F0 and Fmax are the initial and final fluorescence emissions of amyloid aggregation
process, respectively; 1/k is the elongation rate constant and t½ is the time at which the amplitude of
ThT emission is 50% of the Fmax – F0 value. The lag time (tlag) is defined as the intercept between
the time axis and the tangent of the curve with slope k from the midpoint of the fitted sigmoidal
curve; this parameter was calculated from the fitted parameters by using the following equation:
𝒕𝒍𝒂𝒈 = 𝒕𝟏𝟐⁄− 𝟐𝒌 (2)
The kinetic parameters of any set of measurements were expressed as mean ± SD (Table S2).
Cross-linking MS. Cross-linking experiments were conducted in duplicate and the identified cross-
links were combined. All chemicals were obtained from Sigma Aldrich (Taufkirchen, Germany).
HPLC solvents were purchased from VWR (Darmstadt, Germany), Milli-Q water was produced by
a TKA Pacific system with X-CAD dispenser from Thermo Electron LED GmbH (Thermo Fisher
Scientific, Niederelbert, Germany). Cross-linking reactions. Ub stock solution was diluted to give a
final protein concentration of 10 μM (20 mM HEPES at pH 8.0). 1 uL of a freshly prepared stock
solution of Aβ40 in DMSO was added to 49 uL of Ub solution to a final Aβ40 concentrations of 10
μM. The protein solution was incubated for 30 min at 37° C or on ice and 0.5 ul of DSBU in DMSO
were added to a final concentration of 1 mM. The final concentration of DMSO was 3%vv. The
reaction was incubated for for 30 minutes at 37° C or 1 hour on ice and it was stopped with Tris
buffer (final concentration 20 mM).
Enzymatic in-solution digestion. Protein solutions were subjected to in-solution digestion with
trypsin/GluC mixture according to an existing protocol.2

Nano-HPLC/Nano-ESI-Orbitrap-MS/MS measurements. Peptide mixtures were analyzed by
LC/MS/MS on an UltiMate 3000 RSLC nano-HPLC system (Thermo Fisher Scientific) coupled to
an Orbitrap Q-Exactive Plus mass spectrometer (Thermo Fisher Scientific), equipped with
Nanospray Flex ion source (Thermo Fisher Scientific). Fragmentation was performed by HCD
(30 ± 3% NCE); data were acquired in data-dependent MS/MS mode. Each high-resolution full scan
(R = 140,000 at m/z 200) in the Orbitrap was followed by high-resolution HCD product ion scans
(R = 17,500 at m/z 200) within 5 s, starting with the most intense signal in the mass spectrum
(isolation window of 2 Th). A with maximum accumulation times of 250 ms was employed.
Dynamic exclusion (exclusion duration 60s) was enabled.
Identification of Cross-Linked Products. Cross-linked products were automatically annotated with
MeroX and manually validated. Mass deviations of 3 and 10 ppm were applied for precursor and
product ions. A 5% FDR cut-off and a signal-to-noise ratio of ≥ 2 were applied. Lys, Ser, Thr, and
Tyr were considered as potential cross-linking sites for DSBU. Oxidation of Met and
carbamidomethylation of cysteines were set as variable modifications. Three missed cleavage sites
were considered for each amino acid [Lys and Arg].
NMR analysis. Two samples were prepared for the NMR characterization. 100 M or 60M final
concentration of 15N-13C labeled human-Ubiquitin (Ub) (CortecNet, Voisins le Bretonneux France)
was dissolved in 500 L of 10 mM phosphate buffer (90% H2O, 10% 2H2O, pH 7.0). Aβ40
unlabeled was added to both solutions as a single aliquot of known amount of lyophilized peptide.
The final peptide concentration was in both cases 30 M. Freshly prepared sample were used
immediately. NMR experiments were acquired on each sample at 298 K on a Bruker Avance III HD
600 MHz equipped with cryoprobe at the Department of Environmental, Biological and
Pharmaceutical Sciences and Technologies of the University of Campania – Luigi Vanvitelli
(Caserta, Italy). Chemical shifts were calibrated indirectly by using external references. Data were
processed with the TopSpin 3.5 software (Bruker) and analysed by using CARA software
(computer aided resonance assignment - cara.nmr.ch). A standard set of triple resonance NMR
experiments were collected as previously reported4 to enable sequence-specific backbone and Cα
resonances assignment. The pulsed-field gradient spin-echo DOSY experiment was used to measure
the translation diffusion coefficient. The intensity variations of the amide cross-peaks were
evaluated using the equation: I = (I – I0)/I0, where I0 and I are the amide cross-peak intensities in
absence and in presence of Aβ40 respectively.

Molecular simulations. A40 and A42 underwent 75 ns of parallel tempering simulations in
explicit solvent, after an equilibration of 2 ns of MD in explicit solvent. GROMACS 5.0.4 package
was used.5 Parallel tempering simulations were used in order to boost the sampling of flexible
protein domains, avoiding any dependence on the starting coordinates. The overall charge of the
system was neutralized by adding three sodium ions. Periodic boundary conditions were applied.
The AMBER99SB6 force field was used for the biomolecules and counter ions, and the TIP3P force
field was used for water molecules7. Electrostatic interactions were calculated using the Particle
Mesh Ewald method.8 A cutoff (0.9 nm) was used for the Lennard-Jones interactions. The time-step
was set to 2 fs. All bond lengths were constrained to their equilibrium values using the SHAKE9
algorithm for water and the LINCS10 algorithm for the peptide. We simulated 64 replicas distributed
in the temperature range 300-400 K following a geometric progression. All replicas were simulated
in NVT ensemble using a stochastic thermostat with a coupling time of 0.1 ps.11 A thermostat that
yields the correct energy fluctuations of the canonical ensemble is crucial in parallel tempering
simulations.12 Exchanges were attempted every 0.1 ps. The method of Daura and Van Gunsteren13
was used in post-processing phase to cluster the resulting trajectories, with a cutoff of 4 Å
calculated on the backbone atoms as implemented in the clustering utility provided in the
GROMACS package5. The former protocol has been successful in a wealth of studies.14–19 Docking
simulations have been performed using HADDOCK interface.20 The three main A40 and Aβ42
clusters found through PT simulations were docked to the Ub structure whose starting coordinates
were considered from the X-ray structure of the complex between the UBA1 enzyme and Ub (pdb
code: 3CMM). The following residues of Ub were considered as active residues, since observed
through NMR experiments to interact with A40. Those involve Q2, L8, G10, K11, T12, I23, A46,
G47, Q49, K63, L71, R72 ,L73, R74. The binding surface of A40 and Aβ42 was considered as
active surface. Structures underwent rigid body energy minimization, semirigid simulated annealing
in torsion angle space, with a final clusterization of the results.
Surface Plasmon Resonance. To assess the interaction between ubiquitin and Aβ40 a multi-
parametric SPR instrument (Bionavis SPR Navi 210A) was used. Covalent Aβ40 immobilization
was obtained by amine coupling of the lysine-free amino groups and terminal amines of the peptide,
as described elsewhere.21 CMD3D sensor was mounted onto the sensor slide holder and then onto
the SPR Navi 210A instrument, previously equilibrated with the running buffer, PBS 10mM (pH
7.4). The flow cell temperature was set to 22C°. Activation of CMD3D sensor was performed
immediately previous Aβ injection through the reaction between EDC (0,2M)/NHS (0,05M) and
matrix carboxyl groups to achieve reactive succinimide ester groups that can react with primary
amines. Lyophilized amyloid beta 1-40 (HFIP treated) was dissolved in pure DMSO to a final

concentration of 1,6mM and stored in freezer at -20 C°. To avoid amyloid beta aggregation the
injection solutions were prepared immediately before immobilization step diluting the peptide stock
solution in sodium acetate buffer (10mM, pH 4); in particular two amyloid beta injections were
performed at 5 M for 10 minutes at 15 l/min and two injections at 10 M was performed for 15
minutes at 15 l/min. Immobilization was performed in parallel configuration in the channel 1
while in the channel 2 (reference channel) only running buffer was injected. At the end of the
immobilization step ethanolamine-HCl 1M (pH 8,5) was injected in serial mode for 10 minutes at
15 l/min to deactivate all the residual active sites on the surface. After deactivation step the final
immobilization angular delta (Δθ) was 0,27 degrees. Analysis of the binding curves was carried out
by the Tracedrawer software®. Residual values between the fitted curves and the experimental ones
are reported in figure S1. Fitting parameters are reported in Table S4.
Microscale Thermophoresis (MST). MST experiments were performed on a Monolith NT 115
system (Nano Temper Technologies, Munchen, Germany) using 100% LED and 20% IR-laser
power. The labelling of Ab40 and Ab1-16 (10 μM) was performed in labelling buffer with NT-647-
NHS reactive dye (30 μM) (Nanotemper), which reacts efficiently with the primary amines of the
proteins to form a stable dye protein conjugates. The labeling reaction was carried out for 30 min at
RT. A 16-point serial dilution (1:1) was prepared for ubiquitin at the final concentration ranged
from 1 mM to 30 nM in PBS tween 0.05%. The samples were filled into Standard capillaries and
measurements were conducted at 25 °C. An equation implemented by the software MO-S002 MO
Affinity Analysis, provided by the manufacturer, was used for fitting normalized fluorescence
values at different concentrations of ligands.21
Lys63 and Lys48 self-polyubiquitination reactions in Tube Tests. Lys63-linked polyUb reactions
were performed at pH 7.4 (T = 37 °C) in small volumes (40 μL) of a ligation buffer (50 mM TRIS,
5 mM MgCl2, 100 μM DTT, and 2 mM ATP) containing Ub (10 μM), UBE1 (500 nM), and
UbcH13/Uev (50 nM). Lys48 polyUb chain synthesis was carried out by mixing Ub (10 μM),
UBE1 (100 nM), and E2-25K (1 μM) in the same experimental conditions as those used for Lys63
polyUb reactions. All reactions were carried out at different Aβ1-16 to Ub molar ratios and constant
Ub concentration. The reactions were quenched after 3-hour incubation with addition of 10 µL of
the sample loading buffer containing 8% (w/v) SDS, 24% (v/v) glycerol, 0.015% Coomassie Blue
G, and were size-fractioned by SDS-polyacrylamide gel electrophoresis. Samples were then electro-
transferred onto a nitrocellulose membrane (GE Healthcare, Lifescience). The membranes were
blocked with Odyssey blocking buffer for 1 hour and then incubated overnight at 4°C with K48-

linkage specific polyubiquitin antibody. The membrane was washed thrice for 5 minutes with PBS-
T (PBS-0.05% Tween-20) and then incubated with IRDye 800–labeled secondary antibody
(1:12,000) from Molecular Probes (Eugene, OR) for 30 minutes. Membrane visualization was done
using the LI-COR Odyssey IR Imaging System (LI-COR Biosciences, Lincoln).
ELISA assay (Enzyme-Linked-ImmunoSorbent-Assay). To perform a protein/interaction experiment
was also used an Indirect ELISA approach. High binding plates (Ultracruz, Santacruz) were coated
with Ubiquitin or Abeta, alternatively. The peptides were diluted to a final concentration of 10 M
in carbonate/bicarbonate buffer, pH 9,6, and distributed to the selected wells of the plate for coating
reaction (overnight 4°C). The remaining protein-binding sites in the well were blocked by covering
the surface with 100 / 200 L blocking buffer (PBS-T) for 2hrs. The second protein/peptide
solution (20 M in PBS 100 uL pH 7,4) was then added to the selected wells. The sealed plate was
incubated for 2 hrs at room temperature. After washing and a further step of unspecific site
blocking, 100 L of the appropriately diluted primary monoclonal antibodies, anti Aβ (Mouse anti-
Aβ [1-16], Invitrogen) or anti Ubiquitin (Mouse anti-Ubiquitin VU-1, Life sensor) alternatively,
were added to each well, and sealed plate incubated overnight at 4°C. Each step was interrupted by
washing steps with PBS/Tween. Incubation for 1 hour at 37°C with the appropriately diluted HRPO
conjugated secondary anti mouse antibody (Invitrogen) to each well, was followed by detection.
The addition of TMB substrate solution (50 L, 20 minutes) to each well resulted in the
development of colored product. After stopping the enzymatic reaction the plate was read at 450 nm
by a plate reader (Multiskan Ascent). Neuroblastoma SHSY5Y cell cultures were grown until 80%
confluency and differentiated by classic retinoic acid treatment before mechanical harvesting and
homogeneization in PBS. A 30 min 12000 rpm centrifugation preceded the recovery of supernatant
cytoplasmic material used in the ELISA experiments.
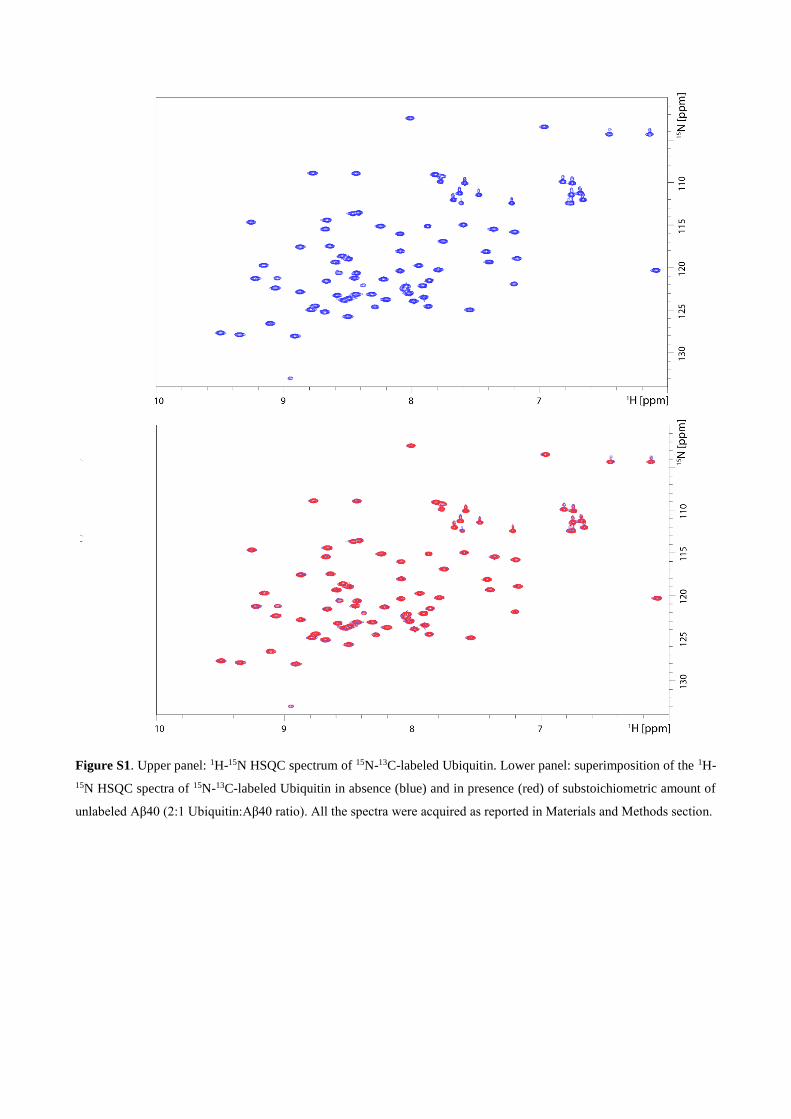
Figure S1. Upper panel: 1H-15N HSQC spectrum of 15N-13C-labeled Ubiquitin. Lower panel: superimposition of the 1H-
15N HSQC spectra of 15N-13C-labeled Ubiquitin in absence (blue) and in presence (red) of substoichiometric amount of
unlabeled Aβ40 (2:1 Ubiquitin:Aβ40 ratio). All the spectra were acquired as reported in Materials and Methods section.

Figure S2. The three lowest energy binding modes for the A42/Ub complex. A42 sections are shown by orange
ribbons, Ub sections are shown by green ribbons. The residues of Ub interacting with A42 are shown by solid sticks
and those involved in salt-bridge interactions are also labeled. The internal energies of the A42/Ub complex in the
three binding poses a)-c) are -4195 kcal/mol, -4140 kcal/mol, -4178 kcal/mol.

Figure S3. Residual values between the fitted curves and the experimental ones of the interaction between immobilized
Aβ40 and ubiquitin at increasing concentration: 43 M (green line)- 86 M (blue line)- 171 M (red line)- 343 M
(black line)- 755 M (orange line).
Figure S4. MST traces (left) of titrations of Aβ1-16 against Ubiquitin; F0 and F1 correspond to the fluorescence of
unbound state and bound state respectively. Plot of normalized fluorescence (right) obtained from Ubiquitin binding
experiment versus Aβ1-16 at different concentrations (from 1 mM to 20 nM).

A
B
Figure S5. Flowchart of the two different ELISA assays. The Aβ peptides covalently linked on the surface in the
microwells or in solution are shown as blue bars or semicircles, respectively. The graph schematically explains the two
situations occurred in the ELISA experiments (panel A). Inhibition ELISA histograms for different Ub solutions
(control Aβ/void: buffer; Aβ/Ub: 10 M Ub in buffer solution; Aβ/Lys: whole cell lysates; Aβ/Ub+Lys: 10 M Ub in
cell lysate) added to Aβ-coated microwells (panel B). Significant differences from control values were indicated by
(p<0.05) * (vs. control) ** (vs. lysate competition) (one-way ANOVA with Tukey’s post hoc test). Normalized data are
reported as percentages considering 100% the signal referring to the control Aβ/void.
0
50
100
150
200
250
300
350
control Aβ/void Aβ/Ub Aβ/lys Aβ/Ub+lys
% v
s co
ntr
ol
Ubiquitin binding to Aβ
*
**

Effect of Aβ40 on the proteasome activity
The inhibitory effect of Aβ40 on the proteasome activity was evaluated by using Aβ16-28 as the
substrate of proteasome 20S. Aβ40 is not appreciably degraded by proteasome within 30 min at
37°C (data not shown), whereas Aβ16-28 drops down to 33% of the starting concentration within the
same incubation time (Figure S4, 0:1 sample). Aβ40 clearly inhibits the proteasome mediated-
clearance of Aβ16-28 in a dose-dependent manner. When the larger [Aβ40]/[Aβ16-28] molar ratio was
used (3:1), the Aβ16-28 is not significantly degraded. This experiment demonstrates the inhibitory
effect of Aβ40 on the proteasome activity.
Figure S6. Dose dependent effect of the Aβ40 on the degradation of Aβ16-28 (2 µM) catalysed by yeast proteasome 20S
(2 nM) in Tris buffer 1 mM pH 8, at 37 °C for 30 min. Samples were analysed by means of nanoLC-HRMS. The peak
area of the XIC related to the main m/z species of the substrate (Aβ16-28) was referred to that one obtained before
starting the reaction with proteasome. Such values (% substrate) were reported as a function of the Aβ40 concentration
(expressed as a ratio between the Aβ40 and Aβ16-28 concentrations).
0
25
50
75
100
0:1 1:1 2:1 3:1
% s
ub
stra
te
[A1-40]:[A16-28]

Table S1. Intramolecular unique cross-links in Ub
10 µM Ub, 10 µM Aβ, 20 mM HEPES, pH 8,
Entry Site (1) Site (2) Cα-Cα distance
1 K27 K48 15.9 2 S20 K63 12.5 3 K48 K63 17.9 4 K48 S20 18.3 5 S65 K48 13.9 6 K63 K29 16.7 7 K63 K33 19.6 8 K48 K27 15.9 9 K29 K33 6.2 10 K27 S20 14.0 11 K48 K29 20.2 12 S20 K29 14.2 13 S65 K27 14.0
Table S2. Fitted kinetic parameters related to the aggregation of Aβ1–40 in the presence of Ub, being the Ubi:Aβ ratio
ranging from 0:1 (Aβ1–40 alone) to 3:1. All results are expressed as mean ± standard deviation (SD).
Ubi:Aβ 0:1 0.2:1 0.6:1 1:1 2:1 3:1
Fmax-F0 13.0 ± 0.9 11.6 ± 0.8 6.5 ± 0.5 4.2 ± 0.4 2.0 ± 0.2 2.2 ± 0.3
tlag 19.2 ± 0.9 23.9 ± 0.8 51.3 ± 0.9 44.4 ± 0.8 50.0 ± 0.9 63.7 ± 0.8
Table S2. List of the peptide fragments formed by the action of IDE on Aβ40 within 60 min at 37°C.
RT m/z (exp.) z m/z (theor.)
(ppm) Aβ peptide sequence
13.18 849.8667 2 849.8669 -0.3 1DAEFRHDSGYEVHH14
16.12 772.0374 3 772.0387 -1.8 1DAEFRHDSGYEVHHQKLVF19
16.75 674.3915 1 674.3911 0.6 34LMVGGVV40
17.35 791.4163 2 791.4178 -1.9 15QKLVFFAEDVGSNK28
17.73 821.0607 3 821.0615 -1.0 1DAEFRHDSGYEVHHQKLVFF20
20.36 943.5054 2 943.5068 -1.4 21AEDVGSNKGAIIGLMVGGVV40
20.94 1017.0392 2 1017.0410 -1.8 20FAEDVGSNKGAIIGLMVGGVV40
21.11 1082.7954 4 1082.7949 0.4 1DAEFRHDSGYEVHHQKLVFFAEDVGSNKGAIIGLMVGGVV40
21.72 929.1727 3 929.1744 -1.8 14HQKLVFFAEDVGSNKGAIIGLMVGGVV40
22.26 883.4869 3 883.4881 -1.3 15QKLVFFAEDVGSNKGAIIGLMVGGVV40

Table S4 - Kinetic parameters obtained from the fitting of the SPR curves reported in Error! Reference source not
found.. Data were calculated using the “OneToOne” fitting model.
[Ub] (M) Bmax ([Signal (mdeg)])
ka (1/(M*s)) kd (1/s) KD (M) Chi2 ([Signal (mdeg)]^2)
43 3 5,33E+01 1,90E-02 3,56E-04 0
86 3 5,33E+01 1,90E-02 3,56E-04 0
171 3 5,33E+01 1,90E-02 3,56E-04 0
343 3 5,33E+01 1,90E-02 3,56E-04 0
755 3 5,33E+01 1,90E-02 3,56E-04 0
References
1 V. Oliveri, F. Bellia and G. Vecchio, ChemPlusChem, 80, 762–770.
2 M. Götze, J. Pettelkau, R. Fritzsche, C. H. Ihling, M. Schäfer and A. Sinz, J. Am. Soc. Mass
Spectrom., 2015, 26, 83–97.
3 M. Palmieri, L. Russo, G. Malgieri, S. Esposito, I. Baglivo, A. Rivellino, B. Farina, I. de Paola, L.
Zaccaro, D. Milardi, C. Isernia, P. V. Pedone and R. Fattorusso, Journal of Inorganic
Biochemistry, 2014, 131, 30–36.
4 B. Hess, C. Kutzner, D. van der Spoel and E. Lindahl, J Chem Theory Comput, 2008, 4, 435–447.
5 V. Hornak, R. Abel, A. Okur, B. Strockbine, A. Roitberg and C. Simmerling, Proteins, 2006, 65,
712–725.
6 W. L. Jorgensen, J. Chandrasekhar, J. D. Madura, R. W. Impey and M. L. Klein, The Journal of
Chemical Physics, 1983, 79, 926–935.
7 U. Essmann, L. Perera, M. L. Berkowitz, T. Darden, H. Lee and L. G. Pedersen, The Journal of
Chemical Physics, 1995, 103, 8577–8593.
8 S. Miyamoto and P. A. Kollman, Journal of Computational Chemistry, 13, 952–962.
9 B. Hess, J. Chem. Theory Comput., 2008, 4, 116–122.
10 G. Bussi, D. Donadio and M. Parrinello, The Journal of Chemical Physics, 2007, 126,
014101.
11 E. Rosta, N.-V. Buchete and G. Hummer, J. Chem. Theory Comput., 2009, 5, 1393–1399.
12 X. Daura, K. Gademann, B. Jaun, D. Seebach, W. F. van Gunsteren and A. E. Mark,
Angewandte Chemie International Edition, 38, 236–240.
13 G. Pandini, C. Satriano, A. Pietropaolo, F. Gianì, A. Travaglia, D. La Mendola, V. G.
Nicoletti and E. Rizzarelli, Front. Neurosci., , DOI:10.3389/fnins.2016.00569.
14 A. Travaglia, A. Pietropaolo, R. Di Martino, V. G. Nicoletti, D. La Mendola, P. Calissano
and E. Rizzarelli, ACS Chem. Neurosci., 2015, 6, 1379–1392.
15 A. Travaglia, D. La Mendola, A. Magrì, A. Pietropaolo, V. G. Nicoletti, G. Grasso, G.
Malgieri, R. Fattorusso, C. Isernia and E. Rizzarelli, Inorg. Chem., 2013, 52, 11075–11083.
16 I. Naletova, V. G. Nicoletti, D. Milardi, A. Pietropaolo and G. Grasso, Metallomics, 2016, 8,
750–761.
17 G. Grasso, A. Magrì, F. Bellia, A. Pietropaolo, D. La Mendola and E. Rizzarelli, Journal of
Inorganic Biochemistry, 2014, 130, 92–102.
18 G. Grasso, V. Lanza, G. Malgieri, R. Fattorusso, A. Pietropaolo, E. Rizzarelli and D.
Milardi, Chemical Communications, 2015, 51, 15724–15727.
19 S. J. de Vries, M. van Dijk and A. M. J. J. Bonvin, Nature Protocols, 2010, 5, 883–897.
20 G. Grasso, P. Mielczarek, M. Niedziolka and J. Silberring, International Journal of
Molecular Sciences, 2014, 15, 16787–16799.
21 G. Smaldone, L. Pirone, A. Capolupo, L. Vitagliano, M. C. Monti, S. Di Gaetano and E.
Pedone, International journal of biological macromolecules, 2018, 115, 469–475.
![Colloid-amyloid Bodies in PUVA-treated Human Psoriatic ...Amyloid of primary cutaneous amyloidoses such as lichen amyloidosus [5, 17], macular amyloidosis [6] and amyloid dep- osition](https://img.pdfslide.us/doc/110x75/5e62f6a65098527daa05e73b/colloid-amyloid-bodies-in-puva-treated-human-psoriatic-amyloid-of-primary-cutaneous.jpg)