Embed Size (px)
Citation preview
Supplementary Information
Novel small molecules targeting ciliary transport of Smoothened and oncogenic Hedgehog pathway activation
by
Bomi Jung1,2, Ana C. Messias3,5, Kenji Schorpp4, Arie Geerlof3, Günter Schneider6,7, Dieter Saur6,7,9,10, Kamyar Hadian4, Michael Sattler3,5, Erich E. Wanker11, Stefan Hasenöder1,2
& Heiko Lickert1,2,7,8
1Institute of Diabetes and Regeneration Research, 2Institute of Stem Cell Research,
3Institute of Structural Biology, 4Assay Development and Screening Platform, Helmholtz Zentrum München, Germany,
5Center for Integrated Protein Science Munich at Biomolecular NMR Spectroscopy, Department Chemistry, Technische Universität München, 85747 Garching, Germany
6Department of Internal Medicine II, Klinikum rechts der Isar, 7Technische Universität München, München, Germany. 8German Center for Diabetes Research (DZD), Germany. 9German Cancer Consortium (DKTK), Heidelberg, Germany. 10German Cancer Research
Center (DKFZ), Heidelberg, Germany. 11Neuroproteomics, Max Delbrueck Center for Molecular Medicine, 13125 Berlin, Germany
Correspondence and requests for materials should be addressed to H.L. ([email protected]) Heiko Lickert Helmholtz Zentrum München Parkring11 D-85748, Garching Germany PHONE: +49 89 3187 3760 FAX: +49 89 3187 3761
Supplementary Materials and Methods
Cell viability assay
Cells were seeded at approximately 70-80% confluence on 96 well plates. The following day, cells
were subjected to serum deprivation and subsequently treated with Shh (500 ng/ml, R&D systems)
plus one of the compounds or DMSO for 24 or 48 h. AlamarBlue reagent (Invitrogen) was directly
added to cells in the culture medium according to the manufacturer's protocol and incubated for 3 h at
37 degree in a cell culture incubator. Absorbance of alamarBlue was monitored at 570nm.
Quantitative PCR
Total RNA was obtained using Trizol and miRNeasy micro kit (Qiagen) according to the
manufacturer's protocol. Subsequently, cDNA was prepared with the Super Script Synthesis System
(Invitrogen). TaqMan® qPCR was performed by using 25 ng of cDNA per qPCR reaction and the
following probes according to the manufacturing instruction; TaqMan probes: Gli1
(Mm00494654_m1), Ptch1 (Mm00436026_m1), GFP (Mr04329676_mr), GAPDH
(Mm99999915_g1). The analysis was carried out in biological triplicates.
Hh/Gli1 target gene activation in Sufu-/-
MEFs
Sufu-/- MEFs (a gift from Prof. Rune Toftgård, Karolinska Institute, Sweden) were maintained in
standard DMEM medium (Invitrogen), supplemented with 10% FCS, 2 mM L-Glutamine and 1%
Penicillin/Streptomycin. Cells were seeded at approximately 70-80% confluence. The following day,
Sufu-/- MEFs were concurrently subjected to serum deprivation and the treatment of compounds, Cyc,
or DMSO for 24 h. To check the effect of compounds on Sufu-/- MEFs, the total RNA was isolated and
cDNA was prepared as described above. Gli1 mRNA expression levels were determined by
quantitative PCR using TaqMan Gli1 probe as mentioned above.
Immunoprecipitation
HEK293T cells were transiently transfected using PEI (polyethylenimine, Polysciences) as previously
described1. Importantly, the cells were treated with 20uM compounds immediately after transfection to
prevent protein-protein interactions. 24h after transfection with compound treatment, the cells were
lysed in IP lysis buffer (30 mM Tris-HCl, pH 7.5, 150 mM NaCl, 0.5% NP-40) containing protease
inhibitor cocktail (Roche) and after centrifugation, the supernatant was subsequently incubated with

Strep-Tactin superflow resin (IBA) for overnight at 4°C on a rotating wheel (14rpm). After extensive
washing with IP lysis buffer, the protein complexes were analyzed by immunoblotting with anti-HA
primary antibody (1:1000, Sigma).
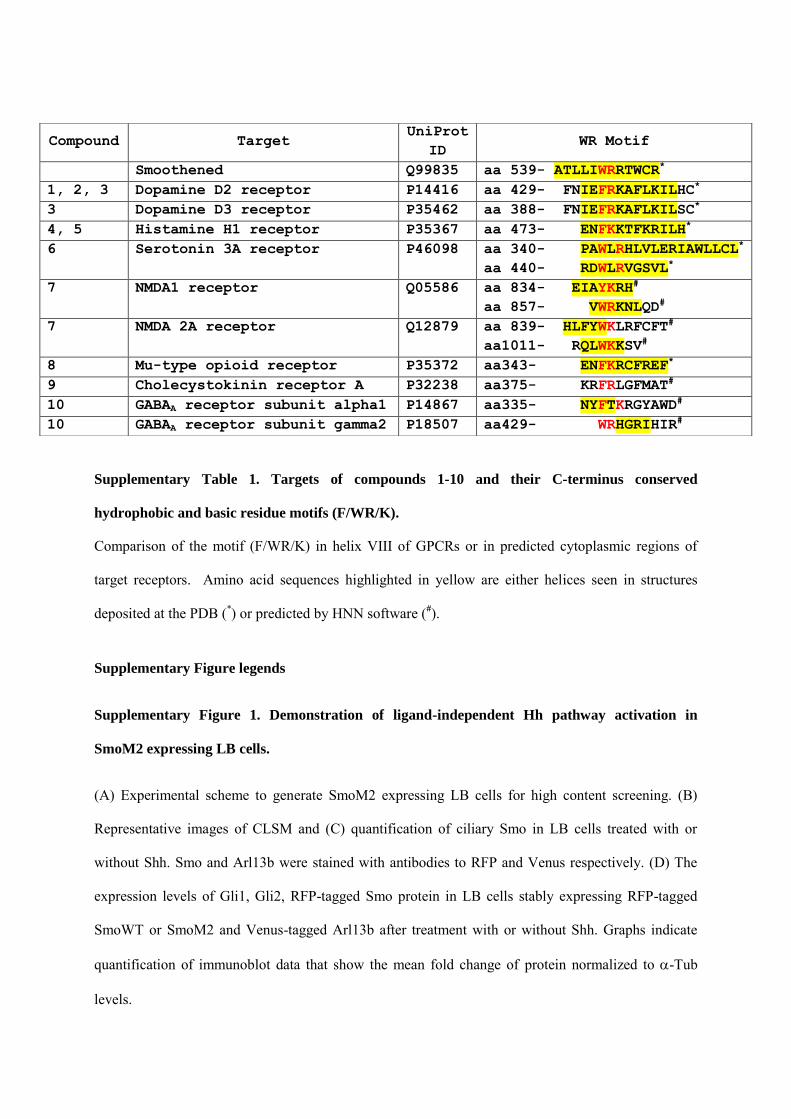
Supplementary Table 1. Targets of compounds 1-10 and their C-terminus conserved
hydrophobic and basic residue motifs (F/WR/K).
Comparison of the motif (F/WR/K) in helix VIII of GPCRs or in predicted cytoplasmic regions of
target receptors. Amino acid sequences highlighted in yellow are either helices seen in structures
deposited at the PDB (*) or predicted by HNN software (#).
Supplementary Figure legends
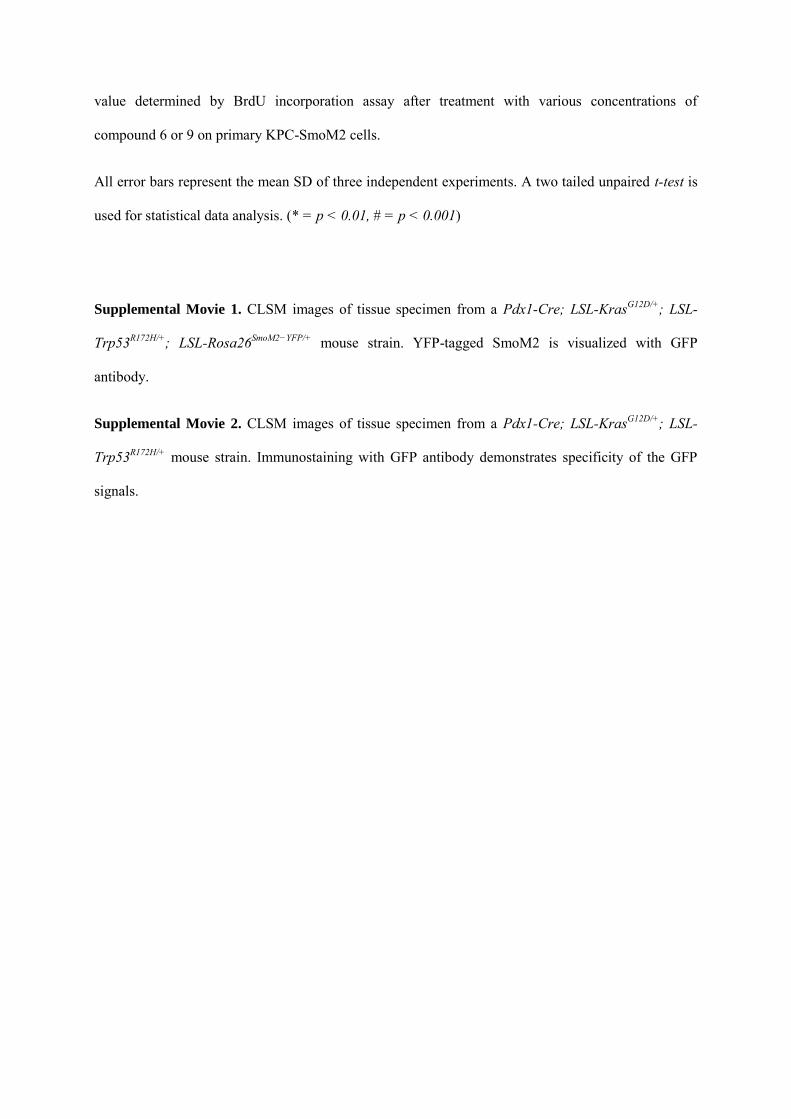
Supplementary Figure 1. Demonstration of ligand-independent Hh pathway activation in
SmoM2 expressing LB cells.
(A) Experimental scheme to generate SmoM2 expressing LB cells for high content screening. (B)
Representative images of CLSM and (C) quantification of ciliary Smo in LB cells treated with or
without Shh. Smo and Arl13b were stained with antibodies to RFP and Venus respectively. (D) The
expression levels of Gli1, Gli2, RFP-tagged Smo protein in LB cells stably expressing RFP-tagged
SmoWT or SmoM2 and Venus-tagged Arl13b after treatment with or without Shh. Graphs indicate
quantification of immunoblot data that show the mean fold change of protein normalized to -Tub
levels.
Compound Target UniProt
ID WR Motif
Smoothened Q99835 aa 539- ATLLIWRRTWCR*
1, 2, 3 Dopamine D2 receptor P14416 aa 429- FNIEFRKAFLKILHC*
3 Dopamine D3 receptor P35462 aa 388- FNIEFRKAFLKILSC*
4, 5 Histamine H1 receptor P35367 aa 473- ENFKKTFKRILH*
6 Serotonin 3A receptor P46098 aa 340- PAWLRHLVLERIAWLLCL*
aa 440- RDWLRVGSVL*
7 NMDA1 receptor Q05586 aa 834- EIAYKRH#
aa 857- VWRKNLQD#
7 NMDA 2A receptor Q12879 aa 839- HLFYWKLRFCFT#
aa1011- RQLWKKSV#
8 Mu-type opioid receptor P35372 aa343- ENFKRCFREF*
9 Cholecystokinin receptor A P32238 aa375- KRFRLGFMAT#
10 GABAA receptor subunit alpha1 P14867 aa335- NYFTKRGYAWD#
10 GABAA receptor subunit gamma2 P18507 aa429- WRHGRIHIR#
Scale bar = 25 m. > 100 cilia were analyzed per condition. All error bars represent the mean SD of
three independent experiments. A two tailed unpaired t-test is used for statistical data analysis. (* = p
< 0.1, ** = p < 0.01, # = p < 0.001)
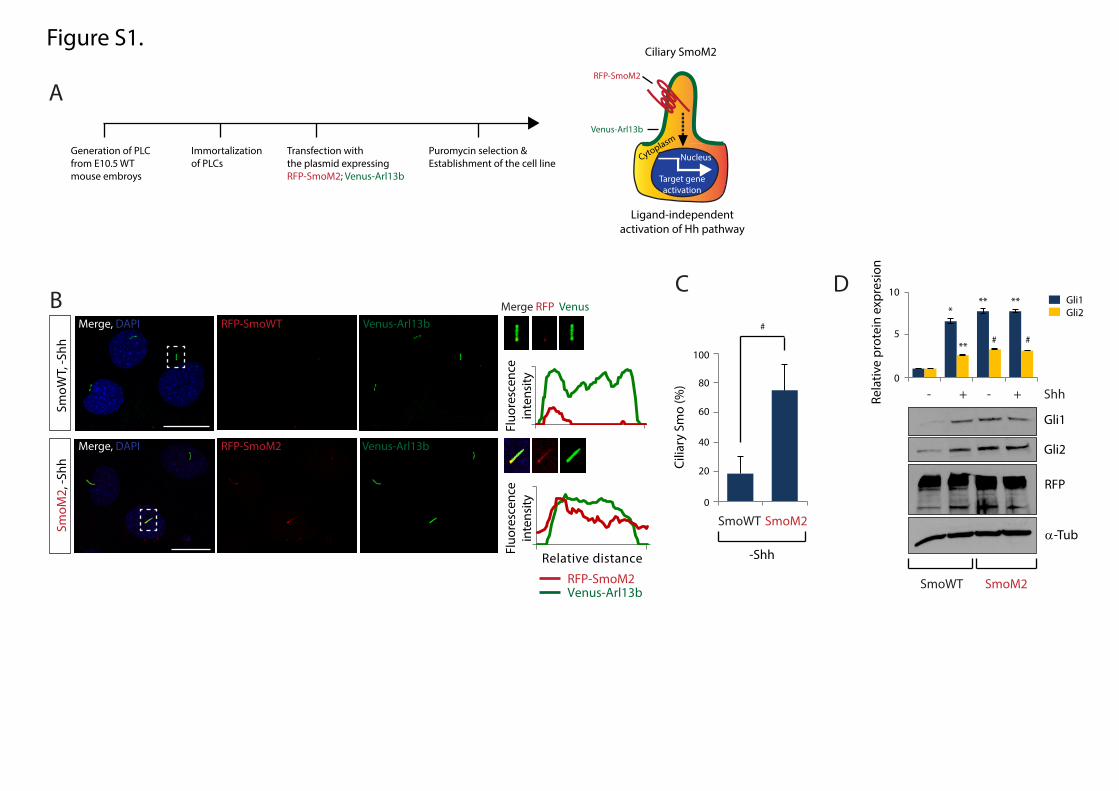
Supplementary Figure 2. High content screening for identification of small molecule inhibitors
of ciliary accumulation of oncogenic SmoM2.
(A) Experimental scheme for high content screening. (B) Representative high content screening
images of LB cells stably expressing RFP-tagged SmoM2 and Venus-tagged Arl13b. SmoM2 and
Arl13b were stained with antibodies to RFP and Venus respectively. (C) Quantification of
fluorescence intensity of ciliary SmoM2 after hit validation.
Supplementary Figure 3. Compounds effect on ciliary SmoM2 localization in SmoM2 expressing
LB cells.
Representative CLSM images of SmoM2 expressing LB cells treated with compound 1-10, Cyc, or
GDC-0449. SmoM2 and Arl13b were visualized by staining with RFP and Venus antibodies
respectively. Scale bar = 10 m. > 100 cilia were analyzed per condition. All experiments were
repeated at least three times.
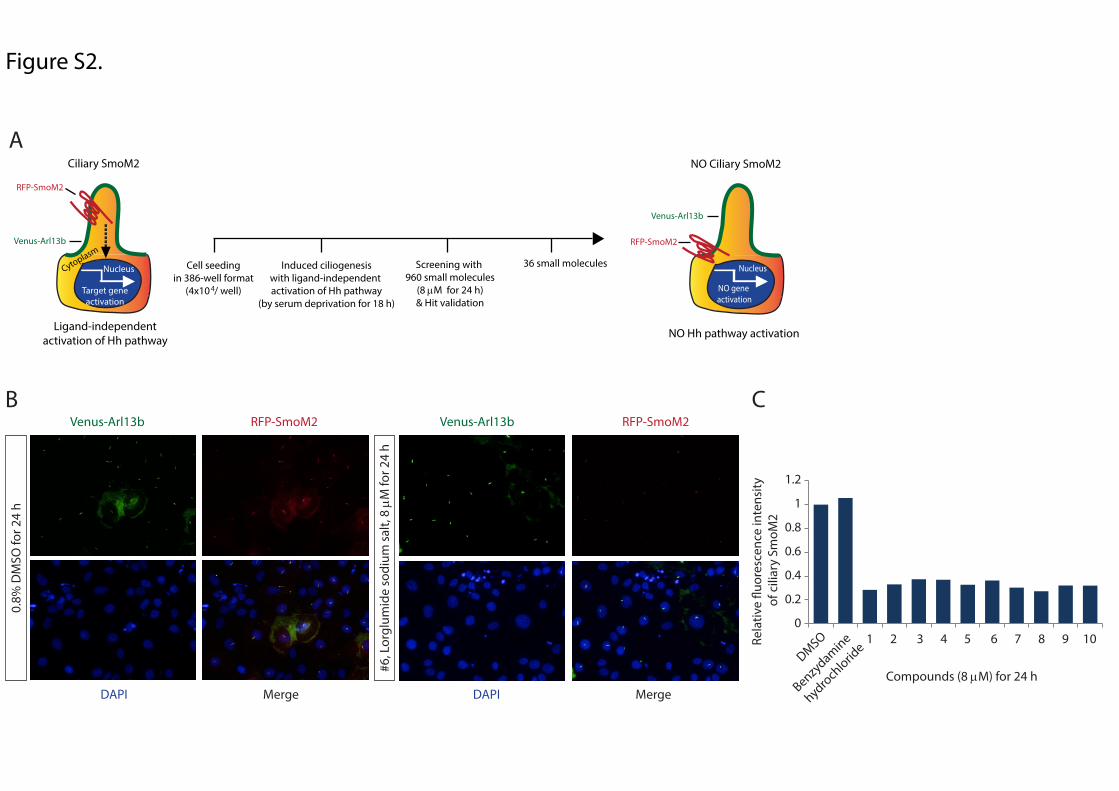
Supplementary Figure 4. Compounds suppress ciliary accumulation of endogenous Smo.
Representative CLSM images of (A) NIH3T3 cells and (B) Ptch1-/- MEFs treated with compound 1-
10, or Cyc. PC were stained with an antibody to Ace-Tub and Smo were visualized with a Smo
antibody. Scale bar = 10 m. > 100 cilia were analyzed per condition. All experiments were repeated
at least three times.
Supplementary Figure 5. Cell viability is not affected by compounds treatment.
Cell viability measured after 24 or 48 h of exposure to various concentrations of compound 1-10.
All error bars represent the mean SD of three independent experiments. D = DMSO, 0.1%
Supplementary Figure 6. Determination of IC50 values for Hh pathway in GBS-GFP MEFs.
IC50 value determined by GFP and Ptch1 mRNA expression levels after treatment with various
concentrations of compounds on GBS-GFP MEFs. Relative expression was normalized against
GAPDH expression level. The data represent the mean values of three independent experiments.
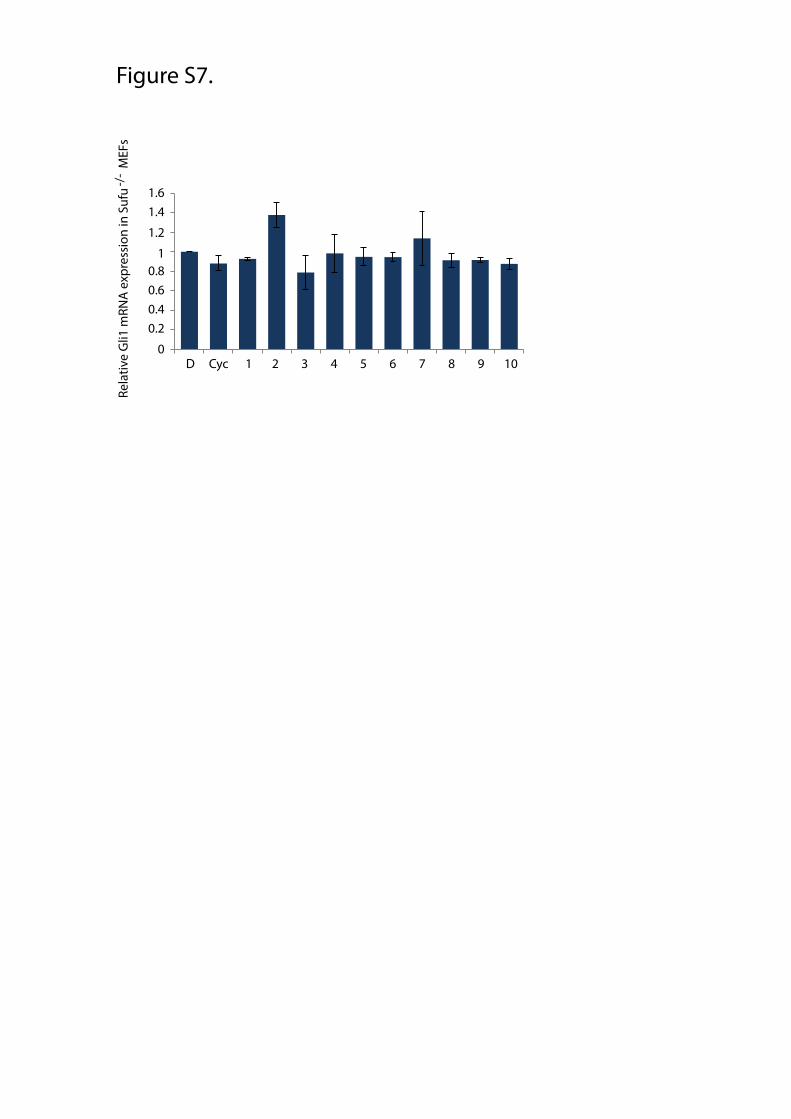
Supplementary Figure 7. Compounds effect on Hh/Gli1 target gene expression in Sufu-/-
MEFs.
Quantitative levels of Gli1 mRNA expression in Sufu-/- MEFs were measured by qPCR after treatment
with compounds. Relative expression was normalized against GAPDH expression level.
All error bars represent the mean SD of three independent experiments. D = DMSO, 0.1%; Cyc, 10
M; compound 1-4, 10 μM; compound 5-10, 20 μM
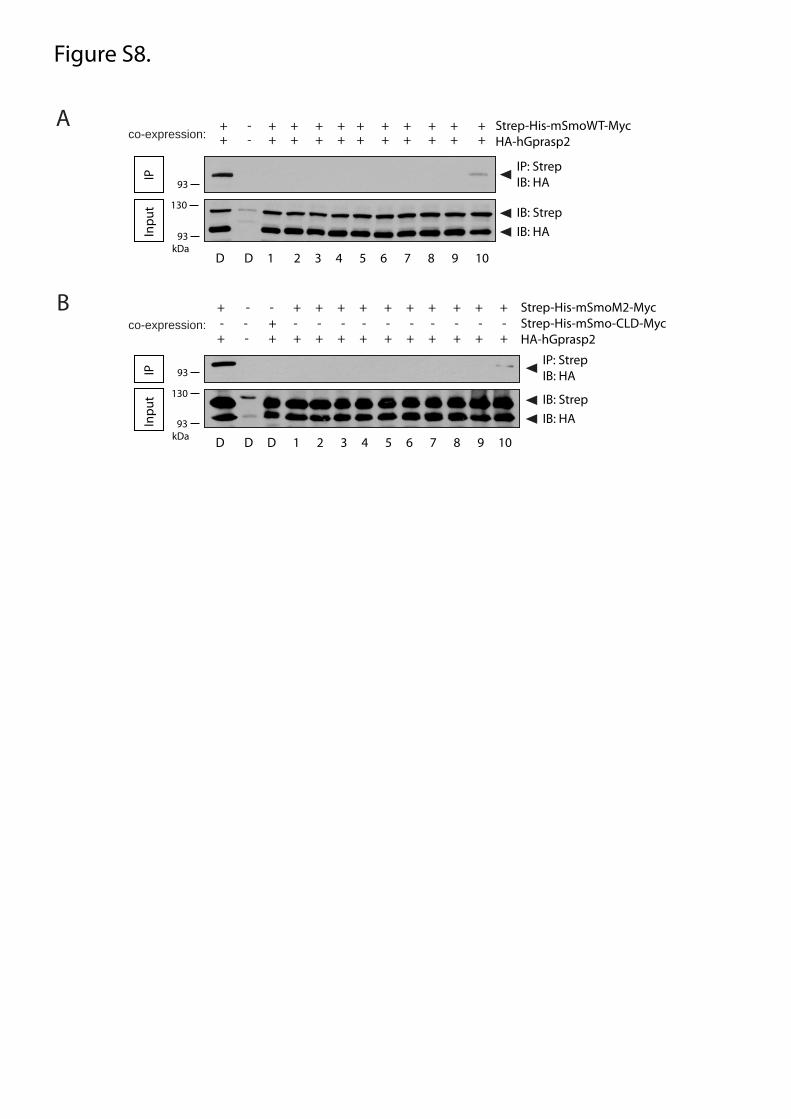
Supplementary Figure 8. All compounds, with the exception of compound 10, interfere with
Gprasp2 binding to SmoWT and to SmoM2.
(A, B) Confirmation of compounds interference with Smo-Gprasp2 complex formation in co-
immunoprecipitation (co-IP). HEK293T cells were transiently co-transfected with the indicated
expression plasmids. Concurrently, the cells were treated with 20 μM compounds and 24 h later the
cell lysates were subsequently subjected to immunoprecipitation. Note that 10% input and Smo-
Gprasp2 protein interactions were detected by immunoblotting with the indicated antibodies.
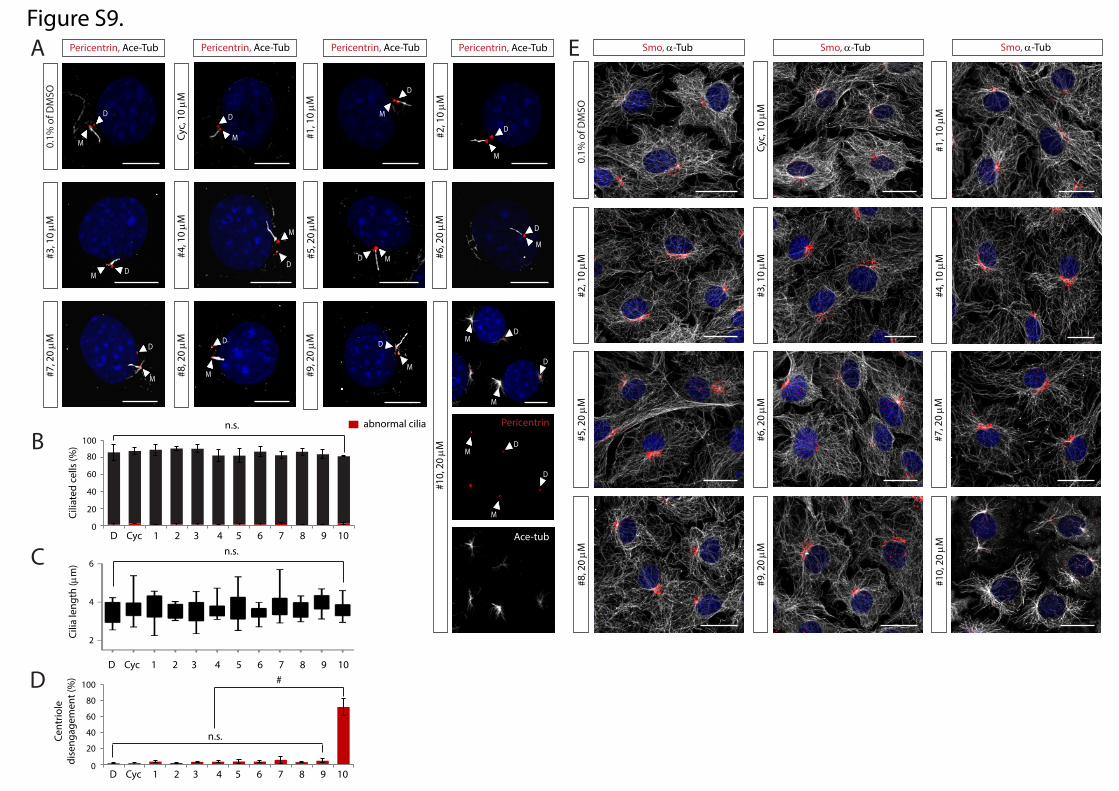
Supplementary Figure 9. Ciliogenesis is unaffected by all compounds, but cytoplasmic
distribution of Smo is disrupted by compound 10.
(A, E) Representative CLSM images of NIH3T3 cells treated with or without compound 1-10. (A) PC
were stained with an antibody to Ace-Tub and basal bodies were visualized with a pericentrin
antibody. (E) Microtubule network and endogenous Smo distribution were visualized with antibodies
to -Tub and Smo respectively. The quantification of (B) ciliation and cilia abnormality, (C) cilia
length, and (D) centriole disengagement of NIH3T3 cells after treatment with compound 1-10.
Scale bar = 10 m (A); 25 m (E). > 100 cilia were analyzed per condition. All error bars represent
the mean SD of three independent experiments. A two tailed unpaired t-test (B, D) and a one-way
Anova (C) were used for statistical data analysis. (# = p < 0.0001)
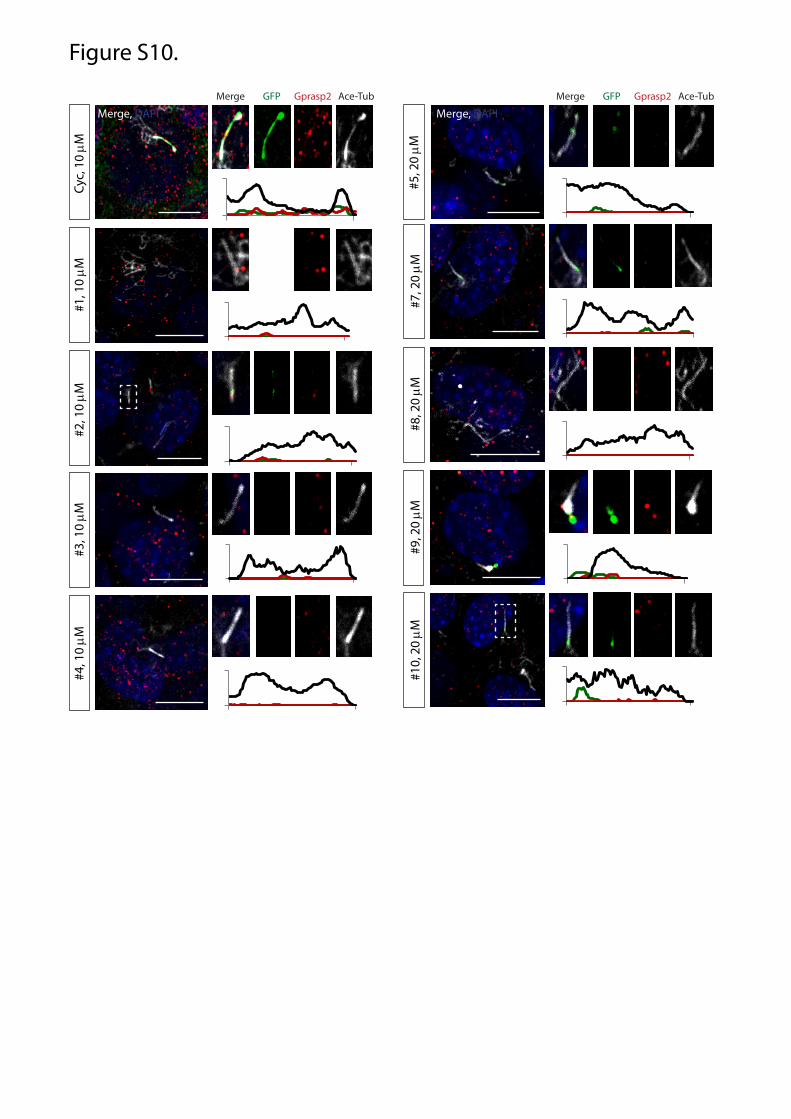
Supplementary Figure 10. Compounds inhibit ciliary SmoM2 accumulation in primary SmoM2
PDAC cells.
Representative CLSM images of primary KPC-SmoM2 cells treated with compound 1-10 or Cyc.
SmoM2 and Gprasp2 are visualized with antibodies to GFP and Gprasp2 respectively and PC are
visualized with an antibody against Ace-Tub.
Scale bar = 10 m. > 100 cilia were analyzed per condition. All experiments were repeated at least
three times.
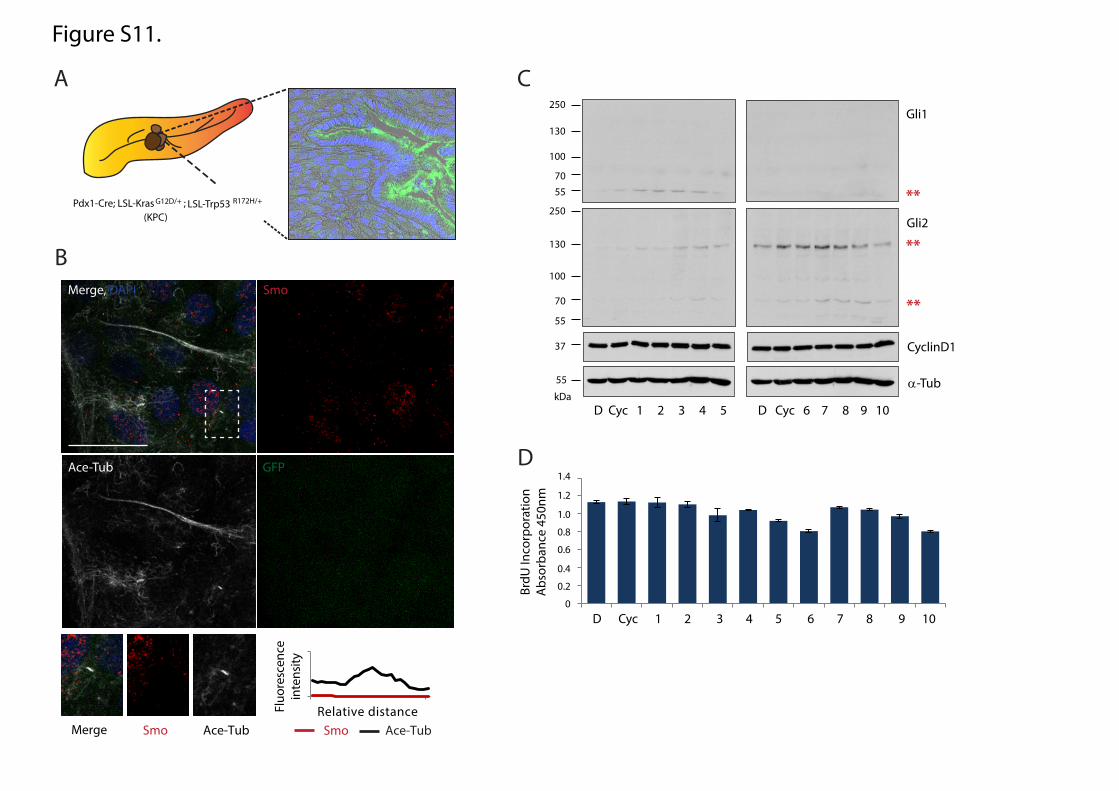
Supplementary Figure 11. Compounds do not effect on PDAC which do not show ciliary Smo-
dependent Hh activity.
Representative CLSM images of (A, Movie S2) tissue specimen and (B) primary PDAC cells from a
Pdx1-Cre; LSL-KrasG12D/+; LSL-Trp53R172H/+ (KPC) mouse strain. (A, B) Immunostaining with GFP
antibody demonstrates specificity of the GFP signals shown in Figure 4 (A, B, F) and Figure 5 (B).
Immunostaining against Ace-Tub and Smo antibodies show rare ciliation and no signs of Smo ciliary
translocation. (C) Protein expression levels of Gli1, Gli2, (** indicates non-specific bands) and
CyclinD1 after treatment with compound 1-10 on primary KPC cells. (D) Statistical analysis of BrdU
incorporation after compound 1-10 treatment on primary KPC cells.
Scale bar = 25 m. > 100 cilia were analyzed per condition. All error bars represent the mean SD of
three independent experiments. D = DMSO, 0.1%; Cyc, 10 M; compound 1-4, 10 μM; compound 5-
10, 20 μM
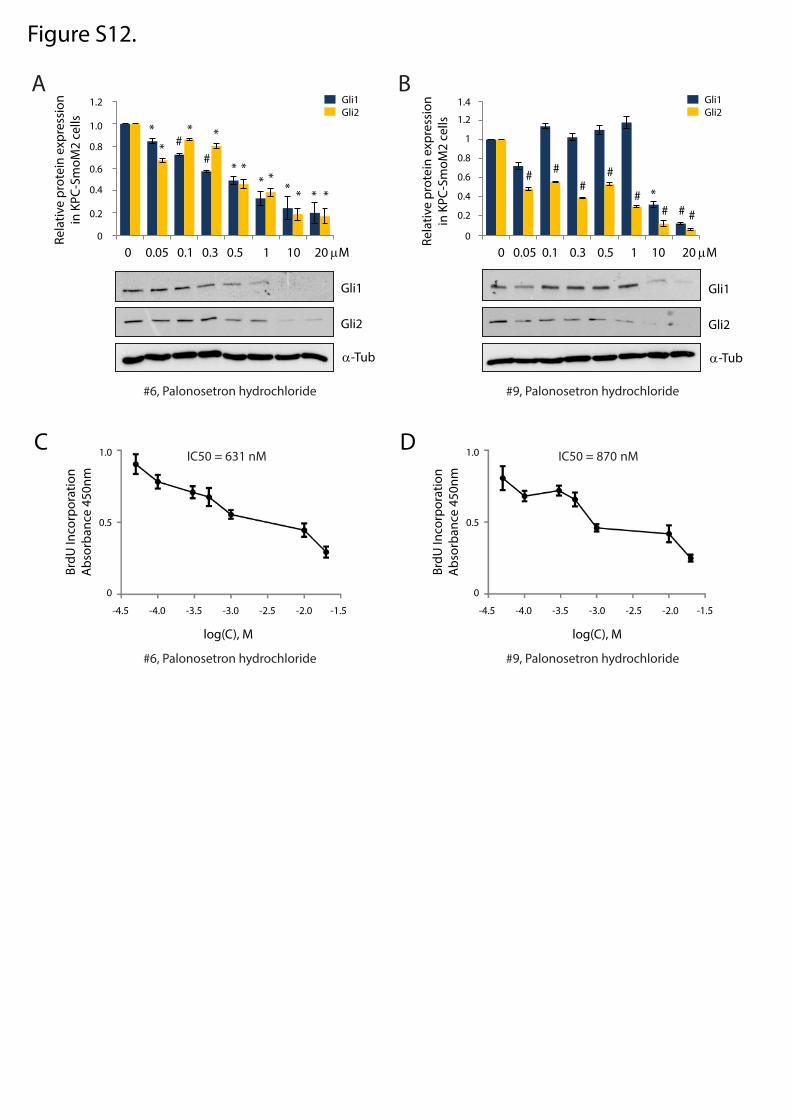
Supplemental Figure 12. Effective concentration and half maximal inhibitory concentration
(IC50) of compound 6 and 9 in Gli protein expression and PDAC tumor cell proliferation.
(A, B) The expression levels of Gli1 and Gli2 protein in primary Pan KPC-SmoM2 cells after
treatment with various concentrations of compound 6 or 9. Graphs indicate quantification of
immunoblot data that show the mean fold change of protein normalized to -Tub levels. (C, D) IC 50
value determined by BrdU incorporation assay after treatment with various concentrations of
compound 6 or 9 on primary KPC-SmoM2 cells.
All error bars represent the mean SD of three independent experiments. A two tailed unpaired t-test is
used for statistical data analysis. (* = p < 0.01, # = p < 0.001)
Supplemental Movie 1. CLSM images of tissue specimen from a Pdx1-Cre; LSL-KrasG12D/+; LSL-
Trp53R172H/+; LSL-Rosa26SmoM2−YFP/+ mouse strain. YFP-tagged SmoM2 is visualized with GFP
antibody.
Supplemental Movie 2. CLSM images of tissue specimen from a Pdx1-Cre; LSL-KrasG12D/+; LSL-
Trp53R172H/+ mouse strain. Immunostaining with GFP antibody demonstrates specificity of the GFP
signals.

Supplemental References
1. Boussif, O. et al. A versatile vector for gene and oligonucleotide transfer into cells in culture and in vivo: Polyethylenimine. Proc Natl Acad Sci U S A 92, 7297-7301 (1995).
A
Relative distance
Fluo
resc
ence
inte
nsity
Venus-Arl13bRFP-SmoM2
Fluo
resc
ence
inte
nsity
Cilia
ry S
mo
(%) 80
40
60
20
100
0
SmoM2SmoWT
#Merge, DAPI RFP-SmoWT Venus-Arl13b
Merge, DAPI RFP-SmoM2 Venus-Arl13b
BC
-Shh
SmoW
T, -S
hhSm
oM2,
-Shh
Gli1
Gli2
RFP
α-Tub
SmoM2SmoWT
- + - + Shh
Gli1Gli2
Rela
tive
prot
ein
expr
esio
n
10
5
0
*** **
**# #
DMerge RFP Venus
Generation of PLCfrom E10.5 WTmouse embroys
Immortalizationof PLCs
Transfection withthe plasmid expressingRFP-SmoM2; Venus-Arl13b
Puromycin selection &Establishment of the cell line
Ligand-independentactivation of Hh pathway
Ciliary SmoM2
RFP-SmoM2
Venus-Arl13b
Target geneactivation
Cytoplasm
Nucleus
Figure S1.
Venus-Arl13b RFP-SmoM2 Venus-Arl13b RFP-SmoM2
DAPI Merge DAPI Merge
#6, L
orgl
umid
e so
dium
sal
t, 8 µM
for 2
4 h
0.8%
DM
SO fo
r 24
h
A
Compounds (8 µM) for 24 h
1.2
1
0.8
0.6
0.4
0.2
0
Benzydamine
hydroch
loride
1 2 3 4 5 6 7 8 9 10DMSORe
lativ
e �u
ores
cenc
e in
tens
ity
of c
iliar
y Sm
oM2
C B
Cell seedingin 386-well format
(4x10 / well)
Induced ciliogenesiswith ligand-independent activation of Hh pathway
(by serum deprivation for 18 h)
Screening with 960 small molecules
(8 µM for 24 h)& Hit validation
36 small molecules
4
Ligand-independentactivation of Hh pathway
Ciliary SmoM2
RFP-SmoM2
Venus-Arl13b
Target geneactivation
Cytoplasm
Nucleus
NO gene activation
Nucleus
NO Ciliary SmoM2
NO Hh pathway activation
Venus-Arl13b
RFP-SmoM2
Figure S2.

Merge, DAPI RFP-SmoM2 Venus-Arl13b
Merge RFP Venus
Merge, DAPI RFP-SmoM2 Venus-Arl13b
GD
C-04
49, 1
µM
Merge RFP Venus Cy
c, 1
0 µM
#1, 1
0 µM
#2, 1
0 µM
#3, 1
0 µM
#4, 1
0 µM
#5, 2
0 µM
#7, 2
0 µM
#8, 2
0 µM
#9, 2
0 µM
#10,
20 µM
Figure S3.
Merge, DAPI Smo Ace-Tub
Cyc
, 10
µM
#1
, 10
µM
Merge Smo Ace-Tub Merge Smo Ace-Tub Merge, DAPI Smo Ace-Tub
#2, 1
0 µ
M
#3, 1
0 µ
M
#4, 1
0 µ
M
#5, 2
0 µ
M
#7, 2
0 µ
M
#8, 2
0 µ
M
#9, 2
0 µ
M
#10
, 20
µM
NIH3T3 cells Ptch1 MEFs
Cyc
, 10
µM
#1
, 10
µM
#2
, 10
µM
#3
, 10
µM
#4
, 10
µM
#5
, 20
µM
#7
, 20
µM
#8
, 20
µM
#9
, 20
µM
#1
0, 2
0 µ
M
-/-A B
Figure S4.

1 µM 10 µM 20 µM
1 µM 10 µM 20 µM
120
100
80
60
40
20
0
120
100
80
60
40
20
0
D 1 2 3 4 5 6 7 8 9 10 for 24hCell
viab
ility
in N
IH3T
3 ce
lls (%
)Ce
ll vi
abili
ty in
NIH
3T3
cells
(%)
D 1 2 3 4 5 6 7 8 9 10 for 48h
A
B
Figure S5.

1.5
1.0
0.5
0.0
log [Compound#1], µM10
log [Compound#1], µM10
log [Compound#6], µM10
log [Compound#2], µM10 log [Compound#3], µM10 log [Compound#4], µM10 log [Compound#5], µM10
log [Compound#2], µM10
log [Compound#7], µM10
log [Compound#8], µM10 log [Compound#9], µM10 log [Compound#10], µM10
log [Compound#3], µM10 log [Compound#4], µM10 log [Compound#5], µM10
log [Compound#8], µM10 log [Compound#9], µM10 log [Compound#10], µM10
log [Compound#6], µM10 log [Compound#7], µM10
Rela
tive
GFP
exp
ress
ion
in G
BS-G
FP M
EFs
Rela
tive
GFP
exp
ress
ion
in G
BS-G
FP M
EFs
Rela
tive
Ptch
1 ex
pres
sion
in G
BS-G
FP M
EFs
Rela
tive
Ptch
1 ex
pres
sion
in G
BS-G
FP M
EFs
-1.5 -1.0 -0.5 -0.0 0.5 1.0 1.5
1.5
1.0
0.5
0.0-1.5 -1.0 -0.5 -0.0 0.5 1.0 1.5 -1.5 -1.0 -0.5 -0.0 0.5 1.0 1.5 -1.5 -1.0 -0.5 -0.0 0.5 1.0 1.5 -1.5 -1.0 -0.5 -0.0 0.5 1.0 1.5
-1.5 -1.0 -0.5 -0.0 0.5 1.0 1.5 -1.5 -1.0 -0.5 -0.0 0.5 1.0 1.5 -1.5 -1.0 -0.5 -0.0 0.5 1.0 1.5 -1.5 -1.0 -0.5 -0.0 0.5 1.0 1.5 -1.5 -1.0 -0.5 -0.0 0.5 1.0 1.5
-1.5 -1.0 -0.5 -0.0 0.5 1.0 1.5 -1.5 -1.0 -0.5 -0.0 0.5 1.0 1.5 -1.5 -1.0 -0.5 -0.0 0.5 1.0 1.5 -1.5 -1.0 -0.5 -0.0 0.5 1.0 1.5 -1.5 -1.0 -0.5 -0.0 0.5 1.0 1.5
-1.5 -1.0 -0.5 -0.0 0.5 1.0 1.5 -1.5 -1.0 -0.5 -0.0 0.5 1.0 1.5 -1.5 -1.0 -0.5 -0.0 0.5 1.0 1.5 -1.5 -1.0 -0.5 -0.0 0.5 1.0 1.5 -1.5 -1.0 -0.5 -0.0 0.5 1.0 1.5
1.5
1.0
0.5
0.0
1.5
1.0
0.5
0.0
1.5
1.0
0.5
0.0
1.5
1.0
0.5
0.0
1.5
1.0
0.5
0.0
1.5
1.0
0.5
0.0
1.5
1.0
0.5
0.0
1.5
1.0
0.5
0.0
1.5
1.0
0.5
0.0
1.5
1.0
0.5
0.0
1.5
1.0
0.5
0.0
1.5
1.0
0.5
0.0
1.5
1.0
0.5
0.0
1.0
0.8
0.6
0.4
0.2
0.0
1.0
0.8
0.6
0.4
0.2
0.0
1.0
0.8
0.6
0.4
0.2
0.0
1.0
0.8
0.6
0.4
0.2
0.0
1.0
0.8
0.6
0.4
0.2
0.0
1.0
0.8
0.6
0.4
0.2
0.0
IC50 = 0.6693 IC50 = 0.5939 IC50 = 9.308e-008 IC50 = 4.842e-012 IC50 = 0.2013
IC50 = 2.976e+022 IC50 = 0.0002135 IC50 = 1.263e-008 IC50 = 6.043 IC50 = 7.559e+014
IC50 = 5.230e-007 IC50 = 0.5939 IC50 = 1.795e+013 IC50 = 5.572e-006 IC50 = 0.002660
IC50 = 1.128 IC50 = 1.759e+008 IC50 = 5.539e+007 IC50 = 0.7394 IC50 = 0.7421
A
B
Figure S6.
D Cyc 1 2 3 4 5 6 7 8 9 10
1.61.4
1.2
10.80.60.40.2
0
Rela
tive
Gli1
mRN
A e
xpre
ssio
n in
Suf
u
M
EFs
-/-
Figure S7.
+ - + + + + + + + + + +co-expression:+ - + + + + + + + + + +
- - + - - - - - - - - - -+ - - + + + + + + + + + +
+ - + + + + + + + + + + +
Strep-His-mSmoWT-MycHA-hGprasp2
IP: StrepIB: HA
IB: StrepIB: HA
kDa
130
130
kDa
Strep-His-mSmoM2-MycStrep-His-mSmo-CLD-MycHA-hGprasp2
co-expression:
IPIn
put
IPIn
put
A
B
D D 1 2 3 4 5 6 7 8 9 10
D D D 1 2 3 4 5 6 7 8 9 10 93
93
93
93
IP: StrepIB: HA
IB: StrepIB: HA
Figure S8.
M
D
M
D M
D
M
D
M D
M
DMD
M
D
M
D
M
D
M
D MD
M
D
MD
M
D
Pericentrin, Ace-Tub Pericentrin, Ace-Tub Pericentrin, Ace-Tub Pericentrin, Ace-Tub Smo, α-Tub Smo, α-Tub Smo, α-Tub
Pericentrin
Ace-tub
0.1%
of D
MSO
0.1%
of D
MSO
Cyc,
10 µM
#10,
20 µM
#8, 2
0 µM
#7, 2
0 µM
#3, 1
0 µM
#9, 2
0 µM
#2, 1
0 µM
#5, 2
0 µM
#1, 1
0 µM
#6, 2
0 µM
#4, 1
0 µM
Cyc,
10 µM
#10,
20 µM
#8, 2
0 µM
#7, 2
0 µM
#3, 1
0 µM
#9, 2
0 µM
#2, 1
0 µM
#5, 2
0 µM
#1, 1
0 µM
#6, 2
0 µM
#4, 1
0 µM
A
abnormal cilian.s.
Cilia
ted
cells
(%)
D Cyc 1 2 3 4 5 6 7 8 9 10
100
80
60
40
20
0
n.s.
#
Cent
riole
dise
ngag
emen
t (%
)
D Cyc 1 2 3 4 5 6 7 8 9 10
100
80
60
40
20
0
D Cyc 1 2 3 4 5 6 7 8 9 10
n.s.6
4
2Cilia
leng
th (µ
m)
B
C
D
EFigure S9.
Merge GFP Gprasp2 Ace-Tub
Cyc,
10 µM
#1, 1
0 µM
#2, 1
0 µM
#3, 1
0 µM
#4, 1
0 µM
Merge, DAPI
#5, 2
0 µM
#7, 2
0 µM
#8, 2
0 µM
#9, 2
0 µM
#10,
20 µM
Merge GFP Gprasp2 Ace-Tub
Merge, DAPI
Figure S10.
A
D
C
1.4
1.2
1.0
0.8
0.6
0.4
0.2
0
BrdU
Inco
rpor
atio
nA
bsor
banc
e 45
0nm
D Cyc 1 2 3 4 5 6 7 8 9 10
Gli1
Gli2
CyclinD1
α-Tub
D Cyc 1 2 3 4 5 D Cyc 6 7 8 9 10
37
kDa
**
55
130
250
100
70
55
130
250
100
70 55
**
**
Merge, DAPI Smo
Ace-Tub GFP
Smo Merge Ace-TubRelative distanceFl
uore
scen
cein
tens
ity
Smo Ace-Tub
B
Pdx1-Cre; LSL-Kras ;G12D/+ LSL-Trp53 R172H/+
(KPC)
Figure S11.
1.0
0.5
0
BrdU
Inco
rpor
atio
nA
bsor
banc
e 45
0nm
1.0
0.5
0
BrdU
Inco
rpor
atio
nA
bsor
banc
e 45
0nm
-4.5 -4.0 -3.5 -3.0 -2.5 -2.0 -1.5
log(C), M log(C), M
IC50 = 870 nMIC50 = 631 nM
A
Gli1
Gli2
α-Tub
0 0.05 0.1 0.3 0.5 1 10 20 µM 0 0.05 0.1 0.3 0.5 1 10 20 µM
1.2
1.0
0.8
0.6
0.4
0.2
0Rela
tive
prot
ein
expr
essi
onin
KPC
-Sm
oM2
cells
Gli1Gli2
Gli1
Gli2
α-Tub
1.4
1.2
1
0.8
0.6
0.4
0.2
0
Gli1Gli2
#6, Palonosetron hydrochloride #9, Palonosetron hydrochloride
B
C D
#*
#*
Rela
tive
prot
ein
expr
essi
onin
KPC
-Sm
oM2
cells
-4.5 -4.0 -3.5 -3.0 -2.5 -2.0 -1.5
#*
**
**
#
*
**
*#
**
# ##
#
#
#6, Palonosetron hydrochloride #9, Palonosetron hydrochloride
Figure S12.