Embed Size (px)
Citation preview

The genetics of East African populations: a Nilo-Saharan component in
the African genetic landscape
Begoña Dobon1#, Hisham Y. Hassan2,3#, Hafid Laayouni1,4#, Pierre Luisi1, Isis Ricaño-Ponce
5, Alexandra Zhernakova5, Cisca Wijmenga5, Hanan Tahir6, David Comas1, Mihai G.
Netea7,8* and Jaume Bertranpetit1*
1Institut de Biologia Evolutiva (UPF-CSIC), Departament de Ciències Experimentals i de la Salut, Universitat
Pompeu Fabra, Barcelona, Catalonia, Spain. 2College of Medical Laboratory Sciences, University of Science
and Technology, Omdurman, Sudan; and 3Banoon ART and Cytogenetics Centre, Bahrain defense Force
Hospital, Manama, Kingdom of Bahrain. 4Departament de Genètica i de Microbiologia, Grup de Biologia
Evolutiva (GBE), Universitat Autonòma de Barcelona, Bellaterra (Barcelona), Spain. 5University of
Groningen, University Medical Center Groningen, Department of Genetics, Groningen, The Netherlands.
6Sudan Medical and Scientific Research Institute, University of Medical Sciences and Technology, Khartoum,
Sudan. 7Department of Internal Medicine and 8Radboud Center for Infectious Diseases, Radboud University
Nijmegen Medical Centre, Nijmegen, The Netherlands.
# Equal contribution
*Corresponding authors: Mihai G. Netea ([email protected]) and Jaume Bertranpetit
SUPPLEMENTARY INFORMATION
Includes Supplementary Figures S1-S12, Supplementary Tables S1-S8 and
Supplementary Methods.

SUPPLEMENTARY FIGURES
a)
b)
Supplementary Fig. S 1. Principal component analysis of the new populations genotyped from the Sudanese region. Plot shows PC1 and PC2 and thevariation explained by them using a) 143,602 markers and b) 14,343 markers (SNPs in common with the external populations in the 14K data set). PC1separates the populations in a north-south gradient (Copts are originally from Egypt), whereas PC2 separates the nomadic Fulani from settled populations.The same structure between populations is recovered as in Fig. 2, even though the intra–population variation is higher.

Supplementary Fig. S 2. Principal component analysis of six world–wide populations from 1000 Genomes Project using different number of SNPs. Plotsshow PC1 and PC2 using: a) 3M SNPs available from 1000 Genomes Project, b) 143,602 SNPs present in the Immunochip (140K data set), and c) 14,343SNPs common between our newly genotyped populations and the reference populations we added to provide a continental context: Egyptian, Qatari, MKK,LWK and YRI samples (14K data set). Intra–population variability increases with lower number of SNPs, but the same population structure is recoveredregardless of the number of SNPs. CEU = Utah residents with Northern and Western European ancestry; GBR = British in England and Scotland; CHB = HanChinese in Bejing, China; JPT = Japanese in Tokyo, Japan (JPT); LWK = Luhya from Webuye, Kenya; and YRI = Yoruba from Ibadan, Nigeria.

a)
b)

c)
d)
Supplementary Fig. S 3. Principal component analysis of the new populations genotyped from the Sudanese region. Plot shows PC1 and PC2 using a) 9,221genic SNPs and b) 133,724 intergenic SNPs (intergenic and intronics SNPs) genotyped in the Immunochip. c,d) We also performed PCA on ten randomsubsets of 10,000 intergenic SNPs to test whether the same population structure could be recovered with a equivalent sample size as the genic SNPs (showntwo example plots). We observe a similar population structure as in Fig. 2, regardless of the subset of SNPs used.

Supplementary Fig. S 4. Principal component analysis of the populations from the Sudanese region in the context of the African continent with 14 samplesidentified as outliers with respect to their populations of origin (�). The excluded individuals are: 1 Copt (211-5151), 1 Nubian (211-5042), 2 Nuba (211-4903,211-4926), 4 Arabs (211-4969, 211-5187, 211-5212, 210-22416), and 6 Fulani (211-5208, 211-5281, 211-5215, 211-5238, 211-5198, 211-5230). MKK =Maasai from Kinyawa, Kenya; LWK = Luhya from Webuye, Kenya; YRI = Yoruba from Ibadan, Nigeria. Modified from main Figure 2a.

Supplementary Fig. S 5. Pairwise FST values between the 14 populations. Values of pairwise FST were colour coded to show the grades of geneticdifferentiation between populations. Geographically close populations have low genetic distances: Arabs, Beja, Etiophians and Nubians form one cluster(North-East) and Darfurian, Nilotes and Nuba another (South-West). MKK = Maasai from Kinyawa, Kenya; LWK = Luhya from Webuye, Kenya; YRI =Yoruba from Ibadan, Nigeria.

a)
b)
Supplementary Fig. S 6. Cross-validation error estimates of the new nine genotyped populations for the ADMIXTURE analysis. Plots show standard errorof the cross–validation error estimates for each of the 10 clusters tested (from k = 1 through k = 10) when a) all 447 individuals were analysed and b) a randomsubset of 25 individuals was chosen from each of the 9 populations to avoid sample size bias (225 individuals). When population sample size is taken intoaccount the optimal number of ancestral clusters is two.

Supplementary Fig. S 7. ADMIXTURE results for k = 2 through k = 10 for the Sudanese populations. A random subset of 25 samples was extracted fromeach population to avoid sample size bias. Columns represent individuals, where the size of each colour segment represents the proportion of ancestry fromeach cluster. For the cross–validation error estimation, k = 1 was calculated but is not shown here. The statistically supported model is k = 2 (SupplementaryFig. 6b). A North–African ancestral component (dark blue) driven by the Coptic population is found in north-eastern populations (Arabs, Beja, Ethiopiansand Nubian) along with a Nilo–Saharan ancestral component (light blue) characterised by south–western populations (Nuba, Nilotes and Darfurian). NomadicFulani are predominantly Nilo–Saharan, but at k = 3 show their own component (light green). Fulani individuals present different levels of admixture with aNilo–Saharan component.

a)
b)
Supplementary Fig. S 8. Cross-validation error estimates of the 14 populations for the ADMIXTURE analysis. Plots show standard error of the cross–validation error estimates for each of the 10 clusters tested (from k = 1 through k = 10) when a) all 921 individuals were analysed and b) a random subset of18 individuals was chosen from each of the 14 populations to avoid sample size bias (252 individuals). When population sample size is taken into account theoptimal number of ancestral clusters decreases by half (from six to three).
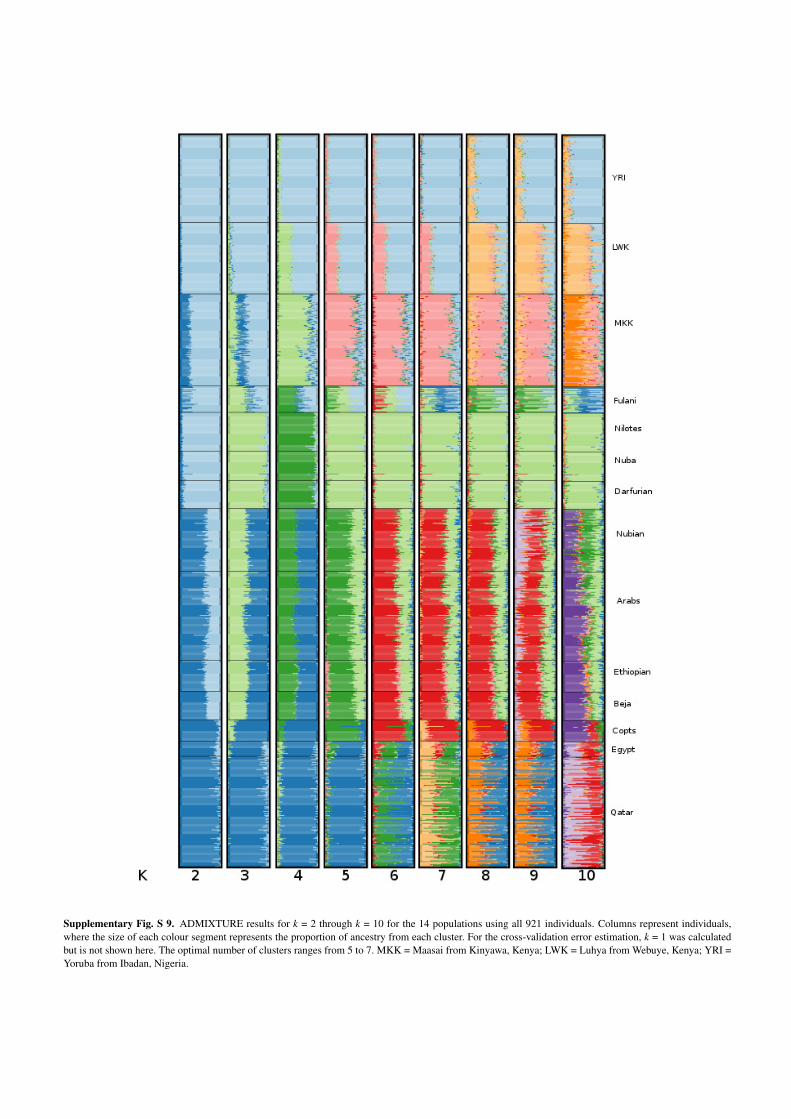
Supplementary Fig. S 9. ADMIXTURE results for k = 2 through k = 10 for the 14 populations using all 921 individuals. Columns represent individuals,where the size of each colour segment represents the proportion of ancestry from each cluster. For the cross-validation error estimation, k = 1 was calculatedbut is not shown here. The optimal number of clusters ranges from 5 to 7. MKK = Maasai from Kinyawa, Kenya; LWK = Luhya from Webuye, Kenya; YRI =Yoruba from Ibadan, Nigeria.
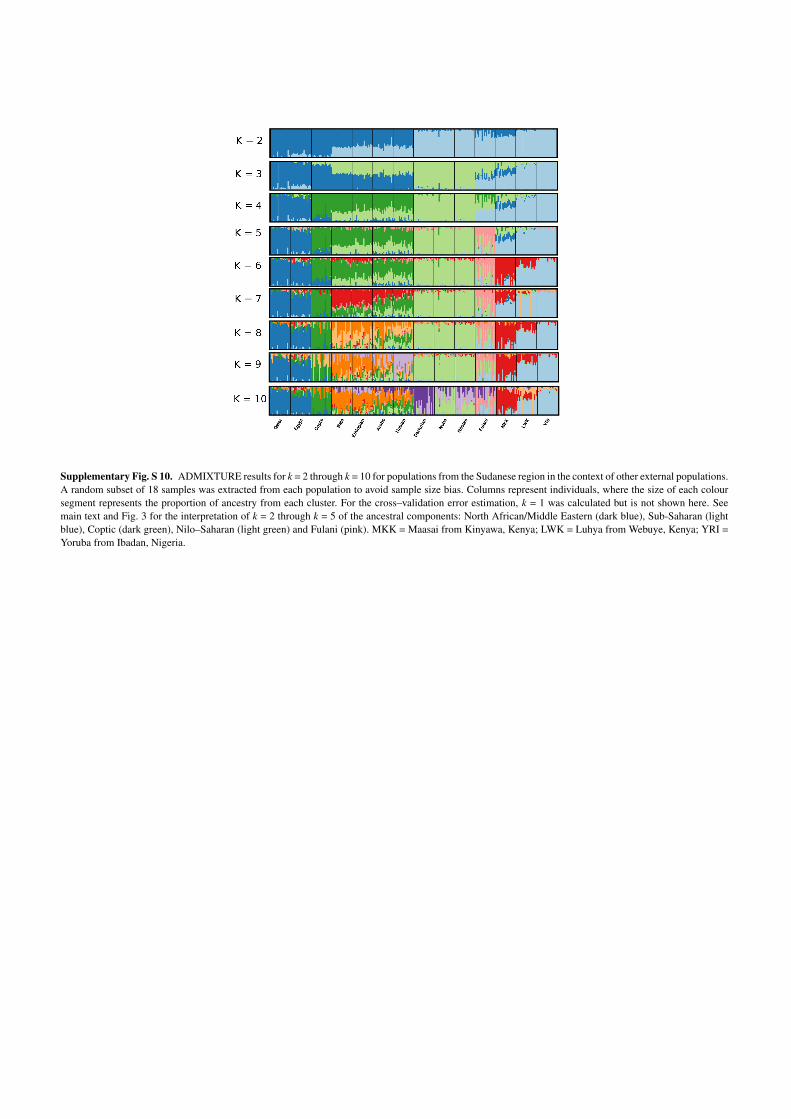
Supplementary Fig. S 10. ADMIXTURE results for k = 2 through k = 10 for populations from the Sudanese region in the context of other external populations.A random subset of 18 samples was extracted from each population to avoid sample size bias. Columns represent individuals, where the size of each coloursegment represents the proportion of ancestry from each cluster. For the cross–validation error estimation, k = 1 was calculated but is not shown here. Seemain text and Fig. 3 for the interpretation of k = 2 through k = 5 of the ancestral components: North African/Middle Eastern (dark blue), Sub-Saharan (lightblue), Coptic (dark green), Nilo–Saharan (light green) and Fulani (pink). MKK = Maasai from Kinyawa, Kenya; LWK = Luhya from Webuye, Kenya; YRI =Yoruba from Ibadan, Nigeria.

a)
b)
Supplementary Fig. S 11. Principal component analysis of the populations from the Sudanese region in the context of the African continent with an Europeanpopulation added. Plot shows a) PC1 and PC2 and b) PC2 and PC3 and the variation explained by them using 13,713 markers. PC1 separates European, MiddleEast and North-African populations from Sub-Saharan populations. MKK = Maasai from Kinyawa, Kenya; LWK = Luhya from Webuye, Kenya; YRI = Yorubafrom Ibadan, Nigeria; CEU = Utah Residents with Northern and Western European ancestry.

a)
b)
Supplementary Fig. S 12. ADMIXTURE results for k = 2 through k = 10 for populations from the Sudanese region in the context of other external populations.a) A random subset of 18 samples was extracted from each population to avoid sample size bias. Columns represent individuals, where the size of each coloursegment represents the proportion of ancestry from each cluster. b) For the cross–validation error estimation, k = 1 was calculated but is not shown here. A= Utah Residents with Northern and Western European ancestry; B = Qatar; C = Egypt; D = Copts; E = Beja, F = Ethiopians; G = Arabs; H = Nubians; I =Darfurians; J = Nuba; K = Nilotes; L = Fulani; M= Maasai from Kinyawa, Kenya (MKK) ; N = Luhya from Webuye, Kenya (LWK); O = Yoruba from Ibadan,Nigeria (YRI).

Supplementary Fig. S 13. Sampling distribution of the sample mean Global FST between Sudanese populations. The average FST value of genes associatedwith resistance/susceptibility to a) malaria, b) bacteria, and c) fungi (�) is significantly lower than the mean FST value of the sampling distribution. Thesampling distribution is drawn from the mean FST value of subsets of randomly selected genic SNPs with a sample size equal to the number of common SNPsbetween populations in the selected genes (n) and with similar MAF (10,000 permutations).
SUPPLEMENTARY TABLES
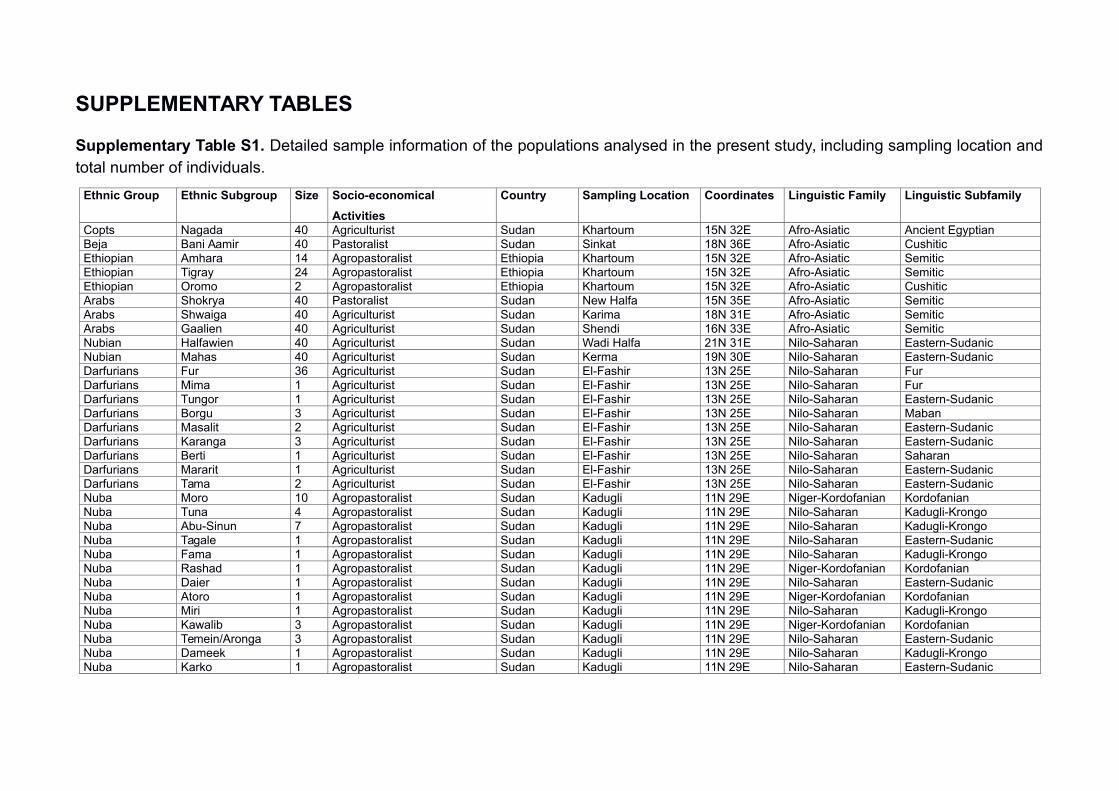
Supplementary Table S1. Detailed sample information of the populations analysed in the present study, including sampling location andtotal number of individuals.
Ethnic Group Ethnic Subgroup Size Socio-economical
Activities
Country Sampling Location Coordinates Linguistic Family Linguistic Subfamily
Copts Nagada 40 Agriculturist Sudan Khartoum 15N 32E Afro-Asiatic Ancient Egyptian Beja Bani Aamir 40 Pastoralist Sudan Sinkat 18N 36E Afro-Asiatic Cushitic Ethiopian Amhara 14 Agropastoralist Ethiopia Khartoum 15N 32E Afro-Asiatic Semitic Ethiopian Tigray 24 Agropastoralist Ethiopia Khartoum 15N 32E Afro-Asiatic Semitic Ethiopian Oromo 2 Agropastoralist Ethiopia Khartoum 15N 32E Afro-Asiatic Cushitic Arabs Shokrya 40 Pastoralist Sudan New Halfa 15N 35E Afro-Asiatic Semitic Arabs Shwaiga 40 Agriculturist Sudan Karima 18N 31E Afro-Asiatic Semitic Arabs Gaalien 40 Agriculturist Sudan Shendi 16N 33E Afro-Asiatic Semitic Nubian Halfawien 40 Agriculturist Sudan Wadi Halfa 21N 31E Nilo-Saharan Eastern-SudanicNubian Mahas 40 Agriculturist Sudan Kerma 19N 30E Nilo-Saharan Eastern-SudanicDarfurians Fur 36 Agriculturist Sudan El-Fashir 13N 25E Nilo-Saharan Fur Darfurians Mima 1 Agriculturist Sudan El-Fashir 13N 25E Nilo-Saharan Fur Darfurians Tungor 1 Agriculturist Sudan El-Fashir 13N 25E Nilo-Saharan Eastern-SudanicDarfurians Borgu 3 Agriculturist Sudan El-Fashir 13N 25E Nilo-Saharan Maban Darfurians Masalit 2 Agriculturist Sudan El-Fashir 13N 25E Nilo-Saharan Eastern-SudanicDarfurians Karanga 3 Agriculturist Sudan El-Fashir 13N 25E Nilo-Saharan Eastern-SudanicDarfurians Berti 1 Agriculturist Sudan El-Fashir 13N 25E Nilo-Saharan Saharan Darfurians Mararit 1 Agriculturist Sudan El-Fashir 13N 25E Nilo-Saharan Eastern-SudanicDarfurians Tama 2 Agriculturist Sudan El-Fashir 13N 25E Nilo-Saharan Eastern-SudanicNuba Moro 10 Agropastoralist Sudan Kadugli 11N 29E Niger-Kordofanian Kordofanian Nuba Tuna 4 Agropastoralist Sudan Kadugli 11N 29E Nilo-Saharan Kadugli-Krongo Nuba Abu-Sinun 7 Agropastoralist Sudan Kadugli 11N 29E Nilo-Saharan Kadugli-Krongo Nuba Tagale 1 Agropastoralist Sudan Kadugli 11N 29E Nilo-Saharan Eastern-SudanicNuba Fama 1 Agropastoralist Sudan Kadugli 11N 29E Nilo-Saharan Kadugli-Krongo Nuba Rashad 1 Agropastoralist Sudan Kadugli 11N 29E Niger-Kordofanian Kordofanian Nuba Daier 1 Agropastoralist Sudan Kadugli 11N 29E Nilo-Saharan Eastern-SudanicNuba Atoro 1 Agropastoralist Sudan Kadugli 11N 29E Niger-Kordofanian Kordofanian Nuba Miri 1 Agropastoralist Sudan Kadugli 11N 29E Nilo-Saharan Kadugli-Krongo Nuba Kawalib 3 Agropastoralist Sudan Kadugli 11N 29E Niger-Kordofanian Kordofanian Nuba Temein/Aronga 3 Agropastoralist Sudan Kadugli 11N 29E Nilo-Saharan Eastern-SudanicNuba Dameek 1 Agropastoralist Sudan Kadugli 11N 29E Nilo-Saharan Kadugli-Krongo Nuba Karko 1 Agropastoralist Sudan Kadugli 11N 29E Nilo-Saharan Eastern-Sudanic

Ethnic Group Ethnic Subgroup Size Socio-economical
Activities
Country Sampling Location Coordinates Linguistic Family Linguistic Subfamily
Nuba Julud 1 Agropastoralist Sudan Kadugli 11N 29E Niger-Kordofanian Kordofanian Nuba Shawabna 1 Agropastoralist Sudan Kadugli 11N 29E Niger-Kordofanian Kordofanian Nuba Tulishi 1 Agropastoralist Sudan Kadugli 11N 29E Nilo-Saharan Kadugli-Krongo Nuba Haiban 1 Agropastoralist Sudan Kadugli 11N 29E Niger-Kordofanian Kordofanian Nuba Tira Dagig 1 Agropastoralist Sudan Kadugli 11N 29E Niger-Kordofanian Kordofanian Nilotes Dinka 17 Pastoralist South Sudan Juba 4N 31E Nilo-Saharan Eastern-SudanicNilotes Baria 3 Pastoralist South Sudan Juba 4N 31E Nilo-Saharan Eastern-SudanicNilotes Balanda 1 Pastoralist South Sudan Juba 4N 31E Nilo-Saharan Eastern-SudanicNilotes Moru 1 Pastoralist South Sudan Juba 4N 31E Nilo-Saharan Central-Sudanic Nilotes Nuer 18 Pastoralist South Sudan Juba 4N 31E Nilo-Saharan Eastern-SudanicNilotes Kakwa 1 Pastoralist South Sudan Juba 4N 31E Nilo-Saharan Eastern-SudanicNilotes Shilluk 5 Pastoralist South Sudan Juba 4N 31E Nilo-Saharan Eastern-SudanicNilotes Anyuak 1 Pastoralist South Sudan Juba 4N 31E Nilo-Saharan Eastern-SudanicNilotes Tennet 1 Pastoralist South Sudan Juba 4N 31E Nilo-Saharan Eastern-SudanicNilotes Mundari 1 Pastoralist South Sudan Juba 4N 31E Nilo-Saharan Eastern-SudanicFulani – 40 Nomadic Pastoralist Sahel – – Niger-Kordofanian Atlantic
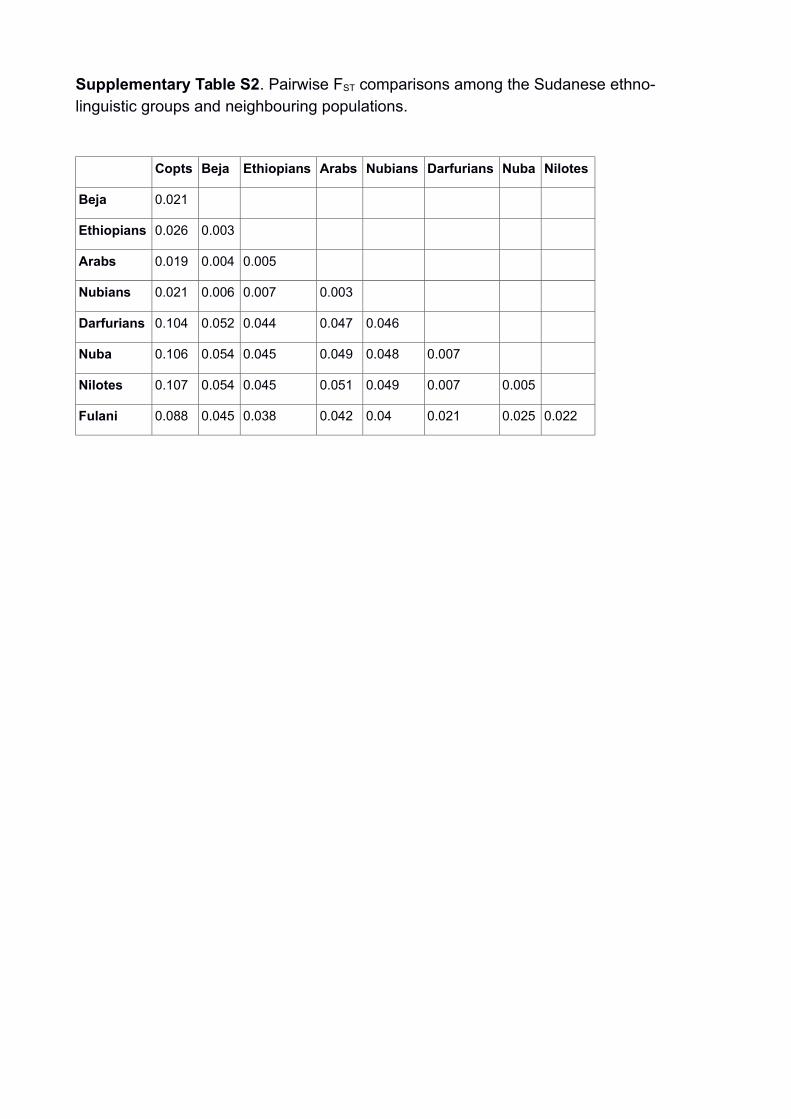
Supplementary Table S2. Pairwise FST comparisons among the Sudanese ethno-linguistic groups and neighbouring populations.
Copts Beja Ethiopians Arabs Nubians Darfurians Nuba Nilotes
Beja 0.021
Ethiopians 0.026 0.003
Arabs 0.019 0.004 0.005
Nubians 0.021 0.006 0.007 0.003
Darfurians 0.104 0.052 0.044 0.047 0.046
Nuba 0.106 0.054 0.045 0.049 0.048 0.007
Nilotes 0.107 0.054 0.045 0.051 0.049 0.007 0.005
Fulani 0.088 0.045 0.038 0.042 0.04 0.021 0.025 0.022

Supplementary Table S3. Three–population test with Yoruba as outgroup to estimatemixing proportions. Here we show all combinations of source populations that give anegative f3 statistic (p–value < 3.2×10⁻⁵) and the estimate mixing proportions are withinbounds (αL is the lower bond and αU is the upper bound of α, where α is the admixtureproportion by which was formed the target population from the ancestral population ofsource population 1). The pairs with the most negative results are summarized in Table 2in the main text.
Target Source1 Source2 f3 Z-score αL αU
Beja Fulani Qatar -0.010807 -12.874 0.102 0.404
Beja Darfurians Copts -0.017997 -22.767 0.358 0.359
Beja Nuba Copts -0.017329 -22.084 0.249 0.37
Beja Nilotes Copts -0.01793 -21.981 0.314 0.361
Ethiopians Fulani Qatar -0.013213 -16.313 0.196 0.477
Ethiopians Darfurians Copts -0.021364 -28.487 0.339 0.431
Ethiopians Nuba Copts -0.021254 -28.893 0.359 0.445
Ethiopians Nilotes Copts -0.021274 -28.085 0.343 0.434
Ethiopians Darfurians Beja -0.003714 -5.716 0.102 0.15
Ethiopians Nuba Beja -0.004269 -6.537 0.11 0.158
Ethiopians Nilotes Beja -0.003691 -5.576 0.104 0.152
Arabs Fulani Qatar -0.014746 -19.195 0.211 0.446
Arabs Nuba Copts -0.022826 -31.657 0.363 0.417
Arabs Nilotes Copts -0.022784 -30.629 0.348 0.407
Arabs Darfurians Beja -0.002611 -4.252 0.128 0.16
Arabs Nuba Beja -0.002693 -4.254 0.112 0.169
Nubians Fulani Qatar -0.013878 -17.824 0.169 0.431
Nubians Luhya Qatar -0.007696 -5.193 0.345 0.356
Nubians Darfurians Copts -0.020759 -26.402 0.304 0.385
Nubians Nuba Copts -0.02071 -27.231 0.317 0.398
Nubians Nilotes Copts -0.020634 -27.197 0.304 0.388

Supplementary Table S4. Three–population test with Luya as outgroup to estimate mixing
proportions. Here we show all combinations of source populations that give a negative f3
statistic (p–value < 3.2×10⁻⁵) and the estimate mixing proportions are within bounds (αL is
the lower bond and αU is the upper bound of α, where α is the admixture proportion by
which was formed the target population from the ancestral population of source population
1).
Target Source1 Source2 f3 Z-score αL αU
Beja Copts Darfurians -0.018 -22.77 0.639 0.658Beja Copts Maasai -0.0093 -12.78 0.633 0.657Beja Copts Nuba -0.0173 -22.08 0.632 0.699Beja Copts Yoruba -0.0153 -17.09 0.725 0.852Ethiopians Beja Darfurians -0.0037 -5.72 0.848 0.899Ethiopians Beja Fulani -0.0027 -4.39 0.841 0.897Ethiopians Beja Nilotes -0.0037 -5.58 0.853 0.903Ethiopians Beja Nuba -0.0043 -6.54 0.843 0.894Ethiopians Beja Yoruba -0.0043 -5.84 0.912 0.946Ethiopians Copts Darfurians -0.0214 -28.49 0.568 0.667Ethiopians Copts Maasai -0.0118 -16.76 0.559 0.564Ethiopians Copts Nilotes -0.0213 -28.09 0.574 0.638Ethiopians Copts Nuba -0.0213 -28.89 0.559 0.655Ethiopians Copts Yoruba -0.0192 -21.63 0.67 0.796Ethiopians Qatar Yoruba -0.0098 -6.35 0.621 0.863Arabs Beja Darfurians -0.0026 -4.25 0.834 0.892Arabs Beja Nuba -0.0027 -4.25 0.829 0.885Arabs Copts Nuba -0.0228 -31.66 0.586 0.619Arabs Copts Yoruba -0.0201 -23.85 0.69 0.789Arabs Qatar Yoruba -0.0111 -7.37 0.645 0.873Nubians Copts Darfurians -0.0208 -26.4 0.61 0.699Nubians Copts Nilotes -0.0206 -27.2 0.615 0.676Nubians Copts Nuba -0.0207 -27.23 0.602 0.688Nubians Copts Yoruba -0.0185 -20.78 0.702 0.81Nubians Qatar Yoruba -0.009 -5.85 0.655 0.903Fulani Copts Yoruba -0.0111 -11.19 0.308 0.368
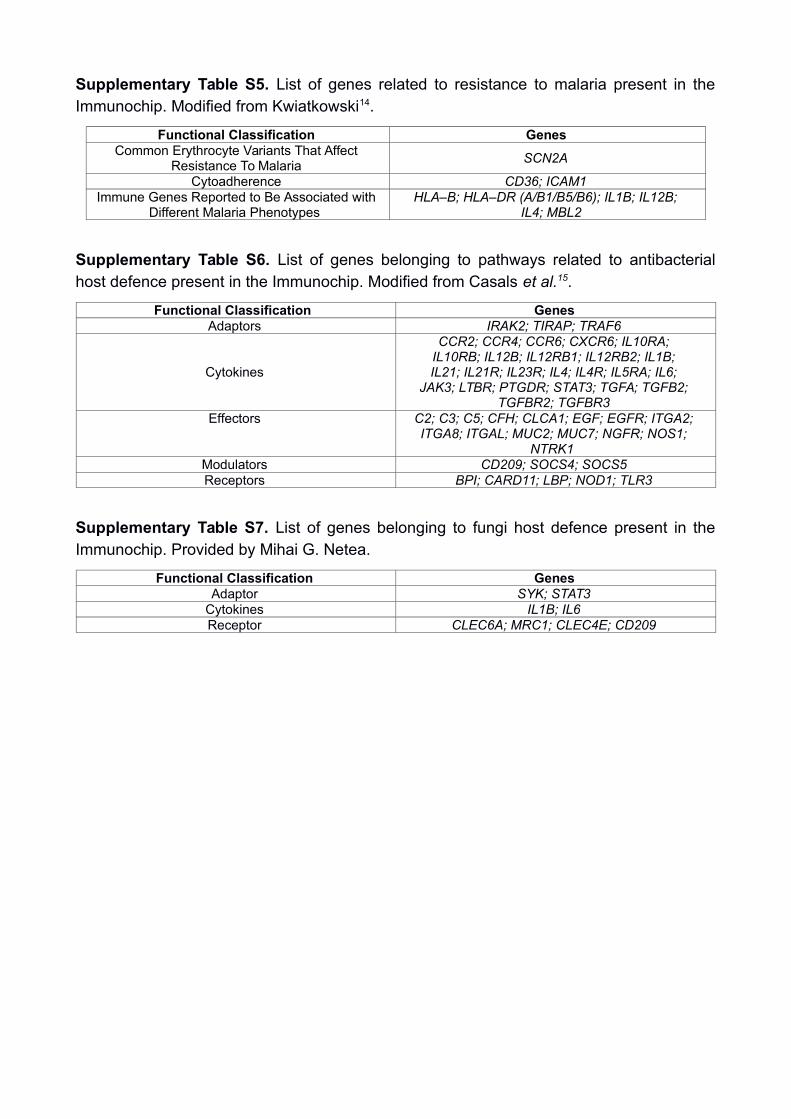
Supplementary Table S5. List of genes related to resistance to malaria present in theImmunochip. Modified from Kwiatkowski14.
Functional Classification GenesCommon Erythrocyte Variants That Affect
Resistance To MalariaSCN2A
Cytoadherence CD36; ICAM1Immune Genes Reported to Be Associated with
Different Malaria Phenotypes HLA–B; HLA–DR (A/B1/B5/B6); IL1B; IL12B;
IL4; MBL2
Supplementary Table S6. List of genes belonging to pathways related to antibacterialhost defence present in the Immunochip. Modified from Casals et al.15.
Functional Classification GenesAdaptors IRAK2; TIRAP; TRAF6
Cytokines
CCR2; CCR4; CCR6; CXCR6; IL10RA;IL10RB; IL12B; IL12RB1; IL12RB2; IL1B;IL21; IL21R; IL23R; IL4; IL4R; IL5RA; IL6;
JAK3; LTBR; PTGDR; STAT3; TGFA; TGFB2;TGFBR2; TGFBR3
Effectors C2; C3; C5; CFH; CLCA1; EGF; EGFR; ITGA2;ITGA8; ITGAL; MUC2; MUC7; NGFR; NOS1;
NTRK1 Modulators CD209; SOCS4; SOCS5Receptors BPI; CARD11; LBP; NOD1; TLR3
Supplementary Table S7. List of genes belonging to fungi host defence present in theImmunochip. Provided by Mihai G. Netea.
Functional Classification GenesAdaptor SYK; STAT3
Cytokines IL1B; IL6Receptor CLEC6A; MRC1; CLEC4E; CD209
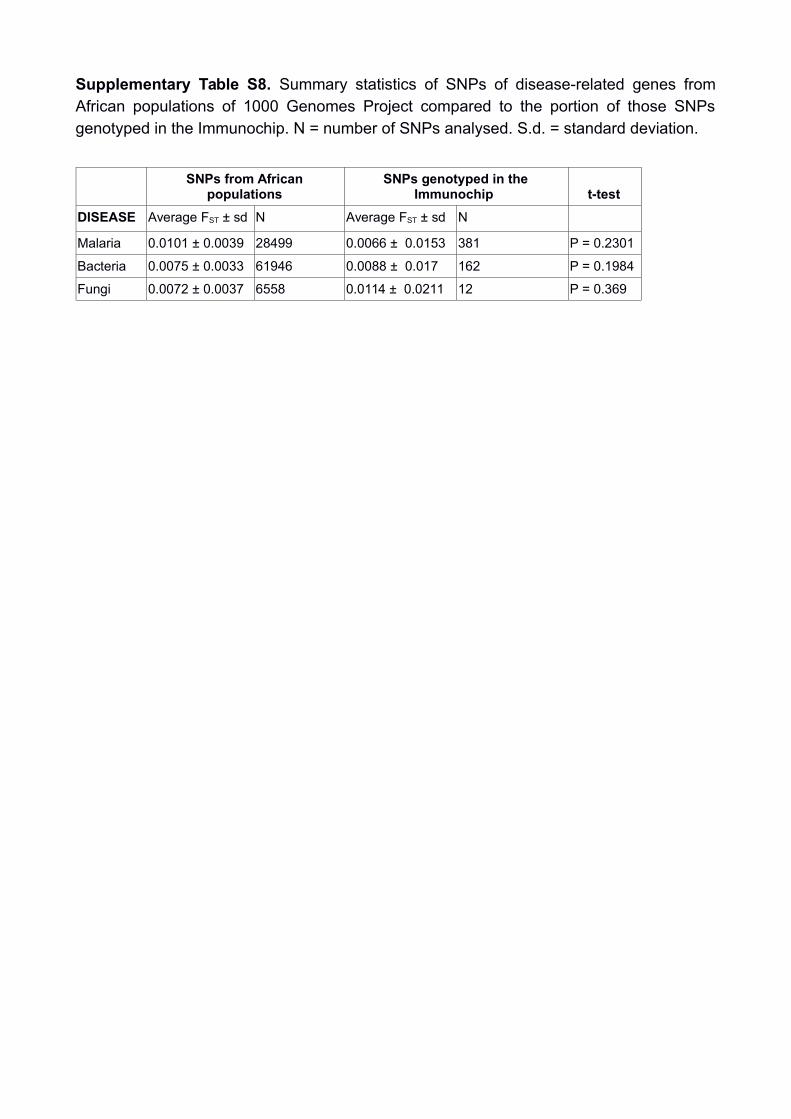
Supplementary Table S8. Summary statistics of SNPs of disease-related genes fromAfrican populations of 1000 Genomes Project compared to the portion of those SNPsgenotyped in the Immunochip. N = number of SNPs analysed. S.d. = standard deviation.
SNPs from Africanpopulations
SNPs genotyped in theImmunochip t-test
DISEASE Average FST ± sd N Average FST ± sd N
Malaria 0.0101 ± 0.0039 28499 0.0066 ± 0.0153 381 P = 0.2301
Bacteria 0.0075 ± 0.0033 61946 0.0088 ± 0.017 162 P = 0.1984
Fungi 0.0072 ± 0.0037 6558 0.0114 ± 0.0211 12 P = 0.369

SUPPLEMENTARY METHODS
Overview of the Immunochip
The Immunochip (Illumina Infinium single-nucleotide polymorphism microarray) was
originally designed for deep replication of meta-genome-wide association studies
(GWASs): 2.000 independent association signals for 11 immune-mediated diseases were
included, based on early 1000 Genomes Pilot data (February 2010 release), mainly on
European variants1. As result, 186 loci are dense covered with single-nucleotide
polymorphisms (SNPs) while other genomic regions are not represented. This restricted
the statistical methods that we could apply: methods based on linkage disequilibrium or
haplotype information were discarded due to the heterogeneous SNP density. We focused
our analysis in methods based on allele frequencies: pair-wise FST2 and F-statistics3. Also,
when working with genotyping arrays the problem of ascertainment bias should be
addressed. To assess whether our inferences on population structure and population
differentiation were robust to the peculiarities of the Immmunochip, we tested our
assumptions using data from 1000 Genomes Project4 with no ascertainment bias or from
“neutral” Immmunochip SNPs.
Genotype Data and Quality Control
Samples were collected between June-September 2010 using Oragene.DNA saliva kit
(Supplementary Table S1). Duplicated markers, and samples and markers with more than
2 % missing data rate were removed. There were 12 individuals with discordant sex

information. After manual revision and checking with the sample coordinator, sex codes
based on SNP data were imputed in the original file and a new file with the revised gender
assignments was created. Samples 211-4933 and 211-4934 had ambiguous sex codes
and were removed. A sample without enough ethnic and linguistic information was
removed (211-5344). Duplicated or/and related individuals were identified by identity by
descent (IBD) matrix. Nine samples were identified as being second or third-degree
relatives (IBD > 0.185) with respect to other individual and were removed: 4 Copts (211-
5103, 211-5159, 211-5110, 211-5134), 4 Arabs (211-4947, 211-4898, 211-4921, 210-
22425) and 1 Beja (211-5319).
Before, there were 176,562 markers and 459 samples. After these steps, 176,562 markers
and 447 samples remained. A marker without a name was excluded from further analysis.
SNPs on sexual chromosomes, with a minor allele frequency (MAF) less than 0.001 or that
deviated from Hardy-Weinberg equilibrium (p-value < 1e-005) were removed.
A total of 143,602 SNPs and 447 samples remained: 27 Copts, 36 Beja, 39 Ethiopians,
112 Arabs, 79 Nubians, 35 Darfurians, 18 Nilo-Saharan Nuba, 19 Niger-Kordofanian Nuba,
49 Nilotes, and 33 Fulani. This data set is further referred to as the “140K” data set. We
merged the SNPs genotyped on the Immunochip (140K data set), in the 116 Maasai from
Kinyawa, Kenya (MKK), 90 Luhya from Webuye, Kenya (LWK) and 110 Yoruba from
Ibadan, Nigeria (YRI) from HapMap 35. Then, after merging them in the 19 Egyptian
samples on the Affymetrix 6.0 platform6, and in the 139 Qatari on the Affymetrix 500K
platform7, a total of 14,343 SNPs remained (“14K” data set). Two SNPs (rs10921143 and
rs1627096) were removed as their alleles did not match. We updated genome positions
from NCBI build 36 (UCSC hg 18) to NCBI build 37 (UCSC hg19) using the LiftOver utility
from the University of California, Santa Cruz Genome Browser
(http://genome.ucsc.edu/cgi-bin/hgLiftOver). Filtering and quality control was done using
PLINK8 and R9.

Principal Component Analysis
Principal Component Analysis (PCA) was performed using Eigensoft (version 5.0.1) and all
principal components plotted were significant (Tracy-Widom statistic p-value < 0.001)10. As
the number of common markers between all platforms was relatively low (14,343 SNPs),
we tested whether this number was enough to detect structure in African populations. We
applied PCA on the 140K set using only the subset of common markers shared with the
other genotyping platforms (14,343 SNPs). The same pattern between populations
observed when all available SNPs are considered (Supplementary Fig. S1a, explained in
main text) is recovered using less than 15,000 SNPs (Supplementary Fig. S1b). A
minimum of 10,000 markers has been reported to be sufficient to identify population
structure in African populations in a global context11, and we show that less than 15,000
markers are enough to detect structure in a continental context.
Recovering Population Structure with the Immunochip
However, as mention before, the Immunochip does not have a representative selection of
genome-wide SNPs. To assess whether the particular SNPs present in the Immunochip
can recover population structure, we used data from the 1000 Genomes Project. We
extracted a total of 545 individuals from world-wide populations: 85 Utah residents with
Northern and Western European ancestry (CEU); 89 British in England and Scotland
(GBR); 91 Han Chinese in Bejing, China (CHB); 94 Japanese in Tokyo, Japan (JPT); 97
Luhya in Webuye, Kenya (LWK); and 88 Yoruba in Ibadan, Nigeria (YRI)4. We applied a
PCA using the different data sets of SNPs that we used for different analysis:

a) 3M SNPs available from 1000 Genomes Project data.
b) 140K data set: 143,602 SNPs genotyped in the Immunochip (after quality control)
present in 1000 Genomes data.
c) 14K data set: 14,343 SNPs genotyped in the Immunochip (when our populations
are merged with reference populations to provide continental context: Egyptian5,
Qatari6, MKK, LWK and YRI samples4) present in 1000 Genomes data.
In Supplementary Fig. S2 we can see how the genetic structure between world-wide
populations is maintained across the different data sets of SNPs used. Even though, the
smallest data sets show higher intra-population variability, in our study we are able to
separate between geographically close ethnic groups in our Sudanese populations.
We also evaluated the effect of ascertainment bias in the Immunochip using a subset of
putative neutral SNPs (SNPs located in intergenic and intronic regions) by PCA.
Supplementary Fig. S3 shows PC1 and PC2 using a) 9,221 genic SNPs and b) 133,724
intergenic SNPs (intergenic and intronics SNPs) genotyped in the Immunochip. We
observe a similar population structure as in main Fig. 2, regardless of the subset of SNPs
used. We also performed PCA on ten random subsets of 10,000 intergenic SNPs to test
whether the same population structure could be recovered with an equivalent sample size
as the genic SNPs (Supplementary Fig. S3c,d). We show no effect of ascertainment bias
of the SNPs used on our conclusions.
Population differentiation
To emphasize population-specific characteristics, as analysed by genetic distances
(pairwise FST), we excluded population outliers. After inspecting the PCA (main Fig. 2), 14

samples were identified as outliers with respect to their populations of origin. The excluded
individuals are: 1 Copt (211-5151), 1 Nubian (211-5042), 2 Nuba (211-4903, 211-4926), 4
Arabs (211-4969, 211-5187, 211-5212, 210-22416), and 6 Fulani (211-5208, 211-5281,
211-5215, 211-5238, 211-5198, 211-5230). See Supplementary Fig. S4 to located the
samples. Then, 433 individuals remained : 26 Copts, 36 Beja, 39 Ethiopians, 108 Arabs,
78 Nubians, 35 Darfurians, 18 Nilo-Saharan Nuba, 17 Niger-Kordofanian Nuba, 49 Nilotes,
and 27 Fulani. Then, pairwise FST values for each pair of Sudanese populations was
calculated (Supplementary Table S2, Supplementary Fig. S5)
Admixture Analysis
An unsupervised cluster algorithm, ADMIXTURE (version 1.23)12 was applied both to the
140K and to 14K data sets. To test whether sample size difference would affect the results
of ancestry estimation, a random subset of 25 (140K data set) or 18 (14K data set)
individuals was chosen for each population. In each of these four data sets, ten ancestral
clusters (k = 1 through 10) were tested successively. A 10-fold cross-validation procedure
was applied to identify the value of k for which the model had the best predictive accuracy.
Clustering results were visualized with Distruct13.
In the 140K data set, when we use all individuals (447) the statistically supported model is
k = 3 (Supplementary Fig. S6a). When we correct for sample size, the number of clusters
that best fit our data decreases, being the best supported model k = 2 (Supplementary Fig.
S6b). In the later case, populations from the Sudanese region differentiate in 3 groups: a
group from one ancestral population formed by the Coptic population (dark blue), a second
group from another ancestral population (light blue) formed by South-West populations
(Nuba, Darfurians and Nilotes) and a third group of 70/30 mixed ancestry formed by North-
East populations (Beja, Arabs, Ethiopians and Nubians) (Supplementary Fig. S7). Fulani
have mostly south-western ancestry, but they show their own component when the
number of ancestral populations increases to k = 3 (light green). At k = 4, Beja and
Ethiopian populations show a common component (dark blue). South-West populations
form a homogeneous group until k = 5, when Darfurians (dark blue) start to differentiate
from Nuba and Nilotes populations (light blue). At k = 6 Nubians separates from the rest. A
higher number of ancestral populations do not help differentiate populations between
themselves. This result is recovered when we use the 14K data set with the 14 populations
(main text, Fig. 3).
When we run ADMIXTURE in the 14K data set using a random subset of 252 individuals
(18 per population), the optimal number of ancestral clusters is 3 (explained in main text,
Fig. 3, Supplementary Fig. S8b and S10). When we include all individuals in the analysis
(921), the estimated number of ancestral populations doubles (k = 6) (Supplementary Fig.
S8a). If we were to analyse the results with all individuals, we would see that at k = 4,
Maasai would show their own component (light green) and Fulani would do it at k = 5
(pink) (Supplementary Fig. S9).
Ruling out recent European admixture
To eliminate the possibility of cryptic recent European admixture in our populations, we
extracted 85 non-related individuals from the CEU population (Utah Residents with
Northern and Western European ancestry) from the 1000 Genomes Project4. We merged
them with the 14K data set and applied a PCA and ADMIXTURE analyses using the same
procedure as before (see Principal Component and Admixture analyses).

In Supplementary Fig. S11, we can see how all African and Middle-East populations keep
roughly the same relationships among themselves but cluster closer than in the previous
PCA (see main Fig. 2). This is because the European population forms a separate cluster
very different from the other African populations. The ADMIXTURE analysis reveals a new
ancestral genetic component given by the European populations (dark blue at k = 2,
Supplementary Fig. 12a). This component represents less than 5 % in the genetic
composition of Middle-East and North-Africa populations. Now the best statistically
supported model is k = 4, corresponding to the addition of the European population
(Supplementary Fig. 12b). As the patterns of admixture between Sudanese populations do
not change with the addition of a European genetic component, we ruled out the effect of
possible recent European admixture in our populations.
F3 ancestry estimation
The three-population test is a formal test to detect admixture between populations
implemented in the qp3Pop program from ADMIXTOOLS software package3. These tests
are of the form f3 (A; B, C), where a negative value of the f3 statistic implies that population
A (target population) comes from an admixture event between the two ancestral
populations of B and C (source populations). The only situation when this test will not
detect admixture is when the target population suffered a high-degree of population-
specific drift after the admixture event.
The value of the mixing coefficient involving the first source population (α) can be
estimated with qpBound3. This value should fall within reasonable boundaries: upper
boundary of α should be higher than the lower boundary. To calculate the bonds of α we
need an outgroup population that split from the ancestral population of A,B and C before
populations A and B split. We used Yoruba as the outgroup population.
We tried every possible combination of source populations for each of our nine target
populations. For each comparison we kept the results with a significantly negative value of
the f3 statistic (Z-score < -4, p-value < 3.2×10⁻⁵). All four target populations gave a
significant result with an ancestral Middle East population (similar to the one that currently
inhabits Qatar) and an ancestral West-Africa (similar to Fulani) as source populations
(Table 2, Supplementary Table S3). This is a case when one of the source populations are
themselves admixed, as are the Fulani. Beja appear as source population in Arabs and in
Ethiopians with an ancestral South-West Sudanese population (Darfurians, Nuba or
Nilotes) as the other source population. This could be because Beja and Ethiopians are
very similar populations (FST = 0.003).
To confirm our results and the choice of Yoruba as the outgroup population, we also
estimated the mixing proportions with Luhya instead of Yoruba (Supplementary Table S4).
Then, the Yoruba population appears in all comparisons, giving a statistically significant
value of f3 and an α value within reasonable boundaries. This is an “outgroup case”, where
the ancestral population of Yoruba split from the ancestral population of A,B before they
did. Despite of the outgroup population used, the comparisons giving the most negative
values are the same, confirming that the choice of outgroup is not that relevant for these
calculations3.

Infectious disease-related genes
To assess whether the SNPs present in the Immunochip for genes related to infectious
diseases are a random subset of all the SNPs of those genes, we compared the average
FST values of two sets of SNPs. The first set is formed by all SNPs that belong to
Immunochip genes related to resistance to bacteria, malaria or fungi and present in African
populations of 1000 Genomes data4. The second set are SNPs that correspond to those
present in the Immunochip, belonging to genes related to resistance to malaria, bacteria or
fungi, and are also present in the 1000 Genomes data (see Suplementary Tables S5, S6,
and S7). Set 2 is then formed by SNPs of our study and is obviously a subset of Set 1.
We extracted those SNPs from African populations (LWK and YRI) and compared the
average FST value (mean ± standard deviation) of Set 1 and Set 2 using a t-test. We found
that the average FST values of Immunochip SNPs of infectious disease-related genes are
not statistically different from the average FST values of all SNPs of infectious disease-
related genes of African populations from 1000 Genomes Project (Supplementary Table
S8). Thus, the SNPs present in the Immunochip for those genes can be considered as a
representative sample of all the SNPs in those genes.
We can take the same approach using global FST values instead of pairwise FST distances
between our 4 sets of Sudanese populations. Then, we observe that globally genes
related to resistance to bacteria, malaria or fungi have an average FST value that is
statistically lower than the mean of the sampling distribution (Supplementary Fig. S13).
However, as shown by the pairwise comparisons these results are driven by the
similarities of some populations and not by all of them.

REFERENCES
1. Trynka, G. et al. Dense genotyping identifies and localizes multiple common and rare variant association signals in celiac disease. Nat. Genet. 43, 1193–201 (2011).
2. Weir, B. S. & Hill, W. G. Estimating F-statistics. Annu. Rev. Genet. 36, 721–750 (2002).
3. Patterson, N. et al. Ancient admixture in human history. Genetics 192, 1065–93 (2012).
4. Abecasis, G. R. et al. An integrated map of genetic variation from 1,092 human genomes. Nature 491, 56–65 (2012).
5. Altshuler, D. M., Gibbs, R. A. & Peltonen, L. T. I. H. 3 C. Integrating common and rare genetic variation in diverse human populations. Nature 467, 52–58 (2010).
6. Henn, B. M. et al. Genomic ancestry of North Africans supports back-to-Africa migrations. PLoS Genet. 8, e1002397 (2012).
7. Hunter-Zinck, H. et al. Population Genetic Structure of the People of Qatar. Am. J. Hum.Genet. 87, 17–25 (2010).
8. Purcell, S. et al. PLINK: a tool set for whole-genome association and population-based linkage analyses. Am. J. Hum. Genet. 81, 559–75 (2007).
9. R Core Team. R: A Language and Environment for Statistical Computing. (R Foundationfor Statistical Computing, 2014).
10. Patterson, N., Price, A. L. & Reich, D. Population structure and eigenanalysis. PLoS Genet. 2, e190 (2006).
11. Sikora, M., Laayouni, H., Calafell, F., Comas, D. & Bertranpetit, J. A genomic analysis identifies a novel component in the genetic structure of sub-Saharan African populations. Eur. J. Hum. Genet. 19, 84–8 (2011).
12. Alexander, D. H. & Lange, K. Enhancements to the ADMIXTURE algorithm for individual ancestry estimation. BMC Bioinformatics 12, 246 (2011).
13. Rosenberg, N. a. Distruct: a Program for the Graphical Display of Population Structure.Mol. Ecol. Notes 4, 137–138 (2003).
14. Kwiatkowski, D. P. How malaria has affected the human genome and what human genetics can teach us about malaria. Am. J. Hum. Genet. 171–192 (2005).
15. Sikora, M., Ferrer-Admetlla, A., Mayor, A., Bertranpetit, J. & Casals, F. Evolutionary analysis of genes of two pathways involved in placental malaria infection. Hum. Genet. 123, 343–57 (2008).


![The Kayigang [=Keiga, Deiga] language of the Nuba hills, Sudan](https://img.pdfslide.us/doc/110x75/61fb3d202e268c58cd5bcedb/the-kayigang-keiga-deiga-language-of-the-nuba-hills-sudan.jpg)