Embed Size (px)
Citation preview

w w w. n a t u r e . c o m / n a t u r e | 1
SuPPLementarY InFormatIondoi:10.1038/nature09646
Con
cen
tratio
n (n
g m
l-1)
Rel
ativ
e am
oun
t (%
GF
mic
e)
Supplementary Figure 1 | Effect of B. longum JCM 1217T (BL) and B. adolescentis JCM 1275T
(BA) on toxicity of Shiga toxin 2 five to seven days after O157 inoculation.
a, Stx2 concentration in the feces. b, The amount of mucin and total IgA in the caecal contents.
Error bars indicate s.e.m. (n = 3).
a
0
100
200
O157BA + O157
BL + O157
O157BA + O157
BL + O157
O157BA + O157
BL + O157
0
100
200
mucin IgAb

SUPPLEMENTARY INFORMATION
2 | w w w. n a t u r e . c o m / n a t u r e
RESEARCH
Supplementary Figure 2 | Histological analysis of B. longum JCM 1217T
(BL) and B. adolescentis JCM 1275T (BA)-associated mice after O157
infection.
a, Hematoxylin-eosin staining of the murine distal colon five to seven days
after inoculation of O157. The distal colon of the GF mice, O157-,
BL+O157-, and BA+O157-associated mice are shown. b, Immunostaining
of murine distal colon in GF, and BL- and BA-associated mice seven days after inoculation of O157.
c, Hematoxylin-eosin staining of the murine distal colon one day after inoculation of O157.
d, TdT-mediated dUTP nick end-labeling (TUNEL) staining of the murine distal colon on day one of
O157 inoculation. a-d, Data are representative of two independent experiments (n = 5).
Scale bars: 100 µm.
GF BA+O157BL+O157O157a
CD
4TU
NEL
Ki6
7C
D11
bC
D11
c
b BL+O157BA+O157O157
.
BL+
O15
7B
AB
A+O
157
d
O15
7
c
BA
+O15
7O
157

w w w. n a t u r e . c o m / n a t u r e | 3
SUPPLEMENTARY INFORMATION RESEARCH
Supplementary Figure 3 | Multivariate analysis of gene expression profiles of the colonic epithelium on day one of O157 inoculation.Gene expression profiles of each group were normalized to those in GF mice and analysed by self-organised mapping (SOM) to reduce the noise generated by the gene profiling data. The resulting data were further subjected to hierarchical clustering analysis (HCA) and partial least squares-discriminant analysis (PLS-DA) to determine the distance similarities and to identify the differential factors among the experimental groups, respectively. a, Clustering of the O157-monoassociated mice (O157), B. adolescentis JCM 1275T and O157-associated mice (BA+O157), and B. longum subsp. longum JCM 1217T and O157-associated mice (BL+O157) are based on gene expression profiles (n = 2). In the SOM analysis, each cell in the lattice represents a cluster of several genes with equal gene expression values. The colors indicate the relative levels of gene expression compared to those of GF mice (as depicted on the color scale). In the HCA analysis, the scale bar represents the length of the branches of the dendrogram accounting for the similarity distance among groups. b, PLS-DA on transcriptome data on day one of O157 inoculation. Proportions of the first (PC1), second (PC2), and third (PC3) components are 50.1%, 26.5%, and 12.4%, respectively. c, Quantitative RT-PCR analysis of the genes contributing the component based on partial least squares-discriminant analysis(PLS-DA) on day one of O157 inoculation (b). Error bars indicate s.e.m. (n = 3). P values in all experiments for O157, BA+O157, and BL+O157 were determined using the one-way ANOVA test followed by Tukey’ stest, or the Kruskal-Wallis test followed by the Scheffé test. Asterisks and double asterisks indicate P < 0.05 and P < 0.01, respectively.
a bO157
BL+O157
BA+O157
PC2
0.1
O157BA+O157BL+O157
Relative value 0 1 3
cO157BA+O157BL+O157
3
2
1
0
Rela
tive
mRN
A ex
pres
sion
in G
F m
urin
ecol
onic
epi
thel
ium
(log
10) 4
Socs3Reg3gReg3b
Cxcl9 Cxcl10 Trim15 Nr4a1
3
2
1
0
*
** ****
**
*** ********
****

SUPPLEMENTARY INFORMATION
4 | w w w. n a t u r e . c o m / n a t u r e
RESEARCH
GF BA BT BL BF
13C
che
mic
al s
hift
(ppm
)1H chemical shift (ppm)
50
60
70
80
904 3 4 3 4 3 4 3 4 3
1 H N
MR
sign
al in
tens
ity
1.5
1.0
0.5
0.0
GF: germ-free miceBA:BA-associated miceBT: BT-associated miceBL: BL-associated miceBF: BF-associated mice
Supplementary Figure 4 | Signal intensities of the sugar region by 1H NMR and 1H-13C
correlation NMR measurements.
The signal intensities of the sugar region (3.0 - 4.5 ppm) observed by 1H NMR (upper) and 1H-13C corrrelation NMR (lower) analysis are shown. The y-axes of the 1H NMR and 1H-13C
corrrelation NMR data correspond to relative signal intensity to GF mice and 13C chemical shift,
respectively. The x-axis of both data indicates the 1H chemical shift. In the 1H-13C corrrelation NMR
measurement, signal intensities are shown as contour lines. The signals surrounded by circles in panel
GF were assigned as fructose (red), raffinose or sucrose (brown), and maltose (green). Data are from
one of five independent murine faecal samples.

w w w. n a t u r e . c o m / n a t u r e | 5
SUPPLEMENTARY INFORMATION RESEARCH
BL-
asso
ciat
ed m
urin
e co
loni
c ep
ithel
ium
(nor
mal
ized
inte
nsity
)
BA-associated murine colonic epithelium (normalized intensity)
Supplementary Figure 5 | Comparison of the gene expression profiles between the BL- and BA-
monoassociated murine colonic epithelium on day seven of bifidobacterial inoculation.
Normalised data obtained by cDNA microarray analysis are shown in the scatter plot.
The upper and lower lines indicate the threshold levels of two-fold higher and lower expression,
respectively.

SUPPLEMENTARY INFORMATION
6 | w w w. n a t u r e . c o m / n a t u r e
RESEARCH
Rel
ativ
e m
RN
A e
xpre
ssio
n
(%
Gap
dh)
Supplementary Figure 6 | The expression level of A4galt, which encodes globotriaosylceramide
(Gb3) synthase (α 1,4-galactosyltransferase; A4GALT) in BA- and BL-monoassociated murine
colonic epithelium.
Error bars indicate s.e.m. (n = 3). The glycolipid Gb3 has been identified as a Stx receptor.
The expression level of the gene encoding A4GALT was comparable between BA- and
BL-monoassociated murine colonic epithelium, indicating that the preventive effect by BL aginst O157
lethal infection was not associated with the downregulation of the Stx receptor expression.
BA BL
0.2
0.1
0.0

w w w. n a t u r e . c o m / n a t u r e | 7
SUPPLEMENTARY INFORMATION RESEARCH
Rnase1TgfbiRcn1Coro1aPla2g2aC3G21Rik*Faim3Arl4dCd53Slc11a2Lzp-sC1qaApoeMs4a1Krt36CremNr4a1Gdf15Ifit2H2-aaH2-ab1H2-eaCd74
0.1 4 3 2 11H chemical shift (ppm)
1
0
-1
Correlation coefficient
Supplementary Figure 7 | Covariation analysis between gene expression profiles of the colonic
epithelium and metabolic profiles of the feces in the BL- or BA-monoassociated mice seven days
after inoculation of each bifidobacterial strain.
The two-dimensional correlation map was calculated as a matrix in which an element at position (i, j) is
defined as a correlation coefficient (r) between the i-th genes and the j-th bins in a set of microarray data
(24 genes that differed in expression level by more than two-fold between BL and BA mice) and1H NMR spectra (n = 3). A positively (or negatively) higher coefficient means the existence of a positive
(or negative) correlation between the i-th and j-th signals or peaks. Pearson's correlation coefficient
was calculated using the R software package. Correlation coefficients are shown as follows:
red (0.9 < r), black (-0.9 < r < 0.9), and green (-0.9 > r). The Y axis indicates the HCA value. The scale
bar represents the length of the branches of the dendrogram accounting for the similarity distance among
genes. The distance was calculated based on the correlation coefficient of the metabolites. G21Rik
means 2010309G21Rik. The X axis indicates the 1H chemical shift (0.5-4.5 ppm). Covariation analysis
of these 24 genes with fecal metabolic difference between BL and BA mice indicated a strong
correlation of the expression level of some of these genes with the amounts of faecal metabolites,
especially amino acids and organic acids (positive correlation: 1.0-2.0 ppm), and carbohydrates
(negative correlation: 3.0–4.5 ppm).
SUPPLEMENTARY INFORMATION
8 | w w w. n a t u r e . c o m / n a t u r e
RESEARCH
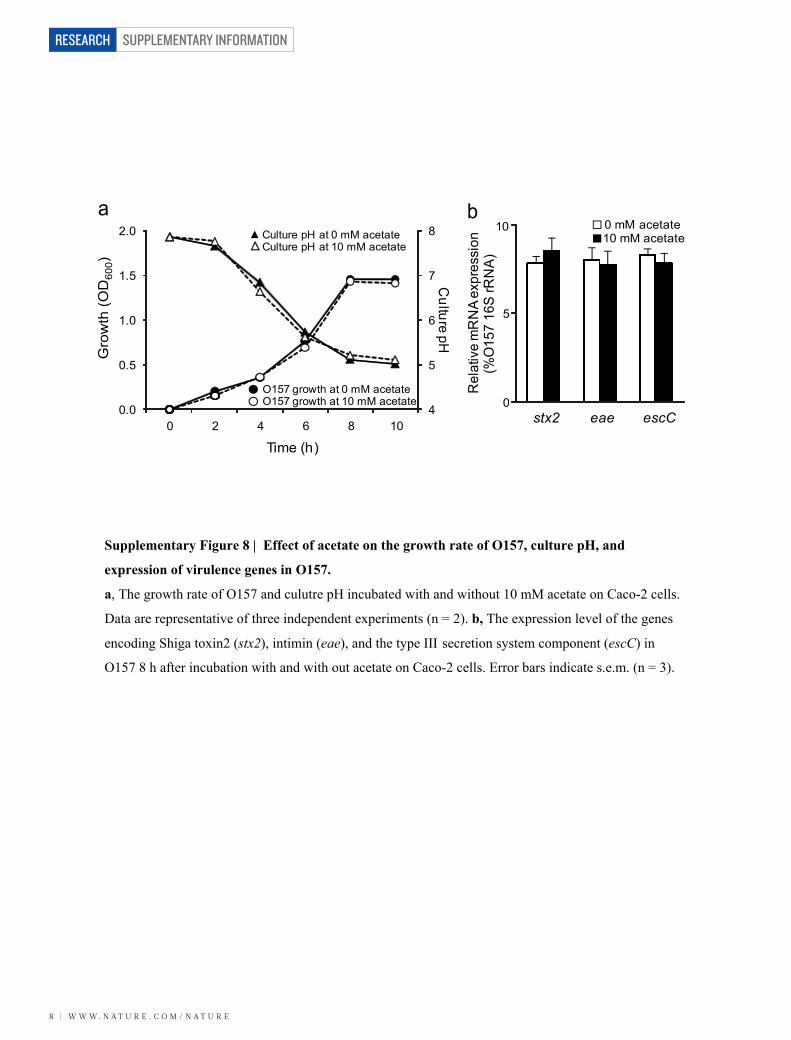
Supplementary Figure 8 | Effect of acetate on the growth rate of O157, culture pH, and
expression of virulence genes in O157.
a, The growth rate of O157 and culutre pH incubated with and without 10 mM acetate on Caco-2 cells.
Data are representative of three independent experiments (n = 2). b, The expression level of the genes
encoding Shiga toxin2 (stx2), intimin (eae), and the type III secretion system component (escC) in
O157 8 h after incubation with and with out acetate on Caco-2 cells. Error bars indicate s.e.m. (n = 3).
Gro
wth
(OD
600)
a b
4
5
6
7
8
0.0
0.5
1.0
1.5
2.0
0 2 4 6 8 10
Time (h)
Culture pH
● O157 growth at 0 mM acetate ○ O157 growth at 10 mM acetate 0.00
0.05
0.10
stx2 eae escC
□0 mM acetate ■10 mM acetate Culture pH at 0 mM acetate
Culture pH at 10 mM acetate
10
5
0
Rel
ativ
e m
RN
A ex
pres
sion
(%
O15
7 16
S rR
NA
)

w w w. n a t u r e . c o m / n a t u r e | 9
SUPPLEMENTARY INFORMATION RESEARCH
0.0
0.3
0.6
BN-GBN-FBNKO-GBNKO-FBA-GBA-FBAtg-GBAtg-F
Rel
ativ
e m
RN
A e
xpre
ssio
n
(
%16
S r
RN
A)
a
b
0.000
0.005
0.010 BLBFBN
COG no.1879 1129 1172 1129 1879 1172
Rel
ativ
e m
RN
A e
xpre
ssio
n
(
%16
S r
RN
A)
Supplementary Figure 9 | Quantitative RT-PCR analysis of the genes assigned to the three COGs (COG1879, 1129, and1172) in bifidobacterial strains. a, Expression level of these COG genes in BN, BNKO, BA, and BAtg strains in vitro. Bifidobacterial RNA was extracted from in vitro culture after 12 h incubation with addition of glucose (G) or fructose (F) as a substrate. PCR amplification efficiency of BN genomic DNA used as a template was comparable among these primers (data not shown). Asterisks indicate below the threshold of detection. b, Gene expression level of BL0033 in the feces of preventive bifidobacteria-associated mice. Gene expression levels are expressed as values relative to 16S rRNA expression (a, b). Error bars indicate s.e.m.. (n = 3).
* * * * * * * * * * * * * * * * * * * *

SUPPLEMENTARY INFORMATION
1 0 | w w w. n a t u r e . c o m / n a t u r e
RESEARCH
Supplementary Figure 10 | Targeted disruption of the ABC type carbohydrate transporter gene,
BL0033, in B. longum subsp. longum NCC 2705 (BN) by homologous recombination.
a, Schematic representation of the genomic structure of the wild-type BN BL0033 gene (WT), the
targeting vector, and the resultant mutant generated by homologous recombination (BNKO) containing
the spectinomycin resistant gene (Spec). Restriction enzyme sites are denoted as follows: EI, EcoRI;
EV, EcoRV; H, HindIII. b and c, Confirmation of the disruption of BL0033, as well as the absence of
random integration of the targeting vector by Southern blot (b) and PCR (c) analyses of genomic DNA
from wild-type BN (WT) and BNKO (KO). Probe A, depicted as dark boxes in (a), were used to detect
3-kb (WT) or 4-kb (KO) EcoRI genomic fragments. Probe B were also used to detect 4-kb (KO) EcoRI,
7.7-kb EcoRV, and 5.6-kb HindIII genomic fragments in BNKO but not in WT starin. Positions of
primers for PCR are depicted in (a). The primer sequences are shown in Supplementary Table 12.
The sizes of the PCR products for BL0033 and Spec are 154 bp and 143 bp, respectively.
a
b
5.04.03.02.0
1.0
WT KO
Targeting vector
WT
Spec(1.1 kb)
BNKO Spec
BL0033(1.0 kb)
EI EI
EI EI
Probe A
Probe A
EI
Probe B
cWT KO WT KO
100
5.04.03.02.0
1.0
200
(bp)
Probe A Probe B
EI
BL0033 Spec
(kb) (kb)
7.06.05.04.0
7.06.05.04.0
EcoRV HindIIIProbe B Probe B
EcoRIEcoRI
EV
EV
EV
EV
H H
HH
(kb) (kb)
WT KO WT KO WT KO

w w w. n a t u r e . c o m / n a t u r e | 1 1
SUPPLEMENTARY INFORMATION RESEARCH
Supplementary Figure 11 | Ability of bifidobacteria to prevent Caco-2 cell death from O157
infection.
a, Preventive bifidobacteria (Bifidobcterium longum subsp. longum NCC 2705; BN) and BN deficient
in the ABC-type carbohydrate transporter gene BL0033 (BNKO) were preincubated with Caco-2 cells
for 12 h prior to O157 infection. Fructose was added to glucose-free Dulbecco's Modified Eagle's
Medium for culturing. The number of dead cells was counted 8 h after O157 infection. b, The
expression level of the genes encoding Shiga toxin2 (stx2), intimin (eae), and the type III secretion
system component (escC) in O157 8 h after O157 infection. Error bars indicate s.e.m. (n = 6). P values
were determined using the Kruskal-Wallis test followed by the Scheffé test. Double asterisks mean
P < 0.01.
0
50
100
No add
ition BN
BNKOO15
7
BN+O157
BNKO+O157
**
Num
ber o
f dea
d ce
lls (p
er m
m2
)
150
0
5
10
15
stx2 eae escC
■O157 ■BN+O157■BNKO+O157
Rel
ativ
e m
RN
A ex
pres
sion
(%
O15
7 16
S rR
NA
)
a b**
SUPPLEMENTARY INFORMATION
1 2 | w w w. n a t u r e . c o m / n a t u r e
RESEARCH
Colonic epithelium
Acetate
Carbohydrates
BL, BF, and BNBA and BT
Stx2
E. coli O157:H7
Cell death followedby inflammation
Carbohydrate transporters
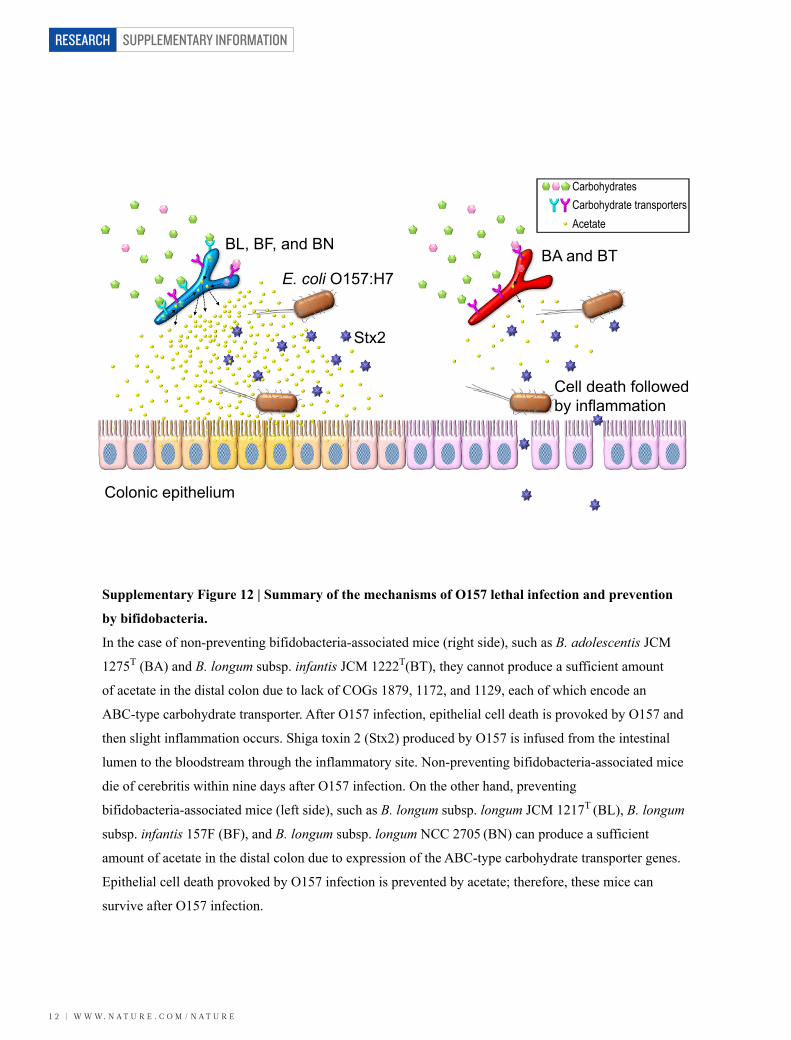
Supplementary Figure 12 | Summary of the mechanisms of O157 lethal infection and prevention
by bifidobacteria.
In the case of non-preventing bifidobacteria-associated mice (right side), such as B. adolescentis JCM
1275T (BA) and B. longum subsp. infantis JCM 1222T(BT), they cannot produce a sufficient amount
of acetate in the distal colon due to lack of COGs 1879, 1172, and 1129, each of which encode an
ABC-type carbohydrate transporter. After O157 infection, epithelial cell death is provoked by O157 and
then slight inflammation occurs. Shiga toxin 2 (Stx2) produced by O157 is infused from the intestinal
lumen to the bloodstream through the inflammatory site. Non-preventing bifidobacteria-associated mice
die of cerebritis within nine days after O157 infection. On the other hand, preventing
bifidobacteria-associated mice (left side), such as B. longum subsp. longum JCM 1217T (BL), B. longum
subsp. infantis 157F (BF), and B. longum subsp. longum NCC 2705 (BN) can produce a sufficient
amount of acetate in the distal colon due to expression of the ABC-type carbohydrate transporter genes.
Epithelial cell death provoked by O157 infection is prevented by acetate; therefore, these mice can
survive after O157 infection.

w w w. n a t u r e . c o m / n a t u r e | 1 3
SUPPLEMENTARY INFORMATION RESEARCH

SUPPLEMENTARY INFORMATION
1 4 | w w w. n a t u r e . c o m / n a t u r e
RESEARCH

w w w. n a t u r e . c o m / n a t u r e | 1 5
SUPPLEMENTARY INFORMATION RESEARCH
SUPPLEMENTARY INFORMATION
1 6 | w w w. n a t u r e . c o m / n a t u r e
RESEARCH
w w w. n a t u r e . c o m / n a t u r e | 1 7
SUPPLEMENTARY INFORMATION RESEARCH
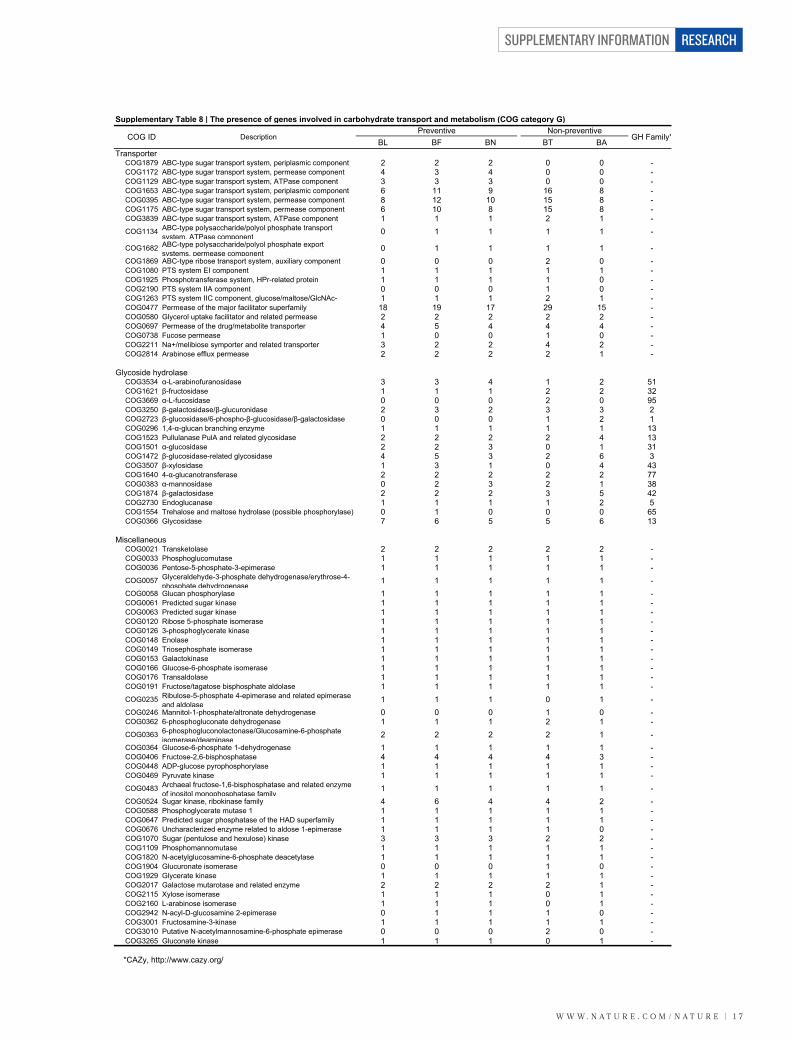
BL BF BN BT BATransporter
COG1879 ABCtype sugar transport system, periplasmic component 2 2 2 0 0 COG1172 ABCtype sugar transport system, permease component 4 3 4 0 0 COG1129 ABCtype sugar transport system, ATPase component 3 3 3 0 0 COG1653 ABCtype sugar transport system, periplasmic component 6 11 9 16 8 COG0395 ABCtype sugar transport system, permease component 8 12 10 15 8 COG1175 ABCtype sugar transport system, permease component 6 10 8 15 8 COG3839 ABCtype sugar transport system, ATPase component 1 1 1 2 1 COG1134 ABCtype polysaccharide/polyol phosphate transport
system, ATPase component0 1 1 1 1
COG1682 ABCtype polysaccharide/polyol phosphate exportsystems, permease component
0 1 1 1 1 COG1869 ABCtype ribose transport system, auxiliary component 0 0 0 2 0 COG1080 PTS system EI component 1 1 1 1 1 COG1925 Phosphotransferase system, HPrrelated protein 1 1 1 1 0 COG2190 PTS system IIA component 0 0 0 1 0 COG1263 PTS system IIC component, glucose/maltose/GlcNAc 1 1 1 2 1 COG0477 Permease of the major facilitator superfamily 18 19 17 29 15 COG0580 Glycerol uptake facilitator and related permease 2 2 2 2 2 COG0697 Permease of the drug/metabolite transporter 4 5 4 4 4 COG0738 Fucose permease 1 0 0 1 0 COG2211 Na+/melibiose symporter and related transporter 3 2 2 4 2 COG2814 Arabinose efflux permease 2 2 2 2 1
Glycoside hydrolaseCOG3534 Larabinofuranosidase 3 3 4 1 2 51COG1621 fructosidase 1 1 1 2 2 32COG3669 Lfucosidase 0 0 0 2 0 95COG3250 galactosidase/glucuronidase 2 3 2 3 3 2COG2723 glucosidase/6phosphoglucosidase/galactosidase 0 0 0 1 2 1COG0296 1,4glucan branching enzyme 1 1 1 1 1 13COG1523 Pullulanase PulA and related glycosidase 2 2 2 2 4 13COG1501 glucosidase 2 2 3 0 1 31COG1472 glucosidaserelated glycosidase 4 5 3 2 6 3COG3507 xylosidase 1 3 1 0 4 43COG1640 4glucanotransferase 2 2 2 2 2 77COG0383 mannosidase 0 2 3 2 1 38COG1874 galactosidase 2 2 2 3 5 42COG2730 Endoglucanase 1 1 1 1 2 5COG1554 Trehalose and maltose hydrolase (possible phosphorylase) 0 1 0 0 0 65COG0366 Glycosidase 7 6 5 5 6 13
MiscellaneousCOG0021 Transketolase 2 2 2 2 2 COG0033 Phosphoglucomutase 1 1 1 1 1 COG0036 Pentose5phosphate3epimerase 1 1 1 1 1 COG0057 Glyceraldehyde3phosphate dehydrogenase/erythrose4
phosphate dehydrogenase1 1 1 1 1
COG0058 Glucan phosphorylase 1 1 1 1 1 COG0061 Predicted sugar kinase 1 1 1 1 1 COG0063 Predicted sugar kinase 1 1 1 1 1 COG0120 ibose 5phosphate isomerase 1 1 1 1 1 COG0126 3phosphoglycerate kinase 1 1 1 1 1 COG0148 Enolase 1 1 1 1 1 COG0149 Triosephosphate isomerase 1 1 1 1 1 COG0153 Galactokinase 1 1 1 1 1 COG0166 Glucose6phosphate isomerase 1 1 1 1 1 COG0176 Transaldolase 1 1 1 1 1 COG0191 Fructose/tagatose bisphosphate aldolase 1 1 1 1 1 COG0235 ibulose5phosphate 4epimerase and related epimerase
and aldolase1 1 1 0 1
COG0246 Mannitol1phosphate/altronate dehydrogenase 0 0 0 1 0 COG0362 6phosphogluconate dehydrogenase 1 1 1 2 1 COG0363 6phosphogluconolactonase/Glucosamine6phosphate
isomerase/deaminase2 2 2 2 1
COG0364 Glucose6phosphate 1dehydrogenase 1 1 1 1 1 COG0406 Fructose2,6bisphosphatase 4 4 4 4 3 COG0448 ADPglucose pyrophosphorylase 1 1 1 1 1 COG0469 Pyruvate kinase 1 1 1 1 1 COG0483 Archaeal fructose1,6bisphosphatase and related enzyme
of inositol monophosphatase family1 1 1 1 1
COG0524 Sugar kinase, ribokinase family 4 6 4 4 2 COG0588 Phosphoglycerate mutase 1 1 1 1 1 1 COG0647 Predicted sugar phosphatase of the HAD superfamily 1 1 1 1 1 COG0676 ncharacterized enzyme related to aldose 1epimerase 1 1 1 1 0 COG1070 Sugar (pentulose and hexulose) kinase 3 3 3 2 2 COG1109 Phosphomannomutase 1 1 1 1 1 COG1820 Nacetylglucosamine6phosphate deacetylase 1 1 1 1 1 COG1904 Glucuronate isomerase 0 0 0 1 0 COG1929 Glycerate kinase 1 1 1 1 1 COG2017 Galactose mutarotase and related enzyme 2 2 2 2 1 COG2115 Xylose isomerase 1 1 1 0 1 COG2160 Larabinose isomerase 1 1 1 0 1 COG2942 NacylDglucosamine 2epimerase 0 1 1 1 0 COG3001 Fructosamine3kinase 1 1 1 1 1 COG3010 Putative Nacetylmannosamine6phosphate epimerase 0 0 0 2 0 COG3265 Gluconate kinase 1 1 1 0 1
*CAZy, http://www.cazy.org/
Preventive NonpreventiveCOG ID Description GH Family*

SUPPLEMENTARY INFORMATION
1 8 | w w w. n a t u r e . c o m / n a t u r e
RESEARCH

w w w. n a t u r e . c o m / n a t u r e | 1 9
SUPPLEMENTARY INFORMATION RESEARCH
≥

SUPPLEMENTARY INFORMATION
2 0 | w w w. n a t u r e . c o m / n a t u r e
RESEARCH

w w w. n a t u r e . c o m / n a t u r e | 2 1
SUPPLEMENTARY INFORMATION RESEARCH


![Chemical Sequestration of CO by CaCO Dissolution...Pacific [CO. 3] Upper Sed. CaCO. 3. The ocean and atmosphere will react to excess CO. 2. emissions by reacting it with CaCO. 3. sediments](https://img.pdfslide.us/doc/110x75/5e9513f96f11a86fd534117d/chemical-sequestration-of-co-by-caco-dissolution-pacific-co-3-upper-sed.jpg)