Embed Size (px)
Citation preview
1
Supplementary Information Meta-analysis identifies multiple loci associated with kidney function-related traits in East Asian populations
Yukinori Okada1,2,40,*, Xueling Sim3,4,40, Min Jin Go5,40, Jer-Yuarn Wu6,7,40, Dongfeng Gu8,40, Fumihiko
Takeuchi9,40, Atsushi Takahashi1, Shiro Maeda10, Tatsuhiko Tsunoda11, Peng Chen12, Su-Chi Lim12,13, Tien-Yin
Wong14,15,16, Jianjun Liu17, Terri L. Young18, Tin Aung14,15, Mark Seielstad19, Yik-Ying Teo3,12,17,20,21, Young Jin
Kim5, Jong-Young Lee5, Bok-Ghee Han5, Daehee Kang22, Chien-Hsiun Chen6,7, Fuu-Jen Tsai7, Li-Ching
Chang6, S.-J. Cathy Fann6, Hao Mei23, Dabeeru C. Rao24, James E. Hixson25, Shufeng Chen8, Tomohiro
Katsuya26,27, Masato Isono9, Toshio Ogihara27,28, John C. Chambers29, Weihua Zhang29, Jaspal S. Kooner30,
the KidneyGen consortium31, the CKDGen consortium31, Eva Albrecht32, the GUGC consortium31, Kazuhiko
Yamamoto2, Michiaki Kubo33, Yusuke Nakamura34, Naoyuki Kamatani35, Norihiro Kato9,41, Jiang He23,41,
Yuan-Tsong Chen6,41, Yoon Shin Cho5,36,41, E-Shyong Tai12,37,38,41, and Toshihiro Tanaka39,41
1. Laboratory for Statistical Analysis, Center for Genomic Medicine (CGM), RIKEN, Yokohama, Japan.
2. Department of Allergy and Rheumatology, Graduate School of Medicine, University of Tokyo, Tokyo, Japan.
3. Centre for Molecular Epidemiology, Yong Loo Lin School of Medicine, National University of Singapore,
Singapore.
4. Center for Statistical Genetics, University of Michigan, United States.
5. Center for Genome Science, National Institute of Health, Osong Health Technology Administration Complex,
Chungcheongbuk-do, The Republic of Korea.
6. Institute of Biomedical Sciences, Academia Sinica, Taipei, Taiwan.
7. School of Chinese Medicine, China Medical University, Taichung, Taiwan.
8. Cardiovascular Institute and Fu Wai Hospital, Chinese Academy of Medical Sciences and Peking Union
Medical College, Beijing, China.
9. Department of Gene Diagnostics and Therapeutics, Research Institute, National Center for Global Health
and Medicine, Tokyo, Japan.
10. Laboratory for Endocrinology and Metabolism, CGM, RIKEN, Yokohama, Japan.
11. Laboratory for Medical Informatics, CGM, RIKEN, Yokohama, Japan.
12. Saw Swee Hock School of Public Health, National University of Singapore, Singapore.
13. Diabetes Centre and Department of Medicine, Khoo Teck Puat Hospital, Singapore.
14. Singapore Eye Research Institute, Singapore National Eye Centre, Singapore.
Nature Genetics: doi:10.1038/ng.2352
2
15. Department of Ophthalmology, Yong Loo Lin School of Medicine, National University of Singapore,
Singapore.
16. Centre for Eye Research Australia, University of Melbourne, East Melbourne VIC, Australia.
17. Genome Institute of Singapore, Agency for Science, Technology and Research, Singapore.
18. Center for Human Genetics, Duke University Medical Center, Durham, NC, USA.
19. Institute of Human Genetics, University of California, San Francisco, CA, USA.
20. Department of Statistics and Applied Probability, National University of Singapore, Singapore.
21. NUS Graduate School for Integrative Science and Engineering, National University of Singapore,
Singapore.
22. Department of Preventive Medicine, Seoul National University College of Medicine, Seoul, The Republic of
Korea.
23. Department of Epidemiology, Tulane University School of Public Health and Tropical Medicine, New
Orleans, LA, USA.
24. Division of Biostatistics, Washington University School of Medicine, St. Louis, MO, USA.
25. Human Genetics Center, University of Texas School of Public Health, Houston, TX, USA.
26. Department of Clinical Gene Therapy, Osaka University Graduate School of Medicine, Suita, Japan.
27. Department of Geriatric Medicine and Nephrology, Osaka University Graduate School of Medicine, Suita,
Japan.
28. Morinomiya University of Medical Sciences, Osaka, Japan.
29. Dept Epidemiology and Biostatistics, Imperial College London, United Kingdom.
30. National Heart and Lung Institute, Imperial College London, United Kingdom.
31. Full list of contributing authors for the KidneyGen, CKDGen, and GUGC consortia is provided in
Supplementary Information.
32. Institute of Genetic Epidemiology, Helmholtz Zentrum München - German Research Center for
Environmental Health, Neuherberg, Germany.
33. Laboratory for Genotyping Development, CGM, RIKEN, Yokohama, Japan.
34. Laboratory of Molecular Medicine, Human Genome Center, Institute of Medical Science, University of
Tokyo, Tokyo, Japan.
35. Laboratory for International Alliance, CGM, RIKEN, Yokohama, Japan.
36. Department of Biomedical Science, Hallym University, Hallymdaehak-gil, Chuncheon, Gangwon-do, The
Republic of Korea.
37. Department of Medicine, Yong Loo Lin School of Medicine, National University of Singapore, Singapore.
38. Duke-National University of Singapore Graduate Medical School, Singapore.
Nature Genetics: doi:10.1038/ng.2352
3
39. Laboratory for Cardiovascular Diseases, CGM, RIKEN, Yokohama, Japan.
40. These authors contributed equally to this work.
41. These authors directed equally to this work.
*Corresponding author: Yukinori Okada
Laboratory for Statistical Analysis, Center for Genomic Medicine, RIKEN
4-6-1 Shirokane-dai, Minato-ku, Tokyo 108-8639, Japan
Telephone: +81-3-5449-5509, Fax: +81-3-5449-5564
E-mail: [email protected]
Nature Genetics: doi:10.1038/ng.2352
4
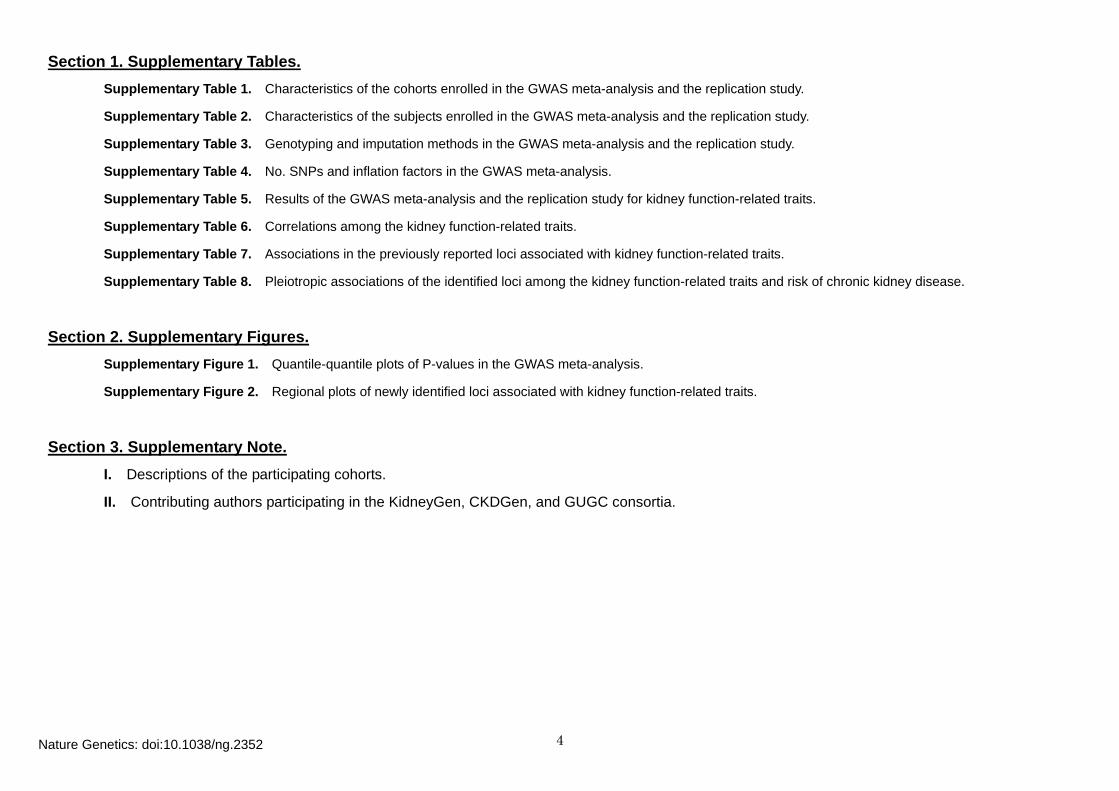
Supplementary Table 1. Characteristics of the cohorts enrolled in the GWAS meta-analysis and the replication study.
Section 1. Supplementary Tables.
Supplementary Table 2. Characteristics of the subjects enrolled in the GWAS meta-analysis and the replication study.
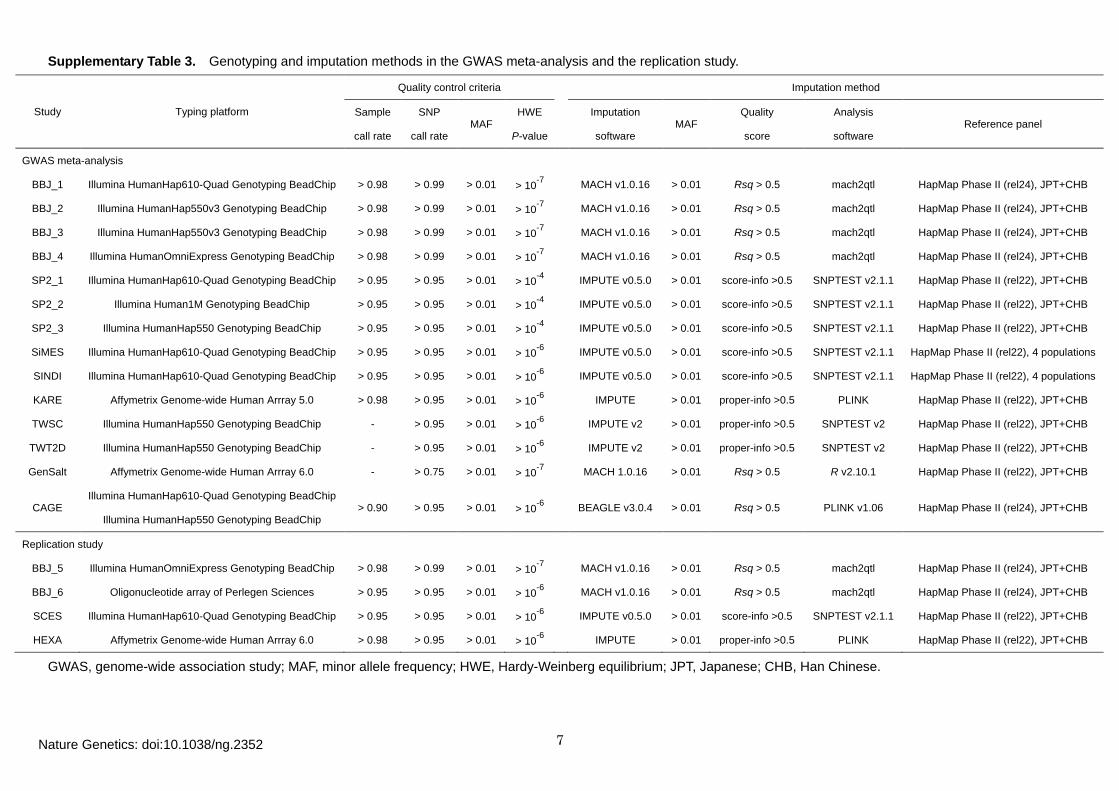
Supplementary Table 3. Genotyping and imputation methods in the GWAS meta-analysis and the replication study.
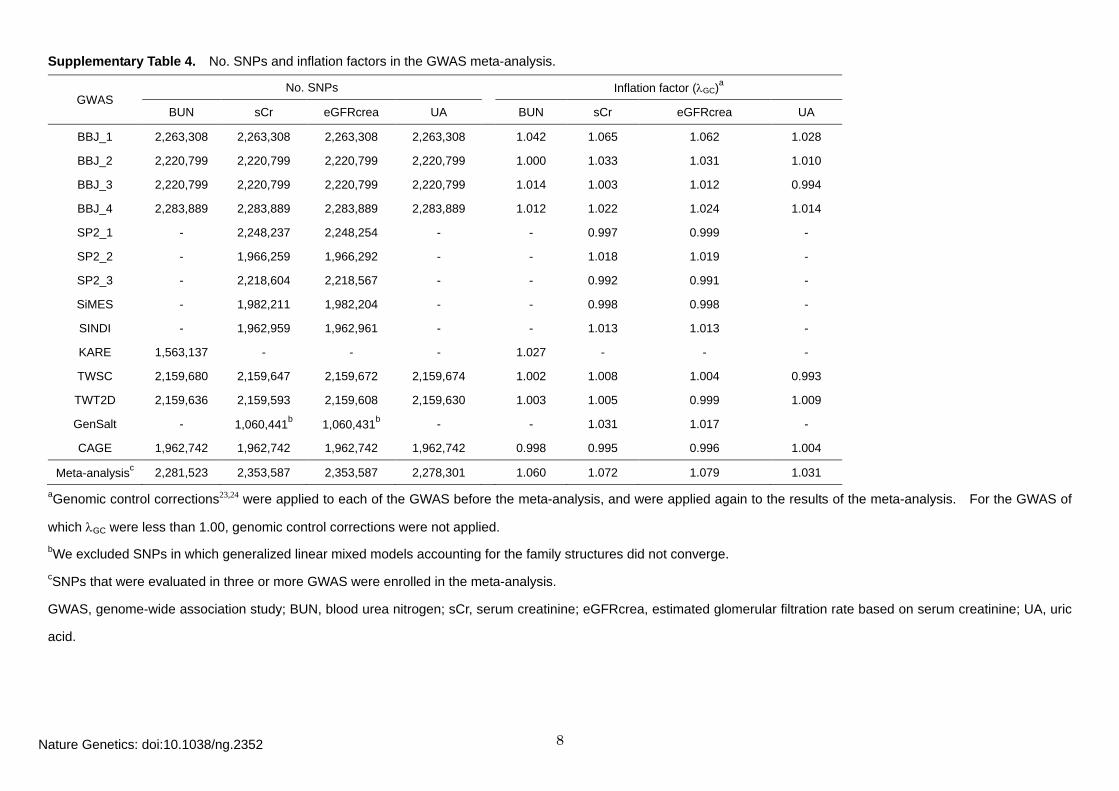
Supplementary Table 4. No. SNPs and inflation factors in the GWAS meta-analysis.
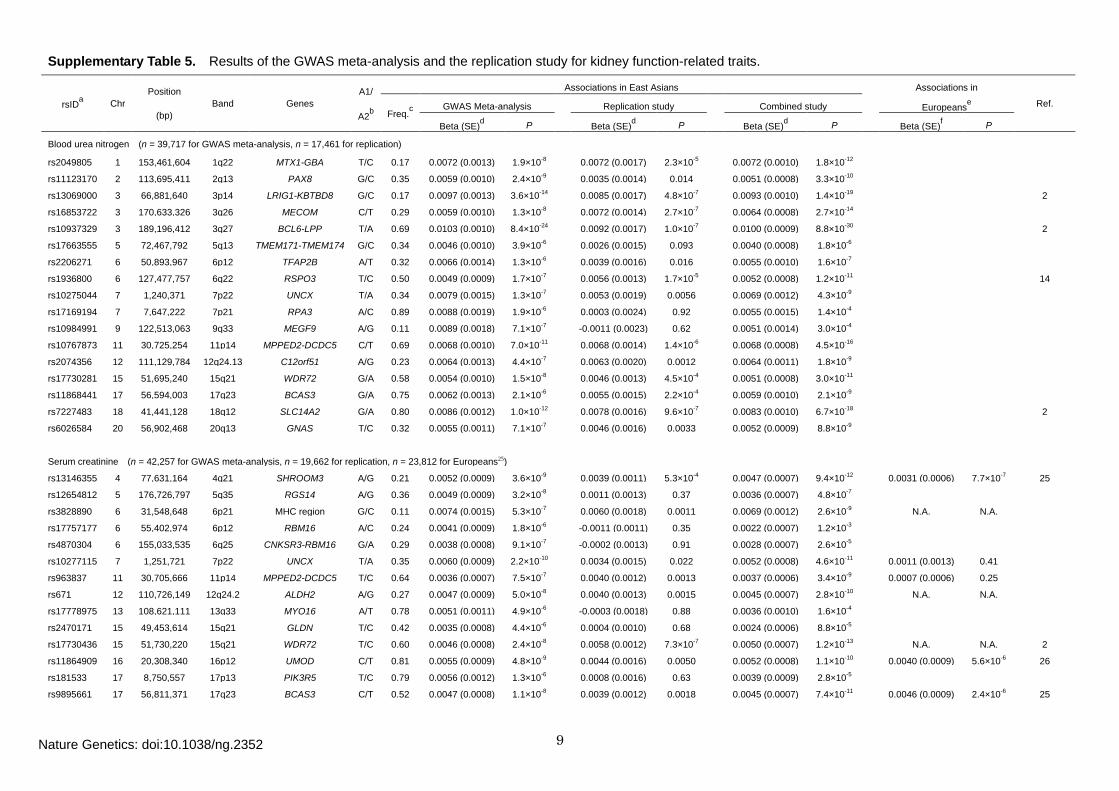
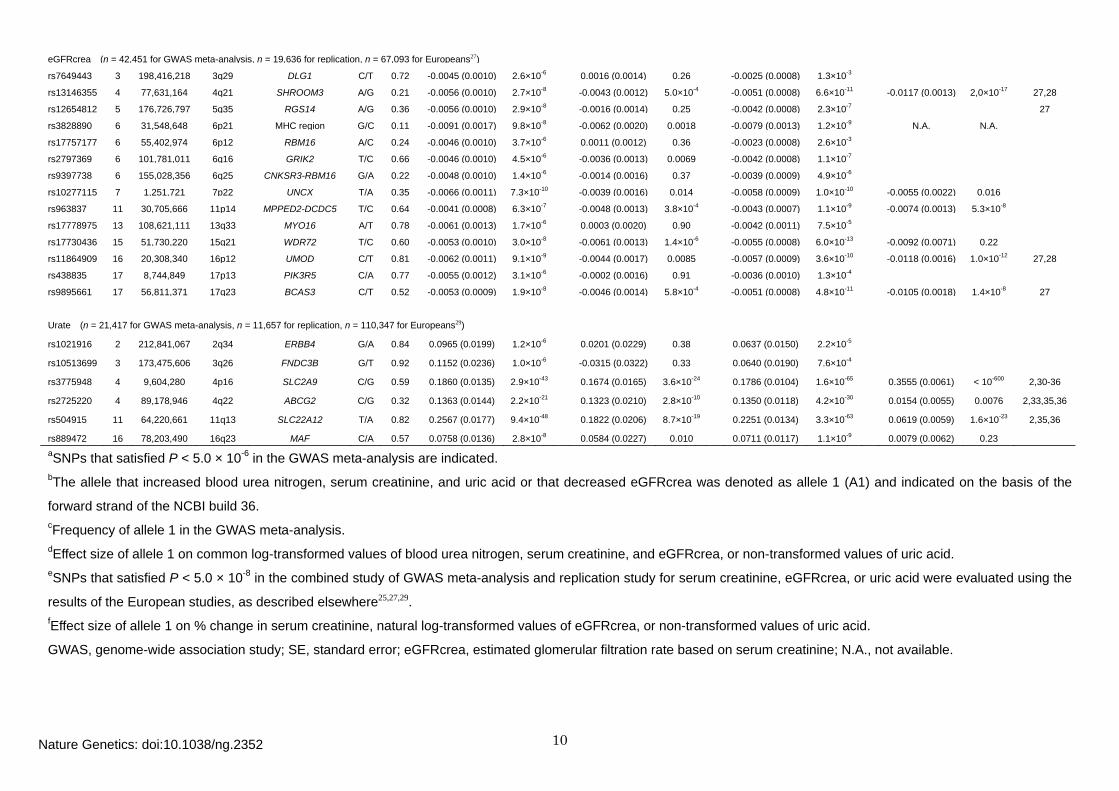
Supplementary Table 5. Results of the GWAS meta-analysis and the replication study for kidney function-related traits.
Supplementary Table 6. Correlations among the kidney function-related traits.
Supplementary Table 7. Associations in the previously reported loci associated with kidney function-related traits.
Supplementary Table 8. Pleiotropic associations of the identified loci among the kidney function-related traits and risk of chronic kidney disease.
Supplementary Figure 1. Quantile-quantile plots of P-values in the GWAS meta-analysis.
Section 2. Supplementary Figures.
Supplementary Figure 2. Regional plots of newly identified loci associated with kidney function-related traits.
I. Descriptions of the participating cohorts.
Section 3. Supplementary Note.
II. Contributing authors participating in the KidneyGen, CKDGen, and GUGC consortia.
Nature Genetics: doi:10.1038/ng.2352
5
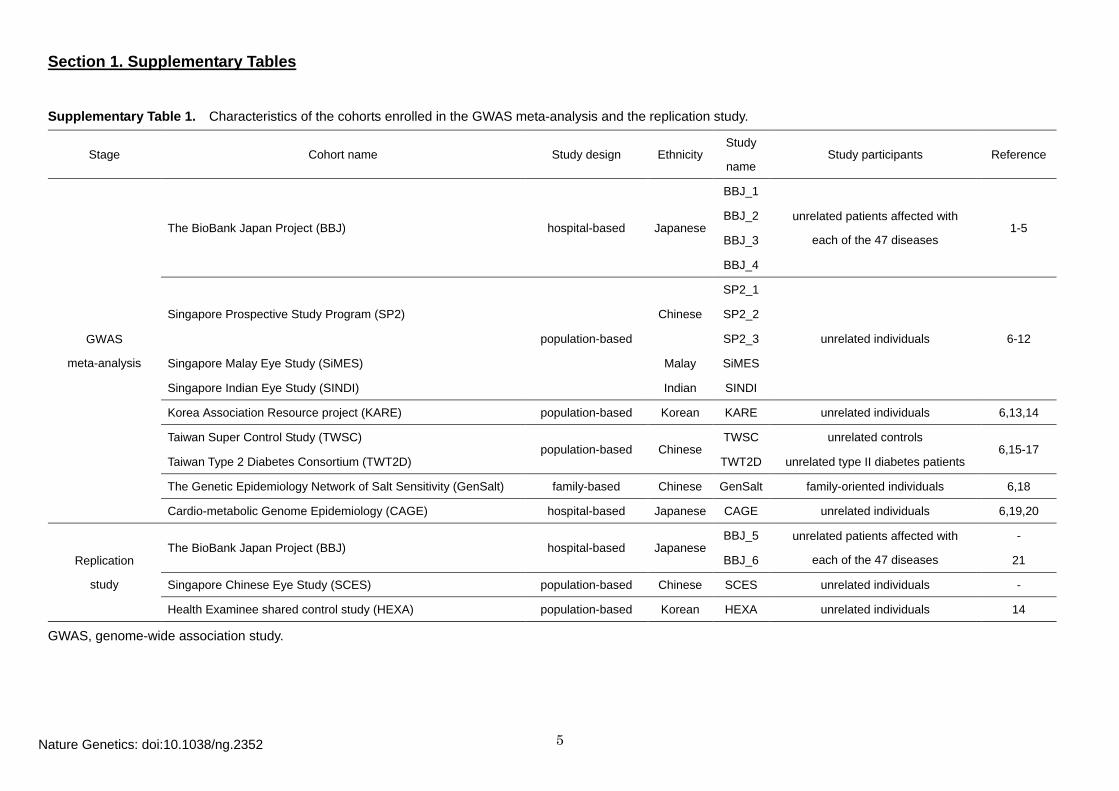
Section 1. Supplementary Tables
Supplementary Table 1. Characteristics of the cohorts enrolled in the GWAS meta-analysis and the replication study.
Stage Cohort name Study design Ethnicity Study
name Study participants Reference
GWAS
meta-analysis
The BioBank Japan Project (BBJ) hospital-based Japanese
BBJ_1
unrelated patients affected with
each of the 47 diseases 1-5
BBJ_2
BBJ_3
BBJ_4
Singapore Prospective Study Program (SP2)
population-based
Chinese
SP2_1
unrelated individuals 6-12
SP2_2
SP2_3
Singapore Malay Eye Study (SiMES) Malay SiMES
Singapore Indian Eye Study (SINDI) Indian SINDI
Korea Association Resource project (KARE) population-based Korean KARE unrelated individuals 6,13,14
Taiwan Super Control Study (TWSC) population-based Chinese
TWSC unrelated controls 6,15-17
Taiwan Type 2 Diabetes Consortium (TWT2D) TWT2D unrelated type II diabetes patients
The Genetic Epidemiology Network of Salt Sensitivity (GenSalt) family-based Chinese GenSalt family-oriented individuals 6,18
Cardio-metabolic Genome Epidemiology (CAGE) hospital-based Japanese CAGE unrelated individuals 6,19,20
Replication
study
The BioBank Japan Project (BBJ) hospital-based Japanese BBJ_5 unrelated patients affected with
each of the 47 diseases
-
BBJ_6 21
Singapore Chinese Eye Study (SCES) population-based Chinese SCES unrelated individuals -
Health Examinee shared control study (HEXA) population-based Korean HEXA unrelated individuals 14
GWAS, genome-wide association study.
Nature Genetics: doi:10.1038/ng.2352
6
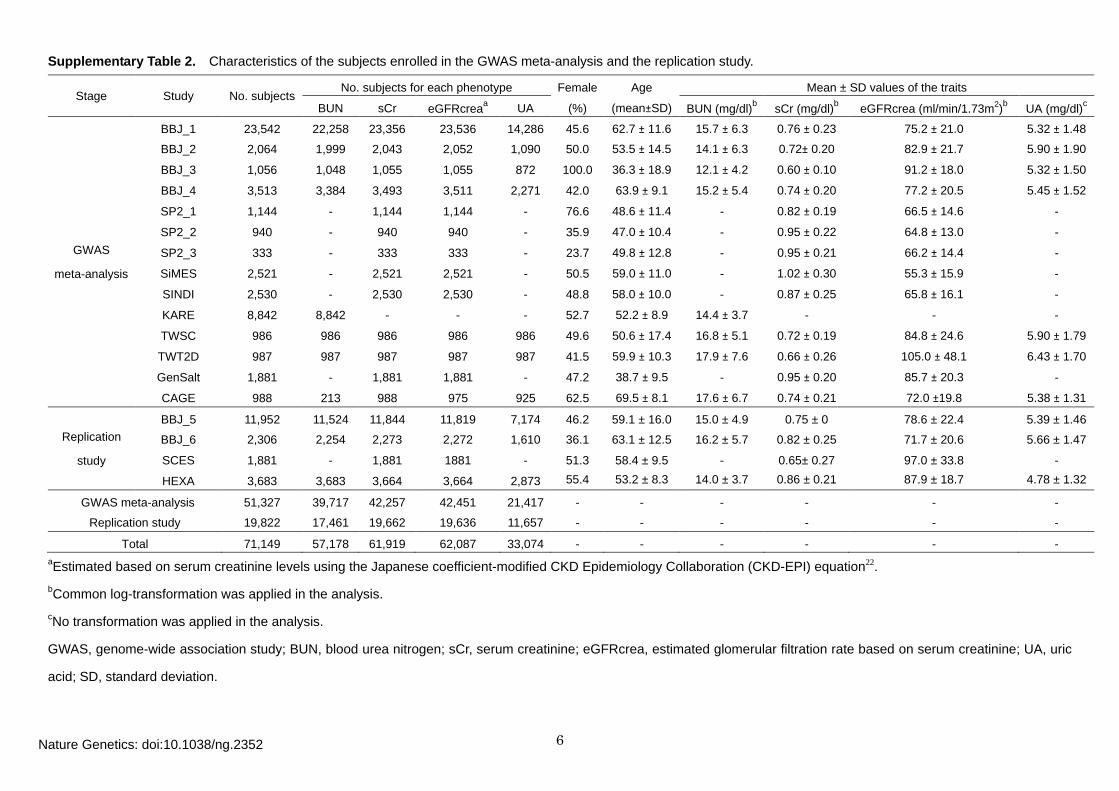
Supplementary Table 2. Characteristics of the subjects enrolled in the GWAS meta-analysis and the replication study.
Stage Study No. subjects No. subjects for each phenotype Female Age Mean ± SD values of the traits
BUN sCr eGFRcreaa UA (%) (mean±SD) BUN (mg/dl)b sCr (mg/dl)b eGFRcrea (ml/min/1.73m2)b UA (mg/dl)c
GWAS
meta-analysis
BBJ_1 23,542 22,258 23,356 23,536 14,286 45.6 62.7 ± 11.6 15.7 ± 6.3 0.76 ± 0.23 75.2 ± 21.0 5.32 ± 1.48
BBJ_2 2,064 1,999 2,043 2,052 1,090 50.0 53.5 ± 14.5 14.1 ± 6.3 0.72± 0.20 82.9 ± 21.7 5.90 ± 1.90
BBJ_3 1,056 1,048 1,055 1,055 872 100.0 36.3 ± 18.9 12.1 ± 4.2 0.60 ± 0.10 91.2 ± 18.0 5.32 ± 1.50
BBJ_4 3,513 3,384 3,493 3,511 2,271 42.0 63.9 ± 9.1 15.2 ± 5.4 0.74 ± 0.20 77.2 ± 20.5 5.45 ± 1.52
SP2_1 1,144 - 1,144 1,144 - 76.6 48.6 ± 11.4 - 0.82 ± 0.19 66.5 ± 14.6 -
SP2_2 940 - 940 940 - 35.9 47.0 ± 10.4 - 0.95 ± 0.22 64.8 ± 13.0 -
SP2_3 333 - 333 333 - 23.7 49.8 ± 12.8 - 0.95 ± 0.21 66.2 ± 14.4 -
SiMES 2,521 - 2,521 2,521 - 50.5 59.0 ± 11.0 - 1.02 ± 0.30 55.3 ± 15.9 -
SINDI 2,530 - 2,530 2,530 - 48.8 58.0 ± 10.0 - 0.87 ± 0.25 65.8 ± 16.1 -
KARE 8,842 8,842 - - - 52.7 52.2 ± 8.9 14.4 ± 3.7 - - -
TWSC 986 986 986 986 986 49.6 50.6 ± 17.4 16.8 ± 5.1 0.72 ± 0.19 84.8 ± 24.6 5.90 ± 1.79
TWT2D 987 987 987 987 987 41.5 59.9 ± 10.3 17.9 ± 7.6 0.66 ± 0.26 105.0 ± 48.1 6.43 ± 1.70
GenSalt 1,881 - 1,881 1,881 - 47.2 38.7 ± 9.5 - 0.95 ± 0.20 85.7 ± 20.3 -
CAGE 988 213 988 975 925 62.5 69.5 ± 8.1 17.6 ± 6.7 0.74 ± 0.21 72.0 ±19.8 5.38 ± 1.31
Replication
study
BBJ_5 11,952 11,524 11,844 11,819 7,174 46.2 59.1 ± 16.0 15.0 ± 4.9 0.75 ± 0
78.6 ± 22.4 5.39 ± 1.46
BBJ_6 2,306 2,254 2,273 2,272 1,610 36.1 63.1 ± 12.5 16.2 ± 5.7 0.82 ± 0.25 71.7 ± 20.6 5.66 ± 1.47
SCES 1,881 - 1,881 1881 - 51.3 58.4 ± 9.5 - 0.65± 0.27 97.0 ± 33.8 -
HEXA 3,683 3,683 3,664 3,664 2,873 55.4 53.2 ± 8.3 14.0 ± 3.7 0.86 ± 0.21 87.9 ± 18.7 4.78 ± 1.32
GWAS meta-analysis 51,327 39,717 42,257 42,451 21,417 - - - - - -
Replication study 19,822 17,461 19,662 19,636 11,657 - - - - - -
Total 71,149 57,178 61,919 62,087 33,074 - - - - - - aEstimated based on serum creatinine levels using the Japanese coefficient-modified CKD Epidemiology Collaboration (CKD-EPI) equation22.
bCommon log-transformation was applied in the analysis. cNo transformation was applied in the analysis.
GWAS, genome-wide association study; BUN, blood urea nitrogen; sCr, serum creatinine; eGFRcrea, estimated glomerular filtration rate based on serum creatinine; UA, uric
acid; SD, standard deviation.
Nature Genetics: doi:10.1038/ng.2352
7
Supplementary Table 3. Genotyping and imputation methods in the GWAS meta-analysis and the replication study.
Study Typing platform
Quality control criteria Imputation method
Sample
call rate
SNP
call rate MAF
HWE
P-value
Imputation
software MAF
Quality
score
Analysis
software Reference panel
GWAS meta-analysis
BBJ_1 Illumina HumanHap610-Quad Genotyping BeadChip > 0.98 > 0.99 > 0.01 > 10-7 MACH v1.0.16 > 0.01 Rsq > 0.5 mach2qtl HapMap Phase II (rel24), JPT+CHB
BBJ_2 Illumina HumanHap550v3 Genotyping BeadChip > 0.98 > 0.99 > 0.01 > 10-7
MACH v1.0.16 > 0.01 Rsq > 0.5 mach2qtl HapMap Phase II (rel24), JPT+CHB
BBJ_3 Illumina HumanHap550v3 Genotyping BeadChip > 0.98 > 0.99 > 0.01 > 10-7
MACH v1.0.16 > 0.01 Rsq > 0.5 mach2qtl HapMap Phase II (rel24), JPT+CHB
BBJ_4 Illumina HumanOmniExpress Genotyping BeadChip > 0.98 > 0.99 > 0.01 > 10-7
MACH v1.0.16 > 0.01 Rsq > 0.5 mach2qtl HapMap Phase II (rel24), JPT+CHB
SP2_1 Illumina HumanHap610-Quad Genotyping BeadChip > 0.95 > 0.95 > 0.01 > 10-4
IMPUTE v0.5.0 > 0.01 score-info >0.5 SNPTEST v2.1.1 HapMap Phase II (rel22), JPT+CHB
SP2_2 Illumina Human1M Genotyping BeadChip > 0.95 > 0.95 > 0.01 > 10-4
IMPUTE v0.5.0 > 0.01 score-info >0.5 SNPTEST v2.1.1 HapMap Phase II (rel22), JPT+CHB
SP2_3 Illumina HumanHap550 Genotyping BeadChip > 0.95 > 0.95 > 0.01 > 10-4
IMPUTE v0.5.0 > 0.01 score-info >0.5 SNPTEST v2.1.1 HapMap Phase II (rel22), JPT+CHB
SiMES Illumina HumanHap610-Quad Genotyping BeadChip > 0.95 > 0.95 > 0.01 > 10-6
IMPUTE v0.5.0 > 0.01 score-info >0.5 SNPTEST v2.1.1 HapMap Phase II (rel22), 4 populations
SINDI Illumina HumanHap610-Quad Genotyping BeadChip > 0.95 > 0.95 > 0.01 > 10-6
IMPUTE v0.5.0 > 0.01 score-info >0.5 SNPTEST v2.1.1 HapMap Phase II (rel22), 4 populations
KARE Affymetrix Genome-wide Human Arrray 5.0 > 0.98 > 0.95 > 0.01 > 10-6
IMPUTE > 0.01 proper-info >0.5 PLINK HapMap Phase II (rel22), JPT+CHB
TWSC Illumina HumanHap550 Genotyping BeadChip - > 0.95 > 0.01 > 10-6
IMPUTE v2 > 0.01 proper-info >0.5 SNPTEST v2 HapMap Phase II (rel22), JPT+CHB
TWT2D Illumina HumanHap550 Genotyping BeadChip - > 0.95 > 0.01 > 10-6
IMPUTE v2 > 0.01 proper-info >0.5 SNPTEST v2 HapMap Phase II (rel22), JPT+CHB
GenSalt Affymetrix Genome-wide Human Arrray 6.0 - > 0.75 > 0.01 > 10-7
MACH 1.0.16 > 0.01 Rsq > 0.5 R v2.10.1 HapMap Phase II (rel22), JPT+CHB
CAGE Illumina HumanHap610-Quad Genotyping BeadChip
Illumina HumanHap550 Genotyping BeadChip > 0.90 > 0.95 > 0.01 > 10-6 BEAGLE v3.0.4 > 0.01 Rsq > 0.5 PLINK v1.06 HapMap Phase II (rel24), JPT+CHB
Replication study
BBJ_5 Illumina HumanOmniExpress Genotyping BeadChip > 0.98 > 0.99 > 0.01 > 10-7
MACH v1.0.16 > 0.01 Rsq > 0.5 mach2qtl HapMap Phase II (rel24), JPT+CHB
BBJ_6 Oligonucleotide array of Perlegen Sciences > 0.95 > 0.95 > 0.01 > 10-6
MACH v1.0.16 > 0.01 Rsq > 0.5 mach2qtl HapMap Phase II (rel24), JPT+CHB
SCES Illumina HumanHap610-Quad Genotyping BeadChip > 0.95 > 0.95 > 0.01 > 10-6
IMPUTE v0.5.0 > 0.01 score-info >0.5 SNPTEST v2.1.1 HapMap Phase II (rel22), JPT+CHB
HEXA Affymetrix Genome-wide Human Arrray 6.0 > 0.98 > 0.95 > 0.01 > 10-6
IMPUTE > 0.01 proper-info >0.5 PLINK HapMap Phase II (rel22), JPT+CHB
GWAS, genome-wide association study; MAF, minor allele frequency; HWE, Hardy-Weinberg equilibrium; JPT, Japanese; CHB, Han Chinese.
Nature Genetics: doi:10.1038/ng.2352
8
Supplementary Table 4. No. SNPs and inflation factors in the GWAS meta-analysis.
GWAS No. SNPs Inflation factor (λGC)a
BUN sCr eGFRcrea UA BUN sCr eGFRcrea UA
BBJ_1 2,263,308 2,263,308 2,263,308 2,263,308 1.042 1.065 1.062 1.028
BBJ_2 2,220,799 2,220,799 2,220,799 2,220,799
1.000 1.033 1.031 1.010
BBJ_3 2,220,799 2,220,799 2,220,799 2,220,799
1.014 1.003 1.012 0.994
BBJ_4 2,283,889 2,283,889 2,283,889 2,283,889
1.012 1.022 1.024 1.014
SP2_1 - 2,248,237 2,248,254 -
- 0.997 0.999 -
SP2_2 - 1,966,259 1,966,292 -
- 1.018 1.019 -
SP2_3 - 2,218,604 2,218,567 -
- 0.992 0.991 -
SiMES - 1,982,211 1,982,204 -
- 0.998 0.998 -
SINDI - 1,962,959 1,962,961 -
- 1.013 1.013 -
KARE 1,563,137 - - -
1.027 - - -
TWSC 2,159,680 2,159,647 2,159,672 2,159,674
1.002 1.008 1.004 0.993
TWT2D 2,159,636 2,159,593 2,159,608 2,159,630
1.003 1.005 0.999 1.009
GenSalt - 1,060,441b 1,060,431b -
- 1.031 1.017 -
CAGE 1,962,742 1,962,742 1,962,742 1,962,742 0.998 0.995 0.996 1.004
Meta-analysisc 2,281,523 2,353,587 2,353,587 2,278,301 1.060 1.072 1.079 1.031
aGenomic control corrections23,24 were applied to each of the GWAS before the meta-analysis, and were applied again to the results of the meta-analysis. For the GWAS of
which λGC were less than 1.00, genomic control corrections were not applied. bWe excluded SNPs in which generalized linear mixed models accounting for the family structures did not converge. cSNPs that were evaluated in three or more GWAS were enrolled in the meta-analysis.
GWAS, genome-wide association study; BUN, blood urea nitrogen; sCr, serum creatinine; eGFRcrea, estimated glomerular filtration rate based on serum creatinine; UA, uric
acid.
Nature Genetics: doi:10.1038/ng.2352
9
Supplementary Table 5. Results of the GWAS meta-analysis and the replication study for kidney function-related traits.
rsIDa Chr Position
(bp) Band Genes
A1/
A2b
Associations in East Asians
Associations in
Ref. Freq.c
GWAS Meta-analysis
Replication study
Combined study
Europeanse
Beta (SE)d P
Beta (SE)d P
Beta (SE)d P
Beta (SE)f P
Blood urea nitrogen (n = 39,717 for GWAS meta-analysis, n = 17,461 for replication)
rs2049805 1 153,461,604 1q22 MTX1-GBA T/C 0.17 0.0072 (0.0013) 1.9×10⁻⁸
0.0072 (0.0017) 2.3×10⁻⁵
0.0072 (0.0010) 1.8×10⁻¹²
rs11123170 2 113,695,411 2q13 PAX8 G/C 0.35 0.0059 (0.0010) 2.4×10⁻⁹
0.0035 (0.0014) 0.014
0.0051 (0.0008) 3.3×10⁻¹⁰
rs13069000 3 66,881,640 3p14 LRIG1-KBTBD8 G/C 0.17 0.0097 (0.0013) 3.6×10⁻¹⁴
0.0085 (0.0017) 4.8×10⁻⁷
0.0093 (0.0010) 1.4×10⁻¹⁹
2
rs16853722 3 170,633,326 3q26 MECOM C/T 0.29 0.0059 (0.0010) 1.3×10⁻⁸
0.0072 (0.0014) 2.7×10⁻⁷
0.0064 (0.0008) 2.7×10⁻¹⁴
rs10937329 3 189,196,412 3q27 BCL6-LPP T/A 0.69 0.0103 (0.0010) 8.4×10⁻²⁴
0.0092 (0.0017) 1.0×10⁻⁷
0.0100 (0.0009) 8.8×10⁻³⁰
2
rs17663555 5 72,467,792 5q13 TMEM171-TMEM174 G/C 0.34 0.0046 (0.0010) 3.9×10⁻⁶
0.0026 (0.0015) 0.093
0.0040 (0.0008) 1.8×10⁻⁶
rs2206271 6 50,893,967 6p12 TFAP2B A/T 0.32 0.0066 (0.0014) 1.3×10⁻⁶
0.0039 (0.0016) 0.016
0.0055 (0.0010) 1.6×10⁻⁷
rs1936800 6 127,477,757 6q22 RSPO3 T/C 0.50 0.0049 (0.0009) 1.7×10⁻⁷
0.0056 (0.0013) 1.7×10⁻⁵
0.0052 (0.0008) 1.2×10⁻¹¹
14
rs10275044 7 1,240,371 7p22 UNCX T/A 0.34 0.0079 (0.0015) 1.3×10⁻⁷
0.0053 (0.0019) 0.0056
0.0069 (0.0012) 4.3×10⁻⁹
rs17169194 7 7,647,222 7p21 RPA3 A/C 0.89 0.0088 (0.0019) 1.9×10⁻⁶
0.0003 (0.0024) 0.92
0.0055 (0.0015) 1.4×10⁻⁴
rs10984991 9 122,513,063 9q33 MEGF9 A/G 0.11 0.0089 (0.0018) 7.1×10⁻⁷
-0.0011 (0.0023) 0.62
0.0051 (0.0014) 3.0×10⁻⁴
rs10767873 11 30,725,254 11p14 MPPED2-DCDC5 C/T 0.69 0.0068 (0.0010) 7.0×10⁻¹¹
0.0068 (0.0014) 1.4×10⁻⁶
0.0068 (0.0008) 4.5×10⁻¹⁶
rs2074356 12 111,129,784 12q24.13 C12orf51 A/G 0.23 0.0064 (0.0013) 4.4×10⁻⁷
0.0063 (0.0020) 0.0012
0.0064 (0.0011) 1.8×10⁻⁹
rs17730281 15 51,695,240 15q21 WDR72 G/A 0.58 0.0054 (0.0010) 1.5×10⁻⁸
0.0046 (0.0013) 4.5×10⁻⁴
0.0051 (0.0008) 3.0×10⁻¹¹
rs11868441 17 56,594,003 17q23 BCAS3 G/A 0.75 0.0062 (0.0013) 2.1×10⁻⁶
0.0055 (0.0015) 2.2×10⁻⁴
0.0059 (0.0010) 2.1×10⁻⁹
rs7227483 18 41,441,128 18q12 SLC14A2 G/A 0.80 0.0086 (0.0012) 1.0×10⁻¹²
0.0078 (0.0016) 9.6×10⁻⁷
0.0083 (0.0010) 6.7×10⁻¹⁸
2
rs6026584 20 56,902,468 20q13 GNAS T/C 0.32 0.0055 (0.0011) 7.1×10⁻⁷
0.0046 (0.0016) 0.0033
0.0052 (0.0009) 8.8×10⁻⁹
Serum creatinine (n = 42,257 for GWAS meta-analysis, n = 19,662 for replication, n = 23,812 for Europeans25)
rs13146355 4 77,631,164 4q21 SHROOM3 A/G 0.21 0.0052 (0.0009) 3.6×10⁻⁹
0.0039 (0.0011) 5.3×10⁻⁴
0.0047 (0.0007) 9.4×10⁻¹²
0.0031 (0.0006) 7.7×10⁻⁷ 25
rs12654812 5 176,726,797 5q35 RGS14 A/G 0.36 0.0049 (0.0009) 3.2×10⁻⁸
0.0011 (0.0013) 0.37
0.0036 (0.0007) 4.8×10⁻⁷
rs3828890 6 31,548,648 6p21 MHC region G/C 0.11 0.0074 (0.0015) 5.3×10⁻⁷
0.0060 (0.0018) 0.0011
0.0069 (0.0012) 2.6×10⁻⁹
N.A. N.A.
rs17757177 6 55,402,974 6p12 RBM16 A/C 0.24 0.0041 (0.0009) 1.8×10⁻⁶
-0.0011 (0.0011) 0.35
0.0022 (0.0007) 1.2×10⁻³
rs4870304 6 155,033,535 6q25 CNKSR3-RBM16 G/A 0.29 0.0038 (0.0008) 9.1×10⁻⁷
-0.0002 (0.0013) 0.91
0.0028 (0.0007) 2.6×10⁻⁵
rs10277115 7 1,251,721 7p22 UNCX T/A 0.35 0.0060 (0.0009) 2.2×10⁻¹⁰
0.0034 (0.0015) 0.022
0.0052 (0.0008) 4.6×10⁻¹¹
0.0011 (0.0013) 0.41
rs963837 11 30,705,666 11p14 MPPED2-DCDC5 T/C 0.64 0.0036 (0.0007) 7.5×10⁻⁷
0.0040 (0.0012) 0.0013
0.0037 (0.0006) 3.4×10⁻⁹
0.0007 (0.0006) 0.25
rs671 12 110,726,149 12q24.2 ALDH2 A/G 0.27 0.0047 (0.0009) 5.0×10⁻⁸
0.0040 (0.0013) 0.0015
0.0045 (0.0007) 2.8×10⁻¹⁰
N.A. N.A.
rs17778975 13 108,621,111 13q33 MYO16 A/T 0.78 0.0051 (0.0011) 4.9×10⁻⁶
-0.0003 (0.0018) 0.88
0.0036 (0.0010) 1.6×10⁻⁴
rs2470171 15 49,453,614 15q21 GLDN T/C 0.42 0.0035 (0.0008) 4.4×10⁻⁶
0.0004 (0.0010) 0.68
0.0024 (0.0006) 8.8×10⁻⁵
rs17730436 15 51,730,220 15q21 WDR72 T/C 0.60 0.0046 (0.0008) 2.4×10⁻⁸
0.0058 (0.0012) 7.3×10⁻⁷
0.0050 (0.0007) 1.2×10⁻¹³
N.A. N.A. 2
rs11864909 16 20,308,340 16p12 UMOD C/T 0.81 0.0055 (0.0009) 4.8×10⁻⁹
0.0044 (0.0016) 0.0050
0.0052 (0.0008) 1.1×10⁻¹⁰
0.0040 (0.0009) 5.6×10⁻⁶ 26
rs181533 17 8,750,557 17p13 PIK3R5 T/C 0.79 0.0056 (0.0012) 1.3×10⁻⁶
0.0008 (0.0016) 0.63
0.0039 (0.0009) 2.8×10⁻⁵
rs9895661 17 56,811,371 17q23 BCAS3 C/T 0.52 0.0047 (0.0008) 1.1×10⁻⁸
0.0039 (0.0012) 0.0018
0.0045 (0.0007) 7.4×10⁻¹¹
0.0046 (0.0009) 2.4×10⁻⁶ 25
Nature Genetics: doi:10.1038/ng.2352
10
eGFRcrea (n = 42,451 for GWAS meta-analysis, n = 19,636 for replication, n = 67,093 for Europeans27)
rs7649443 3 198,416,218 3q29 DLG1 C/T 0.72 -0.0045 (0.0010) 2.6×10⁻⁶
0.0016 (0.0014) 0.26
-0.0025 (0.0008) 1.3×10⁻³
rs13146355 4 77,631,164 4q21 SHROOM3 A/G 0.21 -0.0056 (0.0010) 2.7×10⁻⁸
-0.0043 (0.0012) 5.0×10⁻⁴
-0.0051 (0.0008) 6.6×10⁻¹¹
-0.0117 (0.0013) 2,0×10⁻¹⁷ 27,28
rs12654812 5 176,726,797 5q35 RGS14 A/G 0.36 -0.0056 (0.0010) 2.9×10⁻⁸
-0.0016 (0.0014) 0.25
-0.0042 (0.0008) 2.3×10⁻⁷
27
rs3828890 6 31,548,648 6p21 MHC region G/C 0.11 -0.0091 (0.0017) 9.8×10⁻⁸ -0.0062 (0.0020) 0.0018
-0.0079 (0.0013) 1.2×10⁻⁹
N.A. N.A.
rs17757177 6 55,402,974 6p12 RBM16 A/C 0.24 -0.0046 (0.0010) 3.7×10⁻⁶
0.0011 (0.0012) 0.36
-0.0023 (0.0008) 2.6×10⁻³
rs2797369 6 101,781,011 6q16 GRIK2 T/C 0.66 -0.0046 (0.0010) 4.5×10⁻⁶
-0.0036 (0.0013) 0.0069
-0.0042 (0.0008) 1.1×10⁻⁷
rs9397738 6 155,028,356 6q25 CNKSR3-RBM16 G/A 0.22 -0.0048 (0.0010) 1.4×10⁻⁶
-0.0014 (0.0016) 0.37
-0.0039 (0.0009) 4.9×10⁻⁶
rs10277115 7 1,251,721 7p22 UNCX T/A 0.35 -0.0066 (0.0011) 7.3×10⁻¹⁰ -0.0039 (0.0016) 0.014
-0.0058 (0.0009) 1.0×10⁻¹⁰
-0.0055 (0.0022) 0.016
rs963837 11 30,705,666 11p14 MPPED2-DCDC5 T/C 0.64 -0.0041 (0.0008) 6.3×10⁻⁷ -0.0048 (0.0013) 3.8×10⁻⁴
-0.0043 (0.0007) 1.1×10⁻⁹
-0.0074 (0.0013) 5.3×10⁻⁸
rs17778975 13 108,621,111 13q33 MYO16 A/T 0.78 -0.0061 (0.0013) 1.7×10⁻⁶
0.0003 (0.0020) 0.90
-0.0042 (0.0011) 7.5×10⁻⁵
rs17730436 15 51,730,220 15q21 WDR72 T/C 0.60 -0.0053 (0.0010) 3.0×10⁻⁸
-0.0061 (0.0013) 1.4×10⁻⁶
-0.0055 (0.0008) 6.0×10⁻¹³
-0.0092 (0.0071) 0.22
rs11864909 16 20,308,340 16p12 UMOD C/T 0.81 -0.0062 (0.0011) 9.1×10⁻⁹
-0.0044 (0.0017) 0.0085
-0.0057 (0.0009) 3.6×10⁻¹⁰
-0.0118 (0.0016) 1.0×10⁻¹² 27,28
rs438835 17 8,744,849 17p13 PIK3R5 C/A 0.77 -0.0055 (0.0012) 3.1×10⁻⁶
-0.0002 (0.0016) 0.91
-0.0036 (0.0010) 1.3×10⁻⁴
rs9895661 17 56,811,371 17q23 BCAS3 C/T 0.52 -0.0053 (0.0009) 1.9×10⁻⁸
-0.0046 (0.0014) 5.8×10⁻⁴
-0.0051 (0.0008) 4.8×10⁻¹¹
-0.0105 (0.0018) 1.4×10⁻⁸ 27
Urate (n = 21,417 for GWAS meta-analysis, n = 11,657 for replication, n = 110,347 for Europeans29)
rs1021916 2 212,841,067 2q34 ERBB4 G/A 0.84 0.0965 (0.0199) 1.2×10⁻⁶
0.0201 (0.0229) 0.38
0.0637 (0.0150) 2.2×10⁻⁵
rs10513699 3 173,475,606 3q26 FNDC3B G/T 0.92 0.1152 (0.0236) 1.0×10⁻⁶
-0.0315 (0.0322) 0.33
0.0640 (0.0190) 7.6×10⁻⁴
rs3775948 4 9,604,280 4p16 SLC2A9 C/G 0.59 0.1860 (0.0135) 2.9×10-43
0.1674 (0.0165) 3.6×10⁻²⁴
0.1786 (0.0104) 1.6×10-65
0.3555 (0.0061) < 10-600 2,30-36
rs2725220 4 89,178,946 4q22 ABCG2 C/G 0.32 0.1363 (0.0144) 2.2×10⁻²¹
0.1323 (0.0210) 2.8×10⁻¹⁰
0.1350 (0.0118) 4.2×10⁻³⁰
0.0154 (0.0055) 0.0076 2,33,35,36
rs504915 11 64,220,661 11q13 SLC22A12 T/A 0.82 0.2567 (0.0177) 9.4×10-48
0.1822 (0.0206) 8.7×10⁻¹⁹
0.2251 (0.0134) 3.3×10-63
0.0619 (0.0059) 1.6×10⁻²³ 2,35,36
rs889472 16 78,203,490 16q23 MAF C/A 0.57 0.0758 (0.0136) 2.8×10⁻⁸ 0.0584 (0.0227) 0.010
0.0711 (0.0117) 1.1×10⁻⁹
0.0079 (0.0062) 0.23 aSNPs that satisfied P < 5.0 × 10⁻⁶ in the GWAS meta-analysis are indicated. bThe allele that increased blood urea nitrogen, serum creatinine, and uric acid or that decreased eGFRcrea was denoted as allele 1 (A1) and indicated on the basis of the
forward strand of the NCBI build 36. cFrequency of allele 1 in the GWAS meta-analysis. dEffect size of allele 1 on common log-transformed values of blood urea nitrogen, serum creatinine, and eGFRcrea, or non-transformed values of uric acid. eSNPs that satisfied P < 5.0 × 10⁻⁸ in the combined study of GWAS meta-analysis and replication study for serum creatinine, eGFRcrea, or uric acid were evaluated using the
results of the European studies, as described elsewhere25,27,29. fEffect size of allele 1 on % change in serum creatinine, natural log-transformed values of eGFRcrea, or non-transformed values of uric acid.
GWAS, genome-wide association study; SE, standard error; eGFRcrea, estimated glomerular filtration rate based on serum creatinine; N.A., not available.
Nature Genetics: doi:10.1038/ng.2352
11
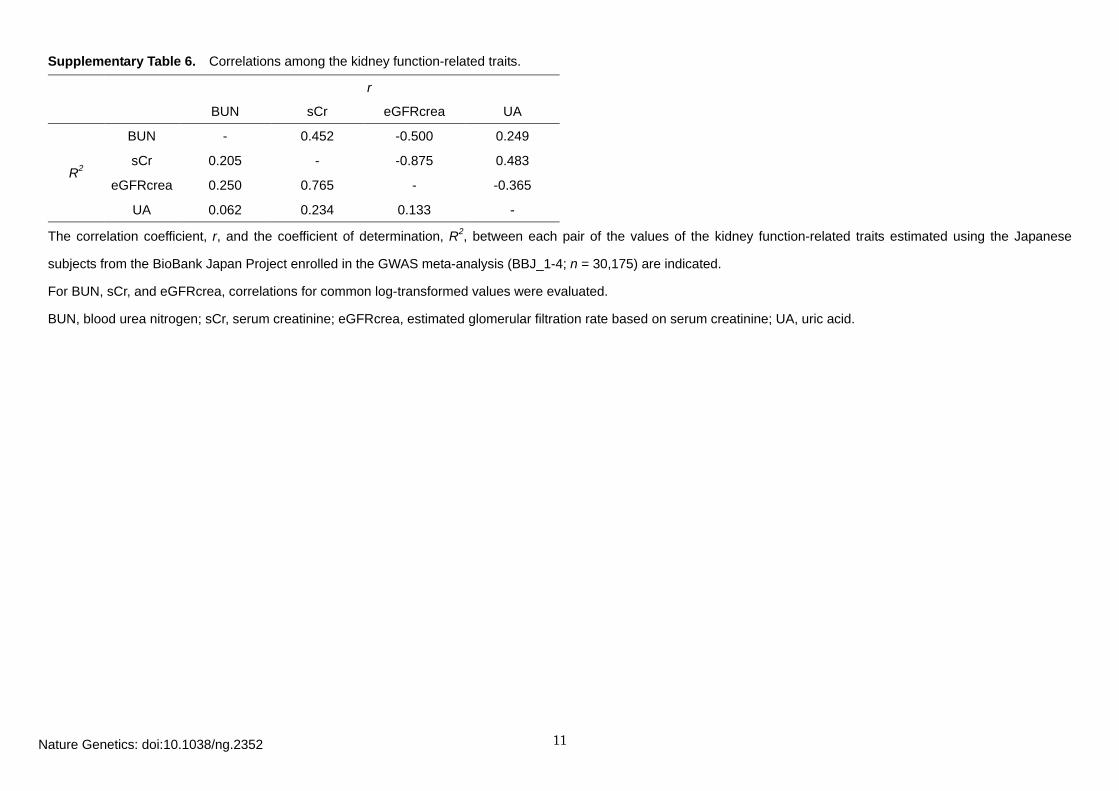
Supplementary Table 6. Correlations among the kidney function-related traits.
r
BUN sCr eGFRcrea UA
R2
BUN - 0.452 -0.500 0.249
sCr 0.205 - -0.875 0.483
eGFRcrea 0.250 0.765 - -0.365
UA 0.062 0.234 0.133 -
The correlation coefficient, r, and the coefficient of determination, R2, between each pair of the values of the kidney function-related traits estimated using the Japanese
subjects from the BioBank Japan Project enrolled in the GWAS meta-analysis (BBJ_1-4; n = 30,175) are indicated.
For BUN, sCr, and eGFRcrea, correlations for common log-transformed values were evaluated.
BUN, blood urea nitrogen; sCr, serum creatinine; eGFRcrea, estimated glomerular filtration rate based on serum creatinine; UA, uric acid.
Nature Genetics: doi:10.1038/ng.2352
12
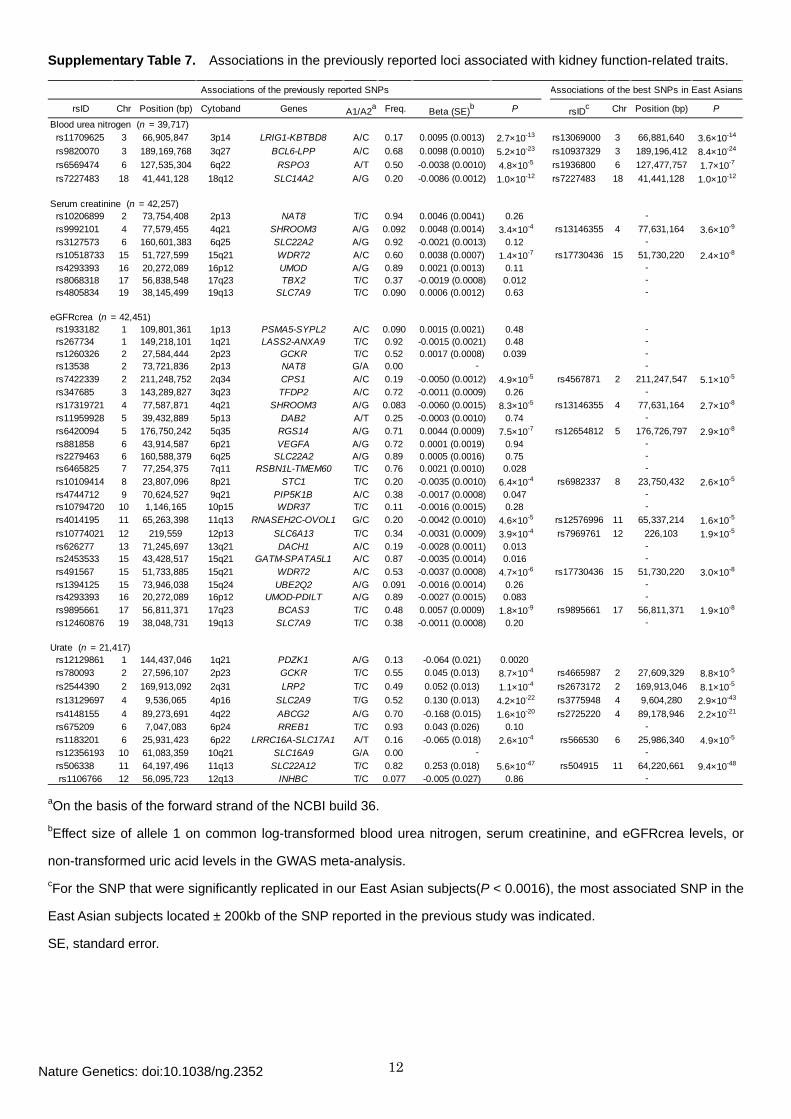
Supplementary Table 7. Associations in the previously reported loci associated with kidney function-related traits.
rsID Chr Position (bp) Cytoband Genes A1/A2a Freq. Beta (SE)b P rsIDc Chr Position (bp) P
Blood urea nitrogen (n = 39,717) rs11709625 3 66,905,847 3p14 LRIG1-KBTBD8 A/C 0.17 0.0095 (0.0013) 2.7×10⁻¹³ rs13069000 3 66,881,640 3.6×10⁻¹⁴
rs9820070 3 189,169,768 3q27 BCL6-LPP A/C 0.68 0.0098 (0.0010) 5.2×10⁻²³ rs10937329 3 189,196,412 8.4×10⁻²⁴
rs6569474 6 127,535,304 6q22 RSPO3 A/T 0.50 -0.0038 (0.0010) 4.8×10⁻⁵ rs1936800 6 127,477,757 1.7×10⁻⁷
rs7227483 18 41,441,128 18q12 SLC14A2 A/G 0.20 -0.0086 (0.0012) 1.0×10⁻¹² rs7227483 18 41,441,128 1.0×10⁻¹²
Serum creatinine (n = 42,257) rs10206899 2 73,754,408 2p13 NAT8 T/C 0.94 0.0046 (0.0041) 0.26 rs9992101 4 77,579,455 4q21 SHROOM3 A/G 0.092 0.0048 (0.0014) 3.4×10⁻⁴ rs13146355 4 77,631,164 3.6×10⁻⁹
rs3127573 6 160,601,383 6q25 SLC22A2 A/G 0.92 -0.0021 (0.0013) 0.12 rs10518733 15 51,727,599 15q21 WDR72 A/C 0.60 0.0038 (0.0007) 1.4×10⁻⁷ rs17730436 15 51,730,220 2.4×10⁻⁸
rs4293393 16 20,272,089 16p12 UMOD A/G 0.89 0.0021 (0.0013) 0.11 rs8068318 17 56,838,548 17q23 TBX2 T/C 0.37 -0.0019 (0.0008) 0.012 rs4805834 19 38,145,499 19q13 SLC7A9 T/C 0.090 0.0006 (0.0012) 0.63
eGFRcrea (n = 42,451) rs1933182 1 109,801,361 1p13 PSMA5-SYPL2 A/C 0.090 0.0015 (0.0021) 0.48 rs267734 1 149,218,101 1q21 LASS2-ANXA9 T/C 0.92 -0.0015 (0.0021) 0.48 rs1260326 2 27,584,444 2p23 GCKR T/C 0.52 0.0017 (0.0008) 0.039 rs13538 2 73,721,836 2p13 NAT8 G/A 0.00 rs7422339 2 211,248,752 2q34 CPS1 A/C 0.19 -0.0050 (0.0012) 4.9×10⁻⁵ rs4567871 2 211,247,547 5.1×10⁻⁵
rs347685 3 143,289,827 3q23 TFDP2 A/C 0.72 -0.0011 (0.0009) 0.26 rs17319721 4 77,587,871 4q21 SHROOM3 A/G 0.083 -0.0060 (0.0015) 8.3×10⁻⁵ rs13146355 4 77,631,164 2.7×10⁻⁸
rs11959928 5 39,432,889 5p13 DAB2 A/T 0.25 -0.0003 (0.0010) 0.74 rs6420094 5 176,750,242 5q35 RGS14 A/G 0.71 0.0044 (0.0009) 7.5×10⁻⁷ rs12654812 5 176,726,797 2.9×10⁻⁸
rs881858 6 43,914,587 6p21 VEGFA A/G 0.72 0.0001 (0.0019) 0.94 rs2279463 6 160,588,379 6q25 SLC22A2 A/G 0.89 0.0005 (0.0016) 0.75 rs6465825 7 77,254,375 7q11 RSBN1L-TMEM60 T/C 0.76 0.0021 (0.0010) 0.028 rs10109414 8 23,807,096 8p21 STC1 T/C 0.20 -0.0035 (0.0010) 6.4×10⁻⁴ rs6982337 8 23,750,432 2.6×10⁻⁵
rs4744712 9 70,624,527 9q21 PIP5K1B A/C 0.38 -0.0017 (0.0008) 0.047 rs10794720 10 1,146,165 10p15 WDR37 T/C 0.11 -0.0016 (0.0015) 0.28 rs4014195 11 65,263,398 11q13 RNASEH2C-OVOL1 G/C 0.20 -0.0042 (0.0010) 4.6×10⁻⁵ rs12576996 11 65,337,214 1.6×10⁻⁵
rs10774021 12 219,559 12p13 SLC6A13 T/C 0.34 -0.0031 (0.0009) 3.9×10⁻⁴ rs7969761 12 226,103 1.9×10⁻⁵
rs626277 13 71,245,697 13q21 DACH1 A/C 0.19 -0.0028 (0.0011) 0.013 rs2453533 15 43,428,517 15q21 GATM-SPATA5L1 A/C 0.87 -0.0035 (0.0014) 0.016 rs491567 15 51,733,885 15q21 WDR72 A/C 0.53 -0.0037 (0.0008) 4.7×10⁻⁶ rs17730436 15 51,730,220 3.0×10⁻⁸
rs1394125 15 73,946,038 15q24 UBE2Q2 A/G 0.091 -0.0016 (0.0014) 0.26 rs4293393 16 20,272,089 16p12 UMOD-PDILT A/G 0.89 -0.0027 (0.0015) 0.083 rs9895661 17 56,811,371 17q23 BCAS3 T/C 0.48 0.0057 (0.0009) 1.8×10⁻⁹ rs9895661 17 56,811,371 1.9×10⁻⁸
rs12460876 19 38,048,731 19q13 SLC7A9 T/C 0.38 -0.0011 (0.0008) 0.20
Urate (n = 21,417) rs12129861 1 144,437,046 1q21 PDZK1 A/G 0.13 -0.064 (0.021) 0.0020 rs780093 2 27,596,107 2p23 GCKR T/C 0.55 0.045 (0.013) 8.7×10⁻⁴ rs4665987 2 27,609,329 8.8×10⁻⁵
rs2544390 2 169,913,092 2q31 LRP2 T/C 0.49 0.052 (0.013) 1.1×10⁻⁴ rs2673172 2 169,913,046 8.1×10⁻⁵
rs13129697 4 9,536,065 4p16 SLC2A9 T/G 0.52 0.130 (0.013) 4.2×10⁻²² rs3775948 4 9,604,280 2.9×10-43
rs4148155 4 89,273,691 4q22 ABCG2 A/G 0.70 -0.168 (0.015) 1.6×10⁻²⁰ rs2725220 4 89,178,946 2.2×10⁻²¹
rs675209 6 7,047,083 6p24 RREB1 T/C 0.93 0.043 (0.026) 0.10 rs1183201 6 25,931,423 6p22 LRRC16A-SLC17A1 A/T 0.16 -0.065 (0.018) 2.6×10⁻⁴ rs566530 6 25,986,340 4.9×10⁻⁵
rs12356193 10 61,083,359 10q21 SLC16A9 G/A 0.00 rs506338 11 64,197,496 11q13 SLC22A12 T/C 0.82 0.253 (0.018) 5.6×10-47 rs504915 11 64,220,661 9.4×10-48
rs1106766 12 56,095,723 12q13 INHBC T/C 0.077 -0.005 (0.027) 0.86
Associations of the previously reported SNPs Associations of the best SNPs in East Asians
-
-
---
----
-
-
-
-
-
-
-
-
--
--
-
---
-
aOn the basis of the forward strand of the NCBI build 36. bEffect size of allele 1 on common log-transformed blood urea nitrogen, serum creatinine, and eGFRcrea levels, or
non-transformed uric acid levels in the GWAS meta-analysis. cFor the SNP that were significantly replicated in our East Asian subjects(P < 0.0016), the most associated SNP in the
East Asian subjects located ± 200kb of the SNP reported in the previous study was indicated.
SE, standard error.
Nature Genetics: doi:10.1038/ng.2352
13
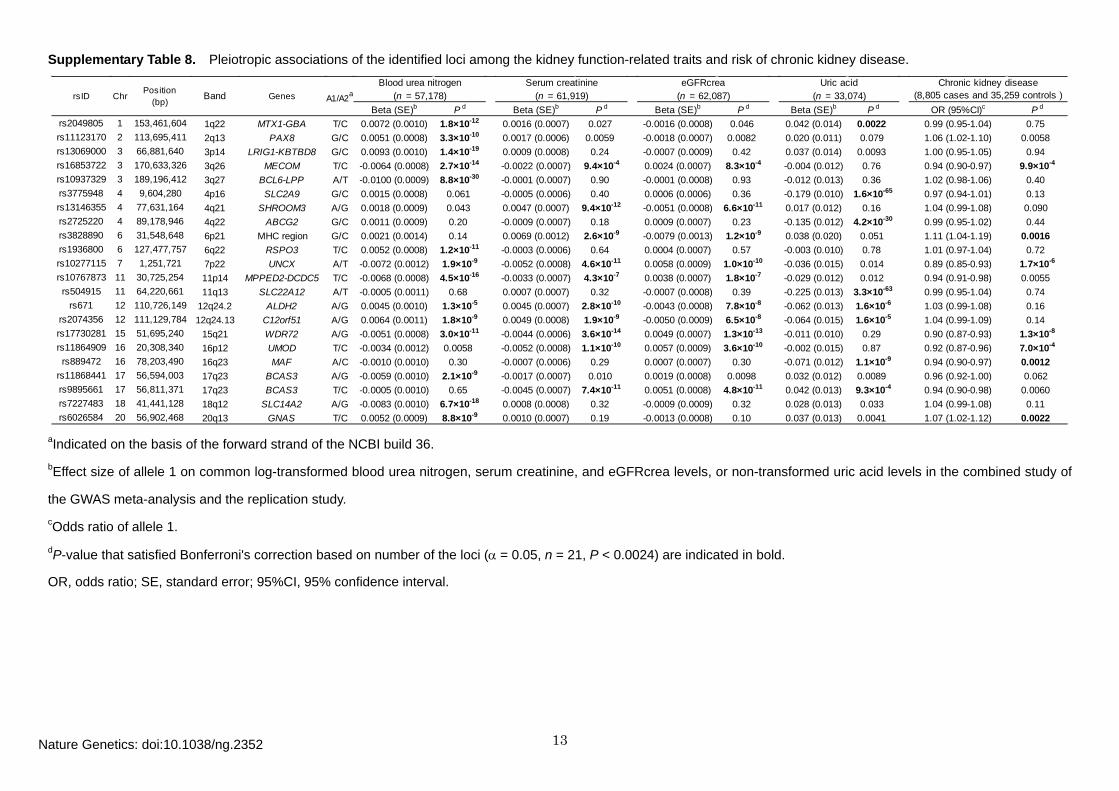
Supplementary Table 8. Pleiotropic associations of the identified loci among the kidney function-related traits and risk of chronic kidney disease.
Beta (SE)b P d Beta (SE)b P d Beta (SE)b P d Beta (SE)b P d OR (95%CI)c P d
rs2049805 1 153,461,604 1q22 MTX1-GBA T/C 0.0072 (0.0010) 1.8×10⁻¹² 0.0016 (0.0007) 0.027 -0.0016 (0.0008) 0.046 0.042 (0.014) 0.0022 0.99 (0.95-1.04) 0.75rs11123170 2 113,695,411 2q13 PAX8 G/C 0.0051 (0.0008) 3.3×10⁻¹⁰ 0.0017 (0.0006) 0.0059 -0.0018 (0.0007) 0.0082 0.020 (0.011) 0.079 1.06 (1.02-1.10) 0.0058rs13069000 3 66,881,640 3p14 LRIG1-KBTBD8 G/C 0.0093 (0.0010) 1.4×10⁻¹⁹ 0.0009 (0.0008) 0.24 -0.0007 (0.0009) 0.42 0.037 (0.014) 0.0093 1.00 (0.95-1.05) 0.94rs16853722 3 170,633,326 3q26 MECOM T/C -0.0064 (0.0008) 2.7×10⁻¹⁴ -0.0022 (0.0007) 9.4×10⁻⁴ 0.0024 (0.0007) 8.3×10⁻⁴ -0.004 (0.012) 0.76 0.94 (0.90-0.97) 9.9×10⁻⁴
rs10937329 3 189,196,412 3q27 BCL6-LPP A/T -0.0100 (0.0009) 8.8×10⁻³⁰ -0.0001 (0.0007) 0.90 -0.0001 (0.0008) 0.93 -0.012 (0.013) 0.36 1.02 (0.98-1.06) 0.40rs3775948 4 9,604,280 4p16 SLC2A9 G/C 0.0015 (0.0008) 0.061 -0.0005 (0.0006) 0.40 0.0006 (0.0006) 0.36 -0.179 (0.010) 1.6×10-65 0.97 (0.94-1.01) 0.13rs13146355 4 77,631,164 4q21 SHROOM3 A/G 0.0018 (0.0009) 0.043 0.0047 (0.0007) 9.4×10⁻¹² -0.0051 (0.0008) 6.6×10⁻¹¹ 0.017 (0.012) 0.16 1.04 (0.99-1.08) 0.090rs2725220 4 89,178,946 4q22 ABCG2 G/C 0.0011 (0.0009) 0.20 -0.0009 (0.0007) 0.18 0.0009 (0.0007) 0.23 -0.135 (0.012) 4.2×10⁻³⁰ 0.99 (0.95-1.02) 0.44rs3828890 6 31,548,648 6p21 MHC region G/C 0.0021 (0.0014) 0.14 0.0069 (0.0012) 2.6×10⁻⁹ -0.0079 (0.0013) 1.2×10⁻⁹ 0.038 (0.020) 0.051 1.11 (1.04-1.19) 0.0016rs1936800 6 127,477,757 6q22 RSPO3 T/C 0.0052 (0.0008) 1.2×10⁻¹¹ -0.0003 (0.0006) 0.64 0.0004 (0.0007) 0.57 -0.003 (0.010) 0.78 1.01 (0.97-1.04) 0.72rs10277115 7 1,251,721 7p22 UNCX A/T -0.0072 (0.0012) 1.9×10⁻⁹ -0.0052 (0.0008) 4.6×10⁻¹¹ 0.0058 (0.0009) 1.0×10⁻¹⁰ -0.036 (0.015) 0.014 0.89 (0.85-0.93) 1.7×10⁻⁶
rs10767873 11 30,725,254 11p14 MPPED2-DCDC5 T/C -0.0068 (0.0008) 4.5×10⁻¹⁶ -0.0033 (0.0007) 4.3×10⁻⁷ 0.0038 (0.0007) 1.8×10⁻⁷ -0.029 (0.012) 0.012 0.94 (0.91-0.98) 0.0055rs504915 11 64,220,661 11q13 SLC22A12 A/T -0.0005 (0.0011) 0.68 0.0007 (0.0007) 0.32 -0.0007 (0.0008) 0.39 -0.225 (0.013) 3.3×10-63 0.99 (0.95-1.04) 0.74
rs671 12 110,726,149 12q24.2 ALDH2 A/G 0.0045 (0.0010) 1.3×10⁻⁵ 0.0045 (0.0007) 2.8×10⁻¹⁰ -0.0043 (0.0008) 7.8×10⁻⁸ -0.062 (0.013) 1.6×10⁻⁶ 1.03 (0.99-1.08) 0.16rs2074356 12 111,129,784 12q24.13 C12orf51 A/G 0.0064 (0.0011) 1.8×10⁻⁹ 0.0049 (0.0008) 1.9×10⁻⁹ -0.0050 (0.0009) 6.5×10⁻⁸ -0.064 (0.015) 1.6×10⁻⁵ 1.04 (0.99-1.09) 0.14rs17730281 15 51,695,240 15q21 WDR72 A/G -0.0051 (0.0008) 3.0×10⁻¹¹ -0.0044 (0.0006) 3.6×10⁻¹⁴ 0.0049 (0.0007) 1.3×10⁻¹³ -0.011 (0.010) 0.29 0.90 (0.87-0.93) 1.3×10⁻⁸
rs11864909 16 20,308,340 16p12 UMOD T/C -0.0034 (0.0012) 0.0058 -0.0052 (0.0008) 1.1×10⁻¹⁰ 0.0057 (0.0009) 3.6×10⁻¹⁰ -0.002 (0.015) 0.87 0.92 (0.87-0.96) 7.0×10⁻⁴
rs889472 16 78,203,490 16q23 MAF A/C -0.0010 (0.0010) 0.30 -0.0007 (0.0006) 0.29 0.0007 (0.0007) 0.30 -0.071 (0.012) 1.1×10⁻⁹ 0.94 (0.90-0.97) 0.0012rs11868441 17 56,594,003 17q23 BCAS3 A/G -0.0059 (0.0010) 2.1×10⁻⁹ -0.0017 (0.0007) 0.010 0.0019 (0.0008) 0.0098 0.032 (0.012) 0.0089 0.96 (0.92-1.00) 0.062rs9895661 17 56,811,371 17q23 BCAS3 T/C -0.0005 (0.0010) 0.65 -0.0045 (0.0007) 7.4×10⁻¹¹ 0.0051 (0.0008) 4.8×10⁻¹¹ 0.042 (0.013) 9.3×10⁻⁴ 0.94 (0.90-0.98) 0.0060rs7227483 18 41,441,128 18q12 SLC14A2 A/G -0.0083 (0.0010) 6.7×10⁻¹⁸ 0.0008 (0.0008) 0.32 -0.0009 (0.0009) 0.32 0.028 (0.013) 0.033 1.04 (0.99-1.08) 0.11rs6026584 20 56,902,468 20q13 GNAS T/C 0.0052 (0.0009) 8.8×10⁻⁹ 0.0010 (0.0007) 0.19 -0.0013 (0.0008) 0.10 0.037 (0.013) 0.0041 1.07 (1.02-1.12) 0.0022
Chronic kidney disease(8,805 cases and 35,259 controls )rsID Chr
Position(bp)
Band Genes A1/A2aBlood urea nitrogen Serum creatinine eGFRcrea Uric acid
(n = 57,178) (n = 61,919) (n = 62,087) (n = 33,074)
aIndicated on the basis of the forward strand of the NCBI build 36. bEffect size of allele 1 on common log-transformed blood urea nitrogen, serum creatinine, and eGFRcrea levels, or non-transformed uric acid levels in the combined study of
the GWAS meta-analysis and the replication study. cOdds ratio of allele 1. dP-value that satisfied Bonferroni's correction based on number of the loci (α = 0.05, n = 21, P < 0.0024) are indicated in bold.
OR, odds ratio; SE, standard error; 95%CI, 95% confidence interval.
Nature Genetics: doi:10.1038/ng.2352
14
Section 2. Supplementary Figures
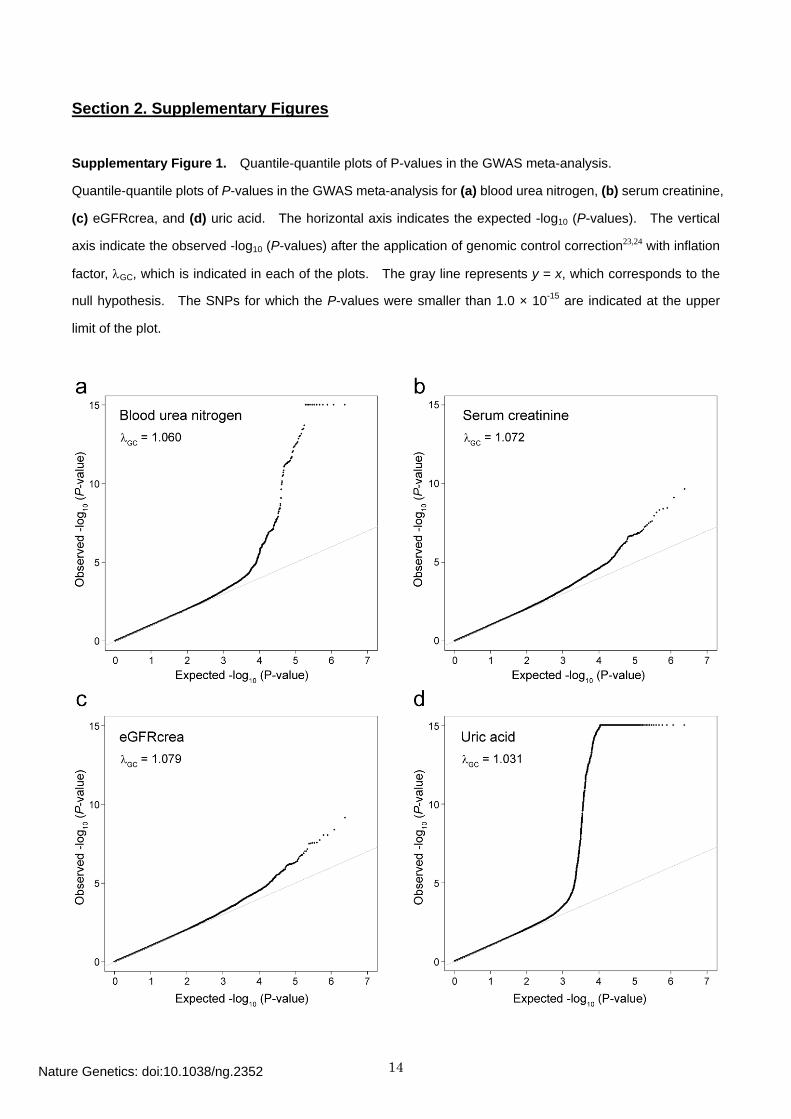
Supplementary Figure 1. Quantile-quantile plots of P-values in the GWAS meta-analysis.
Quantile-quantile plots of P-values in the GWAS meta-analysis for (a) blood urea nitrogen, (b) serum creatinine,
(c) eGFRcrea, and (d) uric acid. The horizontal axis indicates the expected -log10 (P-values). The vertical
axis indicate the observed -log10 (P-values) after the application of genomic control correction23,24 with inflation
factor, λGC, which is indicated in each of the plots. The gray line represents y = x, which corresponds to the
null hypothesis. The SNPs for which the P-values were smaller than 1.0 × 10⁻¹⁵ are indicated at the upper
limit of the plot.
Nature Genetics: doi:10.1038/ng.2352
15
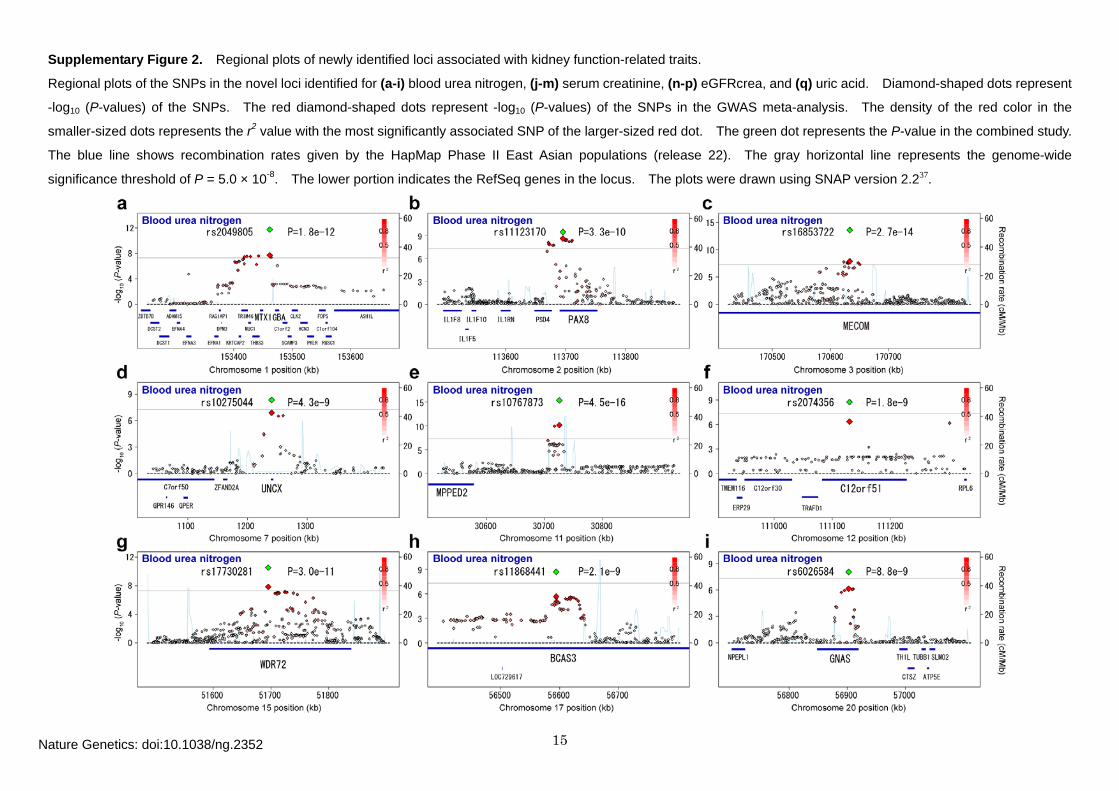
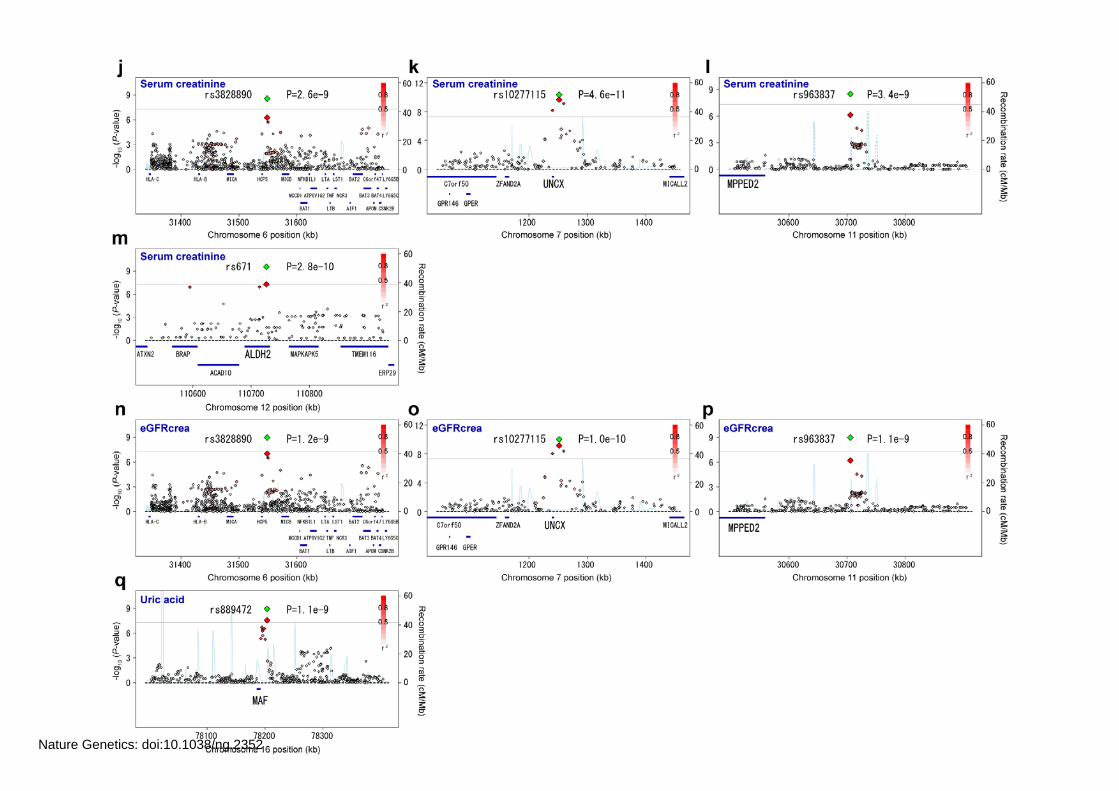
Supplementary Figure 2. Regional plots of newly identified loci associated with kidney function-related traits.
Regional plots of the SNPs in the novel loci identified for (a-i) blood urea nitrogen, (j-m) serum creatinine, (n-p) eGFRcrea, and (q) uric acid. Diamond-shaped dots represent
-log10 (P-values) of the SNPs. The red diamond-shaped dots represent -log10 (P-values) of the SNPs in the GWAS meta-analysis. The density of the red color in the
smaller-sized dots represents the r2 value with the most significantly associated SNP of the larger-sized red dot. The green dot represents the P-value in the combined study.
The blue line shows recombination rates given by the HapMap Phase II East Asian populations (release 22). The gray horizontal line represents the genome-wide
significance threshold of P = 5.0 × 10⁻⁸. The lower portion indicates the RefSeq genes in the locus. The plots were drawn using SNAP version 2.237.
Nature Genetics: doi:10.1038/ng.2352
16
Nature Genetics: doi:10.1038/ng.2352
17
Section 3. Supplementary Note
I. Descriptions of the participating cohorts.
1. The BioBank Japan Project (BBJ).
Subjects. The BioBank Japan Project (http://biobankjp.org)1 started at the Institute of Medical Science, the
University of Tokyo in 2003 and have so far collected up to 300,000 cases consisting of 47 diseases in the
bank. These subjects were recruited from 12 medical institutes in Japan including Osaka Medical Center for
Cancer and Cardiovascular Diseases, the Cancer Institute Hospital of Japanese Foundation for Cancer
Research, Juntendo University, Tokyo Metropolitan Geriatric Hospital, Nippon Medical School, Nihon
University School of Medicine, Iwate Medical University, Tokushukai Hospitals, Shiga University of Medical
Science, Fukujuji Hospital, National Hospital Organization Osaka National Hospital, and Iizuka Hospital.
In this study, a total of 44,433 subjects (46.5% females; mean ± SD age of 61.3 ± 13.2; n = 30,175 for the
GWAS meta-analysis and n = 14,258 for the in-silico replication study) were enrolled and available with the
data of blood urea nitrogen (n = 42,467), serum creatinine (n = 44,064), eGFRcrea (n = 44,245), and uric acid
(n = 27,303). Subjects who were determined to be of non-Japanese origin by self-report, PCA, or our
previous studies2-4,21 were not included. All participants provided written informed consent as approved by the
ethical committees of the RIKEN Yokohama Institute and the Institute of Medical Science, University of Tokyo.
Kidney function-related traits measurement. Clinical information for the samples in the BioBank Japan
Project1 is collected and updated annually from a self-reporting uniform questionnaire (for birth year, height,
weight, and smoking and drinking habits) and from medical records (for laboratory data including the kidney
function- related traits) by the professional medical coordinators according to a standardized manner.
Genotyping and imputation. We used the data of GWAS for 47 diseases which were performed for the
BioBank Japan Project1. In the GWAS, genotyping was performed using the Illumina HumanHap550v3
Genotyping BeadChip, Illumina HumanHap610-Quad Genotyping BeadChip, Illumina HumanOmniExpress
Genotyping BeadChip (Illumina, CA, USA), or oligonucleotide array of Perlegen Sciences (Perlegen Sciences,
CA, USA). After excluding the subjects with call rates lower than 0.95~0.98, we excluded SNPs with call rates
lower than 0.95~0.99, SNPs with ambiguous calls, or non-autosomal SNPs. We excluded closely related
subjects by using identity-by-state (IBS). For each pair with 1st or 2nd degree of kinship, we excluded the
member of the pair with lower call rates. We also excluded subjects whose ancestries were estimated to be
distinct from the other subjects by using PCA performed by EIGENSTRAT version 2.038. We performed PCA
Nature Genetics: doi:10.1038/ng.2352
18
for the genotype data of our study along with the genotype data of unrelated European (CEU), African (YRU),
and East-Asian (Japanese and Han Chinese; JPT + CHB) individuals obtained from the Phase II HapMap
database (release 24)39. Based on the PCA plot, we excluded the outliers in terms of ancestry from JPT +
CHB clusters. We then excluded the SNPs with MAF < 0.01 or the SNPs with exact P-value of the
Hardy-Weinberg equilibrium test < 1.0 × 10⁻⁶~1.0 × 10⁻⁷.
Genotype imputation was performed using MACH 1.0.16 in two step procedure40. The JPT and CHB
individuals obtained from Phase II HapMap database (release 24)39 were used as references. In the first step,
recombination and error rate maps were estimated using 500 subjects randomly selected from the GWAS data.
In the second step, genotype imputation of all subjects was conducted using the rate maps estimated in the
first step. We excluded the imputed SNPs with MAF < 0.01 or Rsq values < 0.5.
Statistical analysis. Associations of the SNPs with transformed values of the kidney function-related traits
were assessed by linear regression assuming additive effects of allele dosages using mach2qtl software40.
Because the study population consisted of the disease cases, the affection status of the diseases were
additionally included as the covariates in the association analysis, as previously described3,4.
2. Singapore Prospective Study Program (SP2), Singapore Malay Eye Study (SiMES), and
Singapore Indian Eye Study (SINDI).
Subjects. SP2: The Singapore Prospective Study Program (SP2) includes 6,968 participants from one of four
the following previous cross-sectional studies: Thyroid and Heart Study 1982–19847, National Health Survey
19928, National University of Singapore Heart Study 1993–19959 or National Health Survey 199810. All
studies involved a random sample of individuals from the Singapore population, aged 24 to 95 years.
Disproportionate sampling stratified by ethnicity was implemented to increase the number of minority ethnic
groups (Malays and Asian Indians). Between 2003 to 2007, 10,747 participants were invited to participate by
linking their unique national identification numbers with national registries, where 7,742 attended the interview
and 5,157 of these attended the clinical examination41. A total of 5,499 Chinese, 1,405 Malays and 1,138
Asian-Indians were available at the time of the study and only the Chinese were used for this study.
SiMES: The Singapore Malay Eye Study (SiMES) is a population-based, cross-sectional study of Malay adults
aged 40 – 80 years living in Singapore. Of the 4,168 eligible participants invited, 3,280 participated in the
study yielding a response rate of 78.7%. Briefly, age-stratified random sampling of all Malay adults aged from
40–80 years residing in 15 residential districts in the southwestern part of Singapore was performed. Details
of the study participants and methods have been published previously11.
SINDI: The Singapore Indian Eye Study (SINDI) is a population-based, cross-sectional study of Asian Indian
Nature Genetics: doi:10.1038/ng.2352
19
adults aged 40–80+ years residing in the South-Western part of Singapore, as part of the Singapore Indian
Chinese Cohort Eye Study. Age stratified random sampling was used to select 6,350 eligible participants, of
which 3,400 participated in the study (75.6% response rate). Detailed methodology has been published12.
SCES: The Singapore Chinese Eye Study (SCES) is a population-based, cross-sectional study of 3,300
Chinese adults aged ≥ 40 years. The study was conducted in the southwestern part of Singapore, using the
same study protocol as the SiMES and SINDI. Using an age-stratified random sampling strategy, 6,350
names were selected. Overall, there was a participation rate of 73% among these selected Chinese who
were eligible.
Informed consent and ethics committees
Informed consent was obtained for all subjects in all our studies.
SP2 was approved by the Singapore Health Services Institutional Review Board (ref CIRB 2001/001/C).
Genetic analysis was approved under the National Health Care Group Domain Specific Review Board
(C/09/413).
SiMES was approved by Singapore Eye Research Institute Scientific & Ethics Committee (R341/34/2003).
Collection of blood and urine sample for blood chemistry, genetic association and renal function studies was
also approved by Singapore Eye Research Institute Scientific & Ethics Committee (R382/40/2004)
SINDI and SCES were approved by Singapore Health Services Institutional Review Board (ref CIRB
2006/612/A) under the study title of Singapore Eye Disease Study (SEDS) - The Indian / Chinese Cohort
(SICC).
Kidney function-related traits. SP2: Creatinine was measured from non-fasting venous samples using
enzymatic methods implemented in the Advia 2400 Chemistry System (Siemens Medical Solutions Diagnostics,
Deerfield, IL, USA) at the National University Hospital Referral Laboratory. The new National Institute of
Standards and Technology Standard Reference Material (NIST SRM) 967, Creatinine in Frozen Human Serum,
was developed in collaboration with the National Kidney Disease Education Program and the College of
American Pathologists for improved calibration of clinical instruments and procedures for measuring serum
creatinine.
SiMES: A 40-mL sample of non-fasting venous blood was collected to determine levels of serum lipids (total
cholesterol, HDL cholesterol, direct LDL cholesterol), glycosylated hemoglobin A1C (HbA1C), creatinine, and
casual glucose at the National University Hospital Reference Laboratory for measurement on the same day11.
Serum creatinine was measured using the same protocol as SP2 in the same laboratory.
SINDI and SCES: Non fasting venous blood sample was collected for biochemistry tests including serum lipids,
Nature Genetics: doi:10.1038/ng.2352
20
HbA1C, creatinine and random glucose. The creatinine analysis is performed on the DXC (Beckman Coulter),
using the Jaffe method.
Genotyping. SP2: 2,867 blood derived samples from the Chinese SP2 study were genotyped on a
combination of Illumina HumanHap 610Quad, 1Mduov3 and 550v3 Beadchips. The samples on the 610Quad
and 1M arrays were controls for a Type 2 Diabetes study and quality filters were implemented on a
case-control basis. Details of the quality controls have been described elsewhere42.
SiMES: For the Malay SiMES study, 3,072 samples were genotyped on the Illumina HumanHap 610Quad.
SINDI: For the SINDI study, 2,953 samples were genotyped on the Illumina HumanHap 610Quad.
SCES: 1,949 blood samples were genotyped on the Illumina HumanHap 610Quad.
For each array in each cohort, a first round of clustering was performed with the proprietary clustering files
from Illumina on the Beadstudio using GenCall. Samples achieving a 99% call rate were used to generate
local specific clusterfiles (GenTrain) which were used for a final round of genotype calling. A threshold of 0.15
was implemented on the GenCall score to decide on the confidence of the assigned genotypes.
Quality control. Similar quality control procedures were implemented on each cohort. SNP QC was first
performed to obtain a pseudo-cleaned set of genotypes for sample QC. SNPs that had missingness greater
than 5%, gross departure from HWE (P-value < 1.0 × 10⁻⁶) or minor allele frequency equal to zero were
temporarily removed from the data.
Using the pseudo-clean set of genotype, samples were then removed based on the following conditions and
in the following order: (i) sample missingness (samples will have a minimum call rate of 95%); (ii) excessive
heterozygosity; (iii) cryptic relatedness; (iv) discordant ethnic membership, using principal components
analysis38 (PCA) with 4 panels from International HapMap II and the Singapore Genome Variation Project43
which includes 96 Chinese, 89 Malays and 83 Asian Indians from Singapore; (v) gender discrepancy.
Finally, after removing the problematic samples and with the full set of SNPs on the genotyping array, SNP
QC is repeated, removing SNPs that had missingness greater than 5%, gross departure from HWE (P-value <
10-4 for the Chinese and P-value < 10-6 for the Malays and Indians) or minor allele frequency equal to zero
across the samples. After QC, there are 2,434 SP2, 2,542 SiMES, 2,538 SINDI, and 1,889 SCES samples
available with genotypes. The post-QC SNPs were used for imputation against reference panels and
association analysis.
Imputation. Imputation was performed using IMPUTEv0.5.044 (for SP2, SiMES and SINDI) and IMPUTEv245
(for SCES). For SP2 Chinese, the reference panel is build 36, release 22 db126 JPT+CHB HapMap panel of
Nature Genetics: doi:10.1038/ng.2352
21
2,416,663 SNPs. For the SiMES Malays and SINDI Indians, a combined panel of the HapMap Phase II
panels (build 36, release 22 db126 CEU and JPT+CHB and YRI HapMap panel of 1969737 SNPs) was used
for the imputation.
Statistical analysis. SNPTESTv2.1.1 (SP2, SiMES and SINDI) and SNPTESTv2.2 (SCES) were used to
perform the association tests, using the –methods score option. The imputation_quality here is the score_info
generated by SNPTEST for the association tests. SNPs with imputation quality score less than 0.5 were
excluded from meta-analysis.
3. Korea Association Resource project (KARE).
Subjects. The Korea Association Resource (KARE) study was initiated in 2007 to undertake a large-scale
GWA analysis for Type 2 Diabetes and numerous complex quantitative traits amongst the 10,038 participants
(aged between 40 and 69) of the Ansung (n = 5,018) and Ansan (n = 5,020) population-based cohorts. Two
KARE study cohorts were established as part of the Korean Genome Epidemiology Study (KoGES) in 2001.
The sampling base for both cohorts is in KyungGi-Do province, close to Seoul, the capital of the Republic of
Korea. A total of 8,842 subjects (52.7% females; mean ± SD age of 52.2 ± 89) were available with the data of
blood urea nitrogen (BUN). Written informed consent for cohort examinations approved by Research Ethics
Committees was obtained from all cohort participants.
Kidney function-related traits. Both KARE cohorts were designed to allow longitudinal prospective study
and adopted the same investigational strategy. Participants have been examined every two years since
baseline (2001). More than 260 traits have been extensively examined through epidemiological surveys,
physical examinations, and laboratory tests applied to Ansung and Ansan cohort members6,13,14. Blood urea
nitrogen was measured using urease with coupled enzymes.
Genotyping and imputation. About 10,000 subjects from KARE study cohorts were genotyped with
Affymetrix Genome-Wide Human SNP array 5.0. We excluded samples with genotyping call rate < 0.98,
gender inconsistency, heterozygosity and first-degree cryptic relationships. After sample quality control, we
excluded SNPs with call rates lower than 0.95, minor allele frequency lower than 0.01 and Hardy-Weinberg
violation (HWE P-value < 1.0 × 10⁻⁶). Genotype imputation was performed using IMPUTE program.
Genotype information for HapMap Asian (JPT + CHB) population was used as reference panel based on
release 22 / NCBI build 36 and dbSNP bulid 128 for SNP imputation. We excluded the imputed SNPs with
low genotype information content (< 0.5), posterior probability score < 0.90, call rate < 0.90, MAF < 0.01, and
Nature Genetics: doi:10.1038/ng.2352
22
HWE P-value < 1.0 × 10⁻⁷ 6,13,14.
Statistical analysis. The genetic associations of Kidney function-related traits were tested by linear
regression analysis with additive genetic mode using PLINK program. Association analyses for log10(BUN)
was adjusted with age, gender, recruitment area and BMI.
4. Health Examinee shared control study (HEXA).
Subjects. The HEXA cohort is one of the KoGES population-based cohorts which were initiated in 2001 aiming
to identify risk factors of life-style related complex diseases such as type 2 diabetes, hypertension, and
dyslipidemia. Approximately 3,700 of 1,200,000 subjects aged 40-69 from the HEXA cohort were randomly
selected as a shared control group for the Korean cancer and coronary artery disease (CAD) GWA studies.
Genotyping was conducted with the Affymetrix Genome-Wide Human SNP array 6.0 in 2008. Written informed
consent for cohort examinations approved by Research Ethics Committees was obtained from all cohort
participants.
Kidney function-related traits. Kidney functions were measured from fasting subjects by clinical
examinations. Kidney function-related traits such blood urea nitrogen, serum creatinine, and uric acid were
assayed using the enzymatic reaction.
Genotyping and imputation. HEXA was conducted using Affymetrix Genome-Wide Human SNP array 6.0.
We included unrelated samples with missing genotyping call rate below 2% and excluded the samples with
gender inconsistency or heterozygosity. After sample quality control, we included SNPs with call rates lower
below 5%, minor allele frequency upper than 0.99 and Hardy-Weinberg (HWE P-value > 1.0 × 10⁻⁶).
Genotype imputation was performed using IMPUTE program reference panel base HapMap Asian (JTP +
CHB) population on release 22 / NCBI build 36 and dbSNP bulid 128. We included the imputed SNPs with
high genotype information content (> 0.5), posterior probability score > 0.90, call rate > 0.90, MAF > 0.01, and
HWE P-value > 1.0 × 10⁻⁷ 14.
Statistical analysis. Measuring kidney functions, the value of genetic associations were tested by linear
regression analysis assuming additive effect using PLINK program. Age, gender, recruitment area and BMI
as additional covariates were included in the association analysis.
5. Taiwan Super Control Study (TWSC)15 and Taiwan Type 2 Diabetes Consortium (TWT2D)16.
Nature Genetics: doi:10.1038/ng.2352
23
Subjects. In this study, 986 control samples (49.8% females; mean ± SD age of 50.7 ± 17.4) were randomly
selected from the Taiwan Han Chinese Cell and Genome Bank, a more than 3,300 healthy controls database,
which was recruited via stratified, 3-staged, probability clustering sampling scheme throughout the registry of
all the 329 non-aboriginal townships or city districts in Taiwan from 2002 to 20046. The criteria for controls in
the association were (1) no past diagnostic history of T2D, (2) HbA1C ranging from 3.4 to 6.0, and (3) BMI ≤ 32.
The two control groups were comparable with respect to BMI, gender, age at study, and level of HbA1C. A total
of 987 unrelated individuals with T2D and age > 20 years (50.0% females; mean ± SD age of 59.2 ± 10.2) were
recruited from China Medical University Hospital (CMUH), Taichung. All of the T2D cases were diagnosed
according to medical records and fasting plasma glucose levels using American Diabetic Association Criteria.
Subjects with type 1 diabetes, gestational diabetes, and maturity-onset diabetes of the young (MODY) were
excluded from this study. All of the participating T2D cases and controls were of Han Chinese origin, which is
the origin of 98% of the Taiwan population17. The study was approved by the institutional review board of all
the participating hospitals and Academia Sinica, Taiwan, and written informed consent were obtained from all
of the participants.
Kidney function-related traits. Phenotype questionnaire on ethnicity, disease history and medication, life
styles, and cognitive function of the elderly was administered by well-trained nurses in a door-to-door survey,
following a standardized protocol. Clinical measurements including basic blood chemistry, and
anthropometric parameters were obtained from Taiwan Han Chinese Cell and Genome Bank blood sample.
Genotyping and imputation. In GWAS, genotyping was conducted using the Illumina HumanHap550-Duo
BeadChip (Illumina, San Diego, CA, USA) and performed by deCODE genetics (Reykjavík, Iceland).
Genotype calling was determined by Beadstudio (Illumina) using default parameters. After filtering callrate <
0.95, MAF < 0.01, HWE-P < 1.0 × 10⁻⁶ SNPs, imputation was performed using IMPUTE v2 software to
generate imputed genotype data, HapMap Phase II JPT_CHB_r24_nr.b36_fwd genotype data was used as
reference panel to IMPUTE.
Statistical analysis. Associations of the SNPs with transformed values of the kidney function-related traits
were assessed by linear regression assuming additive effects of allele dosages using SNPTEST v2 software.
Sex, age, smoking, and drinking status were included as covariates in the linear regression models. The
analyses for SC and T2D were performed separately due to the difference between the two samples.
6. The Genetic Epidemiology Network of Salt-Sensitivity (GenSalt) study
Nature Genetics: doi:10.1038/ng.2352
24
Subjects. The GenSalt study is a unique NHLBI-sponsored family feeding-study designed to examine the
interaction between genes and dietary sodium and potassium intake on blood pressure (BP). A detailed
description of the GenSalt study design and participants has been reported previously18. Briefly, 3,142
participants from 633 Han families from rural, north China were ascertained through a proband with untreated
systolic BP 130-160 mmHg or diastolic BP 85-100 mmHg from a population-based BP screening. A total of
1,906 GenSalt probands and their siblings, spouses, and offspring took part in the dietary intervention and
GWA study. Written informed consent for cohort examinations approved by Research Ethics Committees was
obtained from all the participants in the study.
Kidney function-related traits. Overnight fasting blood specimens were collected at baseline examination
for measurement of serum creatinine. Blood specimens were processed at each field center and shipped by
air to the central clinical laboratory at the at Fuwai Hospital of the Chinese Academy of Medical Sciences in
Beijing, where the specimens were stored at −70°C until laboratory assays could be performed. Serum
creatinine was measured by the modified kinetic Jaffe reaction on a Hitachi 7060 Clinical Analyzer (Hitachi
High-Technologies Corporation, Tokyo, Japan) using commercial reagents. In addition, a random sample of
60 serum specimens was sent to the Cleveland Clinic Laboratory (Cleveland, OH, USA) for measurement of
serum creatinine where the Modification of Diet in Renal Disease (MDRD) Study measured serum creatinine
levels. On average, serum creatinine assays on the same samples were 0.0338 mg/dL higher in the
Cleveland Clinic Laboratory than in the InterASIA Study laboratory. Therefore, serum creatinine
measurements among study participants were calibrated by adding this difference to calculated estimated
glomerular filtration rate (eGFR) using the simplified MDRD equation46.
Genotyping and imputation. Lymphocytic DNA samples were obtained from GenSalt family members
(probands, parents, spouses, siblings, and offspring). Genome-wide SNPs were genotyped using Affymetrix®
Genome-Wide Human Array 6.0 at the Affymetrix genotyping facility. After removing sex-linked SNPs,
mitochondrial SNPs, and ‘unassigned’ SNPs that had no annotated chromosomal location, 871,166 SNPs were
chosen for examination. Strict procedures for extensive QC were used to check the data for any obvious
errors, remove uninformative data, and find and remove all Mendelian errors in three stages. In stage 1, we
removed subjects with gender discrepancies between reported sex and that estimated by PLINK47 and those
who had potential pedigree errors, as determined by GRR (graphical representation of relationship errors)48.
In stage 2, we removed monomorphic SNPs, Affymetrix ‘housekeeping’ SNPs, SNPs with missing rates of >
0.25 or MAF of < 0.01. In the final stage, Mendelian errors were found and removed using PLINK47 and
PedCheck49. After the QC process, 820,015 autosomal SNPs from 1,881 subjects remained. An additional
Nature Genetics: doi:10.1038/ng.2352
25
1,792,556 SNPs were imputed from a HapMap reference panel using 90 subjects from the JPT and CHB
populations. The QC processes removed imputed SNPs with R2 < 0.5, MAF < 0.01, Hardy-Weinberg P-value
< 1.0 × 10⁻⁶, Mendelian errors.
Statistical analysis. Analyses of the association between SNPs and serum creatinine or eGFR phenotypes
were conducted using a linear mixed-effects model implemented in the Proc Mixed procedure of SAS (version
9.1; SAS Institute, Cary, NC). A “sandwich” option was used to compute the estimated variance-covariance
matrix of the fixed-effects (genetic variant effects) parameters by using the asymptotically consistent estimator.
Because most of the studied families (random effects) only included sib pairs, we selected compound
symmetry as the covariance structure, which assumes the same degree of dependency among family
members. Additive genetic models were assumed.
7. Cardio-metabolic Genome Epidemiology (CAGE).
Subjects. The Cardio-metabolic Genome Epidemiology (CAGE) Network is an ongoing collaborative effort to
investigate genetic and environmental factors and their interactions affecting cardiometabolic traits/disorders
among Asians, including the Japanese19,20. CAGE participants were recruited in a population-based or
hospital-based setting, depending on the design of the member studies. Participation rates varied among the
member studies (approximately from 25% in the community-based survey to 80% in the work place-based
survey). From this network sample, a total of 988 Japanese samples (576 men and 412 women; age range
36–85, median 64 years) were used for a GWAS of kidney function-related traits, such as serum creatinine level.
These participants were enrolled at two separate sites in Japan, the Tokyo and Osaka districts. In the CAGE
Network, all participants provided written informed consent and studies were approved by local Research
Ethics Committees and/or Institutional Review boards.
Kidney function-related traits. Serum creatinine was measured using a modified kinetic Jaffe reaction in all
member studies. eGFRcrea was calculated using the equation recommended by the Japanese Society of
Nephrology (http://www.jsn.or.jp/en/). Clinical information for the participants in the CAGE Network is
collected from a self-reporting questionnaire (for birth year, smoking and drinking habits) and from medical (or
annual health check-up) records (for laboratory data including the kidney function-related traits) by the trained
personnel. Participants’ height and body weight were also measured by trained personnel using standard
anthropometric techniques.
Genotyping and imputation. Genotyping was performed with Infinium HumanHap550/Human610-Quad
Nature Genetics: doi:10.1038/ng.2352
26
BeadArray (Illumina, San Diego, CA, USA), which interrogated 550K/610K SNPs, according to the
manufacturer’s protocol. This set of SNP markers reportedly captures 87% of common SNPs with an LD
coefficient of r2 > 0.8 in the HapMap JPT and CHB populations (according to the manufacturer’s brochure).
Assay accuracy and reproducibility were measured by using DNA from CEU samples genotyped as part of the
HapMap project [http://www.hapmap.org]. Genotype calling was performed using BeadStudio software
(Illumina) and genotype calls with a ‘GenCall’ Score < 0.53 were dropped from the analysis. The GenCall
Score measures the reliability of genotype calls based on the clustering of dye intensities
(www.illumina.com/downloads/ GenCallTechSpotlight.pdf).
QC of SNPs and samples was performed as previously described20. Briefly, data cleaning and analysis
were performed using PLINK software (version 1.06)47. Among the assayed SNPs, we excluded SNPs for the
following: (i) genotype call rate < 0.95; (ii) significant (P < 1.0 × 10⁻⁶) deviation from HWE; or (iii) MAF < 0.01.
The remaining 451,377 SNPs were analyzed in the genome scan.
We used BEAGLE (ver 3.0.4)50 for imputation. The training set comprised genotypes for HapMap
Asians (45 JPT + 45 CHB; Phase 2, Release 24). We imputed uncalled genotypes for assayed SNPs,
resulting in 100% genotypes called for all SNPs, whether assayed or not.
Statistical analysis. Association testing was done using PLINK (ver 1.06) and the R software (ver 2.12.2).
Nature Genetics: doi:10.1038/ng.2352
27
II. Contributing authors participating in the KidneyGen, CKDGen, and GUGC consortia
II-a : Contributing authors in the KidneyGen consortium.
John C Chambers1,2, Weihua Zhang1,2, Graham M Lord3–5, Pim van der Harst6, Debbie A Lawlor7, Joban S
Sehmi2,8, Daniel P Gale9, Mark N Wass10, Kourosh R Ahmadi11, Stephan J L Bakker6, Jacqui Beckmann12,
Henk J G Bilo6, Murielle Bochud13, Morris J Brown14, Mark J Caulfield15, John M C Connell16, H Terence Cook17,
Ioana Cotlarciuc11, George Davey Smith7, Ranil de Silva2,8, Guohong Deng18, Olivier Devuyst19, Lambert D
Dikkeschei20, Nada Dimkovic21, Mark Dockrell22, Anna Dominiczak16, Shah Ebrahim23, Thomas Eggermann24,
Martin Farrall25, Luigi Ferrucci26, Jurgen Floege27, Nita G Forouhi28, Ron T Gansevoort29, Xijin Han30, Bo
Hedblad31, Jaap J Homan van der Heide32, Bouke G Hepkema33, Maria Hernandez-Fuentes3–5, Elina
Hypponen34, Toby Johnson35, Paul E de Jong36, Nanne Kleefstra36, Vasiliki Lagou37, Marta Lapsley22, Yun Li30,
Ruth J F Loos28, Jian’an Luan28, Karin Luttropp38, Céline Maréchal19, Olle Melander31, Patricia B Munroe15,
Louise Nordfors38, Afshin Parsa39, Leena Peltonen40–42, Brenda W Penninx43–45, Esperanza Perucha3–5, Anneli
Pouta42,46, Inga Prokopenko47–49, Paul J Roderick50, Aimo Ruokonen51, Nilesh J Samani52, Serena Sanna53,
Martin Schalling54, David Schlessinger55, Georg Schlieper27, Marc A J Seelen29, Alan R Shuldiner56, Marketa
Sjögren31, Johannes H Smit43–45, Harold Snieder37, Nicole Soranzo11, Timothy D Spector11, Peter Stenvinkel57,
Michael J E Sternberg10, Ramasamyiyer Swaminathan58, Toshiko Tanaka26, Lielith J Ubink-Veltmaat59,
Manuela Uda53, Peter Vollenweider60, Chris Wallace61, Dawn Waterworth62, Klaus Zerres24, Gerard Waeber60,
Nicholas J Wareham28, Patrick H Maxwell9, Mark I McCarthy47–49, Marjo-Riitta Jarvelin1,42,46,63, Vincent
Mooser62, Goncalo R Abecasis30, Liz Lightstone64, James Scott8, Gerjan Navis6, Paul Elliott1,65 & Jaspal S
Kooner2,8.
1. Department of Epidemiology and Biostatistics, School of Public Health, Imperial College of London, London,
UK.
2. Ealing Hospital National Health Service (NHS) Trust, Middlesex, UK.
3. Department of Nephrology and Transplantation and 4. Medical Research Council (MRC) Centre for
Transplantation, King’s College London, UK.
5. National Institute for Health Research (NIHR) Comprehensive Biomedical Research Centre, Guy’s and St.
Thomas’ NHS Foundation Trust and King’s College London, London, UK.
6. University Medical Center Groningen, University of Groningen, Groningen, The Netherlands.
7. MRC Centre for Causal Analyses in Translational Epidemiology, University of Bristol, Bristol, UK.
8. National Heart and Lung Institute, Hammersmith Hospital Campus, Imperial College London, London, UK.
9. Division of Medicine, University College London, London, UK.
Nature Genetics: doi:10.1038/ng.2352
28
10. Structural Bioinformatics Group, Imperial College London, London, UK.
11. Twin Research and Genetic Epidemiology Department, King’s College London, St. Thomas’ Hospital
Campus, London, UK.
12. Department of Medical Genetics, University of Lausanne, Lausanne, Switzerland.
13. University Institute of Social and Preventive Medicine, Centre Hospitalier Universitaire Vaudois (CHUV),
Lausanne, Switzerland.
14. Clinical Pharmacology Unit, University of Cambridge, Addenbrookes Hospital, Cambridge, UK.
15. Clinical Pharmacology and The Genome Centre, William Harvey Research Institute, Barts and The London
School of Medicine and Dentistry, London, UK.
16. Glasgow Cardiovascular Research Centre, University of Glasgow, Glasgow, UK.
17. Department of Histopathology, Imperial College, Hammersmith Hospital, London, UK.
18. Department of Gastroenterology and Hepatology, Imperial College London, London, UK.
19. Division of Nephrology, Université Catholique de Louvain Medical School, Brussels, Belgium.
20. Isala Clinics, Zwolle, The Netherlands.
21. Center for Renal Diseases, Zvezdara University Medical Center, Belgrade, Serbia.
22. South West Thames Institute for Renal Research, Epsom and St. Helier University Hospitals NHS Trust,
Carshalton, UK.
23. London School of Hygiene and Tropical Medicine, London, UK.
24. Department of Human Genetics, Rheinisch-Westfaelische Technische Hochschule University Hospital
Aachen, Aachen, Germany.
25. Cardiovascular Medicine, University of Oxford, Wellcome Trust Centre for Human Genetics, Oxford, UK.
26. National Institute of Aging, Clinical Research Branch–Longitudinal Studies Section, Baltimore, Maryland,
USA.
27. Department of Nephrology and Clinical Immunology, RWTH University Hospital Aachen, Aachen, Germany.
28. MRC Epidemiology Unit, Institute of Metabolic Science, Addenbrooke’s Hospital, Cambridge, UK.
29. Department of Internal Medicine, University Medical Center Groningen, University of Groningen, Groningen,
The Netherlands.
30. Center for Statistical Genetics, University of Michigan, Ann Arbor, Michigan, USA.
31. Department of Clinical Sciences, Lund University, Malmö, Sweden.
32. Department of Nephrology, University Medical Center Groningen, Groningen, The Netherlands.
33. Department of Transplantation Immunology, University Medical Center Groningen, Groningen, The
Netherlands.
34. Centre of Epidemiology for Child Health, University College London Institute of Child Health, London, UK.
Nature Genetics: doi:10.1038/ng.2352
29
35. Department of Medical Genetics, University of Lausanne and the Swiss Institute of Bioinformatics,
Lausanne, Switzerland.
36. Langerhans Medical Research Group, Zwolle, The Netherlands.
37. Unit of Genetic Epidemiology and Bioinformatics, Department of Epidemiology, University Medical Center
Groningen, University of Groningen, Groningen, The Netherlands.
38. Department of Molecular Medicine and Surgery, Karolinska University Hospital, Karolinska Institutet,
Stockholm, Sweden.
39. Division of Nephrology, University of Maryland School of Medicine, Baltimore, Maryland, USA.
40. Wellcome Trust Sanger Institute, Wellcome Trust Genome Campus, Hinxton, Cambridge, UK.
41. Institute for Molecular Medicine Finland (FIMM), Nordic European Molecular Biology Laboratory (EMBL)
Partnership for Molecular Medicine, Biomedicum Helsinki 2U and University of Helsinki, Helsinki, Finland.
42. National Institute for Health and Welfare, Helsinki, Finland.
43. Department of Psychiatry, Institute for Research in Extramural Medicine (EMGO), Neuroscience Campus,
Vrije Universiteit (VU) Medical Center, Amsterdam, The Netherlands.
44. Department of Psychiatry, Leiden University Medical Center, Leiden, The Netherlands.
45. Department of Psychiatry, University Medical Center Groningen, University of Groningen, Groningen, The
Netherlands.
46. Institute of Health Sciences, University of Oulu, Oulu, Finland.
47. Wellcome Trust Centre for Human Genetics, University of Oxford, Oxford, UK.
48. Oxford Centre for Diabetes, Endocrinology and Metabolism and 49. Oxford NIHR Biomedical Research
Centre, Oxford, UK.
50. University of Southampton, Southampton, UK.
51. Institute of Clinical Medicine, Department of Clinical Chemistry, University of Oulu, Oulu, Finland.
52. Cardiovascular Sciences, University of Leicester, Glenfield Hospital, Leicester, UK.
53. Istituto di Neurogenetica e Neurofarmacologia, Consiglio Nazionale delle Ricerche, Cagliari, Italy.
54. Department of Molecular Medicine and Surgery, Karolinska University Hospital, Karolinska Institutet,
Stockholm, Sweden.
55. Laboratory of Genetics, US National Institutes of Health Biomedical Research Center, National Institute on
Aging, Baltimore, Maryland, USA.
56. Division of Endocrinology, Diabetes and Nutrition, University of Maryland School of Medicine, Baltimore,
Maryland, USA.
57. Division of Renal Medicine K56, Karolinska University Hospital at Huddinge, Stockholm, Sweden.
58. Chemical Pathology, Guy’s and St Thomas’ Hospitals Trust, London, UK.
Nature Genetics: doi:10.1038/ng.2352

30
59. General Practice ‘t Veen, Hattem, The Netherlands.
60. Department of Internal Medicine, University Hospital Center, University of Lausanne, Lausanne,
Switzerland.
61. Cambridge Institute for Medical Research, Addenbrooke’s Hospital, Hills Road, Cambridge, UK.
62. Medical Genetics, Clinical Pharmacology and Discovery Medicine, GlaxoSmithKline, King of Prussia,
Pennsylvania, USA.
63. Biocenter Oulu, University of Oulu, Oulu, Finland.
64. Renal Section, Division of Medicine, Hammersmith Hospital Campus, Imperial College London, London,
UK.
65. MRC-HPA Centre for Environment and Health, Department of Epidemiology and Biostatistics, School of
Public Health, Imperial College of London, London, UK.
II-b : Contributing authors in the CKDGen consortium.
Anna Köttgen1,2, Cristian Pattaro3,4, Carsten A Böger5, Christian Fuchsberger3,4, Matthias Olden5,6, Nicole L
Glazer7,8, Afshin Parsa9, Xiaoyi Gao10, Qiong Yang11, Albert V Smith12,13, Jeffrey R O’Connell9, Man Li1, Helena
Schmidt14, Toshiko Tanaka15,16, Aaron Isaacs17, Shamika Ketkar10, Shih-Jen Hwang18,19, Andrew D Johnson18,19,
Abbas Dehghan17,20, Alexander Teumer21, Guillaume Paré22, Elizabeth J Atkinson23, Tanja Zeller24, Kurt
Lohman25, Marilyn C Cornelis26, Nicole M Probst-Hensch27,28, Florian Kronenberg29, Anke Tönjes30, Caroline
Hayward31, Thor Aspelund12,13, Gudny Eiriksdottir12, Lenore J Launer32, Tamara B Harris32, Evadnie
Rampersaud33, Braxton D Mitchell9, Dan E Arking34, Eric Boerwinkle35, Maksim Struchalin36, Margherita
Cavalieri37, Andrew Singleton38, Francesco Giallauria39, Jeffrey Metter39, Ian H de Boer40, Talin Haritunians41,
Thomas Lumley42, David Siscovick8,43, Bruce M Psaty44–46, M Carola Zillikens20,47, Ben A Oostra17, Mary
Feitosa10, Michael Province10, Mariza de Andrade23, Stephen T Turner48, Arne Schillert49, Andreas Ziegler49,
Philipp S Wild24, Renate B Schnabel24, Sandra Wilde24, Thomas F Munzel24, Tennille S Leak50, Thomas Illig51,
Norman Klopp51, Christa Meisinger51, H-Erich Wichmann51–53, Wolfgang Koenig54, Lina Zgaga55, Tatijana
Zemunik56, Ivana Kolcic57, Cosetta Minelli3,4, Frank B Hu26, Åsa Johansson58, Wilmar Igl58, Ghazal Zaboli58,
Sarah H Wild55, Alan F Wright31, Harry Campbell55, David Ellinghaus59, Stefan Schreiber59, Yurii S
Aulchenko17,20, Janine F Felix17,20, Fernando Rivadeneira17,20,47, Andre G Uitterlinden17,20,47, Albert Hofman17,20,
Medea Imboden27,28, Dorothea Nitsch60, Anita Brandstätter29, Barbara Kollerits29, Lyudmyla Kedenko61, Reedik
Mägi62,63, Michael Stumvoll30, Peter Kovacs30, Mladen Boban56, Susan Campbell31, Karlhans Endlich64, Henry
Völzke65, Heyo K Kroemer66, Matthias Nauck67, Uwe Völker21, Ozren Polasek57, Veronique Vitart31, Sunita
Badola68, Alexander N Parker68, Paul M Ridker69, Sharon L R Kardia70, Stefan Blankenberg24, Yongmei Liu71,
Nature Genetics: doi:10.1038/ng.2352
31
Gary C Curhan72, Andre Franke59, Thierry Rochat73, Bernhard Paulweber61, Inga Prokopenko62,63, Wei
Wang56,74, Vilmundur Gudnason12,13, Alan R Shuldiner9, Josef Coresh1,75, Reinhold Schmidt37, Luigi Ferrucci39,
Michael G Shlipak76, Cornelia M van Duijn17,20, Ingrid Borecki10, Bernhard K Krämer77, Igor Rudan55, Ulf
Gyllensten58, James F Wilson55, Jacqueline C Witteman17,20, Peter P Pramstaller3,4, Rainer Rettig78, Nick
Hastie31, Daniel I Chasman69, W H Kao1,75, Iris M Heid6,51 & Caroline S Fox18,19,79.
1. Department of Epidemiology, Johns Hopkins University, Baltimore, Maryland, USA.
2. Renal Division, University Hospital of Freiburg, Freiburg, Germany.
3. Institute of Genetic Medicine, European Academy Bozen/Bolzano (EURAC), Bolzano, Italy.
4. Affiliated Institute of the University of Lübeck, Germany, Viale Druso, Bolzano, Italy.
5. Department of Internal Medicine II, University Medical Center Regensburg, Regensburg, Germany.
6. Department of Epidemiology and Preventive Medicine, University Medical Center Regensburg, Regensburg,
Germany.
7. Cardiovascular Health Research Unit, University of Washington, Seattle, Washington, USA.
8. Department of Medicine, University of Washington, Seattle, Washington, USA.
9. University of Maryland Medical School, Baltimore, Maryland, USA.
10. Division of Statistical Genomics, Washington University School of Medicine, St. Louis, Missouri, USA.
11. Department of Biostatistics, Boston University School of Public Health, Boston, Massachusetts, USA.
12. Icelandic Heart Association, Kopavogur, Iceland.
13. University of Iceland, Reykjavik, Iceland.
14. Department of Neurogeriatrics, Austrian Stroke Prevention Study, Institute of Molecular Biology and
Biochemistry and University Clinic of Neurology, Medical University Graz, Graz, Austria.
15. Clinical Research Branch, National Institute on Aging, Baltimore, Maryland, USA.
16. Medstar Research Institute, Baltimore, Maryland, USA.
17. Department of Epidemiology, Erasmus MC, Rotterdam, The Netherlands.
18. The National Heart, Lung, and Blood Institute’s Framingham Heart Study, Framingham, Massachusetts,
USA.
19. Center for Population Studies, Framingham, Massachusetts, USA.
20. Netherlands Genomics Initiative (NGI)-sponsored Netherlands Consortium for Healthy Aging (NCHA),
Leiden, The Netherlands.
21. Interfaculty Institute for Genetics and Functional Genomics, Ernst-Moritz-Arndt University Greifswald,
Greifswald, Germany.
22. Department of Pathology and Molecular Medicine, McMaster University, Hamilton, Ontario, Canada.
Nature Genetics: doi:10.1038/ng.2352
32
23. Division of Biomedical Statistics and Informatics, Mayo Clinic, Rochester, Minnesota, USA.
24. Department of Medicine II, University Medical Center Mainz, Mainz, Germany.
25. Department of Biostatistical Sciences, Wake Forest University, Division of Public Health Sciences,
Winston-Salem, North Carolina, USA.
26. Department of Nutrition, Harvard School of Public Health, Boston, Massachusetts, USA.
27. Swiss Tropical and Public Health Institute, Basel, Switzerland.
28. University of Basel, Basel, Switzerland.
29. Division of Genetic Epidemiology, Innsbruck Medical University, Innsbruck, Austria.
30. Department of Medicine, University of Leipzig, Leipzig, Germany.
31. Medical Research Council Human Genetics Unit, Institute of Genetics and Molecular Medicine, Western
General Hospital, Edinburgh, Scotland, UK.
32. Laboratory of Epidemiology, Demography and Biometry, National Institute on Aging, Bethesda, Maryland,
USA.
33. Miami Institute for Human Genomics, Miami, Florida, USA.
34. McKusick-Nathans Institute of Genetic Medicine, Johns Hopkins University School of Medicine, Baltimore,
Maryland, USA.
35. Human Genetics Center, University of Texas Health Science Center, Houston, Texas, USA.
36. Department of Epidemiology and Biostatistics, Department of Forensic Molecular Biology, Rotterdam, The
Netherlands.
37. Department of Neurogeriatrics, Austrian Stroke Prevention Study, University Clinic of Neurology, Medical
University Graz, Graz, Austria.
38. Laboratory of Neurogenetics, National Institute on Aging, Bethesda, Maryland, USA.
39. Clinical Research Branch, National Institute on Aging, Baltimore, Maryland, USA.
40. Kidney Research Institute and Division of Nephrology, University of Washington, Seattle, Washington,
USA.
41. Medical Genetics Institute, Cedars-Sinai Medical Center, Los Angeles, California, USA.
42. Department of Biostatistics, University of Washington, Seattle, Washington, USA.
43. Department of Epidemiology, University of Washington, Seattle, Washington, USA.
44. Department of Medicine, Cardiovascular Health Research Unit, University of Washington and Group Health
Research Institute, Seattle, Washington, USA.
45. Department of Epidemiology, University of Washington and Group Health Research Institute, Seattle,
Washington, USA.
46. Department of Health Services, University of Washington, Seattle, Washington, USA.
Nature Genetics: doi:10.1038/ng.2352
33
47. Department of Internal Medicine, Erasmus University, Rotterdam, The Netherlands.
48. Department of Internal Medicine,Division of Nephrology and Hypertension, Mayo Clinic, Rochester,
Minnesota, USA.
49. Institute for Medical Biometry and Statistics, University at Lübeck, Lübeck University Hospital
Schleswig-Holstein, Campus Lübeck, Germany.
50. Department of Epidemiology, Graduate School of Public Health, University of Pittsburgh, Pittsburgh,
Pennsylvania, USA.
51. Institute of Epidemiology, Helmholtz Zentrum München, German Research Center for Environmental
Health, Neuherberg, Germany.
52. Institute of Medical Informatics, Biometry and Epidemiology, Ludwig-Maximilians-Universität, Munich,
Germany.
53. Klinikum Grosshadern, Munich, Germany.
54. Zentrum für Innere Medizin, Klinik für Innere Medizin II–Kardiologie, Universitätsklinikum Ulm, Ulm,
Germany.
55. Centre for Population Health Sciences, University of Edinburgh Medical School, Edinburgh, Scotland, UK.
56. Croatian Centre for Global Health, University of Split Medical School, Split, Croatia.
57. Andrija Stampar School of Public Health, Medical School, University of Zagreb, Zagreb, Croatia.
58. Department of Genetics and Pathology, Rudbeck Laboratory, Uppsala University, Uppsala, Sweden.
59. Institute of Clinical Molecular Biology, Christian-Albrechts-University, Kiel, Germany.
60. Department of Epidemiology and Population Health, London School of Hygiene and Tropical Medicine,
London, UK.
61. First Department of Internal Medicine, Paracelsus Medical University, Salzburg, Austria.
62. Wellcome Trust Centre for Human Genetics, University of Oxford, Oxford, UK.
63. Oxford Centre for Diabetes, Endocrinology and Metabolism, University of Oxford, Oxford, UK.
64. Institute of Anatomy and Cell Biology, Ernst-Moritz-Arndt University Greifswald, Greifswald, Germany.
65. Institute for Community Medicine, Ernst-Moritz-Arndt University Greifswald, Greifswald, Germany.
66. Institute of Pharmacology, Ernst-Moritz-Arndt University Greifswald, Greifswald, Germany.
67. Institute of Clinical Chemistry and Laboratory Medicine, Ernst-Moritz-Arndt University Greifswald,
Greifswald, Germany.
68. Amgen, Cambridge, Massachusetts, USA.
69. Brigham and Women’s Hospital, Boston, Massachusetts, USA.
70. Department of Epidemiology, University of Michigan School of Public Health, Ann Arbor, Michigan, USA.
71. Department of Epidemiology and Prevention, Wake Forest University, Division of Public Health Sciences,
Nature Genetics: doi:10.1038/ng.2352
34
Winston-Salem, North Carolina, USA.
72. Brigham and Women’s Hospital, Harvard Medical School, Boston, Massachusetts, USA.
73. University Hospitals of Geneva, Geneva, Switzerland.
74. School of Public Health and Family Medicine, Capital Medical University, Beijing, China.
75. Welch Center for Prevention, Epidemiology and Clinical Research, Johns Hopkins University, Baltimore,
Maryland, USA.
76. General Internal Medicine, University of California, San Francisco, San Francisco, California, USA.
77. Department of Medicine V, Mannheim University Hospital, University of Heidelberg, Mannheim, Germany.
78. Institute of Physiology, Ernst-Moritz-Arndt University Greifswald, Greifswald, Germany.
79. Brigham and Women’s Hospital Department of Endocrinology and Harvard Medical School, Boston,
Massachusetts, USA.
II-c : Contributing authors in the Global Urate Genetics (GUGC) consortium.
The following studies participated in the discovery stage of the Global Urate Genetics (GUGC) consortium;
AGES Reykjavik Study, Amish, ARIC, ASPS, AUSTWIN, BLSA, BRIGHT, CARDIA, CHS, CoLaus,
CROATIA-KORCULA, CROATIA-SPLIT, CROATIA-VIS, DESIR, EPIC-Norfolk cohort, ERF, Estonian Biobank,
Family Heart Study, Framingham Heart Study, Health 2000, InCHIANTI, INCIPE, INGI-Carlantino,
INGI-CILENTO, INGI-FVG, INGI-Val Borbera, KORA F3, KORA F4, LBC1936, LifeLines, LOLIPOP, LURIC,
MICROS, NESDA, NSPHS, ORCADES, PREVEND, PROCARDIS, RS-I, RS-II, SardiNIA, SHIP, SOCCS,
Sorbs, TwinsUK, and Young Finns Study.
The following authors are participated in the GUGC consortium;
Anna Köttgen1,2, Eva Albrecht3, Alexander Teumer4, Veronique Vitart5, Jan Krumsiek6, Claudia Hundertmark1,
Giorgio Pistis7, Daniela Ruggiero8, Conall M O’Seaghdha9,10, Toomas Haller11, Qiong Yang9,12, Toshiko
Tanaka13, Andrew D Johnson9, Zoltán Kutalik14,15, Albert V Smith16,17, Julia Shi18, Maksim Struchalin19, Rita PS
Middelberg20,21, Morris J Brown22, Angelo L Gaffo23,24, Nicola Pirastu25, Guo Li26, Caroline Hayward5, Tatijana
Zemunik27, Jennifer Huffman5, Loic Yengo28,29, Jing Hua Zhao30, Ayse Demirkan31, Mary F Feitosa32, Xuan
Liu12, Giovanni Malerba33, Lorna M Lopez34,35, Pim van der Harst36, Xinzhong Li37, Marcus E Kleber38,39,
Andrew A Hicks40, Ilja M Nolte41, Asa Johansson42,43, Federico Murgia44, Sarah H Wild45, Stephan JL Bakker46,
John F Peden47, Abbas Dehghan19,48, Maristella Steri49, Albert Tenesa5,50, Vasiliki Lagou51, Perttu Salo52,
Massimo Mangino53, Lynda M Rose54, Terho Lehtimäki55, Owen M Woodward56, Yukinori Okada57,58, Adrienne
Tin2, Christian Müller59, Christopher Oldmeadow60, Margus Putku61, Darina Czamara62, Peter Kraft63, Laura
Frogheri44, Gian Andri Thun64,65, Anne Grotevendt66, Gauti Kjartan Gislason16, Tamara B Harris67, Lenore J
Launer67, Patrick McArdle18, Alan R Shuldiner18, Eric Boerwinkle68, Josef Coresh2,69, Helena Schmidt70,
Nature Genetics: doi:10.1038/ng.2352
35
Michael Schallert71, Nicholas G Martin21, Grant W Montgomery21, Michiaki Kubo72, Yusuke Nakamura73,
Toshihiro Tanaka74, Patricia B Munroe75, Nilesh J Samani76,77, David R Jacobs Jr78, Kiang Liu79, Pio D'Adamo25,
Sheila Ulivi80, Jerome I Rotter81, Bruce M Psaty26,82,83, Peter Vollenweider84, Gerard Waeber84, Susan
Campbell5, Olivier Devuyst85, Pau Navaro5, Ivana Kolcic27, Nicholas Hastie5, Beverley Balkau86, Philippe
Froguel28,87, Tõnu Esko11,61, Andres Salumets11,88,89, Kay Tee Khaw90, Claudia Langenberg30, Nicholas J
Wareham30, Aaron Isaacs31, Aldi Kraja32, Qunyuan Zhang32, Philipp S Wild91,92, Rodney J Scott93, Elizabeth G
Holliday60, Elin Org61, Margus Viigimaa94,95, Stefania Bandinelli96, Jeffrey E Metter13, Antonio Lupo97, Elisabetta
Trabetti33, Rossella Sorice8, Angela Döring98,99, Eva Lattka100, Konstantin Strauch3,101, Fabian Theis6, Melanie
Waldenberger100, H-Erich Wichmann99,102,103, Gail Davies34, Alan J Gow34,35, Marcel Bruinenberg104, LifeLines
Cohort Study, Ronald P Stolk105, Jaspal S Kooner106,107, Weihua Zhang107,108, Bernhard R Winkelmann109,
Bernhard O Boehm110, Susanne Lucae62, Brenda W Penninx111-113, Johannes H Smit111, Gary Curhan114,
Poorva Mudgal63, Robert M Plenge115,116, Laura Portas44, Ivana Persico44, Mirna Kirin45, James F Wilson45,
Irene Mateo Leach117, Wiek H van Gilst117, Anuj Goel47, Halit Ongen47, Albert Hofman19,48, Fernando
Rivadeneira118,119, Andre G Uitterlinden118,119, Medea Imboden64,65, Arnold von Eckardstein120, Francesco
Cucca49, Ramaiah Nagaraja121, Maria Grazia Piras49, Matthias Nauck66, Claudia Schurmann4, Kathrin Budde66,
Florian Ernst4, Susan M Farrington5, Evropi Theodoratou45, Inga Prokopenko51, Michael Stumvoll122,123, Antti
Jula124, Markus Perola11,52,125, Veikko Salomaa52, So-Youn Shin126, Tim D Spector53, Cinzia Sala7, Paul M
Ridker54,127, Mika Kähönen128, Jorma Viikari129, Christian Hengstenberg130, Christopher P Nelson77,131, the
CARDIoGRAM Consortium132, the DIAGRAM Consortium, the ICBP Consortium, the MAGIC Consortium,
James F Meschia133, Michael A Nalls134, Pankaj Sharma135, Andrew B Singleton134, Naoyuki Kamatani136, Tanja
Zeller59, Michel Burnier137, John Attia60, Maris Laan61, Norman Klopp100, Hans L Hillege36, Stefan Kloiber62,
Hyon Choi114,138, Mario Pirastu44, Silvia Tore44, Nicole M Probst-Hensch64,65, Henry Völzke139, Vilmundur
Gudnason16,17, Afshin Parsa18, Reinhold Schmidt71, John B Whitfield21, Myriam Fornage140,141, Paolo
Gasparini25, David S Siscovick26,142, Ozren Polasek27, Harry Campbell45, Igor Rudan27,45, Nabila Bouatia-Naji28,
Andres Metspalu11,61, Ruth JF Loos30, Cornelia M van Duijn31, Ingrid B Borecki32,143, Luigi Ferrucci13, Giovanni
Gambaro144, Ian J Deary34,35, Bruce HR Wolffenbuttel145, John C Chambers107,108, Winfried März39,146, Peter P
Pramstaller40, Harold Snieder147, Ulf Gyllensten43, Alan F Wright5, Gerjan Navis148, Hugh Watkins47 on behalf of
PROCARDIS, Jacqueline CM Witteman19,48, Serena Sanna49, Sabine Schipf139, Malcolm G Dunlop5, Anke
Tönjes122,123, Samuli Ripatti125, Nicole Soranzo126, Daniela Toniolo7,149, Daniel I Chasman54,127, Olli Raitakari150,
WH Linda Kao2,69, Marina Ciullo8, Caroline S Fox9,151, Mark Caulfield75, Murielle Bochud152, Christian Gieger3
1. Renal Division, Freiburg University Hospital, Freiburg, Germany.
2. Department of Epidemiology, Johns Hopkins Bloomberg School of Public Health, Baltimore, MD, USA.
3. Institute of Genetic Epidemiology, Helmholtz Zentrum München - German Research Center for
Environmental Health, Neuherberg, Germany.
4. Interfaculty Institute for Genetics and Functional Genomics, Ernst-Moritz-Arndt-University Greifswald,
Greifswald, Germany.
5. MRC Human Genetics Unit, MRC IGMM, University of Edinburgh, Edinburgh, UK.
Nature Genetics: doi:10.1038/ng.2352
36
6. Institute of Bioinformatics and Systems Biology, Helmholtz Zentrum München - German Research
Center for Environmental Health, Neuherberg, Germany.
7. Division of Genetics and Cell Biology, San Raffaele Scientific Institute, Italy.
8. Institute of Genetics and Biophysics "A. Buzzati-Traverso" - CNR, Italy.
9. National Heart, Lung, and Blood Institute's Framingham Heart Study and Center for Population Studies,
MA, USA.
10. Renal Division, Massachusetts General Hospital, Boston, MA, USA.
11. Estonian Genome Center, University of Tartu, Tartu, Estonia.
12. Department of Biostatistics, Boston University, MA, USA.
13. Clinical Research Branch, National Institute on Aging, Baltimore, MD, USA.
14. Department of Medical Genetics, University of Lausanne, Switzerland.
15. Swiss Institute of Bioinformatics, Lausanne, Switzerland.
16. Icelandic Heart Association Research Institute, Kopavogur, Iceland.
17. University of Iceland, Reykjavik, Iceland.
18. University of Maryland School of Medicine, Baltimore, MD, USA.
19. Department of Epidemiology, Erasmus Medical Center, Rotterdam, The Netherlands.
20. Department of Medicine, Prince Charles Hospital, Rode Road, Chermside, Queensland 4032,
Australia.
21. Genetic Epidemiology, Queensland Institute of Medical Research, Brisbane, Australia.
22. University of Cambridge, UK.
23. Division of Rheumatology, University of Alabama at Birmingham, Birmingham, Alabama, USA.
24. Birmingham Veterans Affairs Medical Center, University of Alabama at Birmingham, Birmingham,
Alabama, USA.
25. Institute for Maternal and Child Health - IRCCS "Burlo Garofolo"-Trieste, University of Trieste, Italy.
26. Cardiovascular Health Research Unit, University of Washington, Seattle, WA, USA.
27. Faculty of Medicine, University of Split, Croatia, Soltanska 2, Split, 21000, Croatia.
28. CNRS-UMR-8199, Genomics and Molecular Physiology of Metabolic Diseases, Institut Pasteur de
Lille, France.
29. University Lille 1, Laboratory of Mathematics, CNRS-UMR 8524, MODAL team, INRIA Lille
Nord-Europe, France.
30. MRC Epidemiology Unit, Institute of Metabolic Science, Addenbrooke's Hospital, Cambridge, UK.
31. Department of Epidemiology, Subdivision Genetic Epidemiology, Erasmus MC, Rotterdam, The
Netherlands.
32. Division of Statistical Genomics, Department of Genetics, Washington University School of Medicine,
St. Louis, MO, USA.
33. Biology and Genetics section, Department of Life and Reproduction Sciences, University of Verona,
Italy.
34. Department of Psychology, The University of Edinburgh, Edinburgh, UK.
Nature Genetics: doi:10.1038/ng.2352
37
35. Centre for Cognitive Ageing and Cognitive Epidemiology, The University of Edinburgh, Edinburgh, UK.
36. Department of Cardiology, University Medical Center Groningen and University of Groningen,
Groningen, The Netherlands.
37. Institute of Clinical Science, Faculty of Medicine, Imperial College London, UK.
38. LURIC Study nonprofit LLC, Freiburg, Germany.
39. Mannheim Institute of Public Health, Social and Preventive Medicine, Medical Faculty Mannheim,
University of Heidelberg, Mannheim, Germany.
40. Center for Biomedicine, European Academy Bozen/Bolzano (EURAC), Bolzano, Italy. Affiliated
Institute of the University of Lübeck, Germany.
41. Unit of Genetic Epidemiology and Bioinformatics, Department of Epidemiology, University Medical
Center Groningen, University of Groningen, The Netherlands.
42. Uppsala Clinical Research Center, Uppsala University Hospital, Sweden.
43. Department of Immunology, Genetics and Pathology, Rudbeck Laboratory, Uppsala University,
Uppsala, 751 85, Sweden.
44. Institute of Population Genetics - CNR, Italy.
45. Centre for Population Health Sciences, The University of Edinburgh Medical School, Edinburgh,
Scotland, UK.
46. Department of Internal Medicine, University Medical Center Groningen, University of Groningen,
Groningen, The Netherlands.
47. Department of Cardiovascular Medicine, Wellcome Trust Centre for Human Genetics, University of
Oxford, UK.
48. Member of Netherlands Consortium for Healthy Aging (NCHA) sponsored by Netherlands Genomics
Initiative (NGI), Leiden, The Netherlands.
49. Istituto di Ricerca Genetica e Biomedica, Consiglio Nazionale delle Ricerche, Monserrato, Cagliari,
Italy.
50. Roslin Institute. The University of Edinburgh, UK.
51. Wellcome Trust Centre for Human Genetics, University of Oxford, Oxford, UK.
52. Department of Chronic Disease Prevention, National Institute for Health and Welfare (THL), Helsinki,
Finland.
53. King's College London, St. Thomas' Hospital Campus, London, UK.
54. Preventive Medicine, Brigham and Women's Hospital, Boston, MA, USA.
55. University of Tampere and Tampere University Hospital, Tampere, Finland.
56. Department of Physiology, Johns Hopkins University, School of Medicine, Baltimore, MD, USA.
57. Laboratory for Statistical Analysis, Center for Genomic Medicine, RIKEN, Japan.
58. Department of Allergy and Rheumatology, Graduate School of Medicine, University of Tokyo, Tokyo,
Japan.
59. University Heart Center Hamburg, Clinic for general and interventional Cardiology, Hamburg,
Germany.
Nature Genetics: doi:10.1038/ng.2352
38
60. School of Medicine and Public Health, University of Newcastle, Australia.
61. Institute of Molecular and Cell Biology, University of Tartu, Tartu, Estonia.
62. Max Planck Institute of Psychiatry, Munich, Germany.
63. Program in Molecular and Genetic Epidemiology, Harvard School of Public Health, Boston, MA, USA.
64. Swiss Tropical and Public Health Institute, Basel, Switzerland.
65. University of Basel, Basel, Switzerland.
66. Institute of Clinical Chemistry and Laboratory Medicine, University Medicine Greifswald,
Ernst-Moritz-Arndt University Greifswald, Greifswald, Germany.
67. Laboratory of Epidemiology, Demography and Biometry, National Institute on Aging, Bethesda, MD,
USA.
68. University of Texas Health Science Center at Houston, TX, USA.
69. Welch Center for Prevention, Epidemiology and Clinical Research, John Hopkins University, Baltimore,
MD, USA.
70. Institute of Molecular Biology and Biochemistry, Medical University Graz, Austria.
71. Department of Neurology, Section of Special Neurology, Medical University Graz, Austria.
72. Laboratory for Genotyping Development, Center for Genomic Medicine, RIKEN, Japan.
73. Laboratory of Molecular Medicine, Human Genome Center, Institute of Medical Science, University of
Tokyo, Japan.
74. Laboratory for Cardiovascular Diseases, Center for Genomic Medicine, RIKEN, Japan.
75. William Harvey Research Institute, Barts and The London School of Medicine and Dentistry, Queen
Mary University of London, UK.
76. Leicester NIHR Biomedical Research Unit in Cardiovascular Disease, Glenfield Hospital, Leicester,
UK.
77. Department of Cardiovascular Sciences, University of Leicester, Leicester, UK.
78. Division of Epidemiology and Community Health, University of Minnesota, Minneapolis, MN, USA.
79. Department of Preventive Medicine, Feinberg School of Medicine, Northwestern University, Chicago,
IL, USA.
80. Intitute for Maternal and Child Health - IRCCS "Burlo Garofolo" - Trieste, Italy.
81. Medical Genetics Institute, Cedars-Sinai Medical Center, Los Angeles, CA, USA.
82. Group Health Research Institute, Group Health Cooperative, Seattle, WA, USA.
83. Departments of Medicine, Epidemiology and Health Services, University of Washington, Seattle, WA,
USA.
84. Department of Medicine, Internal Medicine, Lausanne University Hospital, Lausanne, Switzerland.
85. Institute of Physiology, Zurich Center for Integrative Human Physiology (ZIHP), University of Zurich,
Switzerland.
86. University Paris Sud 11, UMRS 1018, Villejuif, France.
87. Department of Genomics of Common Disease, School of Public Health, Imperial College London,
Hammersmith Hospital, London, UK.
Nature Genetics: doi:10.1038/ng.2352
39
88. Competence Centre on Reproductive Medicine and Biology, Tartu, Estonia.
89. Department of Obstetrics and Gynecology, University of Tartu, Tartu, Estonia.
90. Clinical Gerontology Unit, Addenbrooke's Hospital, Cambridge, UK.
91. Department of Medicine II , University Medical Center Mainz, Johannes Gutenberg University Mainz,
Germany.
92. Center for Thrombosis and Hemostasis, University Medical Center Mainz, Johannes Gutenberg
University Mainz, Germany.
93. School of Biomedical Sciences and Pharmacy, University of Newcastle, Australia.
94. Tallinn University of Technology, Department of Biomedical Engineering, Chair of Medical Physics,
Tallinn, Estonia.
95. Centre of Cardiology, North Estonia Medical Centre, Tallinn, Estonia
96. Geriatric Unit, Azienda Sanitaria Firenze (ASF), Florence, Italy.
97. Division of Nephrology, Department of Medicine, University of Verona, Italy.
98. Institute of Epidemiology II, Helmholtz Zentrum München - German Research Center for
Environmental Health, Neuherberg, Germany.
99. Institute of Epidemiology I, Helmholtz Zentrum München - German Research Center for Environmental
Health, Neuherberg, Germany.
100. Research Unit of Molecular Epidemiology, Helmholtz Zentrum München - German Research Center for
Environmental Health, Neuherberg, Germany.
101. Institute of Medical Informatics, Biometry and Epidemiology, Chair of Genetic Epidemiology,
Ludwig-Maximilians-University, Munich, Germany.
102. Institute of Medical Informatics, Biometry and Epidemiology, Chair of Epidemiology,
Ludwig-Maximilians-University, Munich, Germany.
103. Klinikum Grosshadern, Munich, Germany.
104. University Medical Center Groningen and University of Groningen, The Netherlands.
105. Department of Epidemiology, University Medical Center Groningen and University of Groningen, The
Netherlands.
106. Faculty of Medicine, National Heart & Lung Institute, Cardiovascular Science, Hammersmith Hospital,
Hammersmith Campus, Imperial College London, UK.
107. Cath Lab, Cardiology, Ealing Hospital, Southall, Middlesex, UK.
108. Department of Epidemiology and Biostatistics, School of Public Health, Imperical College London, UK.
109. Cardiology Group, Frankfurt-Sachsenhausen, Germany.
110. Division of Endocrinology and Diabetes, Department of Medicine, University Hospital, Ulm, Germany.
111. Department of Psychiatry/EMGO Institute, VU University Medical Centre, Amsterdam, the
Netherlands.
112. Department of Psychiatry, University Medical Centre Groningen, University of Groningen, Groningen,
the Netherlands.
113. Department of Psychiatry, Leiden University Medical Center, Leiden, the Netherlands.
Nature Genetics: doi:10.1038/ng.2352
40
114. Channing Laboratory, Department of Medicine, Brigham and Women's Hospital, Harvard Medical
School, Boston, MA, USA.
115. Brigham and Women's Hospital, Division of Rheumatology, Immunology and Allergy, Division of
Genetics, Boston, MA, USA.
116. Broad Institute of MIT and Harvard, Cambridge, MA, USA.
117. Division of Experimental Cardiology, Department of Cardiology, University Medical Center Groningen,
University of Groningen, Groningen, The Netherlands.
118. Department of Internal Medicine, Erasmus Medical Center, Rotterdam, The Netherlands.
119. Department of Epidemiology, Erasmus Medical Center, Rotterdam, The Netherlands + Member of
Netherlands Consortium for Healthy Aging (NCHA) sponsored by Netherlands Genomics Initiative
(NGI), Leiden, The Netherlands.
120. Institute of Clinical Chemistry, University Hospital of Zurich, Zurich, Switzerland.
121. Laboratory of Genetics, National Institute on Aging, Baltimore, MD, USA.
122. Medical Department, University of Leipzig, Leipzig, Germany.
123. IFB AdiposityDiseases, University of Leipzig, Leipzig, Germany.
124. Department of Chronic Disease Prevention, National Institute for Health and Welfare (THL), Turku,
Finland.
125. University of Helsinki, Institute of Molecular Medicine, Helsinki, Finland.
126. Human Genetics, Wellcome Trust Sanger Institute, Hinxton, UK.
127. Harvard Medical School, Boston, MA, USA.
128. Department of Clinical Physiology, University of Tampere and Tampere University Hospital, Tampere,
Finland.
129. Department of Medicine, University of Turku, and Turku University Hospital, Turku, Finland.
130. University Hospital Regensburg, Regensburg, Germany.
131. NIHR Cardiovascular Biomedical Research Unit, Glenfield Hospital, Leicester, UK.
132. A full list of CARDIoGRAM Consortium members can be found in the Supplementary Materials.
133. Department of Neurology, Mayo Clinic, Jacksonville, FL, USA.
134. Molecular Genetics Section, Laboratory of Neurogenetics, NIA, NIH, Bethesda, MD, USA.
135. Imperial College Cerebrovascular Research Unit, Imperial College London, London, UK.
136. Laboratory for International Alliance, Center for Genomic Medicine, RIKEN, Japan.
137. Department of Medicine, Nephrology Division, Lausanne University Hospital, Lausanne, Switzerland.
138. Section of Rheumatology and the Clinical Epidemiology Unit, Boston University School of Medicine,
Boston, MA, USA.
139. Institute for Community Medicine, University Medicine Greifswald, Greifswald, Germany.
140. University of Texas - Houston Institute of Molecular Medicine, TX, USA.
141. University of Texas - Houston School of Public Health, TX, USA.
142. Departments of Medicine and Epidemiology, University of Washington, Seattle, WA, USA.
143. Division of Biostatistics, Washington University School of Medicine, Saint Louis, MO, USA.
Nature Genetics: doi:10.1038/ng.2352
41
144. Institute of Internal Medicine, Renal Program, Columbus-Gemelli University Hospital, Catholic
University, Rome, Italy.
145. Department of Endocrinology, University Medical Center Groningen and University of Groningen, The
Netherlands.
146. Synlab Centre of Laboratory Diagnostics, Heidelberg, Germany.
147. Department of Epidemiology, University Medical Center Groningen, University of Groningen, The
Netherlands.
148. Division of Nephrology, Department of Internal Medicine, University Medical Center Groningen,
University of Groningen, Groningen, The Netherlands.
149. Institute of Molecular Genetics-CNR, Pavia, Italy.
150. Research Centre of Applied and Preventive Cardiovascular Medicine, University of Turku and the
Department of Clinical Physiology and Nuclear Medicine, Turku University Hospital, Turku, Finland.
151. Division of Endocrinology, Brigham and Women's Hospital and Harvard Medical School, Boston, MA,
USA.
152. University Institute of Social and Preventive Medicine, Lausanne, Switzerland.
Nature Genetics: doi:10.1038/ng.2352
42
REFERENCES
1. Nakamura Y. The BioBank Japan Project. Clin Adv Hematol Oncol 5, 696-697 (2007).
2. Kamatani Y et al. Genome-wide association study of hematological and biochemical traits in a Japanese
population. Nat Genet 42, 210-215 (2010).
3. Okada Y et al. Genome-wide association study for C-reactive protein levels identified pleiotropic
associations in the IL6 locus. Hum Mol Genet 20, 1224-1231 (2011).
4. Okada Y et al. Identification of nine novel loci associated with white blood cell subtypes in a Japanese
population. PLoS Genet 7, e1002067 (2011).
5. Okada Y et al. Common variants at CDKAL1 and KLF9 are associated with body mass index in east
Asian populations. Nat Genet 44, 302-306 (2012).
6. Kato N et al. Meta-analysis of genome-wide association studies identifies common variants associated
with blood pressure variation in east Asians. Nat Genet 43, 531-538 (2011).
7. Hughes K et al. Cardiovascular diseases in Chinese, Malays, and Indians in Singapore. II. Differences in
risk factor levels. J Epidemiol Community Health 44, 29-35 (1990).
8. Tan CE, Emmanuel SC, Tan BY, Jacob E. Prevalence of diabetes and ethnic differences in
cardiovascular risk factors. The 1992 Singapore National Health Survey. Diabetes Care 22, 241-247
(1999).
9. Hughes K, Aw TC, Kuperan P, Choo M. Central obesity, insulin resistance, syndrome X, lipoprotein(a),
and cardiovascular risk in Indians, Malays, and Chinese in Singapore. J Epidemiol Community Health 51,
394-399 (1997).
10. Cutter J, Tan BY, Chew SK. Levels of cardiovascular disease risk factors in Singapore following a
national intervention programme. Bull World Health Organ 79, 908-915 (2001).
11. Foong AW et al. Rationale and methodology for a population-based study of eye diseases in Malay
people: The Singapore Malay eye study (SiMES). Ophthalmic Epidemiol 14, 25-35 (2007).
12. Lavanya R et al. Methodology of the Singapore Indian Chinese Cohort (SICC) eye study: quantifying
ethnic variations in the epidemiology of eye diseases in Asians. Ophthalmic Epidemiol 16, 325-336
(2009).
13. Cho YS et al. A large-scale genome-wide association study of Asian populations uncovers genetic
factors influencing eight quantitative traits. Nat Genet 41, 527-534 (2009).
14. Kim YJ et al. Large-scale genome-wide association studies in east Asians identify new genetic loci
influencing metabolic traits. Nat Genet 43, 990-995 (2011).
15. Pan WH et al. Han Chinese cell and genome bank in Taiwan: purpose, design and ethical considerations.
Hum Hered 61, 27-30 (2006).
Nature Genetics: doi:10.1038/ng.2352
43
16. Tsai FJ et al. A genome-wide association study identifies susceptibility variants for type 2 diabetes in
Han Chinese. PLoS Genet 6, e1000847 (2010).
17. Lin HJ et al. Single-nucleotide polymorphisms in chromosome 3p14.1- 3p14.2 are associated with
susceptibility of type 2 diabetes with cataract. Mol Vis 16, 1206-1214 (2010).
18. GenSalt Collaborative Research Group. GenSalt: rationale, design, methods and baseline
characteristics of study participants. J Hum Hypertens 21, 639-646 (2007).
19. Takeuchi F et al. Blood pressure and hypertension are associated with 7 loci in the Japanese population.
Circulation 121, 2302-2309 (2010).
20. Takeuchi F et al. Confirmation of multiple risk Loci and genetic impacts by a genome-wide association
study of type 2 diabetes in the Japanese population. Diabetes 58, 1690-1699 (2009).
21. Yamaguchi-Kabata Y et al. Japanese population structure, based on SNP genotypes from 7003
individuals compared to other ethnic groups: effects on population-based association studies. Am J Hum
Genet 83, 445-456 (2008).
22. Horio M, Imai E, Yasuda Y, Watanabe T, Matsuo S. Modification of the CKD epidemiology collaboration
(CKD-EPI) equation for Japanese: accuracy and use for population estimates. Am J Kidney Dis 56,
32-38 (2010).
23. Devlin B, Roeder K. Genomic control for association studies. Biometrics 55, 997-1004 (1999).
24. de Bakker PI et al. Practical aspects of imputation-driven meta-analysis of genome-wide association
studies. Hum Mol Genet 17, R122-R128 (2008).
25. Chambers JC et al. Genetic loci influencing kidney function and chronic kidney disease. Nat Genet 42,
373-375 (2010).
26. Gudbjartsson DF et al. Association of variants at UMOD with chronic kidney disease and kidney
stones-role of age and comorbid diseases. PLoS Genet 6, e1001039 (2010).
27. Köttgen A et al. New loci associated with kidney function and chronic kidney disease. Nat Genet 42,
376-384 (2010).
28. Köttgen A et al. Multiple loci associated with indices of renal function and chronic kidney disease. Nat
Genet 41, 712-717 (2009).
29. Albrecht E et al. Common variants identified by meta-analysis of 110,238 individuals associate with
serum urate. 60th Annual Meeting of the American Society of Human Genetics (2011).
30. Li S et al. The GLUT9 gene is associated with serum uric acid levels in Sardinia and Chianti cohorts.
PLoS Genet 3, e194 (2007).
31. Wallace C et al. Genome-wide association study identifies genes for biomarkers of cardiovascular
disease: serum urate and dyslipidemia. Am J Hum Genet 82, 139-149 (2008).
Nature Genetics: doi:10.1038/ng.2352
44
32. Döring A et al. SLC2A9 influences uric acid concentrations with pronounced sex-specific effects. Nat
Genet 40, 430-436 (2008).
33. Dehghan A et al. Association of three genetic loci with uric acid concentration and risk of gout: a
genome-wide association study. Lancet 372, 1953-1961 (2008).
34. Vitart V et al. SLC2A9 is a newly identified urate transporter influencing serum urate concentration, urate
excretion and gout. Nat Genet 40, 437-442 (2008).
35. Kolz M et al. Meta-analysis of 28,141 individuals identifies common variants within five new loci that
influence uric acid concentrations. PLoS Genet 5, e1000504 (2009).
36. Yang Q et al. Multiple genetic loci influence serum urate levels and their relationship with gout and
cardiovascular disease risk factors. Circ Cardiovasc Genet 3, 523-530 (2010).
37. Johnson AD et al. SNAP: a web-based tool for identification and annotation of proxy SNPs using
HapMap. Bioinformatics 24, 2938-2939 (2008).
38. Price AL et al. Principal components analysis corrects for stratification in genome-wide association
studies. Nat Genet 38, 904-909 (2006).
39. The International HapMap Consortium. The International HapMap Project. Nature 426, 789-796 (2003).
40. Li Y, Willer CJ, Ding J, Scheet P, Abecasis GR. MaCH: using sequence and genotype data to estimate
haplotypes and unobserved genotypes. Genet Epidemiol 34, 816-834 (2010).
41. Nang EE et al. Is there a clear threshold for fasting plasma glucose that differentiates between those
with and without neuropathy and chronic kidney disease?: the Singapore Prospective Study Program.
Am J Epidemiol 169, 1454-1462 (2009).
42. Sim X et al. Transferability of type 2 diabetes implicated loci in multi-ethnic cohorts from Southeast Asia.
PLoS Genet 7, e1001363 (2011).
43. Teo YY et al. Singapore Genome Variation Project: a haplotype map of three Southeast Asian
populations. Genome Res 19, 2154-2162 (2009).
44. Marchini J, Howie B, Myers S, McVean G, Donnelly P. A new multipoint method for genome-wide
association studies by imputation of genotypes. Nat Genet 39, 906-913 (2007).
45. Howie BN, Donnelly P, Marchini J. A flexible and accurate genotype imputation method for the next
generation of genome-wide association studies. PLoS Genet 5, e1000529 (2009).
46. Levey AS, Greene T, Kusek JW. A simplified equation to predict glomerular filtration rate from serum
creatinine. J Am Soc Nephrol 11, 155A (2000).
47. Purcell S et al. PLINK: a tool set for whole-genome association and population-based linkage analyses.
Am J Hum Genet 81, 559-575 (2007).
48. Abecasis GR, Cherny SS, Cookson WO, Cardon LR. GRR: graphical representation of relationship
Nature Genetics: doi:10.1038/ng.2352
45
errors. Bioinformatics 17, 742-743 (2001).
49. O'Connell JR, Weeks DE. PedCheck: a program for identification of genotype incompatibilities in linkage
analysis. Am J Hum Genet 63, 259-266 (1998).
50. Browning BL, Browning SR. A unified approach to genotype imputation and haplotype-phase inference
for large data sets of trios and unrelated individuals. Am J Hum Genet 84, 210-223 (2009).
Nature Genetics: doi:10.1038/ng.2352