Embed Size (px)
Citation preview
1
Spatially orthogonal chemical functionalization of a hierarchical pore network for catalytic
cascade reactions
Christopher M.A. Parlett1, Mark A. Isaacs1, Simon K. Beaumont2, Laura M. Bingham2, Nicole S. Hondow3,
Karen Wilson1 & Adam F. Lee1*
1European Bioenergy Research Institute, Aston University, Birmingham B4 7ET, UK 2Department of Chemistry, University of Durham, Durham DH1 3LE, UK 3Institute for Materials Research, University of Leeds, Leeds LS2 9JT, UK
Material synthesis
Supplementary Figure 1| Polystyrene colloidal nanosphere hard template. (left) SEM micrographs of centrifuged array of PS colloidal nanospheres, and (right) dynamic light scattering particle size distribution.
0
5
10
15
20
25
30
Cou
nts
Polystyrene particle size / nm
SUPPLEMENTARY INFORMATIONDOI: 10.1038/NMAT4478
NATURE MATERIALS | www.nature.com/naturematerials 1
© 2015 Macmillan Publishers Limited. All rights reserved

2
Supplementary Figure 2| Selective removal of polystyrene macropore template. (top) N2 adsorption-
desorption isotherms, and (bottom) macropore surface area of as-synthesised and sub-ambient, toluene-
extracted macroporous silica as a function of extraction cycle. Negligible mesoporosity was observed in all
cases. Five extraction cycles were employed for all macroporous materials functionalised in this work.
0
5
10
15
20
25
0 1 2 3 4 5
Ma
cro
po
re s
urf
ace
are
a / m
2.g
-1
Number of toluene extractions
0
20
40
60
80
100
120
140
0 0.2 0.4 0.6 0.8 1
N2 v
olu
me
/ c
m3.g
-1
Relative pressure / P/P0
Adsorption
Desorption
As-synthesised
Extraction cycle:
4
3
2
1
5
© 2015 Macmillan Publishers Limited. All rights reserved

3
Supplementary Figure 3| Hydrophobisation of macroporous silica by triethoxyoctylsilane and mesopore
template retention. (top) N2 adsorption-desorption isotherms, and (top inset) BJH pore size distribution of
macroporous silica after octyl functionalisation; lack of mesoporosity confirms retention of P123 template
during hydrophobisation process. (bottom) Water contact angle analysis of macroporous silica (left) before
and (right) after octyl functionalisation.
0
5
10
15
20
25
30
35
40
45
50
0.0 0.2 0.4 0.6 0.8 1.0
N2 v
olu
me
/
cm
3.g
-1
Relative pressure / P/Po
Adsorption
Desorption
Surface area = 19 m2
.g-1
Macroporous silica
Before octyl-
grafting
Macroporous silica
After octyl-
grafting
Fully wetted
137 °
Strongly hydrophobic
0.0
0.5
1.0
2 4 6 8 10
dV
(lo
gd
) /
a.u
.
Pore diameter / nm
© 2015 Macmillan Publishers Limited. All rights reserved

4
Supplementary Figure 4| Removal of P123 mesopore soft template and resulting ordered mesoporosity.
(a) Thermogravimetric profiles during temperature-programmed oxidation of octyl-functionalised
macroporous silica under flowing 80:20 v/v N2/O2 (20 cm3.min
-1 and 10 °C.min
-1 ramp rate) before and after
extraction of P123 mesopore template by methanol reflux. Decrease in the mass of combustible matter and
absence of characteristic P123 exotherm after methanol reflux demonstrates successful mesopore template
extraction. (b, main) N2 adsorption-desorption isotherms, and (b, inset) BJH pore size distribution of
methanol-extracted, octyl-functionalised macroporous silica, confirming removal of P123 mesopore template,
and (c) low angle XRD evidencing p6mm ordered mesophase characteristic of SBA-15.
50
100
150
200
250
300
0.0 0.5 1.0
N2 v
olu
me
/
cm
3.g
-1
Relative pressure / P/P0
Adsorption
Desorption
0 1 2 3 4 5 6
Inte
nsity / a
.u.
2 / °
-2
0
2
4
6
8
10
12
14
16
18
0
10
20
30
40
50
60
70
80
90
100
0 100 200 300 400 500 600
Hea
t flow
/ mV
Ma
ss /
%
Temperature / ° C
Octyl-functionalised Post P123 extraction
P12
3 c
om
bustion
Surface area = 300 m2
.g-1
Mesopore diameter = 3.5 nm Mesopore range = 2.5 -3.75 nm
0
1
2
3
2 4 6 8 10
dV
(lo
gd
) /
a.u
.
Diameter / nm
(100)
(110) (200)
a
b c
© 2015 Macmillan Publishers Limited. All rights reserved

5
Supplementary Figure 5| Importance of macropore hydrophobisation. (a, c, e) HRTEM bright-field and
(b, d, f) HAADF-STEM micrographs of a hierarchical macroporous-mesoporous SBA-15 functionalised with
Pt nanoparticles, without octyl pre-functionalisation of macropores. Pt nanoparticles are randomly distributed
throughout the entire bimodal pore network, and (g) exhibit a broad particle size distribution with a significant
fraction of particles >3.5 nm, i.e. larger than the mesopores, which must be present within the macropores.
This highlights the importance of octyl pre-functionalization of the macropores in controlling the size and
location of Pt within the framework.
a
b
c
d
e
Macropore surface
Mespore channels
Macropore
f
Mespore
g
0
10
20
30
40
50
60
70
80
90
100
0
5
10
15
20
25
0.5
1 1.5
2 2.5
3 3.5
4 4.5
5 6 7 8
Cum
ula
tive
/ %
Fre
qu
en
cy /
%
Pt particle size / nm
Frequency
Cumulative
© 2015 Macmillan Publishers Limited. All rights reserved
6
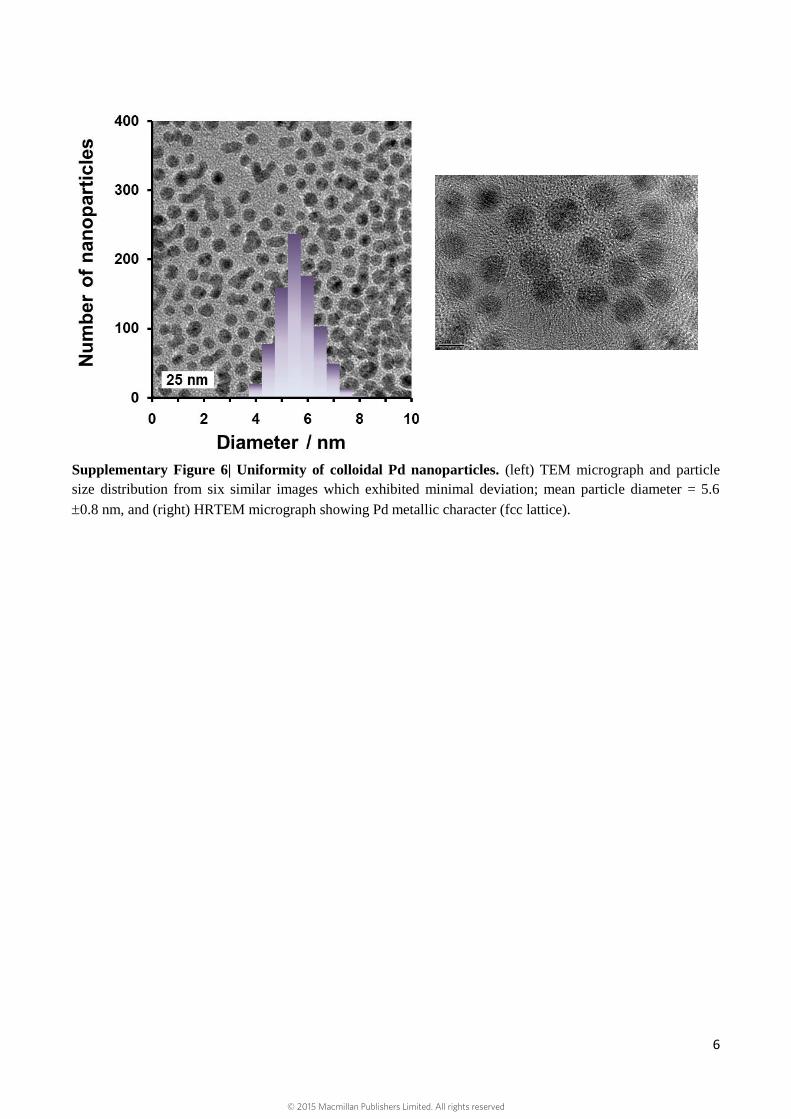
Supplementary Figure 6| Uniformity of colloidal Pd nanoparticles. (left) TEM micrograph and particle
size distribution from six similar images which exhibited minimal deviation; mean particle diameter = 5.6
0.8 nm, and (right) HRTEM micrograph showing Pd metallic character (fcc lattice).
© 2015 Macmillan Publishers Limited. All rights reserved

7
Supplementary Figure 7| Independent functionalisation of either macropores or mesopores. (a) SEM
and (b) DF-STEM micrographs of a hierarchical macroporous-mesoporous SBA-15 functionalised with
colloidal Pd nanoparticles exclusively within macropores; all particles are common to both images, i.e. no
particles reside within the mesopore framework. (c,e) SEM and (d,f) DF-STEM and (g) backscattered SEM
micrographs of a hierarchical macroporous-mesoporous SBA-15 functionalised with Pt nanoparticles
exclusively within mesopores channels; no particles are visible either within, or on the surface, of macropores.
c
d
e
f
gMacropore surfaceMacropore network
Mespore channels
+ Pt nanoparticles
Pt nanoparticles
Macropore network
a b
© 2015 Macmillan Publishers Limited. All rights reserved
8
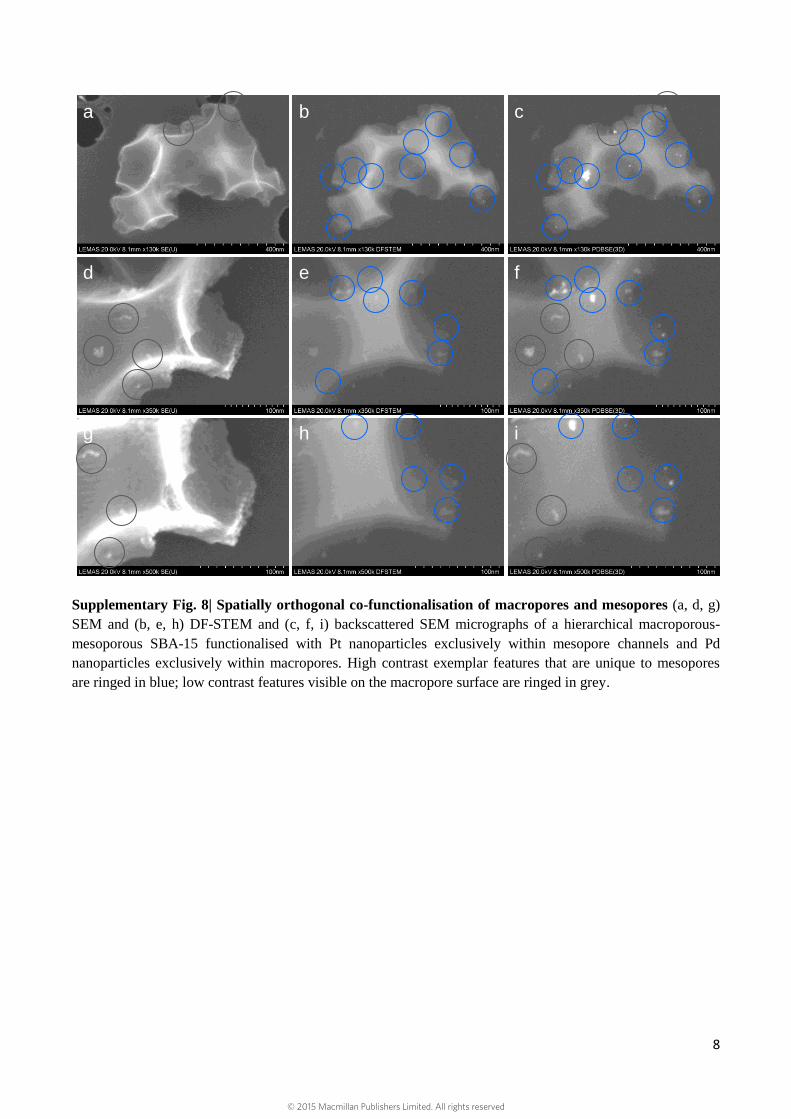
Supplementary Fig. 8| Spatially orthogonal co-functionalisation of macropores and mesopores (a, d, g)
SEM and (b, e, h) DF-STEM and (c, f, i) backscattered SEM micrographs of a hierarchical macroporous-
mesoporous SBA-15 functionalised with Pt nanoparticles exclusively within mesopore channels and Pd
nanoparticles exclusively within macropores. High contrast exemplar features that are unique to mesopores
are ringed in blue; low contrast features visible on the macropore surface are ringed in grey.
a
d
b
e
c
f
g h i
© 2015 Macmillan Publishers Limited. All rights reserved

9
Supplementary Figure 9| Incorporation of larger metallic Pd nanoparticles. Powder XRD patterns for a
hierarchical macroporous-mesoporous SBA-15 functionalised with either Pd nanoparticles exclusively within
the macropores, Pt nanoparticles exclusively within the mesopores, or Pd within the macropores and Pt within
the mesopores. Only reflections characteristic of fcc Pd crystallites of ~5 nm volume averaged diameter are
apparent; the absence of reflections attributable to any Pt phase is consistent with sub-3 nm particles below the
XRD sensitivity limit.
10 20 30 40 50 60 70 80
2 / °
Pd Macro-Pt Meso
Pd Macro
Pt Meso
fcc (111) 5 nm Pd NPs
© 2015 Macmillan Publishers Limited. All rights reserved

10
Supplementary Table 1| Localisation of Pd and Pt within respective macropore and mesopores.
Porosimetry employing N2 physisorption identified minimal change in the average textural properties of the
(fully detemplated) hydrophobised hierarchical macroporous-mesoporous SBA-15 following the introduction
of 5 nm colloidal Pd nanoparticles, consistent with their selective incorporation within macropores. In
contrast, wet impregnation of the (detemplated) hydrophobised hierarchical macroporous-mesoporous SBA-
15 resulted in significant loss of BET and mesopore areas and mesopore volume, consistent with Pt
incorporation within mesopores. Textural properties of hierarchical macroporous-mesoporous SBA-15
functionalised with both Pd and Pt via our new synthetic route were akin to those of the Pt mesopore only
material.
Material BET m2.g-1
BET
area
/ %
DFT mesopore
volume
/ cm3
Mesopore
volume
/ %
DFT mesopore
area
/ m2.g-1
Mesopore
area
/ %
BJH
mesopore
diameter
/ nm
Hydrophobised
hierarchical SBA-15 297
0.33
235
3.6
Pd (macropores only)
hierarchical SBA-15 282 -5 0.34 6 246 5 3.6
Pt (mesopores only)
hierarchical SBA-15 216 -27 0.26 -21 170 -28 3.6
Pd macroporous-Pt
mesoporous SBA-15 191 -36 0.24 -26 162 -31 3.6
Supplementary Figure 10| Illustration of spatial control for cascade reactions. Spatially orthogonal
functionalization of hierarchical pore network affords precise control over reaction sequence in catalytic
cascades: Substrate entering macropores first encounters active species A (Pd NPs shown in blue) to form
Product 1, which subsequently diffuses into interconnected mesopores to undergo reaction over active
species B (Pt NPs shown in grey) to form Product 2. Undesired reaction of Substrate with active species B is
prohibited by the hierarchical nature of mesopore accessibility via macropores.
1
2
© 2015 Macmillan Publishers Limited. All rights reserved
11
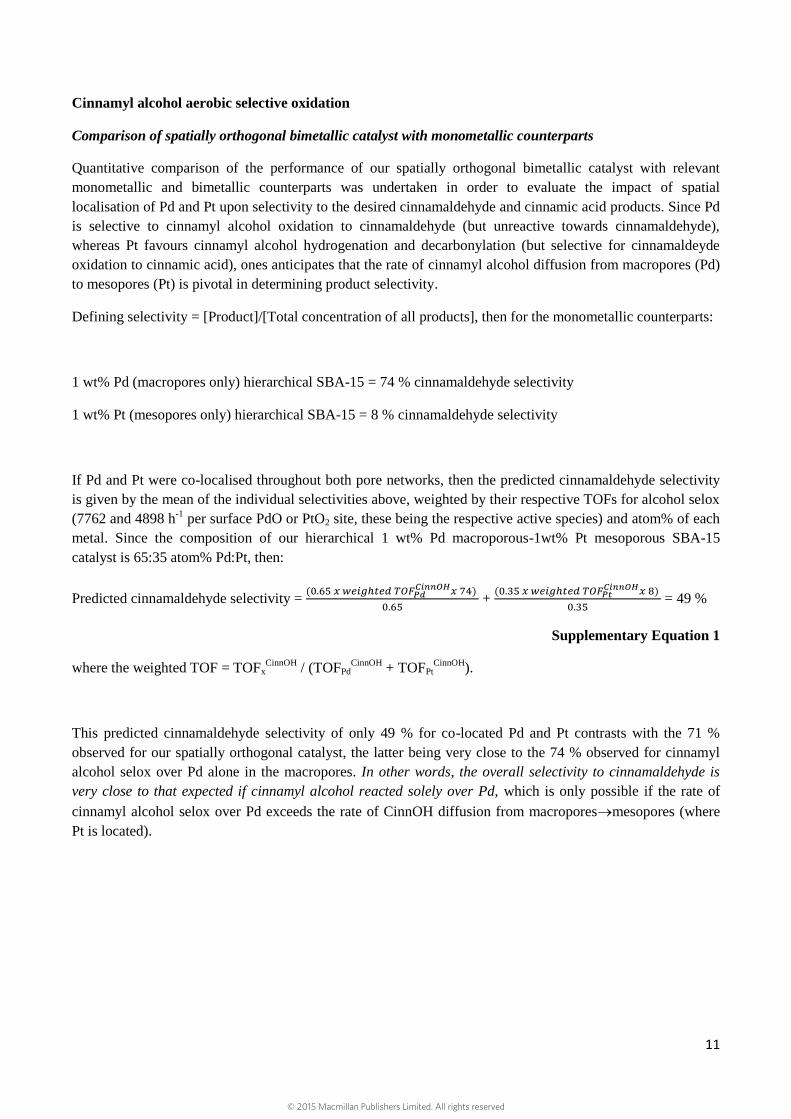
Cinnamyl alcohol aerobic selective oxidation
Comparison of spatially orthogonal bimetallic catalyst with monometallic counterparts
Quantitative comparison of the performance of our spatially orthogonal bimetallic catalyst with relevant
monometallic and bimetallic counterparts was undertaken in order to evaluate the impact of spatial
localisation of Pd and Pt upon selectivity to the desired cinnamaldehyde and cinnamic acid products. Since Pd
is selective to cinnamyl alcohol oxidation to cinnamaldehyde (but unreactive towards cinnamaldehyde),
whereas Pt favours cinnamyl alcohol hydrogenation and decarbonylation (but selective for cinnamaldeyde
oxidation to cinnamic acid), ones anticipates that the rate of cinnamyl alcohol diffusion from macropores (Pd)
to mesopores (Pt) is pivotal in determining product selectivity.
Defining selectivity = [Product]/[Total concentration of all products], then for the monometallic counterparts:
1 wt% Pd (macropores only) hierarchical SBA-15 = 74 % cinnamaldehyde selectivity
1 wt% Pt (mesopores only) hierarchical SBA-15 = 8 % cinnamaldehyde selectivity
If Pd and Pt were co-localised throughout both pore networks, then the predicted cinnamaldehyde selectivity
is given by the mean of the individual selectivities above, weighted by their respective TOFs for alcohol selox
(7762 and 4898 h-1
per surface PdO or PtO2 site, these being the respective active species) and atom% of each
metal. Since the composition of our hierarchical 1 wt% Pd macroporous-1wt% Pt mesoporous SBA-15
catalyst is 65:35 atom% Pd:Pt, then:
Predicted cinnamaldehyde selectivity = (0.65 𝑥 𝑤𝑒𝑖𝑔ℎ𝑡𝑒𝑑 𝑇𝑂𝐹𝑃𝑑
𝐶𝑖𝑛𝑛𝑂𝐻𝑥 74)
0.65 +
(0.35 𝑥 𝑤𝑒𝑖𝑔ℎ𝑡𝑒𝑑 𝑇𝑂𝐹𝑃𝑡𝐶𝑖𝑛𝑛𝑂𝐻𝑥 8)
0.35 = 49 %
Supplementary Equation 1
where the weighted TOF = TOFxCinnOH
/ (TOFPdCinnOH
+ TOFPtCinnOH
).
This predicted cinnamaldehyde selectivity of only 49 % for co-located Pd and Pt contrasts with the 71 %
observed for our spatially orthogonal catalyst, the latter being very close to the 74 % observed for cinnamyl
alcohol selox over Pd alone in the macropores. In other words, the overall selectivity to cinnamaldehyde is
very close to that expected if cinnamyl alcohol reacted solely over Pd, which is only possible if the rate of
cinnamyl alcohol selox over Pd exceeds the rate of CinnOH diffusion from macroporesmesopores (where
Pt is located).
© 2015 Macmillan Publishers Limited. All rights reserved
12
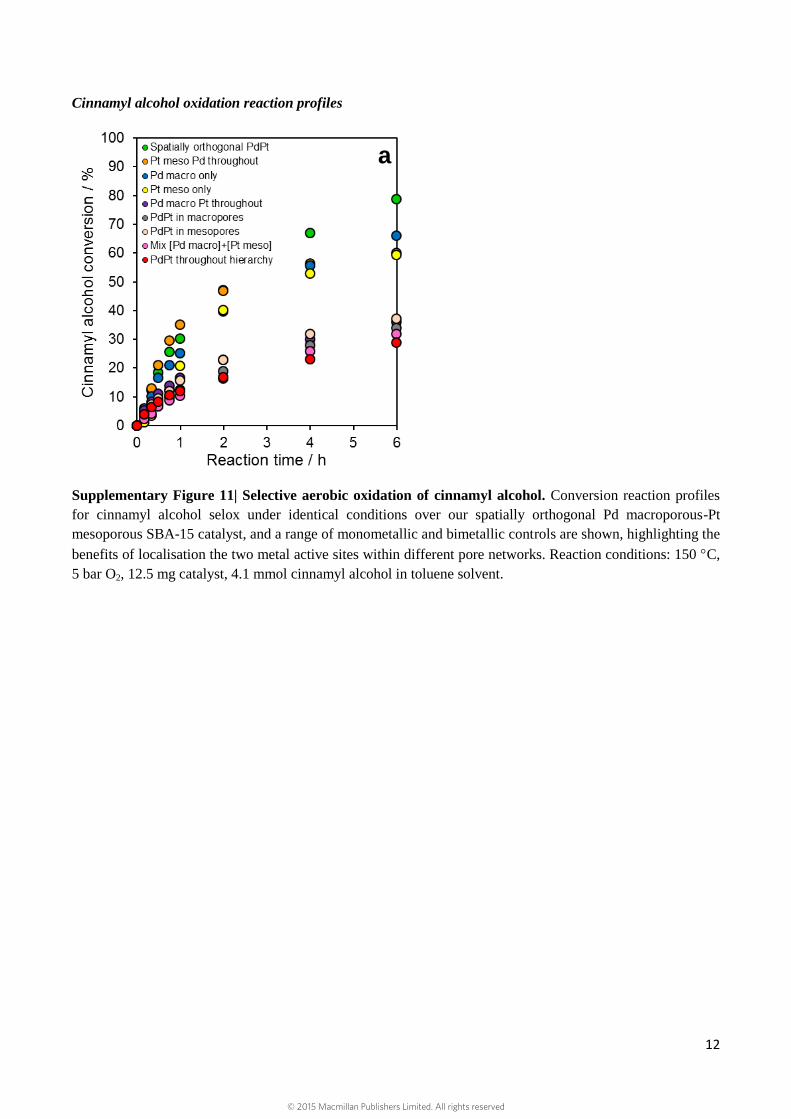
Cinnamyl alcohol oxidation reaction profiles
Supplementary Figure 11| Selective aerobic oxidation of cinnamyl alcohol. Conversion reaction profiles
for cinnamyl alcohol selox under identical conditions over our spatially orthogonal Pd macroporous-Pt
mesoporous SBA-15 catalyst, and a range of monometallic and bimetallic controls are shown, highlighting the
benefits of localisation the two metal active sites within different pore networks. Reaction conditions: 150 C,
5 bar O2, 12.5 mg catalyst, 4.1 mmol cinnamyl alcohol in toluene solvent.
a
d
© 2015 Macmillan Publishers Limited. All rights reserved
13
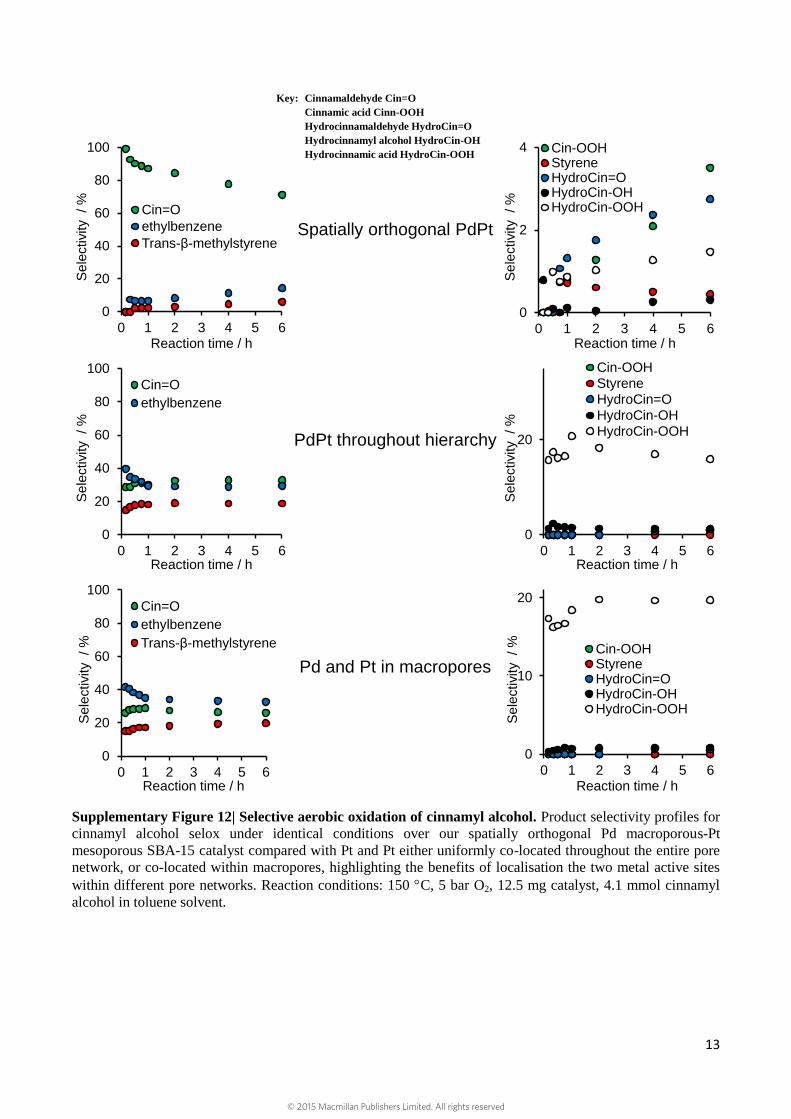
Supplementary Figure 12| Selective aerobic oxidation of cinnamyl alcohol. Product selectivity profiles for
cinnamyl alcohol selox under identical conditions over our spatially orthogonal Pd macroporous-Pt
mesoporous SBA-15 catalyst compared with Pt and Pt either uniformly co-located throughout the entire pore
network, or co-located within macropores, highlighting the benefits of localisation the two metal active sites
within different pore networks. Reaction conditions: 150 C, 5 bar O2, 12.5 mg catalyst, 4.1 mmol cinnamyl
alcohol in toluene solvent.
Spatially orthogonal PdPt
0
20
40
60
80
100
0 1 2 3 4 5 6
Sele
ctivity / %
Reaction time / h
Cin=O
ethylbenzene
Trans-β-methylstyrene
0
2
4
0 1 2 3 4 5 6
Sele
ctivity / %
Reaction time / h
Cin-OOHStyreneHydroCin=OHydroCin-OHHydroCin-OOH
0
20
40
60
80
100
0 1 2 3 4 5 6
Sele
ctivity / %
Reaction time / h
Cin=O
ethylbenzene
0
20
0 1 2 3 4 5 6
Sele
ctivity / %
Reaction time / h
Cin-OOH
StyreneHydroCin=OHydroCin-OH
HydroCin-OOHPdPt throughout hierarchy
Pd and Pt in macropores
0
20
40
60
80
100
0 1 2 3 4 5 6
Sele
ctivity / %
Reaction time / h
Cin=O
ethylbenzene
Trans-β-methylstyrene
0
10
20
0 1 2 3 4 5 6
Sele
ctivity / %
Reaction time / h
Cin-OOHStyreneHydroCin=OHydroCin-OHHydroCin-OOH
Key: Cinnamaldehyde Cin=O
Cinnamic acid Cinn-OOH
Hydrocinnamaldehyde HydroCin=O
Hydrocinnamyl alcohol HydroCin-OH
Hydrocinnamic acid HydroCin-OOH
© 2015 Macmillan Publishers Limited. All rights reserved

14
Supplementary Figure 13| Selective aerobic oxidation of cinnamyl alcohol. Product selectivity reaction
profiles for cinnamyl alcohol selox under identical conditions over macroporous-mesoporous SBA-15 with Pd
and Pt co-located within mesopores, Pd uniformly distributed throughout the entire pore network with Pt only
within the mesopores, or Pt uniformly distributed throughout the entire pore network with Pd only within the
macropores which show no evidence for synergy except in the case where Pt is spatially confined to
mesopores with Pd throughout (this being the closest analogue to our spatially orthogonal catalyst). Reaction
conditions: 150 C, 5 bar O2, 12.5 mg catalyst, 4.1 mmol cinnamyl alcohol in toluene solvent.
PdPt in mesopores
0
20
40
60
80
100
0 1 2 3 4 5 6
Se
lectivity / %
Reaction time / h
Cin=O
ethylbenzene
Trans-β-methylstyrene
0
10
20
30
0 1 2 3 4 5 6
Sele
ctivity / %
Reaction time / h
Cin-OOHStyreneHydroCin=OHydroCin-OHHydroCin-OOH
Pt meso and Pd throughout
0
20
40
60
80
100
0 1 2 3 4 5 6
Se
lectivity / %
Reaction time / h
Cin=O
ethylbenzene
Trans-β-methylstyrene
0
2
4
6
0 1 2 3 4 5 6
Sele
ctivity / %
Reaction time / h
Cin-OOHStyreneHydroCin=OHydroCin-OHHydroCin-OOH
Pt all over and Pd macro
0
20
40
60
80
100
0 1 2 3 4 5 6
Se
lectivity / %
Reaction time / h
Cin=OethylbenzeneTrans-β-methylstyrene
0
5
10
0 1 2 3 4 5 6
Sele
ctivity / %
Reaction time / h
Cin-OOHStyreneHydroCin=OHydroCin-OHHydroCin-OOH
Key: Cinnamaldehyde Cin=O
Cinnamic acid Cinn-OOH
Hydrocinnamaldehyde HydroCin=O
Hydrocinnamyl alcohol HydroCin-OH
Hydrocinnamic acid HydroCin-OOH
© 2015 Macmillan Publishers Limited. All rights reserved
15
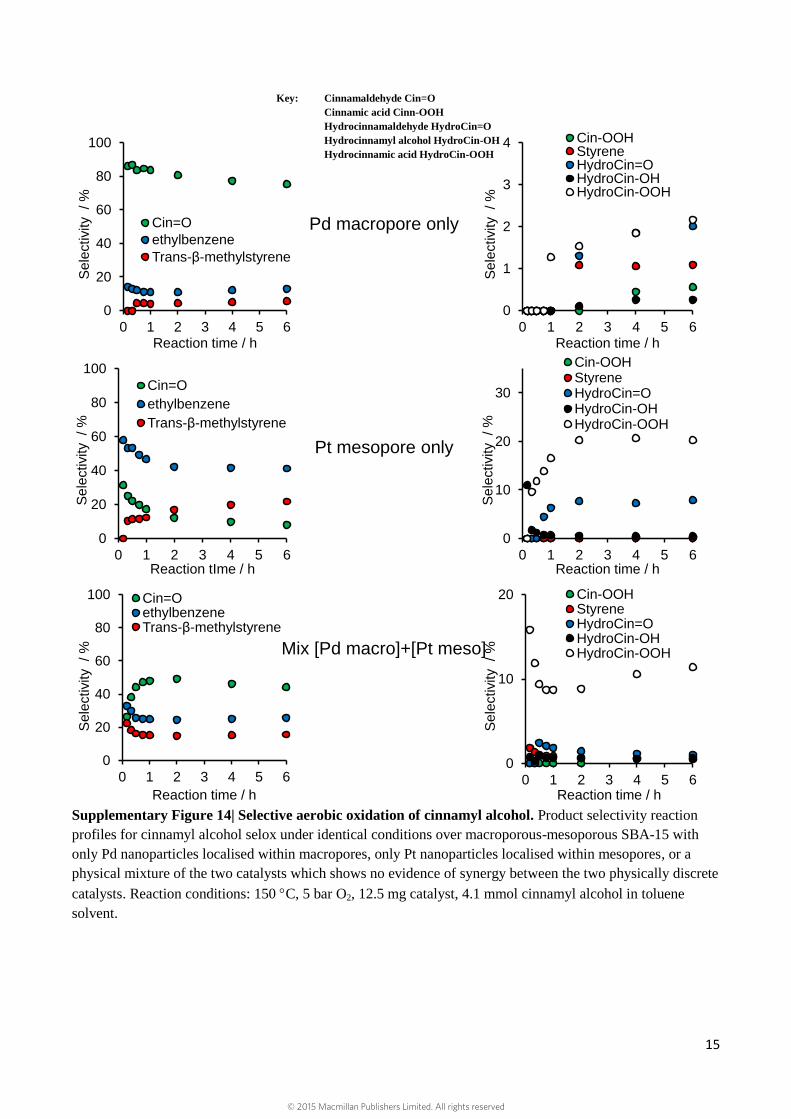
Supplementary Figure 14| Selective aerobic oxidation of cinnamyl alcohol. Product selectivity reaction
profiles for cinnamyl alcohol selox under identical conditions over macroporous-mesoporous SBA-15 with
only Pd nanoparticles localised within macropores, only Pt nanoparticles localised within mesopores, or a
physical mixture of the two catalysts which shows no evidence of synergy between the two physically discrete
catalysts. Reaction conditions: 150 C, 5 bar O2, 12.5 mg catalyst, 4.1 mmol cinnamyl alcohol in toluene
solvent.
0
20
40
60
80
100
0 1 2 3 4 5 6
Sele
ctivity / %
Reaction time / h
Cin=O
ethylbenzene
Trans-β-methylstyrene
0
1
2
3
4
0 1 2 3 4 5 6
Sele
ctivity / %
Reaction time / h
Cin-OOHStyreneHydroCin=OHydroCin-OHHydroCin-OOH
Pd macropore only
0
20
40
60
80
100
0 1 2 3 4 5 6
Se
lectivity / %
Reaction tIme / h
Cin=O
ethylbenzene
Trans-β-methylstyrene
0
10
20
30
0 1 2 3 4 5 6
Se
lectivity / %
Reaction time / h
Cin-OOHStyreneHydroCin=OHydroCin-OHHydroCin-OOH
Pt mesopore only
Mix [Pd macro]+[Pt meso]
0
20
40
60
80
100
0 1 2 3 4 5 6
Se
lectivity / %
Reaction time / h
Cin=OethylbenzeneTrans-β-methylstyrene
0
10
20
0 1 2 3 4 5 6
Se
lectivity / %
Reaction time / h
Cin-OOHStyreneHydroCin=OHydroCin-OHHydroCin-OOH
Key: Cinnamaldehyde Cin=O
Cinnamic acid Cinn-OOH
Hydrocinnamaldehyde HydroCin=O
Hydrocinnamyl alcohol HydroCin-OH
Hydrocinnamic acid HydroCin-OOH
© 2015 Macmillan Publishers Limited. All rights reserved
16
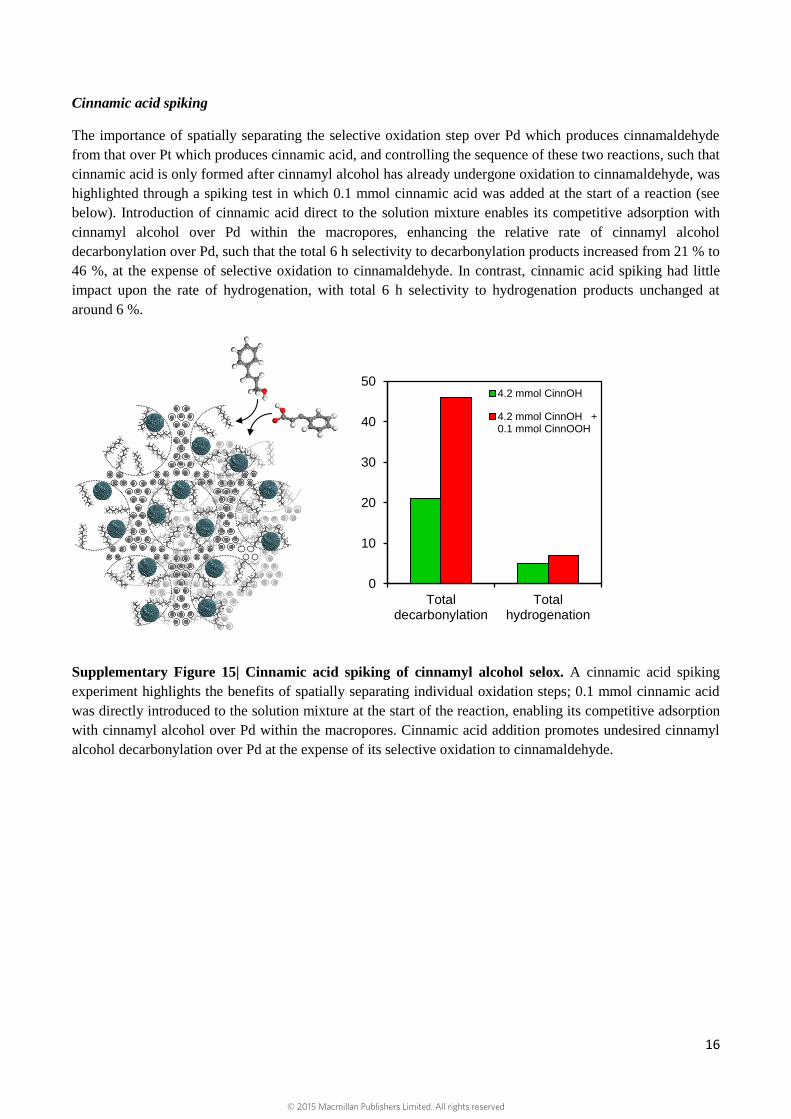
Cinnamic acid spiking
The importance of spatially separating the selective oxidation step over Pd which produces cinnamaldehyde
from that over Pt which produces cinnamic acid, and controlling the sequence of these two reactions, such that
cinnamic acid is only formed after cinnamyl alcohol has already undergone oxidation to cinnamaldehyde, was
highlighted through a spiking test in which 0.1 mmol cinnamic acid was added at the start of a reaction (see
below). Introduction of cinnamic acid direct to the solution mixture enables its competitive adsorption with
cinnamyl alcohol over Pd within the macropores, enhancing the relative rate of cinnamyl alcohol
decarbonylation over Pd, such that the total 6 h selectivity to decarbonylation products increased from 21 % to
46 %, at the expense of selective oxidation to cinnamaldehyde. In contrast, cinnamic acid spiking had little
impact upon the rate of hydrogenation, with total 6 h selectivity to hydrogenation products unchanged at
around 6 %.
Supplementary Figure 15| Cinnamic acid spiking of cinnamyl alcohol selox. A cinnamic acid spiking
experiment highlights the benefits of spatially separating individual oxidation steps; 0.1 mmol cinnamic acid
was directly introduced to the solution mixture at the start of the reaction, enabling its competitive adsorption
with cinnamyl alcohol over Pd within the macropores. Cinnamic acid addition promotes undesired cinnamyl
alcohol decarbonylation over Pd at the expense of its selective oxidation to cinnamaldehyde.
0
10
20
30
40
50
Totaldecarbonylation
Totalhydrogenation
4.2 mmol CinnOH
4.2 mmol CinnOH +0.1 mmol CinnOOH
© 2015 Macmillan Publishers Limited. All rights reserved
17
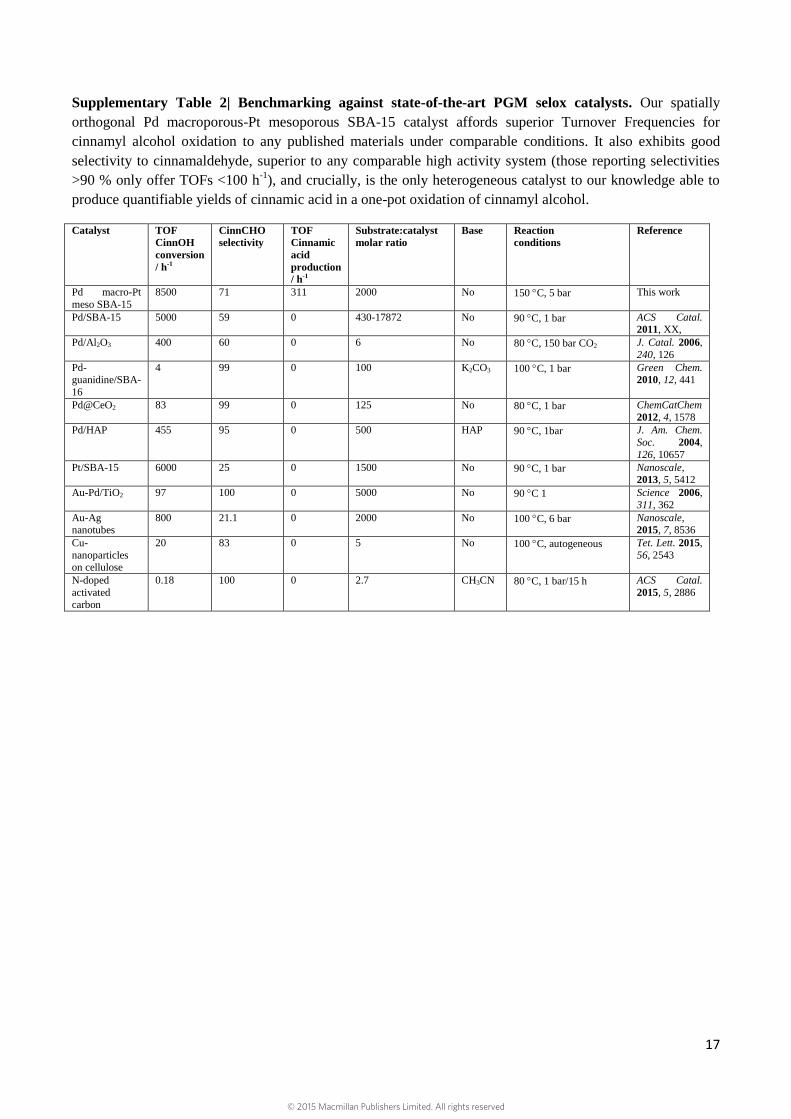
Supplementary Table 2| Benchmarking against state-of-the-art PGM selox catalysts. Our spatially
orthogonal Pd macroporous-Pt mesoporous SBA-15 catalyst affords superior Turnover Frequencies for
cinnamyl alcohol oxidation to any published materials under comparable conditions. It also exhibits good
selectivity to cinnamaldehyde, superior to any comparable high activity system (those reporting selectivities
>90 % only offer TOFs <100 h-1
), and crucially, is the only heterogeneous catalyst to our knowledge able to
produce quantifiable yields of cinnamic acid in a one-pot oxidation of cinnamyl alcohol.
Catalyst TOF
CinnOH
conversion
/ h-1
CinnCHO
selectivity
TOF
Cinnamic
acid
production
/ h-1
Substrate:catalyst
molar ratio
Base Reaction
conditions
Reference
Pd macro-Pt
meso SBA-15
8500
71 311 2000 No 150 C, 5 bar This work
Pd/SBA-15 5000 59 0 430-17872 No 90 C, 1 bar ACS Catal. 2011, XX,
Pd/Al2O3 400 60 0 6 No 80 C, 150 bar CO2 J. Catal. 2006,
240, 126
Pd-guanidine/SBA-
16
4 99 0 100 K2CO3 100 C, 1 bar Green Chem. 2010, 12, 441
Pd@CeO2 83 99 0 125 No 80 C, 1 bar ChemCatChem
2012, 4, 1578
Pd/HAP 455 95 0 500 HAP 90 C, 1bar J. Am. Chem.
Soc. 2004,
126, 10657
Pt/SBA-15 6000 25 0 1500 No 90 C, 1 bar Nanoscale, 2013, 5, 5412
Au-Pd/TiO2 97 100 0 5000 No 90 C 1 Science 2006,
311, 362
Au-Ag nanotubes
800 21.1 0 2000 No 100 C, 6 bar Nanoscale, 2015, 7, 8536
Cu-
nanoparticles on cellulose
20 83 0 5 No 100 C, autogeneous Tet. Lett. 2015,
56, 2543
N-doped
activated carbon
0.18 100 0 2.7 CH3CN 80 C, 1 bar/15 h ACS Catal.
2015, 5, 2886
© 2015 Macmillan Publishers Limited. All rights reserved