Embed Size (px)
Citation preview
Supplementary Information
Lipid-based Phagocytosis Nanoenhancer for
Macrophage Immunotherapy
Anujan Ramesh†, ¶, Sahana Kumar†, Anh Nguyen†, Anthony Brouillard †, Ashish Kulkarni†, ¶, §,*
†Department of Chemical Engineering, University of Massachusetts, Amherst, MA, USA;
¶Department of Biomedical Engineering, University of Massachusetts, Amherst, MA, USA;
§Center for Bioactive Delivery, Institute for Applied Life Sciences, University of Massachusetts,
Amherst, MA, USA.
*Correspondence to: [email protected]
Electronic Supplementary Material (ESI) for Nanoscale.This journal is © The Royal Society of Chemistry 2020
Table of Contents:
Materials: Detailed list of materials for synthesis and characterization of LPN
Figure S1: LPN optimization studies
Figure S2: Stability of LPNs in physiological serum conditions
Figure S3: LPN binding studies
Figure S4: In vitro phagocytic efficacy of BMDMs treated with LPN
Figure S5: In vitro phagocytosis of 4T1 Breast Cancer Cells by RAW 264.7 macrophages on
treatment with LPN
Figure S6: Fluorescent imaging assay of phagocytosis
Figure S7: In vitro evaluation of effect of different LPN optimization parameters such as
antibody concentration and ratio on phagocytosis efficacy
Figure S8: In vitro phagocytic efficacy of M2 polarized RAW 264.7 macrophages treated with
LPN
Figure S9: Flow cytometric analysis of apoptosis of B16/F10 cells and macrophages after
treatment with LPN
Figure S10: Comparison studies of LPN with co-administration of SIRPα-Lipo and CD47-Lipo
in B16F10 melanoma model
Figure S11: Effect of blocking Fcγ receptor on macrophages on binding to anti-SIRPα-Lipo
Materials: All the reagents were of analytical grade and used as supplied without further
purification unless specified. The reactions were maintained at inert conditions unless otherwise
specified. Dichloromethane (DCM), Methanol and N, N-dimethylformamide (DMF) were
purchased from Fisher Scientific. L-α-phosphatidylcholine (PC), and Sephadex G-25 were
purchased from Sigma-Aldrich. Cholesterol, 1,2-Distearoyl-sn-Glycero-3-Phosphoethanolamine-
N- [Carboxy (Polyethylene Glycol)2000] (DSPE-PEG-Carboxylic Acid), mini hand-held extruder
kit including the 0.4μm ,0.2μm,0.05 μm Nucleopore Track-Etch Membrane, 10mm Filter supports
and 250 ml Syringes were bought from Avanti Polar Lipids. 1-Ethyl-3-(3-dimethylaminopropyl)
carbodiimide (EDC) and N-hydroxysulfosuccinamide (Sulfo-NHS) was purchased from Thermo
Scientific. CD47, SIRP, CD11b, CD45, CD8a, CD4, NK1.1, Ly6C antibodies were purchased
from Biolegend Inc. Rabbit anti-mouse iNOS was purchased from Cell Signaling Technology.
Alexa Fluor 594 Goat anti-rabbit IgG antibody was purchased from Thermo Fisher. 6 wells and
12 wells, 5 mL, and 10 mL plates were purchased from Corning. DMEM, FBS, and antibiotic-
antimycotic were purchased from Gibco, Life Technologies. Fluorescence spectra were obtained
using a BioTek plate reader. Flow cytometry was performed using ACEA Novoflow Flow
Cytometer and data was analyzed using NovoExpress software. Mean particle size and zeta
potential were measured by Dynamic Light Scattering method using Malvern Zetasizer Nano ZSP.
Cryo- Transmission Electron microscopy was performed using a FEI Tecnai Cryo-Bio 200KV
FEG TEM and confocal microscopic images were obtained with Nikon A1SP Spectra and
analyzed using NIS elements software.
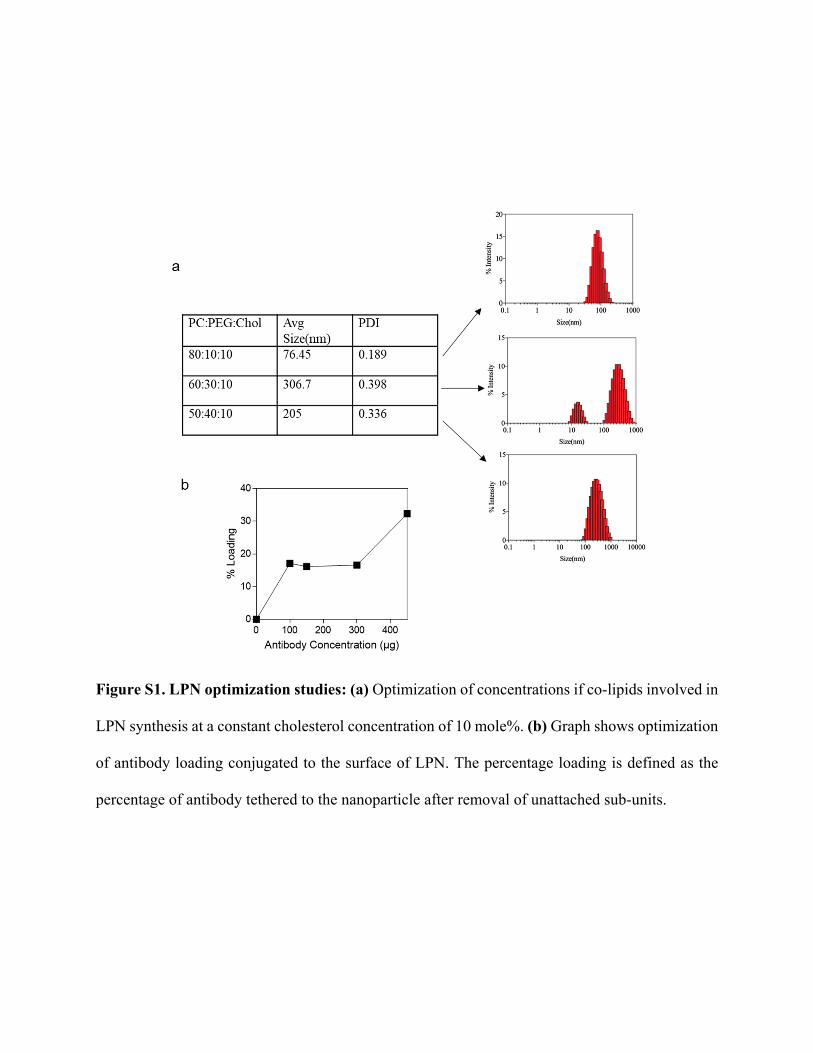
Figure S1. LPN optimization studies: (a) Optimization of concentrations if co-lipids involved in
LPN synthesis at a constant cholesterol concentration of 10 mole%. (b) Graph shows optimization
of antibody loading conjugated to the surface of LPN. The percentage loading is defined as the
percentage of antibody tethered to the nanoparticle after removal of unattached sub-units.
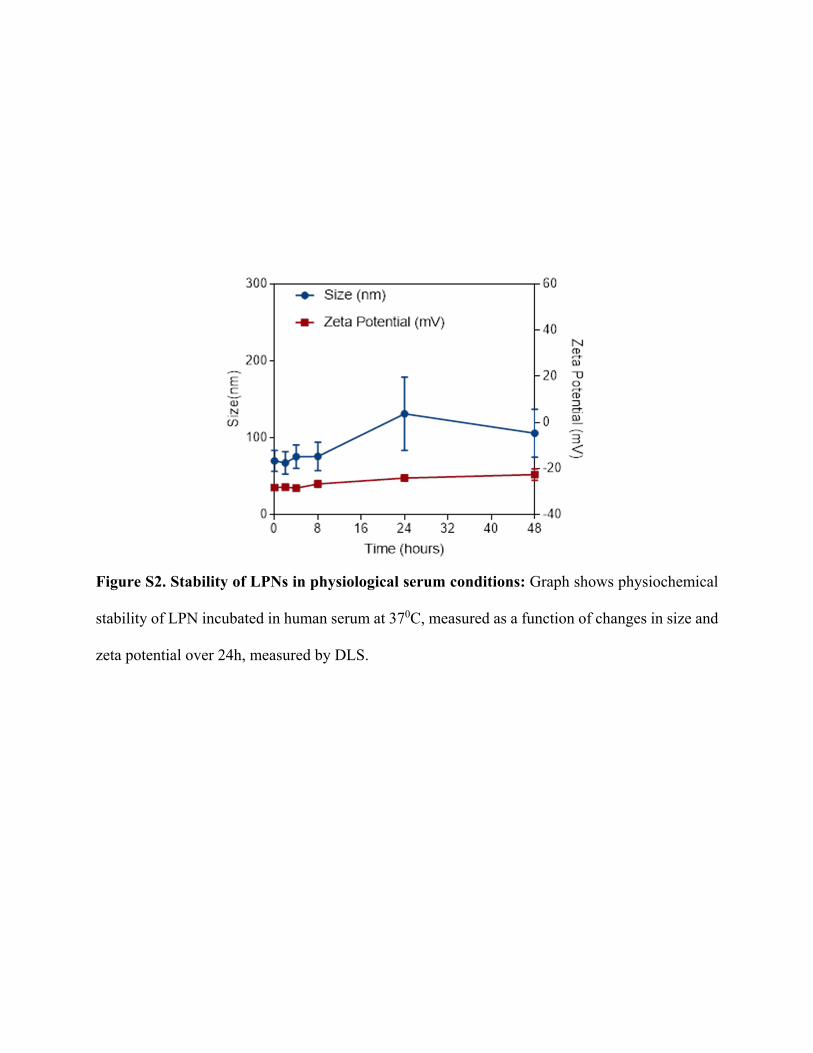
Figure S2. Stability of LPNs in physiological serum conditions: Graph shows physiochemical
stability of LPN incubated in human serum at 370C, measured as a function of changes in size and
zeta potential over 24h, measured by DLS.
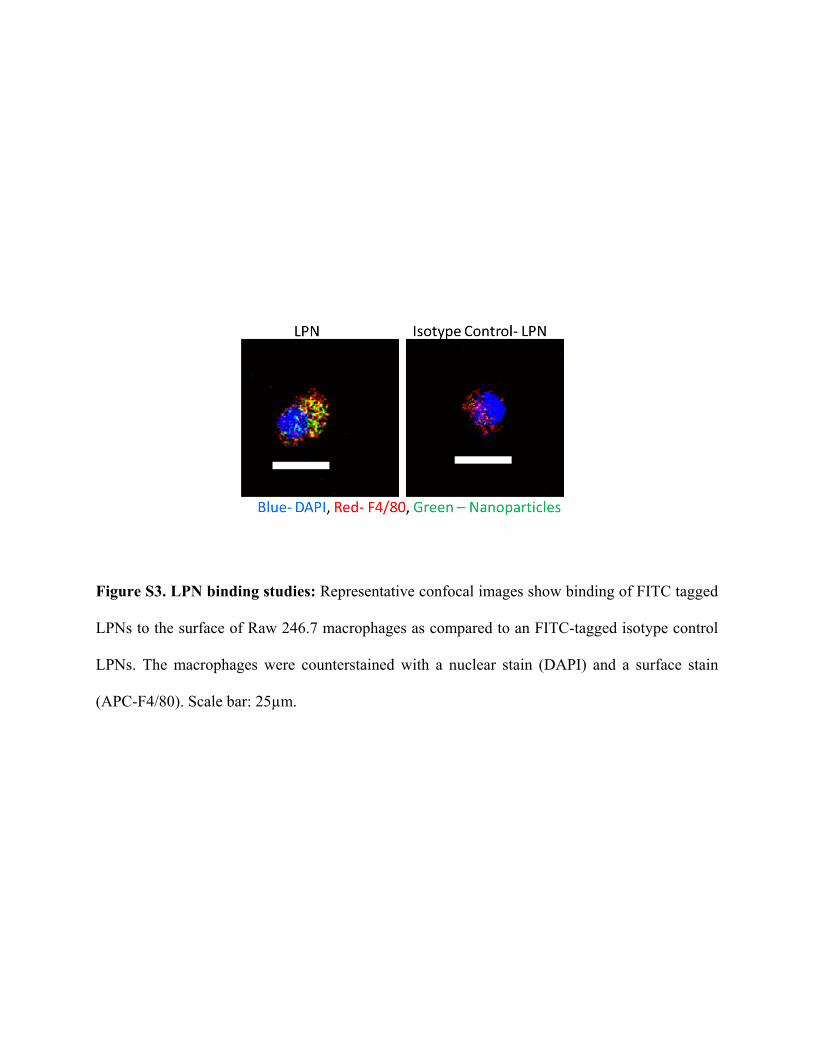
Figure S3. LPN binding studies: Representative confocal images show binding of FITC tagged
LPNs to the surface of Raw 246.7 macrophages as compared to an FITC-tagged isotype control
LPNs. The macrophages were counterstained with a nuclear stain (DAPI) and a surface stain
(APC-F4/80). Scale bar: 25µm.
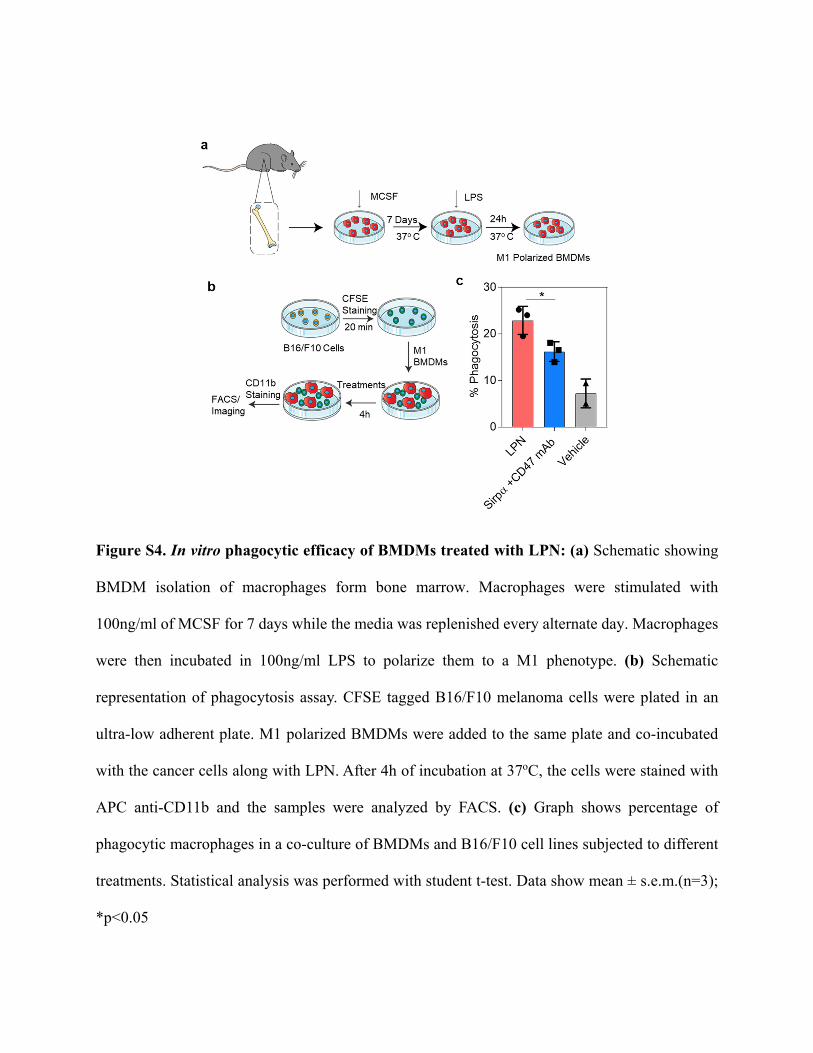
Figure S4. In vitro phagocytic efficacy of BMDMs treated with LPN: (a) Schematic showing
BMDM isolation of macrophages form bone marrow. Macrophages were stimulated with
100ng/ml of MCSF for 7 days while the media was replenished every alternate day. Macrophages
were then incubated in 100ng/ml LPS to polarize them to a M1 phenotype. (b) Schematic
representation of phagocytosis assay. CFSE tagged B16/F10 melanoma cells were plated in an
ultra-low adherent plate. M1 polarized BMDMs were added to the same plate and co-incubated
with the cancer cells along with LPN. After 4h of incubation at 37oC, the cells were stained with
APC anti-CD11b and the samples were analyzed by FACS. (c) Graph shows percentage of
phagocytic macrophages in a co-culture of BMDMs and B16/F10 cell lines subjected to different
treatments. Statistical analysis was performed with student t-test. Data show mean ± s.e.m.(n=3);
*p<0.05
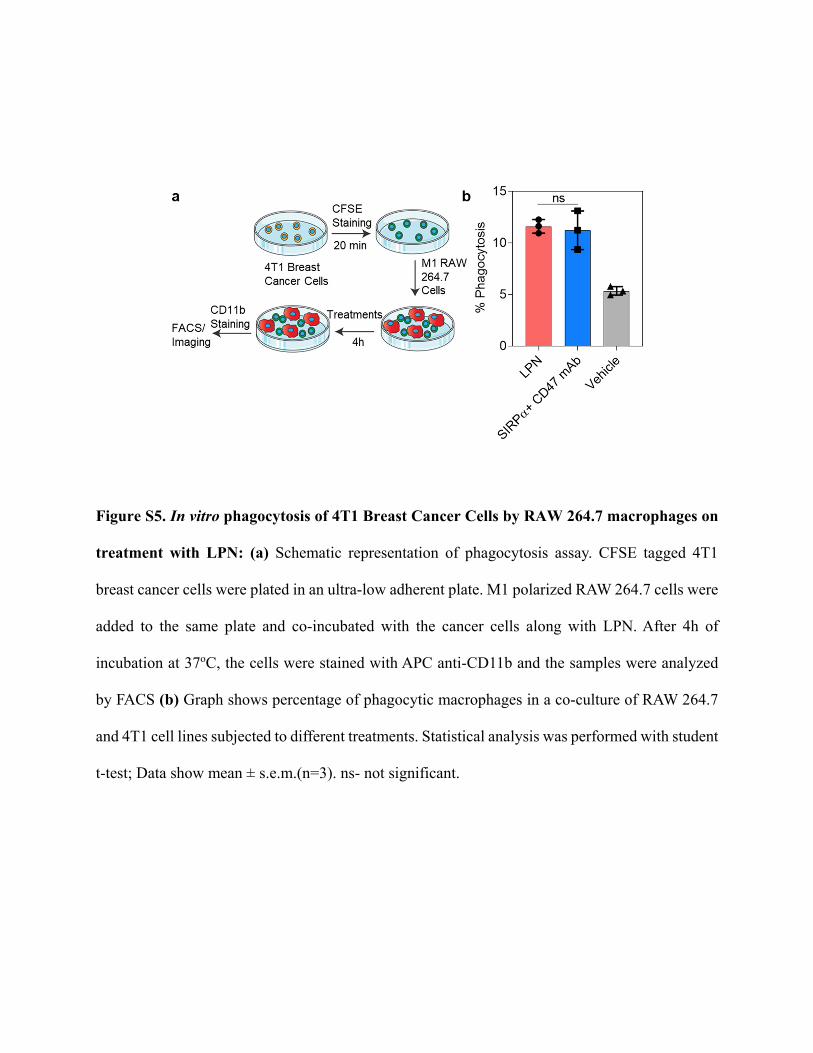
Figure S5. In vitro phagocytosis of 4T1 Breast Cancer Cells by RAW 264.7 macrophages on
treatment with LPN: (a) Schematic representation of phagocytosis assay. CFSE tagged 4T1
breast cancer cells were plated in an ultra-low adherent plate. M1 polarized RAW 264.7 cells were
added to the same plate and co-incubated with the cancer cells along with LPN. After 4h of
incubation at 37oC, the cells were stained with APC anti-CD11b and the samples were analyzed
by FACS (b) Graph shows percentage of phagocytic macrophages in a co-culture of RAW 264.7
and 4T1 cell lines subjected to different treatments. Statistical analysis was performed with student
t-test; Data show mean ± s.e.m.(n=3). ns- not significant.
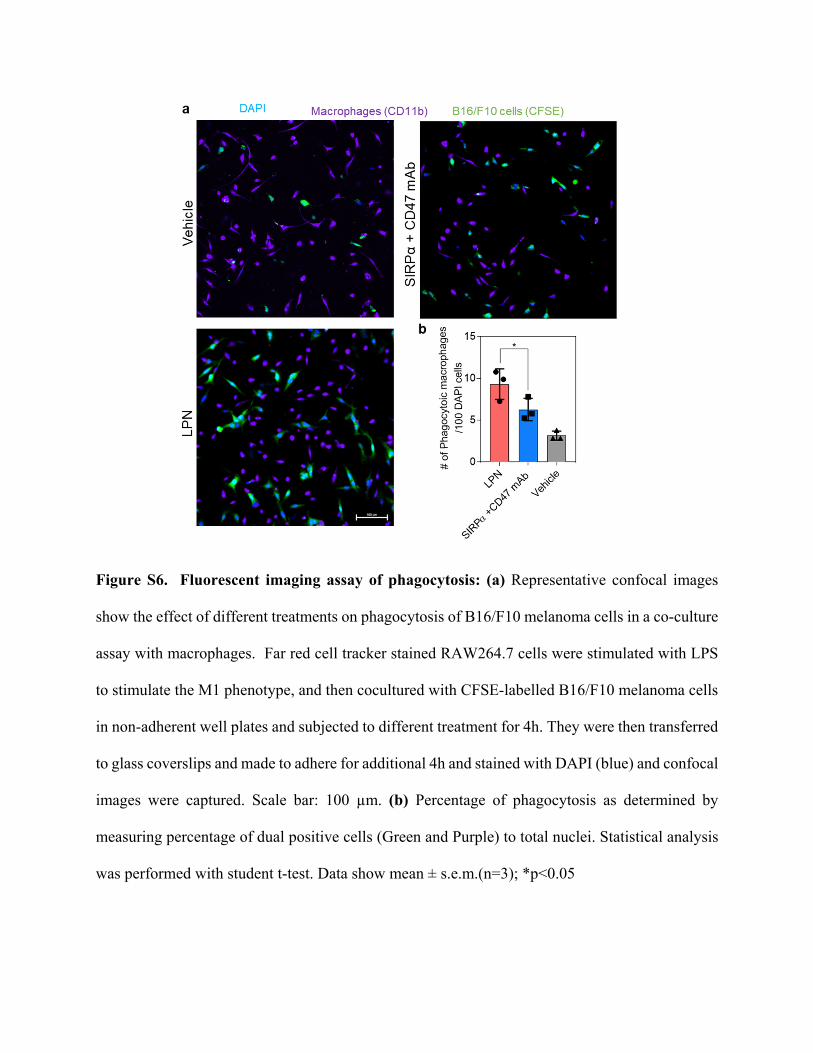
Figure S6. Fluorescent imaging assay of phagocytosis: (a) Representative confocal images
show the effect of different treatments on phagocytosis of B16/F10 melanoma cells in a co-culture
assay with macrophages. Far red cell tracker stained RAW264.7 cells were stimulated with LPS
to stimulate the M1 phenotype, and then cocultured with CFSE-labelled B16/F10 melanoma cells
in non-adherent well plates and subjected to different treatment for 4h. They were then transferred
to glass coverslips and made to adhere for additional 4h and stained with DAPI (blue) and confocal
images were captured. Scale bar: 100 µm. (b) Percentage of phagocytosis as determined by
measuring percentage of dual positive cells (Green and Purple) to total nuclei. Statistical analysis
was performed with student t-test. Data show mean ± s.e.m.(n=3); *p<0.05
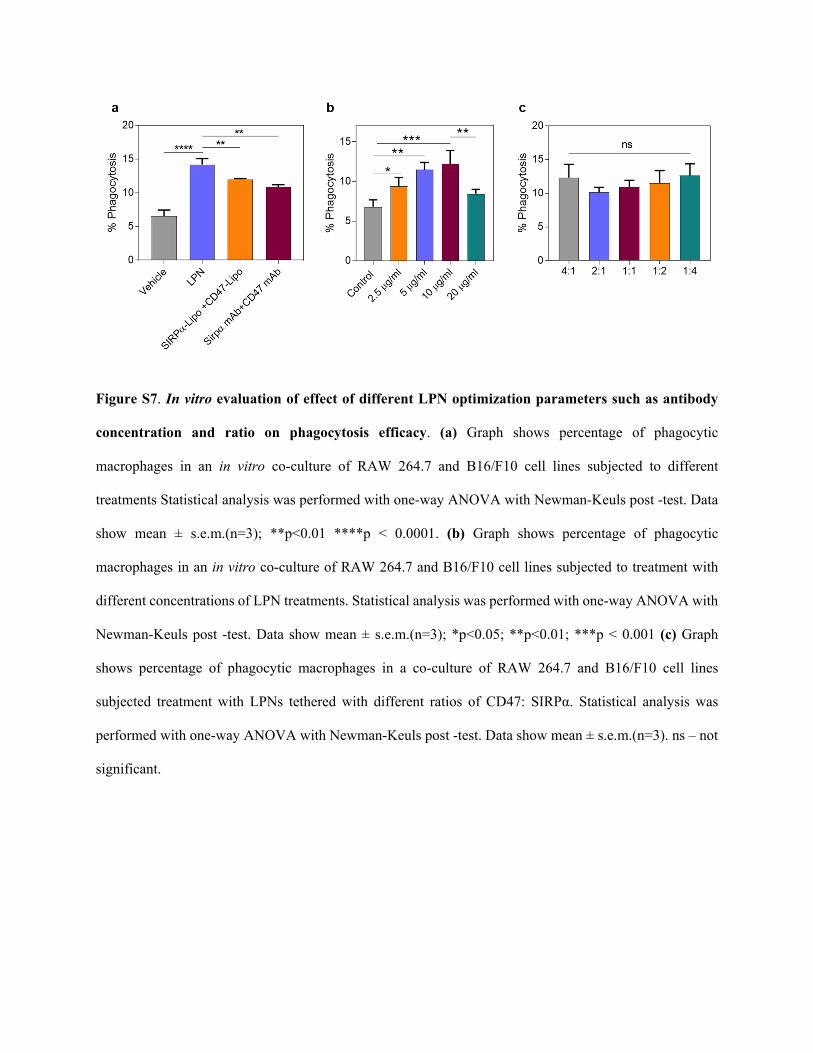
Figure S7. In vitro evaluation of effect of different LPN optimization parameters such as antibody
concentration and ratio on phagocytosis efficacy. (a) Graph shows percentage of phagocytic
macrophages in an in vitro co-culture of RAW 264.7 and B16/F10 cell lines subjected to different
treatments Statistical analysis was performed with one-way ANOVA with Newman-Keuls post -test. Data
show mean ± s.e.m.(n=3); **p<0.01 ****p < 0.0001. (b) Graph shows percentage of phagocytic
macrophages in an in vitro co-culture of RAW 264.7 and B16/F10 cell lines subjected to treatment with
different concentrations of LPN treatments. Statistical analysis was performed with one-way ANOVA with
Newman-Keuls post -test. Data show mean ± s.e.m.(n=3); *p<0.05; **p<0.01; ***p < 0.001 (c) Graph
shows percentage of phagocytic macrophages in a co-culture of RAW 264.7 and B16/F10 cell lines
subjected treatment with LPNs tethered with different ratios of CD47: SIRPα. Statistical analysis was
performed with one-way ANOVA with Newman-Keuls post -test. Data show mean ± s.e.m.(n=3). ns – not
significant.
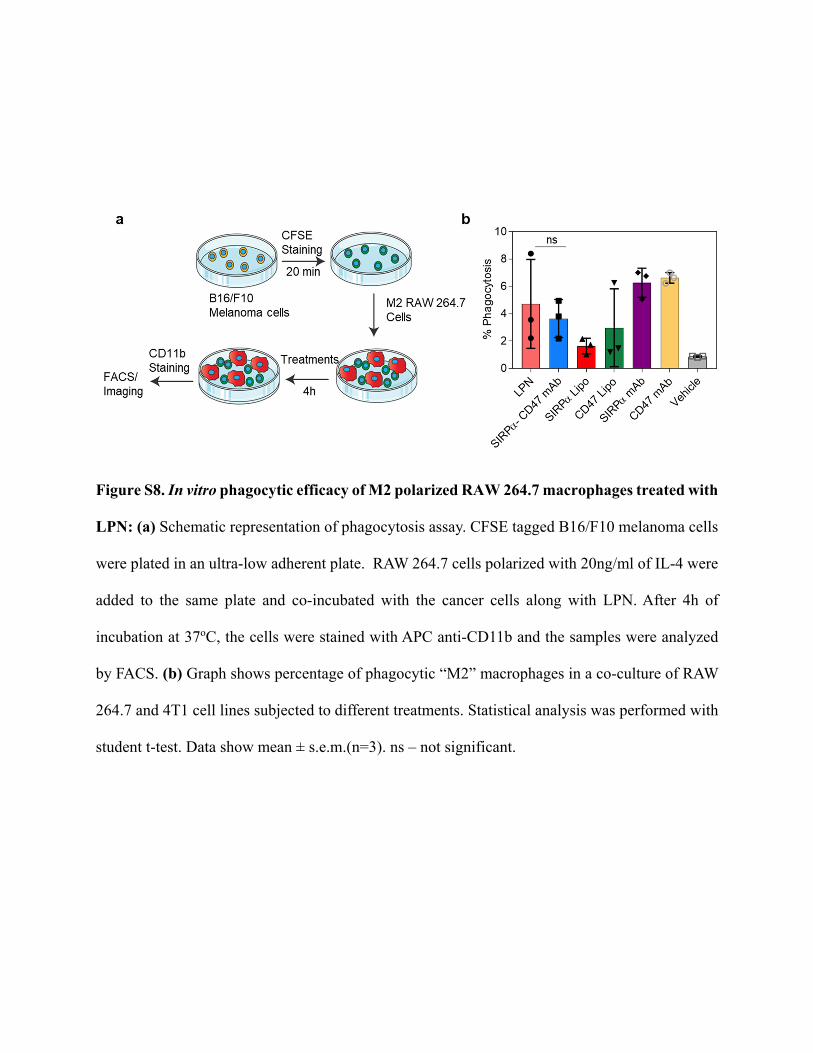
Figure S8. In vitro phagocytic efficacy of M2 polarized RAW 264.7 macrophages treated with
LPN: (a) Schematic representation of phagocytosis assay. CFSE tagged B16/F10 melanoma cells
were plated in an ultra-low adherent plate. RAW 264.7 cells polarized with 20ng/ml of IL-4 were
added to the same plate and co-incubated with the cancer cells along with LPN. After 4h of
incubation at 37oC, the cells were stained with APC anti-CD11b and the samples were analyzed
by FACS. (b) Graph shows percentage of phagocytic “M2” macrophages in a co-culture of RAW
264.7 and 4T1 cell lines subjected to different treatments. Statistical analysis was performed with
student t-test. Data show mean ± s.e.m.(n=3). ns – not significant.
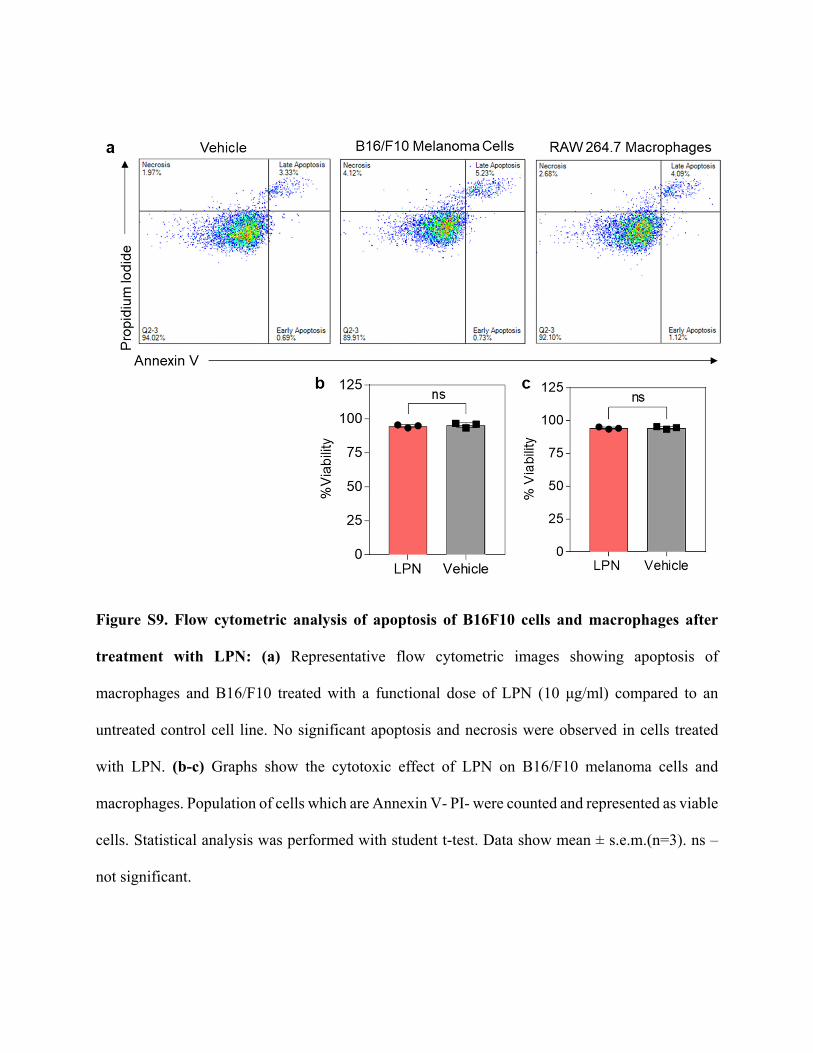
Figure S9. Flow cytometric analysis of apoptosis of B16F10 cells and macrophages after
treatment with LPN: (a) Representative flow cytometric images showing apoptosis of
macrophages and B16/F10 treated with a functional dose of LPN (10 μg/ml) compared to an
untreated control cell line. No significant apoptosis and necrosis were observed in cells treated
with LPN. (b-c) Graphs show the cytotoxic effect of LPN on B16/F10 melanoma cells and
macrophages. Population of cells which are Annexin V- PI- were counted and represented as viable
cells. Statistical analysis was performed with student t-test. Data show mean ± s.e.m.(n=3). ns –
not significant.
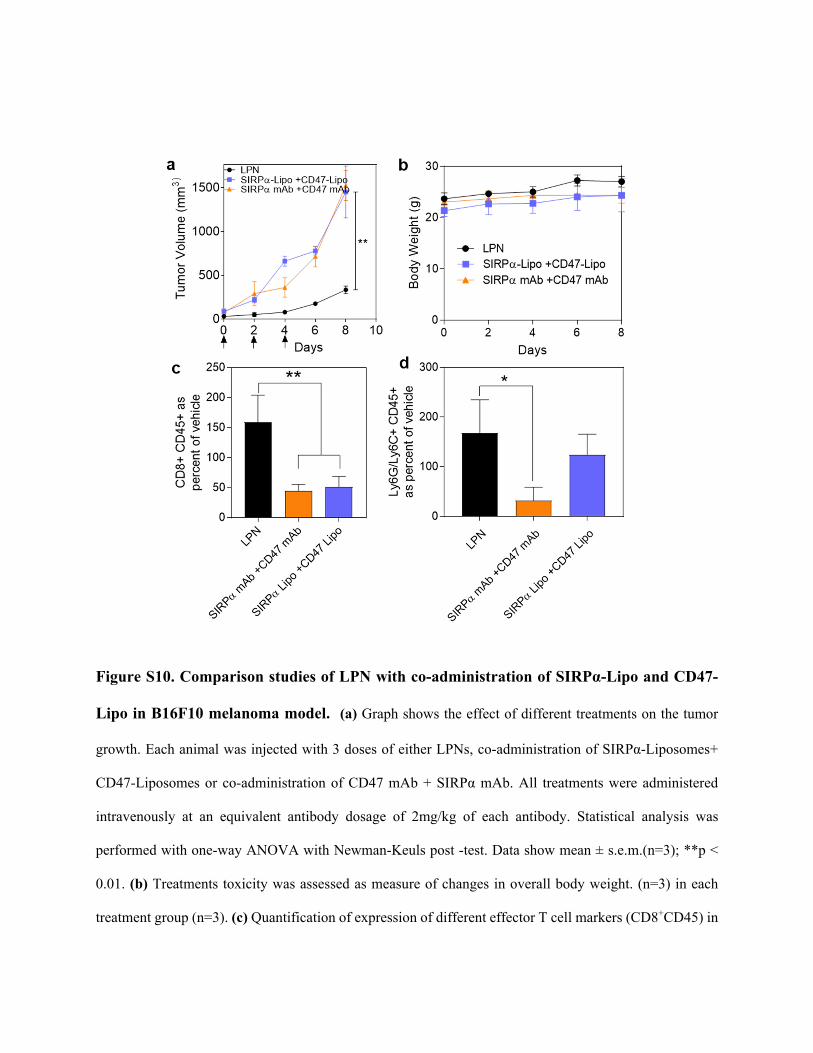
Figure S10. Comparison studies of LPN with co-administration of SIRPα-Lipo and CD47-
Lipo in B16F10 melanoma model. (a) Graph shows the effect of different treatments on the tumor
growth. Each animal was injected with 3 doses of either LPNs, co-administration of SIRPα-Liposomes+
CD47-Liposomes or co-administration of CD47 mAb + SIRPα mAb. All treatments were administered
intravenously at an equivalent antibody dosage of 2mg/kg of each antibody. Statistical analysis was
performed with one-way ANOVA with Newman-Keuls post -test. Data show mean ± s.e.m.(n=3); **p <
0.01. (b) Treatments toxicity was assessed as measure of changes in overall body weight. (n=3) in each
treatment group (n=3). (c) Quantification of expression of different effector T cell markers (CD8+CD45) in
a single cell suspension of harvested tumors post treatment. Data shown are mean ± s.e.m. (n = 3), Statistical
significance was determined using one-way ANOVA with Newman-Keuls post-test. Statistical significance
was determined using one-way ANOVA with Newman-Keuls post-test. Data show mean ± s.e.m.(n=3);
*p<0.05; **p<0.01 (d) Quantification of expression of Pan-Monocyte markers (Ly6C/Ly6G+, CD45+) in a
single cell suspension of harvested tumor post treatments. Data shown are mean ± s.e.m. (n = 3), Statistical
significance was determined using one-way ANOVA with Newman-Keuls post-test. Data show mean ±
s.e.m.(n=3); *p<0.05; **p < 0.01
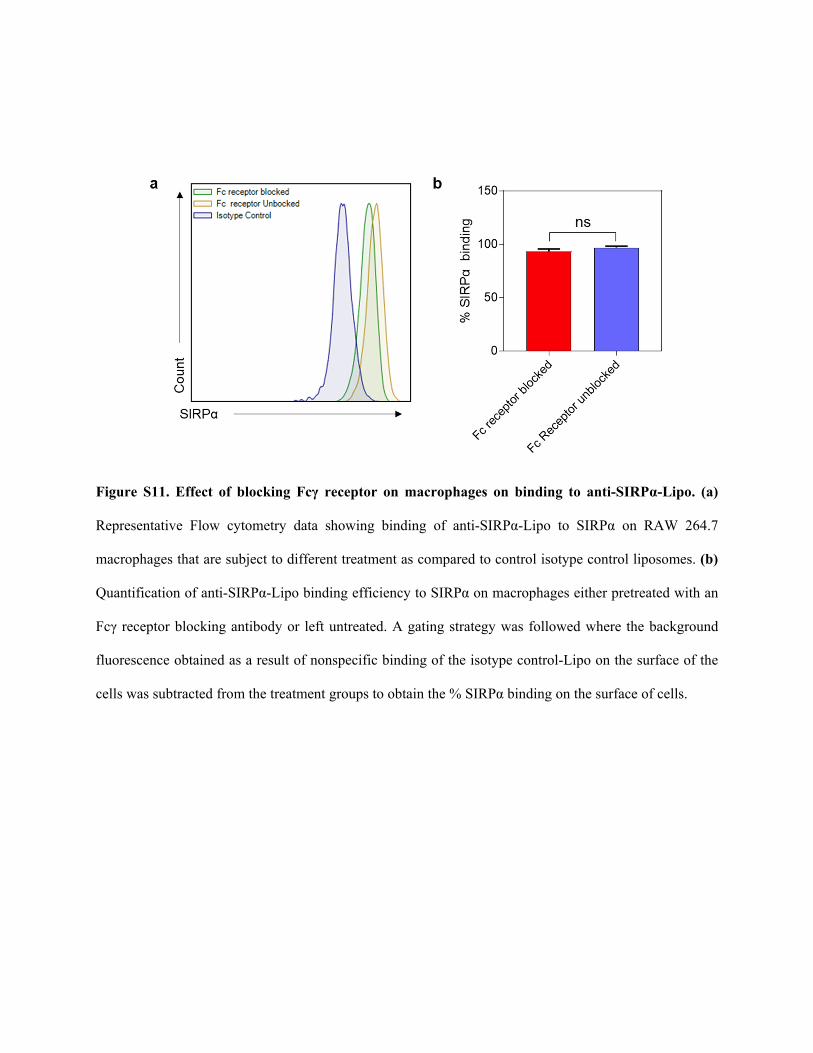
Figure S11. Effect of blocking Fcγ receptor on macrophages on binding to anti-SIRPα-Lipo. (a)
Representative Flow cytometry data showing binding of anti-SIRPα-Lipo to SIRPα on RAW 264.7
macrophages that are subject to different treatment as compared to control isotype control liposomes. (b)
Quantification of anti-SIRPα-Lipo binding efficiency to SIRPα on macrophages either pretreated with an
Fcγ receptor blocking antibody or left untreated. A gating strategy was followed where the background
fluorescence obtained as a result of nonspecific binding of the isotype control-Lipo on the surface of the
cells was subtracted from the treatment groups to obtain the % SIRPα binding on the surface of cells.