Embed Size (px)
Citation preview
Supplementary InformationJ. Braz. Chem. Soc., Vol. 27, No. 6, S1-S4, 2016.
Printed in Brazil - ©2016 Sociedade Brasileira de Química0103 - 5053 $6.00+0.00
*e-mail: [email protected]
Quantification of Synthetic Amino-Nitroquinoxaline Dyes: An Approach Using Image Analysis
Lilian C. da Silva,a Djalan F. de Lima,a Janine A. Silva,a Camilo L. M. de Morais,a Brunno L. Albuquerque,b Adailton J. Bortoluzzi,c Josiel B. Domingos,b
Renata M. Araújo,a Fabrício G. Menezesa and Kássio M. G. Lima*,a
aGrupo de Pesquisa em Química Biológica e Quimiometria, Instituto de Química, Universidade Federal do Rio Grande do Norte, 59072-970 Natal-RN, Brazil
bLaboratório de Catálise Biomimética and cLaboratório de Bioinorgânica e Cristalografia, Departamento de Química, Universidade Federal de Santa Catarina,
88040-900 Florianópolis-SC, Brazil
Procedure for quantification of compounds 2 and 3 through UV-Vis data
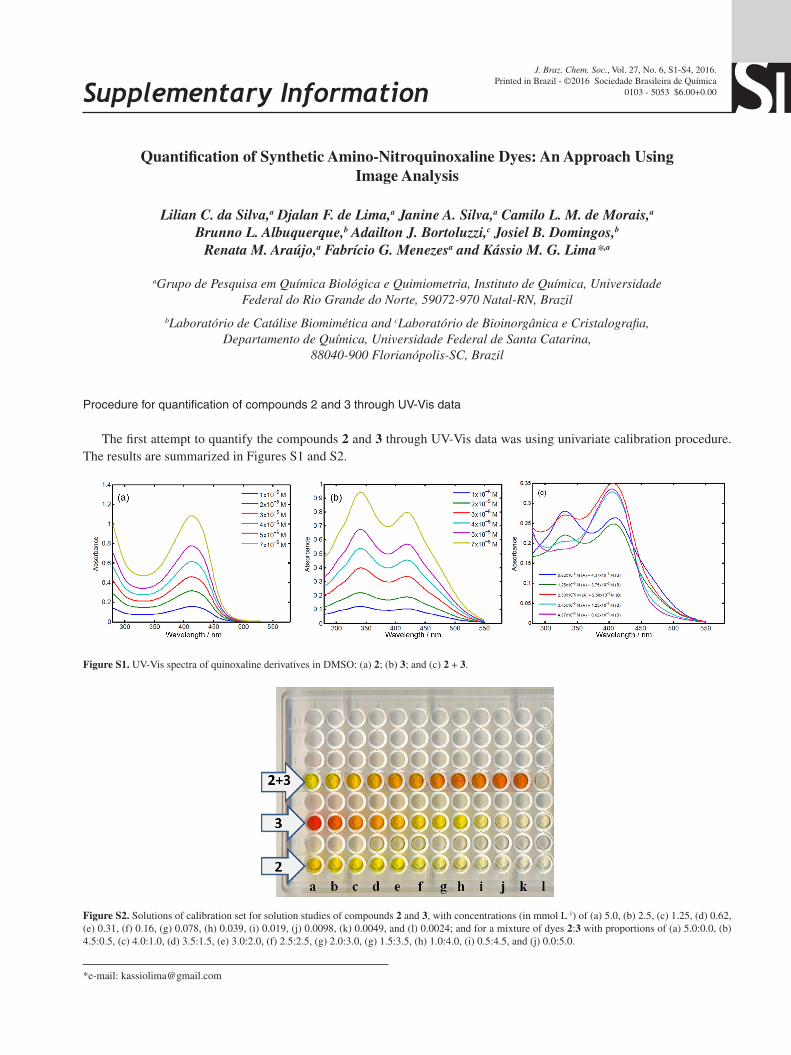
The first attempt to quantify the compounds 2 and 3 through UV-Vis data was using univariate calibration procedure. The results are summarized in Figures S1 and S2.
Figure S1. UV-Vis spectra of quinoxaline derivatives in DMSO: (a) 2; (b) 3; and (c) 2 + 3.
Figure S2. Solutions of calibration set for solution studies of compounds 2 and 3, with concentrations (in mmol L-1) of (a) 5.0, (b) 2.5, (c) 1.25, (d) 0.62, (e) 0.31, (f) 0.16, (g) 0.078, (h) 0.039, (i) 0.019, (j) 0.0098, (k) 0.0049, and (l) 0.0024; and for a mixture of dyes 2:3 with proportions of (a) 5.0:0.0, (b) 4.5:0.5, (c) 4.0:1.0, (d) 3.5:1.5, (e) 3.0:2.0, (f) 2.5:2.5, (g) 2.0:3.0, (g) 1.5:3.5, (h) 1.0:4.0, (i) 0.5:4.5, and (j) 0.0:5.0.
Quantification of Synthetic Amino-Nitroquinoxaline Dyes J. Braz. Chem. Soc.S2
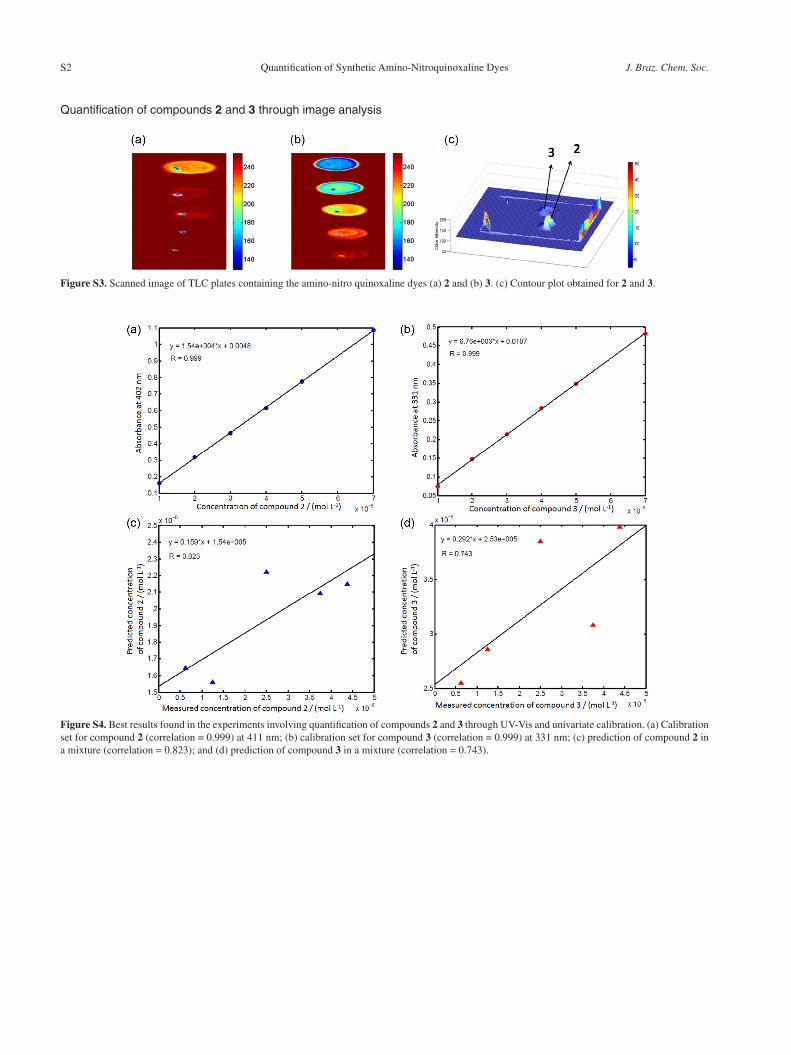
Figure S3. Scanned image of TLC plates containing the amino-nitro quinoxaline dyes (a) 2 and (b) 3. (c) Contour plot obtained for 2 and 3.
Quantification of compounds 2 and 3 through image analysis
Figure S4. Best results found in the experiments involving quantification of compounds 2 and 3 through UV-Vis and univariate calibration. (a) Calibration set for compound 2 (correlation = 0.999) at 411 nm; (b) calibration set for compound 3 (correlation = 0.999) at 331 nm; (c) prediction of compound 2 in a mixture (correlation = 0.823); and (d) prediction of compound 3 in a mixture (correlation = 0.743).
Silva et al. S3Vol. 27, No. 6, 2016
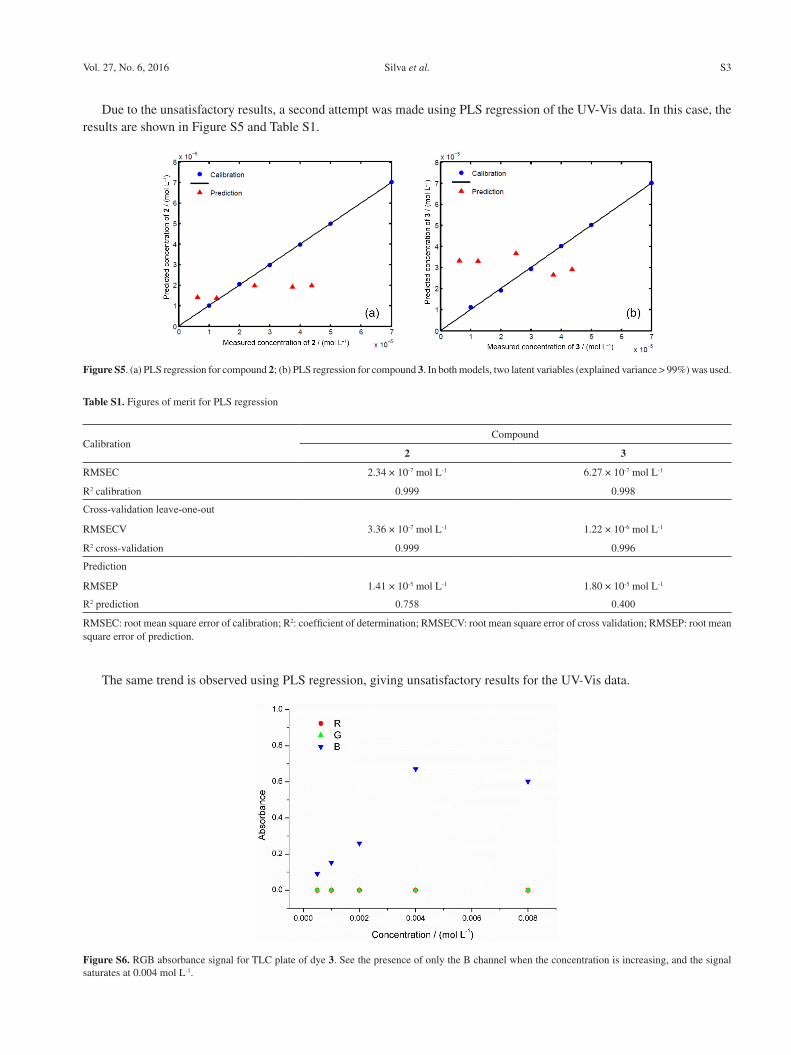
Due to the unsatisfactory results, a second attempt was made using PLS regression of the UV-Vis data. In this case, the results are shown in Figure S5 and Table S1.
Figure S5. (a) PLS regression for compound 2; (b) PLS regression for compound 3. In both models, two latent variables (explained variance > 99%) was used.
Table S1. Figures of merit for PLS regression
CalibrationCompound
2 3
RMSEC 2.34 × 10⁻⁷ mol L-1 6.27 × 10⁻⁷ mol L-1
R2 calibration 0.999 0.998
Cross-validation leave-one-out
RMSECV 3.36 × 10⁻⁷ mol L-1 1.22 × 10⁻⁶ mol L-1
R2 cross-validation 0.999 0.996
Prediction
RMSEP 1.41 × 10⁻⁵ mol L-1 1.80 × 10⁻⁵ mol L-1
R2 prediction 0.758 0.400
RMSEC: root mean square error of calibration; R2: coefficient of determination; RMSECV: root mean square error of cross validation; RMSEP: root mean square error of prediction.
Figure S6. RGB absorbance signal for TLC plate of dye 3. See the presence of only the B channel when the concentration is increasing, and the signal saturates at 0.004 mol L-1.
The same trend is observed using PLS regression, giving unsatisfactory results for the UV-Vis data.
Quantification of Synthetic Amino-Nitroquinoxaline Dyes J. Braz. Chem. Soc.S4
RGB-resolved absorbance
(1)
where F is the RGB-resolved absorbance; I is the intensity of the R, G or B channels; and I0 is the maximum value of intensity or blank: 255.
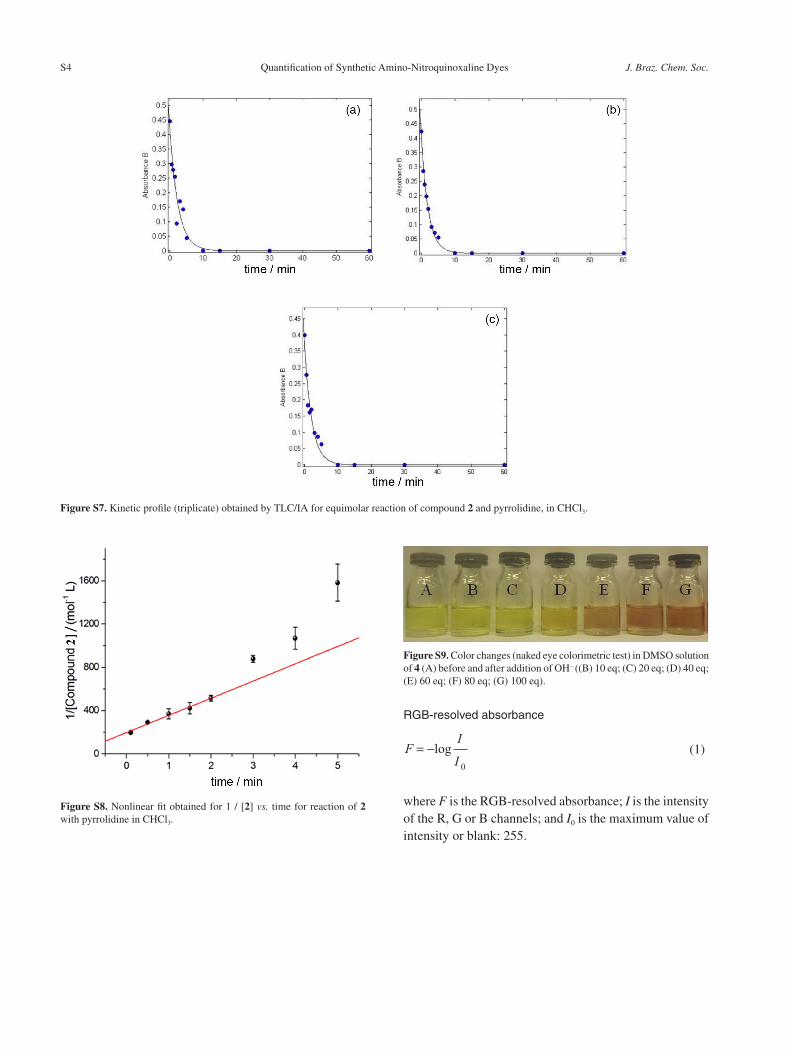
Figure S7. Kinetic profile (triplicate) obtained by TLC/IA for equimolar reaction of compound 2 and pyrrolidine, in CHCl3.
Figure S8. Nonlinear fit obtained for 1 / [2] vs. time for reaction of 2 with pyrrolidine in CHCl3.
Figure S9. Color changes (naked eye colorimetric test) in DMSO solution of 4 (A) before and after addition of OH– ((B) 10 eq; (C) 20 eq; (D) 40 eq; (E) 60 eq; (F) 80 eq; (G) 100 eq).