Embed Size (px)
Citation preview

Eichner et al.
Supplementary Information
Immunomodulatory drugs disrupt the CRBN-CD147/MCT1 axis to exert anti-tumor activity and teratogenicity
Ruth Eichner, Michael Heider*, Vanesa Fernández-Sáiz*, Frauke van Bebber, Anne-Kathrin
Garz, Simone Lemeer, Martina Rudelius, Bianca-Sabrina Targosz, Laura Jacobs, Anna-Maria
Knorn, Jolanta Slawska, Uwe Platzbecker, Ulrich Germing, Christian Langer, Stefan Knop,
Herrmann Einsele, Christian Peschel, Christian Haass, Ulrich Keller, Bettina Schmid,
Katharina S. Götze, Bernhard Kuster and Florian Bassermann
*Equal contribution Correspondence to: [email protected]
Inventory: • Supplementary Figures 1-11 • Supplementary Table 2
Nature Medicine: doi:10.1038/nm.4128

Eichner et al.
Supplementary Figures
Supplementary Fig. 1. Purification of the CRBN complex.
(a) Tandem-Strep-single-Flag-tagged CRBN (CRBN-SF) was expressed in HEK293T
cells and subjected to a sequential immunopurification approach comprising immobilization
on Strep-Tactin beads, elution with desthiobiotin, immobilization on anti-Flag resin and
elution with 3x-Flag octapeptide. The Flag eluate was separated by SDS-PAGE and analyzed
by mass spectrometry. As controls, purifications were performed from HEK293T transfected
with an empty vector (EV) or non-tagged CRBN. The depicted silver stained gel corresponds
to 5% of the final Flag-eluates.
(b) Sequences of identified unique peptides corresponding to CD147 and MCT1. A full
list of identified CRBN interactors is shown in Supplementary Table 1.
EV! CRBN! CRBN-SF!MW
(kDa)!250!130!100!75!55!35!25!15!11!
CRBN!
a!
b!Sequence
Mascot Ion score Modifications Start Stop
(K)GGVVLKEDALPGQK(T) 88.64 58 71 (K)EDALPGQK(T) 58.06 64 71 (K)SSEHINEGETAMLVcK(S) 78.3 Carbamidomethyl (+57) 112 127 (K)SESVPPVTDWAWYK(I) 56.25 128 141 (R)FFVSSSQGR(S) 41.36 158 166 (R)SELHIENLNmEADPGQYR(C) 87.48 Oxidation (+16) 167 184 (K)GSDQAIITLR(V) 66.62 192 201 (R)RKPEDVLDDDDAGSAPLK(S) 83.3 233 250
CD147 - P35613
Sequence Mascot Ion score Modifications Start Stop
(K)SITVFFK(E) 40 39 45 (K)DLHDANTDLIGRHPK(Q) 55,97 225 239 (K)DLHDANTDLIGR(H) 81,49 225 236 (R)LNDMYGDYK(Y) 54,99 412 420 (K)KESKEEETSIDVAGKPNEVTK(A) 61,98 459 479 (K)ESKEEETSIDVAGKPNEVTK(A) 52,8 460 479
MCT1 - P53985
Nature Medicine: doi:10.1038/nm.4128
Eichner et al.
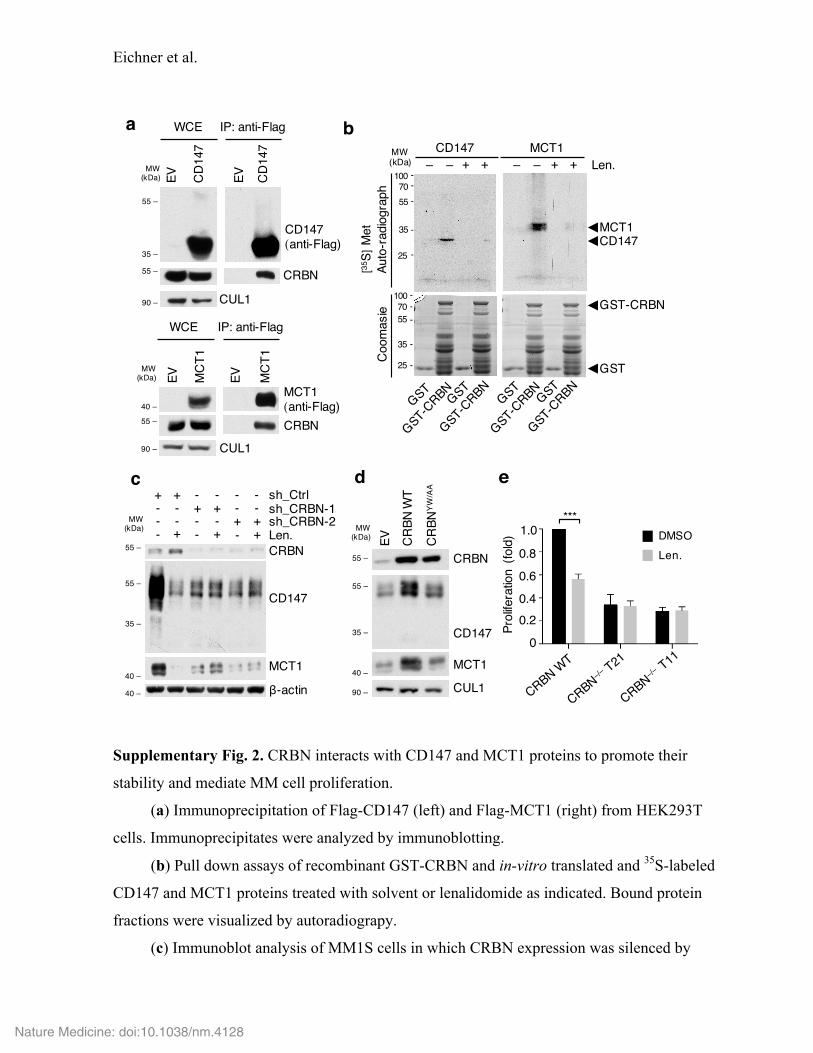
Supplementary Fig. 2. CRBN interacts with CD147 and MCT1 proteins to promote their
stability and mediate MM cell proliferation.
(a) Immunoprecipitation of Flag-CD147 (left) and Flag-MCT1 (right) from HEK293T
cells. Immunoprecipitates were analyzed by immunoblotting.
(b) Pull down assays of recombinant GST-CRBN and in-vitro translated and 35S-labeled
CD147 and MCT1 proteins treated with solvent or lenalidomide as indicated. Bound protein
fractions were visualized by autoradiograpy.
(c) Immunoblot analysis of MM1S cells in which CRBN expression was silenced by
a bWCE IP: anti-Flag
EV CD14
7
CRBN
CD147(anti-Flag)
CUL1
EV CD14
7
MW(kDa)
35 –
55 –
55 –
90 –
WCE IP: anti-Flag
EV MCT
1
EV MCT
1
CRBN
MCT1(anti-Flag)
CUL1
40 –
55 –
90 –
MW(kDa)
MCT1
-
CD147
100
-
-
-
7055
35
25
-
GST
GST-CRBN
Coom
asie
-100-
-
-
7055
35
25
-
MW(kDa)
[35S]
Met
Auto
-radio
grap
h
– – + + – – + + Len.
CD147MCT1
dc
sh_CRBN-2Len. - +- ++CRBN
CD147
MCT1
β-actin
-
sh_Ctrl
+ +- ---- -+ +--- -- -++
sh_CRBN-1
ePr
olife
ratio
n (fo
ld)
0
1.0***
CRBN
CD147
CUL1
MCT1
CRBN
WT
EV
CRBN
YW/A
A
0.20.40.60.8
DMSOLen.
MW(kDa)
35 –
55 –
55 –
40 –
40 –
MW(kDa)
35 –
55 –
55 –
40 –
90 –
Nature Medicine: doi:10.1038/nm.4128

Eichner et al.
lentiviral transduction with two independent shRNAs (sh_CRBN). Cells were treated with 10
µM lenalidomide (Len.) for 96 h as indicated.
(d) Immunoblot analysis of MM1S cells in which expression of CRBN WT or
CRBNYW/AA was induced by infection with respective lentiviral expression constructs.
(e) Cell proliferation analysis of parental (WT), and two CRBN–/– (T11, T21) MM1S
myeloma lines. Cells were treated with 10 µM lenalidomide (Len.) for 96 h as indicated (n = 3
independent experiments with two technical replicates each, data is presented as mean ± s.d.).
***, P < 0.001; one-sample t-test.
Nature Medicine: doi:10.1038/nm.4128

Eichner et al.
Supplementary Fig. 3. Lenalidomide destabilizes CD147 and MCT1 in a time and dose
dependent manner and particularly affects high glycosylated CD147.
(a) Immunoblot analysis of MM1S cells treated with 10 µM lenalidomide (Len.) for the
indicated times.
(b) Immunoblot analysis of MM1S cells treated with different concentrations of Len. for
72 h.
(c) Immunoblot analysis of MM1S cells treated with Len. (10 µM), the glycosylation
inhibitor tunicamycin (5 µg/ml; 48 h) or the N-glycan cleaving enzyme PNGase (10 U/µg
protein added to whole cell lysate). HG, high-glycosylated CD147; CG, core-glycosylated
CD147; NG, non-glycosyated CD147.
1,25 12,5 25 10050
CRBN
CD147
MCT1
CUL1
Len. (μM)0
IKZF3
a c
MW(kDa)
40 –
55 –
35 –
55 –
70 –
90 –
Len. treatmenttime (h)0 6 12 24 48 9672
IKZF3MCT1
CUL1
CD147 (SE)
CD147 (LE)
CRBN
HG
CG
55 –
35 –
55 –
35 –
55 –
40 –70 –
90 –
MW (kDa)
b
MCT1 (LE)
CRBN
IKZF3
CUL1
DMSO
PNG
ase
Len.
MCT1 (SE)
MW(kDa)
55 –
35 –
25 –
40 –
40 –
70 –
55 –
90 –
Tuni
cam
ycin
55 –
35 –
25 –
CD147 (LE)
HG
CG
NG
CD147 (SE)
HG
CG
NG
Nature Medicine: doi:10.1038/nm.4128

Eichner et al.
Supplementary Fig. 4. IMiD induced loss of CD147 and MCT1 expression is not observed in
mouse cells and is not regulated at the level of transcription.
(a) Immunoblot analysis of the murine myeloma line X63AG8.653 (X63) as well as
mouse Ba/F3 cells that were treated with 10 µM lenalidomide (Len.) or 100 nM
pomalidomide (Pom.) as indicated.
(b) Cell proliferation of mouse X63AG8.653 and Ba/F3 cells treated with Len. or Pom. as
specified, compared to control (DMSO) (n = 3 independent experiments with 2 technical
replicates each, data is presented as mean ± s.d.).
d
c
MCT1CRBN CD147
MM1.S
mRN
Aex
pres
sion(
fold)
0
0.5
1.0
1.5
2.0
CRBN CD147 MCT10
0.5
1.0
1.5
2.0
sh_s
cr
sh_I
KZF1
sh_I
KZF3
CRBN
CD147
MCT1 β-actin
IKZF1
IKZF3
0
0.5
1.0
1.5
Prol
ifera
tion
(fold
)
DMSO10 μM Len.100 μM Pom.
a b
U266 DMSO Len 10 μM
CD147
MCT1
CUL1
CK1-α
CRBN
Ponceau
β-actin
DMSO
X63 Ba/F3
Len.
Pom
.
DMSO
Len.
Pom
.
MW(kDa)
40 –
55 –
35 –
35 –
55 –
90 –
40 –
MW(kDa)
40 –
55 –
70 –
35 –
55 –
40 –
55 –
Nature Medicine: doi:10.1038/nm.4128

Eichner et al.
(c) Immunoblot analysis of MM1S cells in which IKZF1 and IKZF3 expression was
silenced by lentiviral transduction with the indicated shRNA constructs.
(d) Real-time qPCR analysis of MM1S and U266 cell lines treated with 10 µM Len. or
vehicle as specified. The amount of mRNA in the control sample was set as 1. (n = 3
independent experiments with two technical replicates each, data is presented as mean ± s.d.).
Nature Medicine: doi:10.1038/nm.4128

Eichner et al.
Supplementary Fig. 5. Characterization of the interaction of CRBN with CD147 and MCT1.
(a) Immunoprecipitation of Flag-tagged IKFZ3, CD147, and MCT1 from HEK293T
cells treated with lenalidomide as indicated. DSS was used for protein crosslinking. Bound
protein fractions were subjected to immunoblot analysis.
(b) Schematic of full-length human CD147 and MCT1 proteins and GST-tagged
fragments of their intracellular domains. T, transmembrane domain, IgI, immunoglobulin-like
domain.
(c) GST pull-downs of the indicated fragments of CD147 and MCT1 in whole cell
extracts (WCE) of MM1S cells. Precipitates were subjected to immunoblot analyses.
(d) Immunoprecipitation of HA-CUL4A that was purified from HEK293T cells and
incubated with MM1S cell extracts that were treated with lenalidomide or vehicle as specified.
Bound protein fractions were subjected to immunoblot analysis.
1- CD147 WT-269Igl Igl T
-269
T T1- -500 MCT1 WTT TT T T T T T T T T
-262
-500
GST-MCT1 (AA 188–262)GST-MCT1 (AA 444–500)
GSTGST
GST GST-CD147 (AA 230–269)
b
c
CRBN 35
25
WCE
GST
GST
-MCT
1 (A
A 18
8–26
2)
GST
-MCT
1 (A
A 44
4–50
0)
GST
-CD1
47 (A
A 23
0–26
9)
MW (kDa)
Ponceau
55
a
CRBN
EV IKZF3- +- - +- - +-
β-tubulin
IKFZ3/CD147/MCT1 (anti-Flag)CRBN
Len. IP
: ant
i-Fla
gW
CEEV CD147 EV MCT1
CRBN
CD147
MCT1
IKZF3
IP: anti-HA
WCE+ +--- -++
Len. - ++-CUL4A(anti-HA)
EVHA-CUL4A
DDB1
MW(kDa)
55 –
90 –
130 –
70 –
55 –
35 –
40 –
d
Nature Medicine: doi:10.1038/nm.4128

Eichner et al.
Supplementary Fig. 6. Cell surface expression of the CD147/MCT1 complex is CRBN-
dependent and is abrogated by lenalidomide.
(a) Visualization of HeLa cells stably expressing the indicated shRNA constructs and
transfected with expression constructs encoding HA-CD147 and Flag-MCT1. Cells were
incubated with an ER-tracker (blue) followed by fixation with paraformaldehyde and
ERMCT1 CD147 Merge
sh_C
RBN
sh_C
trl
a b
0
0.5
1.0
CD14
7 ex
pres
sion
(MFI
) *
DMSOLen.
CD147 DAPI MergeCRBN
MCT1 DAPI MergeCRBN
c
d
DMSO
Len.
DMSO
Len.
Nature Medicine: doi:10.1038/nm.4128
Eichner et al.
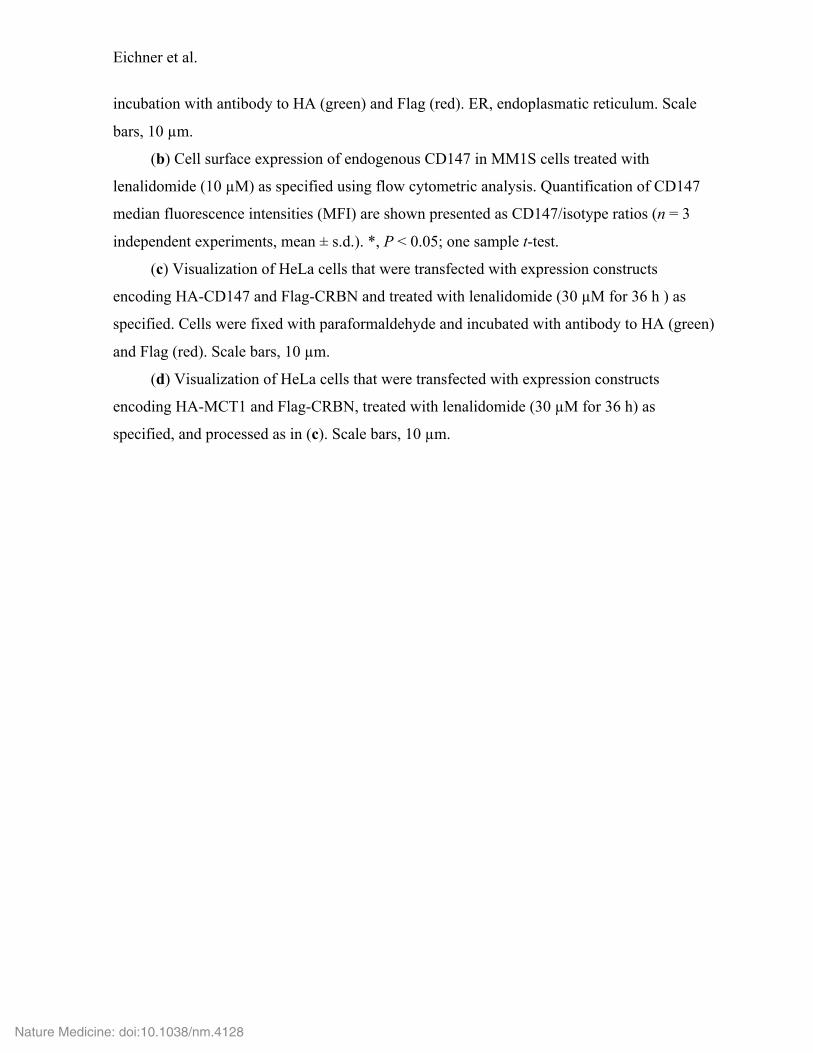
incubation with antibody to HA (green) and Flag (red). ER, endoplasmatic reticulum. Scale
bars, 10 µm.
(b) Cell surface expression of endogenous CD147 in MM1S cells treated with
lenalidomide (10 µM) as specified using flow cytometric analysis. Quantification of CD147
median fluorescence intensities (MFI) are shown presented as CD147/isotype ratios (n = 3
independent experiments, mean ± s.d.). *, P < 0.05; one sample t-test.
(c) Visualization of HeLa cells that were transfected with expression constructs
encoding HA-CD147 and Flag-CRBN and treated with lenalidomide (30 µM for 36 h ) as
specified. Cells were fixed with paraformaldehyde and incubated with antibody to HA (green)
and Flag (red). Scale bars, 10 µm.
(d) Visualization of HeLa cells that were transfected with expression constructs
encoding HA-MCT1 and Flag-CRBN, treated with lenalidomide (30 µM for 36 h) as
specified, and processed as in (c). Scale bars, 10 µm.
Nature Medicine: doi:10.1038/nm.4128

Eichner et al.
Supplementary Fig. 7. CRBN mediated maturation of the CD147/MCT1 complex is
abrogated by lenalidomide.
(a) Immunoprecipitation (IP) of Flag-CD147 from whole cell extracts (WCE) of MM1S
cells that were treated with cycloheximide (CHX) for the indicated times before lysis. Bound
protein fractions were analyzed by immunoblotting. The asterisk denotes unspecific bands.
(b) Immunoprecipitation of Flag-MCT1 from whole cell extracts of MM1S cells that were
treated as in (a). Bound protein fractions and whole cell extracts analyzed by immunoblotting
are shown.
(c) Immunoprecipitation of Flag-MCT1 with endogenous CD147 (left) or Flag-CD147
with endogenous MCT1 (right) from HEK293T cells in which CRBN expression was induced
by a CRBN expression construct. Immunocomplexes were probed with antibodies to the
indicated proteins.
(d) Autoradiographic analysis of CD147 immunoprecipitates from MM1S cells that were
pulsed with 35S Met/Cys, treated with lenalidomide (10 µM) and/or the glycosylation
inihibitor tunicamycin (10 µM) as indicated, and chased for the specified times. CG, core
glycosylated; HG, high glycosylated (mature form).
a b
CUL1
CD147
MCT1 (anti-Flag)
IP: anti-FlagCRBN+-
CRBN
WCE- +--
MCT1
CD147 (anti-Flag)
IP: anti-FlagCRBN+-
CRBN
WCE- +--
CUL1
0
35 –
24
+ Len.– Len.
0 1 3 6 24 24 1 3 246 Time (h)+ Glyc. Inhib.
S35 Autoradiogram
MW (kDa)
55 –CD147
HG
CG
CRBN
MCT1 (anti-Flag) 0 0.5 1 2 4
IP:
anti-
Flag
WCE
CHX treatment time (h)60Flag-MCT1+ + + + + +-
CRBN MCT1 (anti-Flag) *
CRBN
CD147(anti-Flag)
0 0.5 1 2 4IP
: ant
i-Fla
gW
CECHX treatmenttime (h)
60Flag-CD147+ + + + + +-
CRBN
CD147 (anti-Flag) *
*
c
d
MW(kDa)
35 –
55 –
55 –
55 –
35 –
55 –
MW(kDa)
55 –
40 –55 –
40 –
MW(kDa)
35 –
40 –
55 –
90 –
55 –
MW(kDa)
35 –
40 –
55 –
55 –
90 –
Nature Medicine: doi:10.1038/nm.4128

Eichner et al.
Supplementary Fig. 8. Analysis of lenalidomide-sensitive and -resistant MM cell lines and
primary patient derived MM cells.
(a) Quantification of the CD147 and MCT1 protein expression levels of immunoblots
b
CD14
7 ex
pres
sion
(fold
)
0
0.5
1.5
1.0
a
e
** * ** **
DMSOLen.
MCT
1 ex
pres
sion
(fold
)
0
0.5
1.5
1.0
DMSOLen.
** * ** **
f
Intra
cellu
larla
ctat
e(fo
ld)
0
0.5
1.5
1.0
2.0*
*
sh_Ctrlsh_CRBNsh_MCT1
0
0.4
1.0
0.2
0.6
0.8
VEG
F se
cret
ion
(fold
) sh_Ctrlsh_CRBNsh_CD147sh_MCT1
*******
0
20
40
60
80
Anne
xinV–
& PI
–(%
)
0
20
40
60
80
dLensens Lenres
*
c
MCT1
CD147
KMS12BM
RPMI8226
sh_Ctrlsh_CD147sh_MCT1
+--
-+-
--+
+--
-+-
--+
U266+--
-+-
--+
MM1S+--
-+-
--+
AMO1+--
-+-
--+
L363+--
-+-
--+
Lensens Lenres
CUL1
MW(kDa)
35 –
40 –
55 –
90 –
CUL1
MCT1
CRBN
sh_Ctrlsh_CRBNsh_MCT1
+––
–+–
––+
MW(kDa)
90 –
40 –
55 –
CUL1MCT1
CRBN
sh_Ctrlsh_CRBNsh_CD147sh_MCT1
+––
–+–
––+
–––
– – – +
CD147
MW(kDa)
35 –
40 –
55 –
90 –
55 –
**
02040
6080
100
0
100
50
150
Lensens Lenres
CD14
7 ex
pres
sion
(MFI
)
CD14
7 ex
pres
sion
(MFI
)
020406080
100
0
50
100
150
Anne
xinV–
& PI
–(%
)
Nature Medicine: doi:10.1038/nm.4128

Eichner et al.
shown in Fig. 3a averaged with two additional independent experiments (n = 3 independent
experiments, mean ± s.d.). *, P < 0.05; **, P < 0.01; one sample t-test.
(b) Immunoblot analysis of the indicated lenalidomide-sensitive and -resistant MM cell
lines, in which CD147 and MCT1 were silenced using the specified shRNAs. The
corresponding proliferation analysis is presented in Fig. 3c.
(c) Cell surface expression (MFI, median fluorescence intensity) of CD147 in purified
primary CD138 positive MM cells derived from patients with either lenalidomide sensitive or
resistant diesease using flow cytometric analysis and treated with lenalidomide or DMSO for
48 h. Bar graphs show cumulative MFI ratios of Len. relative to DMSO (left), next to
individual absolute MFI values (right) (len. sensitive: n = 5 subjects, len resistant: n = 5
subjects; mean ± s.e.m.). **, P < 0.01; one-sample t-test.
(d) Flow cytometric analysis (annexin V / PI) of cells described in (c) (len. sensitive: n
= 5 subjects, len resistant: n = 5 subjects; mean ± s.e.m.). *, P < 0.05; Student’s t-test.
(e) Analysis of intracellular lactate levels in MM1S cells in which CRBN or MCT1 were
silenced by the specified shRNAs (left) (n = 4 independent experiments, mean ± s.d.). *, P <
0.05; one-sample t-test. Representative immunoblot analysis of the respective cells (right).
(f) Analysis of VEGF secretion in MM1S cells in which CRBN, CD147 or MCT1 were
silenced by the specified shRNAs (left) (n = 5 independent experiments, mean ± s.d.). **, P <
0.01; ***, P < 0.001; one-sample t-test. Representative immunoblot analysis of the respective
cells using the specified antibodies (right).
Nature Medicine: doi:10.1038/nm.4128

Eichner et al.
Supplementary Fig. 9. Expression of CD147 on CD45low/CD235α+ erythropoiesis in MDS
bone marrow of representative non-del(5q), untreated del(5q) and lenalidomide treated del(5q)
patient samples.
Shown are representative plots from subjects #5, #13 and #28 (see Supplementary
Table 2). Using a CD45 and SSC gating strategy, the gate was set on CD45low cells with low
SSC properties. Next, CD34 expressing and CD235α expressing cells within this gate were
discriminated and an analysis gate was set on CD235α+ cells. CD147 expression of
CD45lowCD235α+ cells was determined by histogram gating. Shaded histograms, IgG isotype
control; red histograms, CD147.
SSC
CD459.71
Del(5q)CD34
CD235α21.2
21.1 54.3
Count
CD147
CD45low CD34low/CD235α+
SSC
CD4528.4
Del(5q):+:Len.
CD34
CD235α9.36
22.0 66.8
Count
CD147
CD45low CD34low/CD235α+
SSC
CD456.69
Non?del(5q)
CD34
CD235α18.3
0.057 76.2
Count
CD147
CD45low CD34low/CD235α+
Nature Medicine: doi:10.1038/nm.4128

Eichner et al.
Supplementary Fig. 10. CD147 and MCT1 expression is independent of CK1-α in del(5q)
and non-del(5q) MDS cells.
Immunoblot analysis using the specified antibodies of the indicated MDS cell lines, in
which CK1-α was silenced by the specified shRNAs.
CD147 (SE)
MCT1 (LE)
MCT1 (SE)
CK1-α
CRBN
CD147 (LE)
sh_Ctrlsh_CK1-α_1sh_CK1-α_2
+ - - + - -- + - - + -- - + - - +
MDSLdel(5q)
SKKnon-del(5q)
β-actin
55 –
35 –
35 –
40 –
40 –
MW (kDa)
55 –
35 –
55 –
40 –
Nature Medicine: doi:10.1038/nm.4128

Eichner et al.
Supplementary Fig. 11. Analysis of zebrafish injected with CD147 morpholinos or treated
with different IMiDs.
(a) Semiquantitative RT-PCR on cDNA extracted from zebrafish injected with CD147
splice morpholino (targeting the border of exon3/intron3) at the indicated concentrations or
control. PCR was performed with CD147 fw primer in exon 3 and CD147 rv primer in exon
5, or β-actin primers as control.
(b) Real-time qPCR analysis on cDNA from zebrafish described in (a). qPCR was
performed with CD147 fw primer in exon 3 and CD147 rv primer in exon 4 to detect spliced
mRNA. The amount of mRNA in the control sample was set as 1. (n = 3 independent
experiments with two technical replicates each, mean ± s.d.). ****, P < 0.0001; one-sample t-
test.
CD147 splice MO
unspliced(ex3–ex5: 2387 bp)
spliced(ex3–ex5: 341 bp)
CD14
7
500 bp
1000 bp
1500 bp
2000 bp
β-actin500 bp
a b
c
zf CD147 (SE)
Ponceau
zf CD147 (LE)
0 0.1 0.25 0 0.1 0.25
CD147 splice MO
CD147 ATG MO
μM
****
0
0.5
1.0 ****
CD14
7 m
RNA
0 0.1 0.25 mM
d
0
0.5
1.0
1.5
CD14
7 pr
otein
expr
essio
n(fo
ld) **55 –
35 –
MW (kDa)
55 –
35 –
Nature Medicine: doi:10.1038/nm.4128

Eichner et al.
(c) Immunoblot analysis of zebrafish larvae at 3 dpf that were injected with the indicated
CD147 morpholinos as specified.
(d) Quantification of zebrafish CD147 protein expression levels of immunoblots shown
in Fig. 6f averaged with two additional independent experiments (n = 3 independent
experiments, mean ± s.d.). Extracts were derived from zebrafish larvae treated with DMSO or
the indicated IMiDs. **, P < 0.01; one-sample t-test.
Nature Medicine: doi:10.1038/nm.4128
Eichner et al.
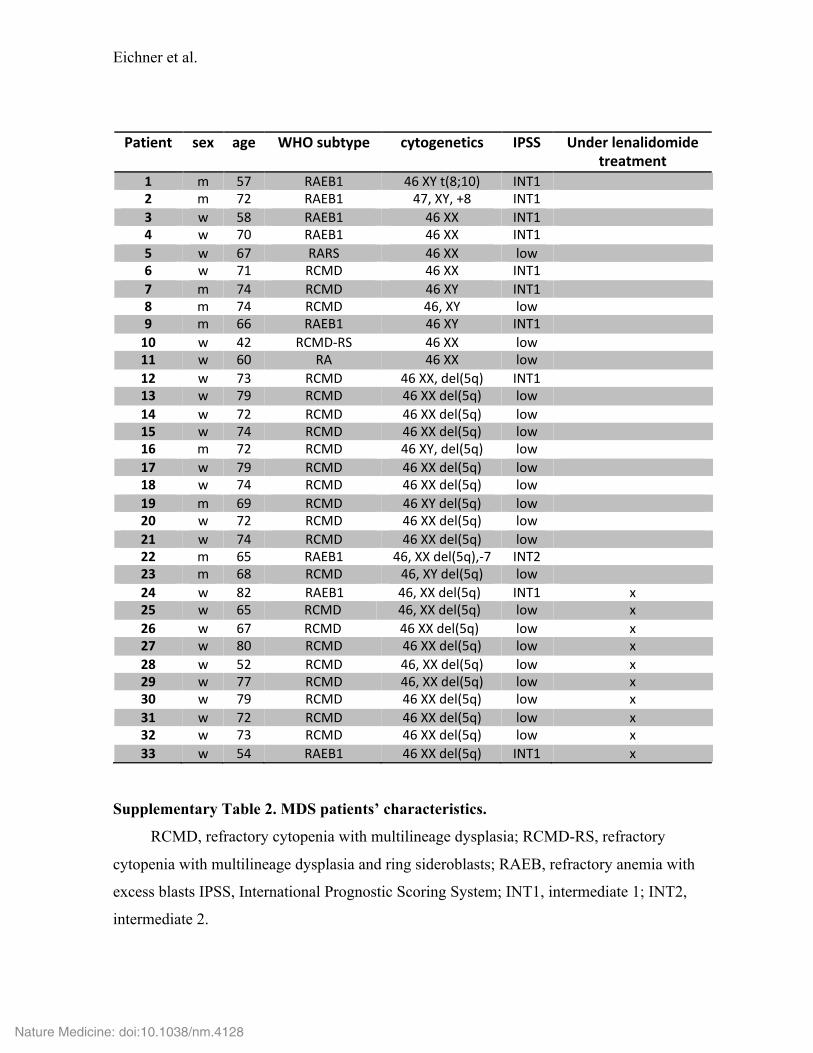
Supplementary Table 2. MDS patients’ characteristics.
RCMD, refractory cytopenia with multilineage dysplasia; RCMD-RS, refractory
cytopenia with multilineage dysplasia and ring sideroblasts; RAEB, refractory anemia with
excess blasts IPSS, International Prognostic Scoring System; INT1, intermediate 1; INT2,
intermediate 2.
Patient' sex' age' WHO'subtype' cytogenetics' IPSS' Under'lenalidomide'
treatment'1' m" 57" RAEB1" 46"XY"t(8;10)" INT1" "2' m" 72" RAEB1" 47,"XY,"+8" INT1" "3' w" 58" RAEB1" 46"XX" INT1" "4' w" 70" RAEB1" 46"XX" INT1" "5' w" 67" RARS" 46"XX" low" "6' w" 71" RCMD" 46"XX" INT1" "7' m" 74" RCMD" 46"XY" INT1" "8' m" 74" RCMD" 46,"XY" low" "9' m" 66" RAEB1" 46"XY" INT1" "10' w" 42" RCMDARS" 46"XX" low" "11' w" 60" RA" 46"XX" low" "12' w" 73" RCMD" 46"XX,"del(5q)" INT1" "13' w" 79" RCMD" 46"XX"del(5q)" low" "14' w" 72"" RCMD" 46"XX"del(5q)" low" "15' w" 74" RCMD" 46"XX"del(5q)" low" "16' m" 72" RCMD" 46"XY,"del(5q)" low" "17' w" 79" RCMD" 46"XX"del(5q)" low" "18' w" 74" RCMD" 46"XX"del(5q)" low" "19' m" 69" RCMD" 46"XY"del(5q)" low" "20' w" 72" RCMD" 46"XX"del(5q)" low" "21' w" 74" RCMD" 46"XX"del(5q)" low" "22' m" 65" RAEB1" 46,"XX"del(5q),A7" INT2" "23' m" 68" RCMD" 46,"XY"del(5q)" low" "24' w" 82" ""RAEB1" 46,"XX"del(5q)" INT1" x"25' w" 65" "RCMD" 46,"XX"del(5q)" low" x"26' w" 67" "RCMD" 46"XX"del(5q)" low" x"27' w" 80" RCMD" 46"XX"del(5q)" low" x"28' w" 52" RCMD" 46,"XX"del(5q)" low" x"29' w" 77" RCMD" 46,"XX"del(5q)" low" x"30' w" 79" RCMD" 46"XX"del(5q)" low" x"31' w" 72" RCMD" 46"XX"del(5q)" low" x"32' w" 73" RCMD" 46"XX"del(5q)" low" x"33' w" 54" RAEB1" 46"XX"del(5q)" INT1" x"
Nature Medicine: doi:10.1038/nm.4128