Embed Size (px)
Citation preview

1
Supplementary Information for Outflanking Immunodominance to Target Subdominant
Broadly Neutralizing Epitopes
Davide Angeletti1,2*, Ivan Kosik1, Jefferson J.S. Santos1, William T. Yewdell3, Carolyn M.
Boudreau4,5, Vamsee V.A. Mallajosyula6, Madeleine Mankowski1, Michael Chambers7,
Madhu Prabhakaran7, Heather D. Hickman8, Adrian B. McDermott7, Galit Alter4, Jayanta
Chaudhuri3, Jonathan W. Yewdell1*
*Corresponding author. Email: [email protected] (D.A.); [email protected] (J.W.Y.) This PDF file includes: SI Text
Figs. S1 to S8
www.pnas.org/cgi/doi/10.1073/pnas.1816300116
2
SI Text
Animals. C57BL/6 mice were purchased from Taconic Farm. For all experiments female
8-12 weeks old mice were used and randomly assigned to experimental group. All mice
were held under specific pathogen-free conditions. All animal procedures were approved
and performed in accordance with the NIAID Animal Care and Use Committee Guidelines.
Proteins and immunization. Recombinant A/Puerto Rico/8/34 (PR8) HA with the Y98F
mutation(1) and H1HA10-Foldon stem only construct derived from PR8(2) were used for
the initial immunization studies. Endotoxin levels were estimated using Pierce LAL
Chromogenic Endotoxin Quant Kit (ThermoFisher) and were < 10 EU/mg for full length
HA and <50EU/mg for stem construct. Animals were randomly divided in 4 groups and
immunized i.m. in the left hind leg, under mild isoflurane anesthesia, with recombinant
proteins mixed with Titermax Gold adjuvant (Sigma). Group 1 and 4 received 10ug of HA
(0.8uM) in the left hind leg, group 2 received 4ug of stem (0.8uM) in the left hind leg while
group 4 the same amount in the right hind leg. Group 3 received equimolar mixture of the
two proteins in the left hind leg. 21 days after prime all the groups were boosted with the
same amount of protein without adjuvant. 21 days after boost, serum was collected,
animals sacrificed and spleen and inguinal and iliac LN collected.
Other groups of animal were immunized with HA sucrose purified from PR8 virus (3).
After addition of PBS the solution was spun at 50,000xg for 2h at 4 C. The supernatant,
containing HA and NA, was incubated at 56 C for 30 min after addition of 10mM EDTA.
Purity was verified by Western blot and HA quantified by DC Protein Assay (Biorad).
Animals were then immunized i.m. or via the hock f.p. with 10ug of HA (0.8uM) mixed
with Titermax Gold adjuvant (Sigma). For repeated i.m. animals were immunized i.m.

3
with 25ug of HA with Titermax Gold adjuvant on day 0, followed by 50ug of HA without
adjuvant on day 1 and 50ug of HA without adjuvant on day 2. On day 21 serum was
collected, animals sacrificed and spleen and iliac LN collected with also inguinal for i.m.
and popliteal for f.p.
For heterologous prime and boost experiments, animals were immunized i.m. with 10ug of
HA (from split virus preparation) or 4ug of stem mixed with Titermax Gold adjuvant
(Sigma). On day 21 serum was collected and animals were boosted with 4ug of stem or
10ug of HA (from split virus preparation) mixed with adjuvant, respectively. On day 21
post-boost serum was collected, animals sacrificed and spleen and iliac LN collected.
For experiments with deglycosylated HA, animals were immunized i.m. with 10ug of HA
(from split virus preparation) or deglycosylated HA (from split virus preparation) mixed
with Titermax Gold adjuvant (Sigma). On day 21 serum was collected, animals sacrificed
and spleen and iliac LN collected.
HA deglycosylation. PR8 virus was propagated in 10-day old SPF embryonated chicken
eggs in the presence of 40 μg kifunensine (Tocris) as previously described (4). HA was
purified from virus stocks as described above and then treated with EndoHf (New England
Biolabs) for 16 h at 37˚C. EndoHf removes N-linked high mannose and some hybrid
oligosaccharides, leaving only a single N-acetylglucosamine at each of the N-glycosylation
sites. After incubation, reactions were mixed with Amylose resin slurry (New England
Biolabs) in PBS. Following o.n. incubation at 4˚C, the resin was spun at 1,500 RPM and
the supernatant collected. Deglycosylated HA was quantified by DC Protein Assay
(Thermo Scientific) and verified by SDS-PAGE, Western blot and ELISA.

4
Flow cytometric analysis. For flow cytometric detection recombinant PR8 H1 HA and
A/Indonesia/5/05 H5 HA with Y98F mutation(1) were pre-labeled with streptavidin-APC
and streptavidin-PE (ThermoFisher, SA1005 and SA10041), respectively. Briefly,
proteins were diluted at 0.02mg/ml and labeled by stepwise addition (at 10 minutes
intervals) of molar excess of fluorescent streptavidin. Labeled proteins were stored at 4°C
and generally used within 2 weeks of labelling.
Draining LN and spleens were harvested individually and single cells suspension prepared
by mechanical dissociation. Red blood cells were lysed using ACK lysis buffer (Gibco).
Cells were counted and up to 5 million cells stained per tube. Organs were stained with
fluorescent HA (final concentration 4nM for each probe) and Ab cocktail for 1h at 4°C in
PBS/0.1% BSA. The following Abs were used in different experiments: from BD
Bioscience BV510 anti mouse CD3 (clone 145-2C11)(cat 563024), APC-Cy7 anti-mouse
B220 (cloneRA3-6B2)(cat 552094), Pacific Blue anti-mouse B220 (cloneRA3-6B2)(cat
558108), FITC anti-mouse CD38 (clone 90)(cat 558813), FITC anti-mouse GL7 (clone
GL7)(cat 553666), PE anti-mouse GL7 (clone GL7)(cat 561530), PerCP-Cy5.5 anti-mouse
IgD (clone11-26c.2a)(cat 564273); from Biolegend BV785 anti-mouse B220 (cloneRA3-
6B2)(cat 103246), Pacific Blue anti-mouse IgD (clone11-26c.2a)(cat 405712),
APC/Fire750 anti-mouse IgD (clone11-26c.2a)(cat 405744), PE/Dazzle594 anti-mouse
IgD (clone11-26c.2a)(cat 405742), PE/Dazzle594 anti-mouse IgM (clone RMM-1)(cat
406530), BV606 anti-mouse IgG (poly4053)(cat405327), Pe-Cy7 anti-mouse CD86 (clone
GL-1)(cat 405014), PE anti-mouse PD-1 (clone 29F.1A12)(cat 135205), FITC anti-ICOS
(clone C398.4A)(cat 313506); from eBioscience PerCP-e710 anti-mouse CD38 (clone
90)(cat 46-0381-82), e450 anti-mouse GL7 (clone GL7)(cat 48-5902-82), PE-Cy7 anti-

5
mouse IgM (clone II/41)(cat 25-5790-82), e450 anti-mouse CXCR4 (clone 2B11)(cat 48-
9991-82), APC-e780 anti-mouse CD4 (clone GK1.5)(cat 47-0041-82). After PBS washes,
live/dead staining was performed with Live/Dead fixable Aqua kit (Thermo Fisher cat
L34957) for 30 minutes at 4°C. Cells were washed trice with PBS/0.1% BSA and
resuspended in PBS/0.1% BSA. Samples were analyzed using a BD LSR Fortessa X-20
instrument. Analysis was performed using FlowJo software (TreeStar).
For staining of T follicular cells, after single cell suspension preparation, cells were stained
with antibody cocktail in 25ul + Biotin anti-mouse CXCR5 (clone SPRCL5)(eBioscience
cat 13-7185-82) at 1:25 dilution in PBS/0.1% BSA. After washes, cells were incubated
with streptavidin-APC for 15 min at 4°C, washed and live/dead staining performed as
above. Cells were then permeabilized with eBioscience Foxp3 staining buffer set (cat 00-
5523-00) according to manufacturer’s protocol. After permeabilization cells were washed
with Permeabilization Buffer and stained with PE-Cy7 anti-mouse Foxp3 (clone FJK-
16s)(eBioscience cat 25-5773-82) at 1:25 dilution for 30 min at RT. Cells were finally
washed with permeabilization buffer and resuspended in PBS/0.1% BSA for analysis as
above.
Precursor frequency quantification. For precursor frequency quantification we took
advantage of the method developed for TCR (5) in order to increase staining of otherwise
low affinity cells. Spleen, inguinal, axillary, mandibular, cervical and mesenteric LNs were
collected from naïve mice, pooled and prepared as above. Protein kinase inhibitor (PKI)
dasatinib (Axon Medchem) was added at a final concentration of 50 nM for 30 min at 37°C.
Without washing, 10ug of unlabeled Streptavidin (Invitrogen, cat 434301) were added per
tube for 20 min at 4°C. Again, without washing, proteins were added in the following

6
combinations with final HA concentration of 8nM for 40 min at 4°C: H1-APC + H1-PE,
H5-APC + H5-PE, H1-APC + H5-PE (to determine stem precursor frequencies), SA-APC
+ SA-PE (to determine SA precursor frequency), H1-APC + SA-PE (control). Cells were
washed twice and unlabeled anti-mouse-PE (clone PE001)(Biolegend cat 408101) and
anti-mouse APC (clone APC003)(Biolegend cat 408001) were added at 10ug/ml for 20
min at 4°C. After washes cells were stained with the following surface Abs: from
Biolegend PE/Dazzle594 anti-mouse CD3 (clone 17A2)(cat 100246), FITC anti-mouse
CD21/CD35 (clone 7E9)(cat 123407), APC/Cy7 anti-mouse CD23 (cloneB3B4)(cat
101630); from BD Bioscience BV421 anti-mouse CD43 (clone S7)(cat 562958); BV785
anti-mouse B220, PE-Cy7 anti-mouse IgM, PerCP-Cy5.5 anti-mouse IgD (as above).
Aqua live dead staining was performed as above and more than 10 milion cells acquired
per tube. Precursor frequency was defined as PE/APC double positive population – the
frequency of the same population in the control tube.
AC50 measurement of GC B cell population affinity. Draining LN were prepared and
stained as above, using a low input cell number per tube (10,000-20,000 antigen specific
cells per tube) and incubated with a graded concentration of unlabeled rHA (0.66nM to
66nM). After washes, HA was detected using APC-conjugated streptavidin at 1:500
dilution for 30 min at 4°C .Data were plotted using frequency of rHA positive B cells and
50% maximal binding (AC50) calculated using a single one-site binding with Hill slope
calculation (6).
ELISA and serum quantification. Microlon medium binding half-well ELISA plates
(Greiner Biotech) were coated overnight at 4°C with recombinant H1, H5 HAs and stem
(7) in 25ul PBS. For background quantification plates were coated with his-tagged

7
Recombinant Encterobacteria phage T4 fibritin (wac) (Cusabio). Plates were blocked with
50ul PBS/4% milk for 2 hours at RT. After 3x washes with PBS+0.05% Tween-20 (PBST)
plates were incubated with three-fold dilutions of sera starting from 1:200 in PBST for 90
min at RT. After 3x washes plates were incubated with 25ul of rat anti-mouse kappa, IgG1,
IgG2(b+c) or IgM specific HRP-conjugated (Southern Biotech) or peroxidase anti-mouse
IgG (vectorlab) diluted 1:2000 for 1h at RT. After 3x washes plates were developed for 5
minutes using TMB substrate (KPL biomedical) and halted with 0.1N HCl. Plates were
read at 450nm. For endpoint titer determination, sera from at least six mice immunized
with irrelevant proteins were tested using the same conditions. Cutoff for positivity was
determined using the formula from (8). For quantification of head Ab titer, the serum was
pre-absorbed using recombinant stem as follows. 5ug of his-tagged stem was incubated
with Talon-Agarose resin in PBS, following 1h incubation at 4°C the slurry was washed
with PBS and then incubated with sera o.n. in rotation at 4°C. The resin was spun at 300xg
and allowed to settle and the supernatant collected and used for ELISA. For each sera a
pre- and a post- absorption samples were run on all the recombinant proteins to verify
depletion. For endpoint titer determination “Head titer” was considered based on reactivity
of depleted sera on H1 while “stem titer” on the reactivity of serum pre-depletion on stem.
For competition with stem mAbs FI6 and 310-16G8 ELISA was performed as above with
the following modifications: H1 HA coated plates were incubated with pooled HA (group
1) or stem (group 2) sera, after washed the human stem mAbs were dispensed to the wells
at the concentration giving 75% of their maximum signal. Plates were detected with anti-
human-kappa (southern biotech) diluted 1:100 and results express as % binding relative to
uncompleted mAb.

8
ELISA Immunodominance profile. Plates were coated with equal amount of virally
purified HA derived from D4 viruses as described in (9). After blocking, plates were
incubated with two-fold serially diluted sera starting from 1:100 for 1h at RT. Following
washes with PBST, serum binding was detected using anti-mouse-kappa secondary Ab at
1:2000 for 1h at RT. ELISA binding is expressed as area under the curve, calculated using
GraphPad Prism as described before (9).
Antibody Dependent Cellular Phagocytosis (ADCP) assay. Biotinylated proteins were
incubated with 1mm fluorescent neutravidin-coated beads (Invitrogen cat no F8776) for 2
hours at 37°C. Antigen-coated beads were then incubated with serum samples diluted 1:50
in PBS for 3 hours at 37°C in 96-well plates. Unbound antibody was washed away, and
primary BALB/c mouse monocytes (isolated using EasySep Mouse Monocyte Isolation
Kit, Stemcell Technologies cat no 19861) added at 12,500 per well and incubated at 37°C
for 4 hours, then fixed. Phagocytosis was measured by flow cytometry on an Intellicyte
iQue cytometer. Phagocytic scores are the % of bead positive cells x GMFI/10,000.
Antibody Dependent Complement Deposition (ADCD) assay. Antigen-coated beads
were prepared as in ADCP and incubated with diluted serum samples for 2 hours at 37°C.
Lyophilized guinea pig complement (Cedarlane) was resuspended in ice cold water, then
diluted in veronal buffer with 0.1% gelatin, calcium and magnesium (Boston BioProducts
cat no IBB-300X). Complement was added to opsonized beads and incubated for 20
minutes at 37°C. Beads were then washed with 15mM EDTA, stained with anti-guinea
pig C3 (MP Biomedicals cat no 0855385), and incubated 15 minutes at room temperature.
Samples were washed and analyzed on a BD LSRII cytometer with a high-throughput

9
sampler to record the geometric mean of fluorescence intensity. Area under the curve was
calculated using Graphpad Prism based on two dilutions (1:5 and 1:10)
PE quantification in LN. R-Phycoerythrin (Prozyme, cat PB32) was diluted in PBS and
injected i.m. or via the f.p. 24h after injection, mice were sacrificed and draining LN
removed and homogenized. Single cell LN suspension was filtered and resuspended in
200ul and 50 ul transferred to the well in two duplicate two-fold dilutions. A standard
curve with 24 two-fold dilutions of R-PE starting from 1ug/ml was performed on every
plate (Costar, White 96 well plates). Plates were read using Synergy H1 at ex 535nm / em
575 nm.
Virus inhibition assay. The self-reporting PR8-mCherry expressing virus was employed
to measure neutralization properties of immune sera. Briefly, 40,000 MDCK cells were
seeded on black 96 well plate. The mCherry expressing virus (500 TCID50) was
preincubated with serial dilutions of sera at 37°C for 60 minutes in 100 ul MEM media
supplemented with 0.3% BSA and trypsin-TPCK (1ug/m). The cells were washed twice
with PBS and the virus-serum mixture was transferred onto the cells. At 18 h post
infection, cells were washed once and 30ul of 0.5% NP-40 in DPBS added for 15 minutes
at 37°C. Plates were read using Synergy H1 at ex 580 / em 610nm. The average signal
measured in absence of the Ab was considered 100% infectivity and used for calculation
of fraction infected at any given Ab concentration.
Infected cell binding assay. MDCK cells were infected using PR8-mCherry expressing
virus at MOI=5 for 5h at 37°C. After incubation, cells were transferred into tubes and
stained with pre-immune or immune sera diluted 1:50 for 90 min at 37°C. After washes
with PBS/0.1% BSA cells were fixed overnight in 1.5% PFA. Cells were washed and

10
stained with Pe-Cy7 anti-mouse IgG (poly4053)(Biolegend, cat405315) for 30 min at 4°C
before acquisition via flow cytometry.
Challenge studies. Female 8–12-wk-old mice were randomly assigned to experimental
groups. Respective group of mice were immunized once i.m. or via the footpad-hock as
above. Twenty-one days after prime, animals were anesthetized with isoflurane and
intranasally infected with 25 µl of chimeric cH5/H1/N1 virus diluted in sterile saline
supplemented with 0.1% BSA. Challenge virus possesses mismatched HA head but
identical stem domain at pathogenic dose. We recorded weight for 14 d and euthanized
mice when reached 30% weight loss. We excluded mice (n = 2) from stem immunization
group as these bubbled extensively during virus administration and showed no signs of
infection and weight loss compared with the rest of the animals in a given experiment.
Statistical analysis. GraphPad Prism (GraphPad Software Inc.) was used for statistical
analysis. Mice were randomly allocated to experimental groups and the investigators were
not blinded on the identity of the samples except for the neutralization and ADCS and
ADCP assays. For comparison between two groups two-sided unpaired student’s t test was
performed. For comparison of one variable between multiple groups one-way ANOVA
with Tukey’s multiple comparison test was performed. For comparison between multiple
variable across multiple groups two-way ANOVA with Holm-Sidak’s multiple comparison
test was performed. When data did not pass the normality test it was log transformed before
plotting and statistical analysis. For all figures data point indicate individual mice. *
represents P < 0.05, ** P < 0.01, *** P < 0.001, **** P < 0.0001.
Data availability. All the reagents described in the study and the data that support the
findings reported are available from the corresponding authors upon request.
11
SI References
1. Whittle JR, et al. (2014) Flow cytometry reveals that H5N1 vaccination elicits cross-reactive stem-directed antibodies from multiple Ig heavy-chain lineages. J Virol 88(8):4047-4057.
2. Mallajosyula VV, et al. (2014) Influenza hemagglutinin stem-fragment immunogen elicits broadly neutralizing antibodies and confers heterologous protection. Proc Natl Acad Sci U S A 111(25):E2514-2523.
3. Altman MO, Bennink JR, Yewdell JW, & Herrin BR (2015) Lamprey VLRB response to influenza virus supports universal rules of immunogenicity and antigenicity. eLife 4.
4. Tseng YC, et al. (2019) Egg-based influenza split virus vaccine with monoglycosylation induces cross-strain protection against influenza virus infections. Proc Natl Acad Sci U S A.
5. Tungatt K, et al. (2015) Antibody stabilization of peptide-MHC multimers reveals functional T cells bearing extremely low-affinity TCRs. Journal of immunology (Baltimore, Md. : 1950) 194(1):463-474.
6. Frank GM, et al. (2015) A Simple Flow-Cytometric Method Measuring B Cell Surface Immunoglobulin Avidity Enables Characterization of Affinity Maturation to Influenza A Virus. mBio 6(4):e01156.
7. Yassine HM, et al. (2015) Hemagglutinin-stem nanoparticles generate heterosubtypic influenza protection. Nat Med 21(9):1065-1070.
8. Frey A, Di Canzio J, & Zurakowski D (1998) A statistically defined endpoint titer determination method for immunoassays. Journal of immunological methods 221(1-2):35-41.
9. Angeletti D, et al. (2017) Defining B cell immunodominance to viruses. Nature immunology 18(4):456-463.

12
SI Figures
a
b c
GL7
-FIT
C
CD38-PerCPe710
Iliac LN(right)
Iliac LN(left)
Inguinal LN(right)
Inguinal LN(left)
Spleen0
2000
4000
6000
8000
10000100001500020000
GC
B c
ells
(num
ber/1
06 cel
ls)
1 - HA (left)2 - Stem (left)3 - HA+Stem mix (left)4 - HA (left) + Stem (right)
SSC
-A
FSC-AFS
C-H
FSC-A
CD
3/Li
ve d
ead-
BV5
10
B220-APC-Cy7
GL7
-FIT
C
CD38-PerCPe710
IgM
-PEc
y7
IgD-PB
H1 HA H1 StemH1 HA +H1 Stem
1 2 3 4
H1 HA H1 Stem
IliacInguinal
rightleft
rightleft
d
eIliac LN(right)
Iliac LN(left)
Inguinal LN(right)
Inguinal LN(left)
Spleen0
1
2
3
4
H1+
swIg
GC
B c
ells
nu
mbe
r / o
rgan
(log
10)
Iliac LN(right)
Iliac LN(left)
Inguinal LN(right)
Inguinal LN(left)
Spleen0
1
2
3
4
H1+ H
5+ sw
Ig G
C B
cel
ls
num
ber /
org
an (l
og10
)
1 - HA (left)
2 - Stem (left)
3 - HA+Stem mix (left)
4 - HA (left) + Stem (right)
Head Stem
Iliac LN(right)
Iliac LN(left)
Inguinal LN(right)
Inguinal LN(left)
Spleen0
100
200
300
400
500
1000
2000
H1+
swIg
GC
B c
ells
(n
umbe
r/106 c
ells
)
Iliac LN(right)
Iliac LN(left)
Inguinal LN(right)
Inguinal LN(left)
Spleen0
100
200
300
15003000
H1+ H
5+ sw
Ig G
C B
cel
ls
(num
ber/1
06 cel
ls)
1 - HA (left)
2 - Stem (left)
3 - HA+Stem mix (left)
4 - HA (left) + Stem (right)
OVA i.m.
H1-
APC
H5-PE
denatured HA i.m.
GL7
-FIT
C
CD38-PerCPe710
OVA i.m. denatured HA i.m.f g

13
Figure S1. Flow cytometry gating strategy, GC B cell specificity and quantification.
(A) gating strategy for flow cytometry, cells were gated as live CD3- B220+ GL7+ CD38-
IgD- IgM- (B) Representative flow cytometry plot showing size of GC B cells, gated as live
CD3- B220+ GL7+ CD38- (C) Frequency of GC B cells as detected in the different LNs and
spleen after immunization as in Fig. 1A (n=9). Absolute number (D) and frequency (E) of
swig GC B cells as detected in the different LNs and spleen after immunization (n=9) as in
Fig 1C. Three independent experiments with 4 mice each (pooled for the first experiment).
Bar graph represent mean and bars SEM.
(F-G) Animals (n = 4) were immunized with OVA or denatured HA (boiled for 10 minutes
at 95C). (F) Representative flow cytometry plot showing size of GC B cells, gated as live
CD3- B220+ GL7+ CD38-, in the iliac draining LN. (G) Representative flow cytometry plot
showing background HA staining in the iliac draining LN.

14
10-2 10-1 100 101 1020.0
0.2
0.4
0.6
0.8
1.0
1.2
1.4
310-18F8, nM
OD
450
Stem
-spe
cific
mA
bsH
ead-
spec
ific
mA
bs
10-2 10-1 100 101 1020.0
0.2
0.4
0.6
0.8
1.0
1.2
1.4
310-18D5, nM
OD
450
10-2 10-1 100 101 102 1030.0
0.1
0.2
0.3
0.4
0.5
0.6
H17-L10, nM
OD
450
10-3 10-2 10-1 100 101 1020.0
0.5
1.0
1.5
2.0
2.5
IC5-4F8, nM
OD
450
10-2 10-1 100 101 1020.0
0.2
0.4
0.6
0.8
1.0
1.2
1.4
FI6v3, nM
OD
450
10-2 10-1 100 101 1020.0
0.1
0.2
0.3
0.4
0.5
310-18E7, nM
OD
450
Wild type HA DG-HA
10-2 10-1 100 101 1020.0
0.5
1.0
1.5
2.0
2.5
Y8-1A6, nM
OD
450
10-3 10-2 10-1 100 101 1020.0
0.5
1.0
1.5
2.0
2.5
H28-E23, nM
OD
450
10-2 10-1 100 101 1020.0
0.2
0.4
0.6
0.8
1.0
1.2
1.4
CR9114, nM
OD
450
10-2 10-1 100 101 1020.0
0.2
0.4
0.6
0.8
1.0
1.2
1.4
310-16G8, nM
OD
450
10-3 10-2 10-1 100 101 1020.0
0.5
1.0
1.5
2.0
2.5
H9-D3, nM
OD
450
10-2 10-1 100 101 102 1030.0
0.2
0.4
0.6
0.8
1.0
1.2
H17-L2, nM
OD
450
a
b H1 Stem1
2
3
4
5
ELIS
A e
ndpo
int t
iter (
log 1
0) Wild type HADG HA
Head Stem0
5
10
15
20
25
Hea
d/St
em G
C B
cel
ls
(Fre
quen
cy, %
)
Wild type HADG HA
c
d

15
Figure S2. Preparation, characterization and immunodominance of deglycosylated
HA from split virus.
A) SDS-PAGE analysis of deglycosylated HA: 1, fully glycosylated HA (wild type HA);
2, HA from kifunesine-grown virus; 3, deglycosylated HA (DG-HA) from kifunesine-
grown virus after treatment with EndoHf; 4, DG-HA after EndoHf removal. (B) Antigenic
characterization of wild type HA and DG-HA by ELISA using a panel of human anti-stem
and mouse anti-head mAbs. Bar is mean ± SD. (C) Frequency of head vs stem swIg GC B
cells for the 2 different groups 21 days after immunization. (D) Antibody endpoint titers
to full length PR8 HA and stem construct. Two independent experiments with 4 mice each
(n=8). Bar is mean ± SEM.

16
Figure S3. Characterization of serum Abs. (A) ELISA curves for full length HA
recognition from which endpoint titers were derived (n=46) (B) ELISA curves for Stem
recognition from which endpoint titers were derived (n=46) (C) ELISA curves of selected
sera for his-tagged recombinant encterobacteria phage T4 fibritin (wac) recognition
(n=24).
(D) Correlation showing endpoint titers of sera on stem-only antigen (as in Fig. 2A) vs H5
antigen for mice with a stem titer (groups 2, 3 and 4) (n=34). (E) Competition of stem
mAbs FI6 and 16G8 with pooled stem sera (from group 2 immunization) or HA sera (from
group 1) for binding on HA-PR8. PR8-HA coated plates were incubated with serial dilution
of pooled sera and subsequently detected with stem mAbs at EC75. Two independent
experiments with 12 pooled sera each. Bars is SEM. (F) Correlation of Head/Stem specific
swig GC B cells as in Fig. 1C vs ELISA endpoint titers as in Fig. 2A. (G) Sera from the
d
e
2 3 4 5 62
3
4
5
6
ELISA endpoint titer stem (log10)
ELIS
A en
dpoi
nt ti
ter H
A-H
5 (lo
g 10)
2 - Stem (left)
3 - HA+Stem mix (left)
4 - HA (left) + Stem (right)
r = 0.80p < 0.0001
0 1 2 3 4 50
2
4
6
8
B cell number (log10)
ELIS
A en
dpoi
nt ti
ter (
log 1
0)
HeadStem
Headr = 0.62p < 0.0001
Stemr = 0.64p < 0.0001
10 100 1000 10000 100000 10000000
50
100100200300
Rel
ativ
e bi
ndin
g (%
) 310-16G8 HA (pool)
Stem (pool)
serum dilution10 100 1000 10000 100000 1000000
0
50
100100200300
serum dilution
Rel
ativ
e bi
ndin
g (%
) FI6f
1HA (left)
2 Stem (left)
3HA+Stemmix (left)
4 HA (left)
+Stem (right)
1
2
3
4
5
Neu
tral
izat
ion
IC50
(log
10)
************ **
2 Stem (left)
pre-immunesera
stem mAb0
1000
2000
3000
4000
Cel
l bin
ding
(MFI
)
2 3 4 5 6
2
3
4
5
ELISA endpoint titer HA head (log10)
Neu
tral
izat
ion
IC50
(log
10)
r = 0.88p < 0.0001
g h i
102 103 104 105 1060
1
2
3
Serum dilution
HA
(PR
8) p
rote
in (O
D45
0)
102 103 104 105 1060
1
2
3
Serum dilution
Stem
(PR
8) p
rote
in (O
D45
0)
102 103 104 105 1060
1
2
3
Serum dilution
Fold
on-H
is p
rote
in (O
D45
0) 1 - HA (left)
2 - Stem (left)
3 - HA+Stem mix (left)
4 - HA (left) + Stem (right)
a cb

17
different groups (n=46) was tested for its ability of neutralizing PR8 virus. Results are
expressed as IC50, the serum dilution that gave half of the maximal inhibition. Three
independent experiments with 4 mice each (n=12 for groups 1, 2, 4 and n=10 for group 3)
and 4 technical replicates for each serum. Bar is mean ± SEM, statistical analysis was
performed using one-way ANOVA with Tukey multiple comparison test. (H) Sera from
animals immunized with stem only (group 2) (n=12) was tested for its ability to bind PR8-
infected cells. Dotted line indicates cut-off given by the average of 3 pre-immune
sera+3SD. Stem mAb FI6 was also tested as control. (I) correlation between neutralization
IC50 as in A and ELISA endpoint titer for HA head as in Fig. 2A

18
Figure S4. Effector function activity of sera. Correlation of ADCD response as in Fig.
2C with total stem Abs titer (as in Fig. 2A)(A) or stem-specific IgG2 (As in Fig. 2B)(B).
Sera were tested for the ability to induce ADCD on H5-HA- (C) or PR8-HA (D) conjugated
beads. Data is presented as area under the curve (AUC) of geometrical mean fluorescent
intensity (GMFI) of 1:5 and 1:10 dilutions, and is the mean of two technical replicates
(n=12 for groups 1, 2, 4 and n=10 for group 3). (E) Ability of the sera to induce ADCP on
PR8-HA-conjugated beads by primary monocytes. Each data point is the mean of two
technical replicates (n=12 for groups 1, 2, 4 and n=10 for group 3). Three independent
1HA (left)
2 Stem (left)
3HA+Stemmix (left)
4 HA (left)
+Stem (right)
0
2000
4000
6000
8000
AU
C (G
MFI
)
PR8-HA ADCD****
*******
0.0 0.2 0.4 0.60
2000
4000
6000
8000 correlation IgG2
Stem titer (IgG2-ELISA)
AD
CD
(AU
C)
p = 0.02r = 0.4
3 4 5 60
2000
4000
6000
8000 correlation vs titer
Stem titer (ELISA)
AD
CD
(AU
C)
p = 0.42r = 0.14
a b
c d
e
1HA (left)
2 Stem (left)
3HA+Stemmix (left)
4 HA (left)
+Stem (right)
0
2000
4000
6000
AU
C (G
MFI
)
H5-HA ADCD**
*
1HA (left)
2 Stem (left)
3HA+Stemmix (left)
4 HA (left)
+Stem (right)
0
500
1000
1500
Phag
ocyt
ic s
core
PR8-HA ADCP

19
experiments with 4 mice each. Bar is mean ± SEM, statistical analysis was performed using
one-way ANOVA with Tukey multiple comparison test.

20
Figure S5. Stem Abs are maintained in a condition of preexisting immunity.
Animals were primed with either stem or full length HA and boosted with full length HA
or stem, respectively (A) Frequency of head vs stem swig GC B cells for the 2 different
groups 21 days after boost. (B) Antibody endpoint titers to full length PR8 HA and stem
construct. Two independent experiments with 4 mice each (n=8). Bar is mean ± SEM.
Head Stem0
10
20
30H
ead/
Stem
sw
Ig G
C B
cel
ls
(Fre
quen
cy, %
)
Stem (prime)HA (boost)
HA (prime)Stem (boost)
H1 Stem1
2
3
4
5
6
ELIS
A e
ndpo
int t
iter (
log 1
0)
Stem (prime)HA (boost)
HA (prime)Stem (boost)
a b

21
Figure S6 GC B cells for both head and stem affinity mature. Pooled iliac LNs from 3
mice at at 21 days after challenge (A) with full length PR8 HA (orange) or stem (blue)
were stained with graded amount of HA-PR8 (orange) or HA-H5 (blue) and plotted against
frequency of GC B cells stained (n=3). (B) nM concentration of HA giving half maximal
binding (AC50) was derived from individual experimental curves (n=3). Three independent
experiments with 3 pooled LN each. Bar graph represent mean and bars SEM, statistical
analysis was performed using two sided unpaired t-test.
HA i.m. Stem i.m.0
1
2
3
4
nM rH
A 5
0%m
axim
al b
indi
ng
21 + 21 d.p.i
a
0.001 0.01 0.1 1 10 1000
5
10
15
20
25
HA concentration
% B
cel
ls rH
A+
0.001 0.01 0.1 1 10 1000
5
10
15
20
25
HA concentration
% B
cel
ls rH
A+
total Ig swIg
HA i.m. Stem i.m.0
1
2
3
4
nM rH
A 5
0%m
axim
al b
indi
ng
b
22
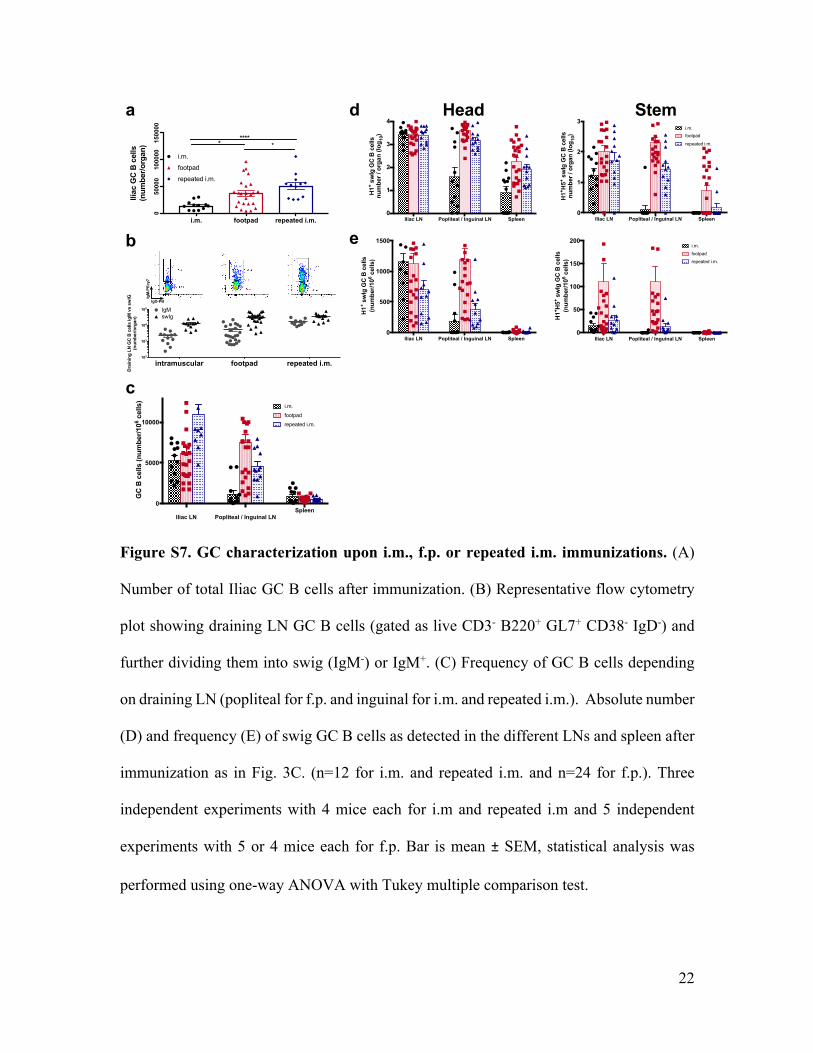
Figure S7. GC characterization upon i.m., f.p. or repeated i.m. immunizations. (A)
Number of total Iliac GC B cells after immunization. (B) Representative flow cytometry
plot showing draining LN GC B cells (gated as live CD3- B220+ GL7+ CD38- IgD-) and
further dividing them into swig (IgM-) or IgM+. (C) Frequency of GC B cells depending
on draining LN (popliteal for f.p. and inguinal for i.m. and repeated i.m.). Absolute number
(D) and frequency (E) of swig GC B cells as detected in the different LNs and spleen after
immunization as in Fig. 3C. (n=12 for i.m. and repeated i.m. and n=24 for f.p.). Three
independent experiments with 4 mice each for i.m and repeated i.m and 5 independent
experiments with 5 or 4 mice each for f.p. Bar is mean ± SEM, statistical analysis was
performed using one-way ANOVA with Tukey multiple comparison test.
Iliac LN Popliteal / Inguinal LN Spleen0
1
2
3
4
H1+
swIg
GC
B c
ells
nu
mbe
r / o
rgan
(log
10)
Iliac LN Popliteal / Inguinal LN Spleen0
1
2
3
H1+ H
5+ sw
Ig G
C B
cel
ls
num
ber /
org
an (l
og10
)
i.m.
footpad
repeated i.m.
intramuscular footpad repeated i.m.102
103
104
105
Dra
inin
g LN
GC
B c
ells
IgM
vs
swIG
(num
ber/
orga
n)
IgMswIg
IgM
-PE
cy7
IgD-PB
i.m. footpad repeated i.m.
050
000
1000
0015
0000
Iliac
GC
B c
ells
(num
ber/
orga
n)
i.m.
footpad
repeated i.m.
***** *
a
b
Iliac LN Popliteal / Inguinal LNSpleen
0
5000
10000
GC
B c
ells
(num
ber/
106
cells
)
i.m.
repeated i.m.
footpad
c
Head Stem
Iliac LN Popliteal / Inguinal LN Spleen0
500
1000
1500
H1+
swIg
GC
B c
ells
(n
umbe
r/106
cells
)
Iliac LN Popliteal / Inguinal LN Spleen0
50
100
150
200
H1+ H
5+ sw
Ig G
C B
cel
ls
(num
ber/1
06 ce
lls)
i.m.
footpad
repeated i.m.
d
e

23
Figure S8. Characterization of serum Abs. (A) Correlation showing endpoint titers of
sera on stem-only antigen (as in Fig. 3F) vs H5 antigen (n=12 for i.m. and repeated i.m.
and n=24 for f.p.). (B) Serially diluted sera from i.m., f.p. or repeated i.m. were tested by
ELISA on a panel of HA from drifted PR8 viruses to determine their immunodominance
profile. Shown is a pie chart graph showing the AUC for each of the canonical antigenic
sites (Sa= blue, Sb= gold, Ca1= purple, Ca2= orange, Cb= red, non-canonical head site=
black). (C) Statistical analysis related to B comparing f.p. with the other two immunization
regimes. The analysis was performed using one-way ANOVA with Tukey multiple
comparison test for each of the antigenic sites. No difference was detected between i.m.
and repeated i.m. for any of the sites. (n=12 for i.m. and repeated i.m. and n=23 for f.p.).
11%
29%
12%15%
24%
9% 12%
24%
14%13%
27%
10%16%
24%
20%8%
17%
17%
i.m. repeated i.m.footpadb
1 2 3 41
2
3
4
ELISA IgG endpoint titer stem (log10)
ELIS
A Ig
G e
ndpo
int t
iter H
A-H
5 (lo
g 10)
r = 0.57p < 0.0001
i.m.f.p.repeated i.m.
a
f.p. vs Sa Sb Ca1 Ca2 Cb other head (S12)i.m. <0.0001 0.0197 0.0004 <0.0001 0.0002 0.0002repeated i.m <0.0001 0.8482 0.0024 <0.0001 0.0223 0.0026
Antigenic sitec
0 2 4 6 8 10 12 14
70
80
90
100
110
days post infection
% o
rigi
nal w
eigh
t
PBS HA IM HA + stem IM stem IM HA footpad
d

24
(D) Mice were immunized once with either HA i.m., HA+stem i.m. (mixture), stem only
i.m. or HA footpad (n = 8-10 mice per group). After 21 days mice were challenged using
a pathologic dose of heterologous chimeric virus with H5head and H1 stem. Mice were
weighted daily for 14 days with weight on day 0 set at 100%. Presented results are the sum
of two independent experiments.