Embed Size (px)
Citation preview
In the format provided by the authors and unedited.
1
Supplementary Information
Polyoxometalate electrocatalysts based on earth-abundant metals for efficient
water oxidation in acidic media
Marta Blasco-Ahicart1†, Joaquín Soriano-López1,2†, Jorge J. Carbó2, Josep M. Poblet2, J. R. Galan-
Mascaros1,3*
Index Page Materials 2
Synthesis 2 Physical methods 2
Active sites calculation 3 Turnover number (TON) estimation 4
Figure 1 6 Figure 2 6 Figure 3 7
Figure 4 7 Figure 5 8
Figure 6 9 Figure 7 10
Figure 8 11 Figure 9 11
Figure 10 12 Figure 11 12
Figure 12 12 Figure 13 13
Table 1 13 Table 2 13
Table 3 14 Table 4 14
© 2017 Macmillan Publishers Limited, part of Springer Nature. All rights reserved.
SUPPLEMENTARY INFORMATIONDOI: 10.1038/NCHEM.2874
NATURE CHEMISTRY | www.nature.com/naturechemistry 1

2
Materials. All reagents and solvents were used of commercial grade, without further purification.
Carbon paste (ALS, CPO Carbon Paste Oil).
Synthesis.
Cs15K[Co9(H2O)6(OH)3(HPO4)2(PW9O34)3]·28H2O (Cs[Co-POM]) was prepared by metathesis: An
excess of CsCl was added to a solution of 1 (500 mg , 0.057 mmol) in 15 mL distilled water.
Cs[Co-POM] precipitated immediately out of solution. After 15 minutes, the product was filtered
(Nylon Filter-Lab, pore size 0.45 µm), washed with 10 mL water, and 10 mL acetone, and left to
dry in air overnight. Digestion of this material in acid, under heating, yields insoluble products,
liberating the metal content only partially. This problem makes difficult the proper elemental
analysis. ICP-OES only gave accurate Cs, Co and P ratios. The presence of the
[Co9(H2O)6(OH)3(HPO4)2(PW9O34)3]16– anion is confirmed by its signature IR spectra
(Supplementary Fig. 7), identical to 1. In POM chemistry, the IR bands represent a reliable
fingerprint for the molecular structure. Cation content was estimated by ICP-OES and EDX. Water
content was determined by TGA analysis (Supplementary Fig. 10). Cs[Co-POM].28 H2O Mw =
10107.15. Elemental analyses, Calc.: Cs, 19.73; K, 0.40. Exp.: Cs, 19.51; K, 0.50.
Ba8[Co9(H2O)6(OH)3(HPO4)2(PW9O34)3]·55H2O (Ba[Co-POM]) was prepared by the same method
as Cs[Co-POM], substituting CsCl by BaCl2. Elemental analyses also presented the same
problems. The presence of the [Co9(H2O)6(OH)3(HPO4)2(PW9O34)3]16– anion was also confirmed by
its signature IR spectra (Supplementary Fig. 7), identical to 1. Countercation content was estimated
by ICP-OES and EDX. Water content was determined by TGA analysis (Supplementary Fig. 11).
Ba[Co-POM].55H2O Mw = 9659.40. Elemental Analyses, Calc.: Ba, 11.37; K, 0.00. Exp.: Ba,
11.51; K, <0.1.
Physical methods. Thermogravimetric analysis (TGA) was performed under N2 flow with powder
samples using a TGA/SDTA851 Mettler Toledo with a MT1 microbalance. Powder X-ray
diffraction data were collected with a Bruker D8 Advance Series equipped with a VANTEC-1 PSD
3
detector. IR spectra were collected with a FTIR Bruker spectrometer model Alpha equipped with an
ATR accessory. Raman measurements were acquired using a Renishaw inVia Reflex Raman
confocal microscope (Gloucester- Shire, UK), equipped with a diode laser emitting at 785 nm at a
nominal power of 300 mW, and a Peltier-cooled CCD detector (−70 ºC) coupled to a Leica DM-
2500 microscope. Calibration was carried out daily by recording the Raman spectrum of an internal
Si standard. Rayleigh scattered light was appropriately rejected by using edge-type filters. Laser
power was used at nominal 1% to avoid sample damage. Spectra were recorded with the
accumulation of at least 3 scans with a 30 s scan time each one. Energy-dispersive X-ray
spectroscopy (EDX) was collected with a JEOL- JMS6400 environmental scanning electron
microscope equipped with an Oxford Instruments X-ray elemental analyzer. X-ray photoelectron
spectroscopy (XPS, K-ALPHA, Thermo Scientific, SSTTI at University of Alicante) was used to
analyze sample surfaces. All spectra were collected using Al-Kα radiation (1486.6 eV),
monochromatized by a twin crystal monochromator, yielding a focused X-ray spot with a diameter
of 400 µm, at 3 mA × 12 kV. The alpha hemispherical analyzer was operated in the constant energy
mode with survey scan pass energies of 200 eV to measure the whole energy band and 50 eV in a
narrow scan to selectively measure the particular elements. Charge compensation was achieved
with the system flood gun that provides low energy electrons and low energy argon ions from a
single source. Elemental analysis was carried out with an Agilent 725-ES inductively coupled
plasma optical emission spectrometer (ICP-OES) at University of Valladolid.
Active sites calculation. The electrode pocket where the carbon paste is inserted has a nominal
surface area of 0.07 cm2, and a depth of 4 mm. This makes very difficult to estimate the actual
active layer. In order to quantify the number of possible active sites for comparison, we followed
this procedure:
The electrode is weighted before and after the incorporation of a homogeneous mixture of the
desired catalyst/CP ratio. Taking into account the catalyst/CP ratio, the exact amount of catalyst can
be determined, as well as, the total content (mols) of metal present. Although not all the catalyst/CP

4
is active, estimating the total catalyst content gives us the maximum active sites limit (and
minimum activity per active site). We think this is a fair approximation. For each catalyst, we
identified all active metal (Co, or Ir) as a viable active site. We need to note, in addition, that in the
case of Co9, only six Co positions are viable active sites (those directly bound to water molecules).
Still, we are accounting for all nine Co positions in these calculations.
Turnover number (TON) estimation. As before, it is not easy to determine the active layer
thickness in these electrodes. So, we introduced an approximation to calculate the corresponding
TON in our systems. The amount of O2 generated can be calculated using the following equation,
considering 100% Faradaic efficiency (true at least for our Co-POM catalysts):
𝑛"# =𝑄
𝑛&'𝐹
where Q (C) is the charge passed through the system, 𝑛&'= 4 is the number of electrons needed to
generate one molecule of O2 and F is the Faraday constant (96485 C/mol).
To determine the mols of active catalyst, we limited to 1/8 of the total electrode pocket volume as
maximum limit really in contact with the solution. This implies a penetration layer of 0.5 mm
thickness, which seems reasonable. Even if this TON calculation is arbitrary regarding total
numbers, the results are still good for relative comparisons between catalysts.
The results of our TON estimations are in Tables 3 and 4 of this Supplementary data document.

5
Figure 1 | Details of electrochemistry data (LSV) in H2SO4 (1 M) solution with 40%catalyst/CP blends. a, Estimation of the water oxidation onset potential. b, Pre-catalytic region for Ba[Co-POM]/CP and Co3O4/CP electrodes, showing the precatalytic event that appears exclusively in the case of cobalt oxide.
Figure 2 | a, Adsorption and desorption isotherms of Ba[Co-POM], Cs[Co-POM], Co3O4 and IrO2 previously degassed at 120ºC during 12 h. b, Plot of Dj (ja-jc) at 0.85 V vs Ag/AgCl (3.5 M KCl)against the scan rate,where the slope is twice the Cdl.We selected this range, 0.8-0.9V vsAg/AgCl3.5MKCl,becausethecurrentresponsedoesnotarisefromanyredoxorcatalyticprocess,soitmustbeduetothechargingofthedoublelayer. Thevaluesobtainedfor30%catalyst/CPare385.2mF/cm2forBa[Co-POM],6.2mF/cm2forCs[Co-POM],8.7mF/cm2forCo3O4and0.6mF/cm2forIrO2.
ab
a
b

6
Figure 3 | Oxygen evolution (blue trace) and maximum Faradaic oxygen production (red line) during water electrolysis in H2SO4 (1 M) with a 30% Cs[Co-POM]/CP (left) and Ba[Co-POM]/CP (right) electrodes at a constant current of 1 mA cm–2. The arrows indicate initial and final electrolysis times. The delay between electrochemical data and oxygen detection is due to the temporary trapping of the evolving gas in the carbon paste.
Figure 4 | Oxygen evolution (blue trace) and maximum Faradaic oxygen production (red line) during water electrolysis in H2SO4 (1 M) with a Co3O4 electrode at a constant current of 1 mA cm–2. The arrows indicate initial and final electrolysis times. The delay between electrochemical data and oxygen detection is due to the temporary trapping of the evolving gas in the carbon paste.
0.0
0.1
0.2
0.3
0 20 40 60 80
µmol
s O
2
time (min)
0.0
0.1
0.2
0.3
0.4
0.5
0 20 40 60 80
time (min)
µm
ols
O2

7
Figure 5 | Raman spectra for Cs[Co-POM] and Ba[Co-POM] before and after 2 h electrocatalytic water oxidation at a constant current density of 1 mA cm–2 in H2SO4 (1 M). Comparison with the corresponding spectra of Co3O4. None of the cobalt oxide strong Raman peaks between 400 and 700 cm–1 could be identified in the fresh or used materials.
8
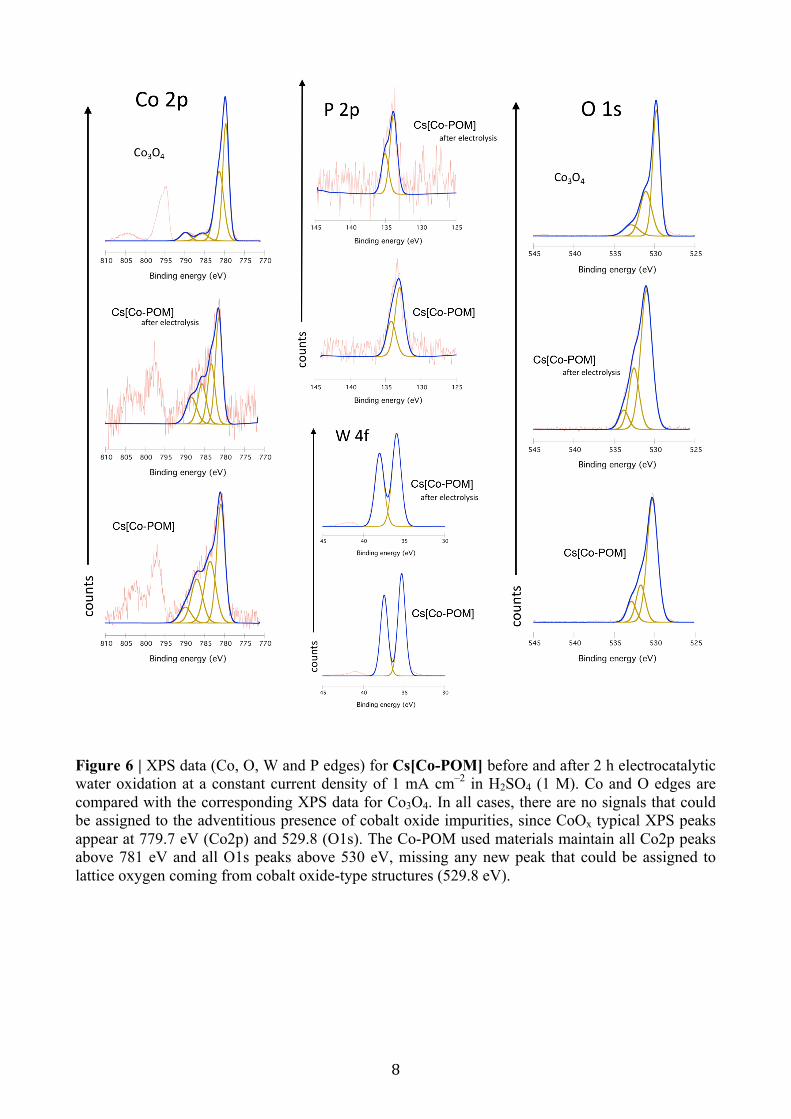
Figure 6 | XPS data (Co, O, W and P edges) for Cs[Co-POM] before and after 2 h electrocatalytic water oxidation at a constant current density of 1 mA cm–2 in H2SO4 (1 M). Co and O edges are compared with the corresponding XPS data for Co3O4. In all cases, there are no signals that could be assigned to the adventitious presence of cobalt oxide impurities, since CoOx typical XPS peaks appear at 779.7 eV (Co2p) and 529.8 (O1s). The Co-POM used materials maintain all Co2p peaks above 781 eV and all O1s peaks above 530 eV, missing any new peak that could be assigned to lattice oxygen coming from cobalt oxide-type structures (529.8 eV).

9
Figure 7 | XPS data for Ba[Co-POM] before and after 2 h electrocatalytic water oxidation at a constant current density of 1 mA cm–2 in H2SO4 (1 M). O edges are compared with the corresponding XPS data for Co3O4. In all cases, there are no signals that could be assigned to the adventitious presence of cobalt oxide impurities. Due to the strong overlap between Ba3d and Co2p XPS absorptions, we checked the Co2s peaks instead. The results are analogous to the Cs[Co-POM] case. Again, all O1s peaks appear above 530 eV, missing any new peak that could be assigned to lattice oxygen coming from cobalt oxide-type structures (529.8 eV).
10
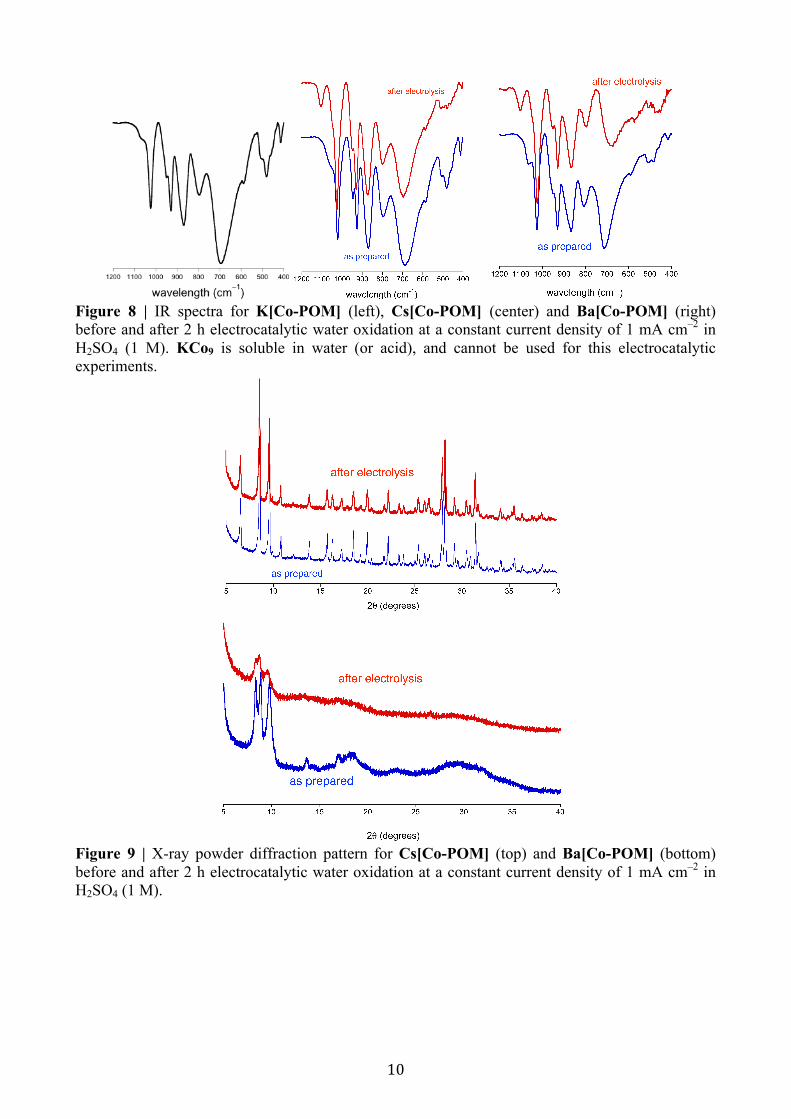
Figure 8 | IR spectra for K[Co-POM] (left), Cs[Co-POM] (center) and Ba[Co-POM] (right) before and after 2 h electrocatalytic water oxidation at a constant current density of 1 mA cm–2 in H2SO4 (1 M). KCo9 is soluble in water (or acid), and cannot be used for this electrocatalytic experiments.
Figure 9 | X-ray powder diffraction pattern for Cs[Co-POM] (top) and Ba[Co-POM] (bottom) before and after 2 h electrocatalytic water oxidation at a constant current density of 1 mA cm–2 in H2SO4 (1 M).
11
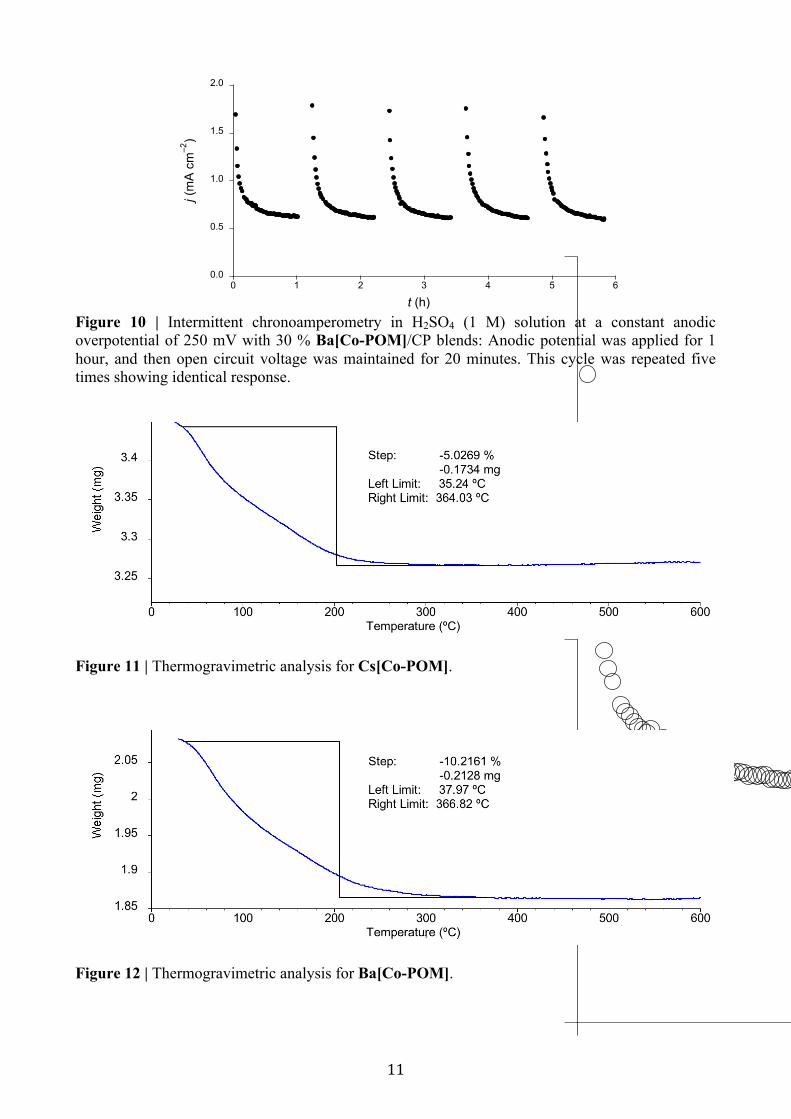
Figure 10 | Intermittent chronoamperometry in H2SO4 (1 M) solution at a constant anodic overpotential of 250 mV with 30 % Ba[Co-POM]/CP blends: Anodic potential was applied for 1 hour, and then open circuit voltage was maintained for 20 minutes. This cycle was repeated five times showing identical response.
Figure 11 | Thermogravimetric analysis for Cs[Co-POM].
Figure 12 | Thermogravimetric analysis for Ba[Co-POM].
0.0
0.5
1.0
1.5
2.0
0 1 2 3 4 5 6
j (m
A c
m–2
)
t (h)

12
Figure 13 | Chronoamperometrydata inH2SO4(1M)solutionataconstantanodiccurrentof10mAcm–2with30%catalyst/CPblends. Table 1. Elemental analyses (ICP-OES) of the liquid reaction media after 2 h electrocatalytic water oxidation at a constant current density of 1 mA cm–2 in H2SO4 (1 M). mother liquor Cs Ba K P Co W Cs[Co-POM] 37 ppm - 7 ppm ≤ 1 ppm ≤ 1 ppm ≤ 1 ppm Ba[Co-POM] - ≤ 1 ppm ≤ 1 ppm ≤ 1 ppm ≤ 1 ppm ≤ 1 ppm Co3O4 - - - - ≤ 1 ppm - Table 2 Elemental analyses (ICP-OES) for the fresh, and recovered catalyst, including also the supernatant fractions after 2 h electrocatalytic water oxidation at a constant current density of 1 mA cm–2 in H2SO4 (1 M). Data was normalized to the W content to facilitate comparison.
Sample Cs Ba K P Co W Cs[Co-POM] fresh (theoretical) 15 - 1 5 9 27
Cs[Co-POM]_fresh 14.8 - 1.3 4.5 9.3 27 Cs[Co-POM]_recovered 13.9 - 1.5 5.4 9.3 27
Cs[Co-POM]_carbon paste_supernatant 5.8 - 1.7 16.2* 7.0 27 Ba[Co-POM] fresh (theoretical) - 8 - 5 9 27
Ba[Co-POM]_fresh - 8.1 - 4.9 8.7 27 Ba[Co-POM]_recovered - 6.8 - 5.3 8.9 27
Ba[Co-POM]_carbon paste_supernatant - 9.3 - 10.3* 7.9 27
*This increment in P content can only be assigned to a problem with the analytical method,
probably due to the carbon/binder predominant content in these samples.

13
Table 3. TON estimation after 24 h chronoamperometry at h=250 mV
BaCo9 CsCo9 Co3O4 IrO2 CoPi NiFe
Mols catalyst (30% CP/cat) 1.13·10-6 1.03·10-6 4.81·10-5 6.17·10-5 1.04·10-4 1.27·10-4
(1/8) Mols catalyst 1.41·10-7 1.29·10-7 6.01·10-6 7.71·10-6 1.29·10-5 1.58·10-5
Q24h (C) 2.54 0.37 0.36 0.27 1.56 0.78
Mols O2 6.58·10-6 9.71·10-7 9.37·10-7 6.93·10-7 4.04·10-6 2.03·10-6
TON 46.59 7.54 0.16 0.09 0.31 0.13
Table 4. TON calculation after 2 h chronopotentiometry at 1mA·cm-2
BaCo9 CsCo9
Mols catalyst (30% CP/cat) 1.13·10-6 1.03·10-6
(1/8) Mols catalyst 1.41·10-7 1.29·10-7
Q2h (C) 0.504 0.504
Mols O2 1.31·10-6 1.31·10-6
TON 9.26 10.16