Embed Size (px)
Citation preview

Supplementary Information:Life cycle assessment of biological pig manure treatment versus direct land application – a trade-off story
L. Corbala-Robles*,†,a, W. N. D. Sastafiana*,a,b, V. Van lindenc, E. I. P. Volckea, T. Schaubroeckb,d
*equally contributing† corresponding author: [email protected]
a Department of Biosystems Engineering, Ghent University, Coupure Links 653, 9000 Ghent, Belgiumb Research group Environmental Organic Chemistry and Technology (EnVOC), Faculty of Bioscience Engineering, Ghent University, Coupure Links 653, B-9000 Ghent, Belgiumc Flanders research institute for agriculture, fisheries and food (ILVO), Burgemeester Van Gansberghelaan 115, 9820 Merelbeke, Belgiumd RDI Unit Life Cycle Sustainability and Risk Assessment (LiSRA), Department of Environmental Research & Innovation (ERIN), Luxembourg Institute of Science and Technology (LIST), 41 Rue du Brill, L-4422 Belvaux, Luxembourg
This document is divided in 5 Appendices:
Appendix 1: life cycle inventory. Pages 2-8
Appendix 2:
o Emissions calculations. Pages 9-15
o Chemical consumption calculations. Page 16
o Electricity consumption calculations. Pages 16-20
Appendix 3: infrastructure details. Pages 21-22
Appendix 4: Fertilizer application and manure storage Pages 23-25
Appendix 5: midpoint and endpoint environmental impacts. Pages 26-29
Appendix 6 : sensitivity background processes 30
Appendix 7 : mass balance (manure treatment process) 31
Reference list. Pages: 32-34
1

Appendix A. The life cycle inventory data of the treatment and no-treatment scenario.FU: 1 m3 of raw manure to be treated
# Item units Ecoinvent Process QuantityTreatment Scenario No-treatment scenario
A. INFRASTRUCTURE1. Construction Inputs for Major VesselsMaterial/Assemblies
Readymix Concrete m3 Concrete, normal {CH}| production 9.37E-04 0.00E+00Steel kg Steel, low-alloyed, hot rolled {RER}| production 4.77E-05 0.00E+00Aluminium, primary, inc. NPI emission estimates kg Aluminum, primary, ingot {UN-EUROPE}| production 3.40E-07 0.00E+00Limestone (calcite) kg Limestone, crushed, for mill {CH}| production 8.40E-06 0.00E+00Chromium Steel 18%Cr, 8%Ni kg chromium steel 18/8, hot rolled {RER}| production 2.38E-06 0.00E+00PA6 30% glass fibre kg Glass fibre {RER}| production 7.94E-07 0.00E+00Copper kg Copper {RER}| production, primary 3.40E-07 0.00E+00EPDM (synthetic) Rubber kg Synthetic rubber {RER}| production 3.40E-07 0.00E+00Mineral Wool (Rock Wool) kg Rock wool {CH}| production 3.40E-07 0.00E+00Chemicals - Organic kg Chemical, organic {GLO}I production 1.59E-06 0.00E+00Bitumen m3 Bitumen seal {RER}| production 1.13E-07 0.00E+00Chemicals - Inorganic kg Chemical, inorganic {GLO}I production 2.27E-07 0.00E+00High-Density Polyethylene (HDPE) kg Polyethylene, high density, granulate {RER}| production 9.08E-07 0.00E+00
ProcessesExcavation, hydraulic digger m3 Excavation, hydraulic digger {RER}| processing 1.36E-03 0.00E+00Transport, Articulated Truck 28/30 (Freight) tkm Transport, freight, lorry, unspecified {RER} 1.92E-02 0.00E+00Transport, Rail (Bulk Transport) tkm Transport, Freight Train [Europe without Swiss]I market for 2.28E-02 0.00E+00Electricity k wh Electricity, medium voltage {BE}| market for 5.35E-05 0.00E+00Extrusion of PET tonne Extrusion, Plastic Pipe {RER]Production 9.08E-07 0.00E+00
2. Construction of the road m2a Road, company, internal {CH} I construction 2.80E-03 0.00E+003. A hall for Solid Fraction Storage and Centrifuge m2 Building, hall, steel construction {CH} 9.30E-04 0.00E+004. Excavation underground manure pit m3 Excavation, hydraulic digger {RER}| processing 3.72E-03 0.00E+005. Building for office, chemical storage and electricity control m2 Building, multi-storey {RER}I construction 6.20E-04 0.00E+006. The pipeline network m.y Pipeline, liquid manure {CH}| construction 2.52E-04 0.00E+007. Carbon steel for infrastructure of methanol tank kg Steel, low-alloyed, hot rolled {RER}| production 1.94E-03 0.00E+008. Excavation of effluent pond m3 Excavation, hydraulic digger {RER}| processing 3.67E-03 0.00E+009. HDPE Liner to cover effluent pond kg Polyethylene, high density, granulate {RER}| production 5.03E-04 0.00E+00
2

# Item units Ecoinvent Process QuantityTreatment Scenario No-treatment scenario
10. Land Occupation for all facilities m2.yr ReCiPe Characterization Factor Land Occupation for Occupation, industrial area
8.91E-03 0.00E+00
B. OPERATION1. Raw Manure StorageAtmospheric Emissions from raw manure storage
CH4 (Methane) emissions kg Ammonia, air, high population density 0.00E+00 7.96E-01Direct N2O (Nitrous Oxide) emissions kg Nitrous oxide, air, high population density 0.00E+00 1.02E-02Indirect N2O (Nitrous Oxide) emissions kg Nitrous oxide, air, high population density 0.00E+00 1.28E-02NH3 (Ammonia) emissions kg Ammonia, air, high population density 0.00E+00 5.54E-01NOx (Nitric Oxide) emissions kg Nitrogen oxides, air, high population density 0.00E+00 3.26E-04
2. Manure Treatment PlantRaw manure
Transport of raw manure to manure treatment plant by lorry tkm Transport, freight, lorry, unspecified {RER} 1.98E+01 0.00E+00Additional materials
Production of Methanol kg Methanol {GLO}| production | Alloc Def, U 1.90E+00 0.00E+00Transport of methanol to manure treatment plant by lorry tkm Transport, freight, lorry, unspecified {RER} 9.48E-02 0.00E+00
Transport of methanol to manure treatment plant by train tkm Transport, Freight Train [Europe without Swiss] I market for
1.14E+00 0.00E+00
Electricity consumptionsElectricity for pumping raw manure k wh Electricity, medium voltage {BE}| market for 6.43E-02 0.00E+00Electricity for pumping feed k wh Electricity, medium voltage {BE}| market for 1.75E-02 0.00E+00Electricity for recirculation k wh Electricity, medium voltage {BE}| market for 1.01E-02 0.00E+00Electricity for drawing k wh Electricity, medium voltage {BE}| market for 2.46E-03 0.00E+00Electricity for pumping sludge k wh Electricity, medium voltage {BE}| market for 4.42E-03 0.00E+00Electricity for centrifuge k wh Electricity, medium voltage {BE}| market for 1.97E+00 0.00E+00Electricity for pumping methanol k wh Electricity, medium voltage {BE}| market for 3.69E-05 0.00E+00Electricity for mixing denitrification and nitrification reactor k wh Electricity, medium voltage {BE}| market for 9.62E-01 0.00E+00Electricity for Aeration k wh Electricity, medium voltage {BE}| market for 1.39E+01 0.00E+00
Atmospheric Emissions from Plant OperationsN2O (Nitrous Oxide) emissions kg Nitrous oxide, air, high population density 7.20E-03 0.00E+00NH3 (Ammonia) emissions kg Ammonia, air, high population density 3.21E-03 0.00E+00
3. Composting of Solid FractionTransport solid fraction to composting plant by lorry tkm? Transport, freight, lorry, unspecified {RER} 5.13E+00 0.00E+00Electricity consumption kg Electricity, medium voltage {BE}| market for 1.75E+01 0.00E+00Transport compost to Norther France by lorry tkm? Transport, freight, lorry, unspecified {RER} 5.48E-02 0.00E+00
C. FIELD APPLICATION1. Field Application of Raw Manure
3

# Item units Ecoinvent Process QuantityTreatment Scenario No-treatment scenario
Transport to Agricultural FieldTransport of biological effluent by lorry tkm Transport, freight, lorry, unspecified {RER} 0.00E+00 1.98E+02
ApplicationSpreading ha Fertilising, by broadcaster {CH}| processing 0.00E+00 2.07E-02Tillage, cultivating ha Tillage, rotary cultivator {CH}| processing 0.00E+00 2.07E-02
Atmospheric Emissions from application of raw manureDirect N2O (Nitrous Oxide) emissions kg Nitrous oxide, air, high population density 0.00E+00 7.31E-02Indirect N2O (Nitrous Oxide) emissions kg Nitrous oxide, air, high population density 0.00E+00 1.46E-02NH3 (Ammonia) emissions kg Ammonia, air, high population density 0.00E+00 1.58E+00NOx (Nitric Oxide) emissions kg Nitrogen oxides, air, high population density 0.00E+00 1.54E-02
Leaching to groundwaterPhosphorus leaching kg Total phosphorus, soil, agricultural 0.00E+00 4.34E-03Nitrate leaching kg Nitrate, water, river 0.00E+00 6.00E-01
Heavy Metal Emissions to Soil from raw manureArsenic kg Arsenic, soil, agricultural 0.00E+00 1.67E-04Cadmium kg Cadmium, soil, agricultural 0.00E+00 1.67E-05Chromium kg Chromium III, soil, agricultural 0.00E+00 5.58E-04Copper kg Copper, soil, agricultural 0.00E+00 3.57E-02Lead kg Lead, soil, agricultural 0.00E+00 2.79E-04Zinc kg Zinc, soil, agricultural 0.00E+00 4.29E-02Nickel kg Nickel, soil, agricultural 0.00E+00 5.02E-04Mercury kg Mercury, soil, agricultural 0.00E+00 1.67E-05
2. Field Application of Biological effluentTransport to Agricultural Field
Transport of biological effluent by lorry tkm Transport, freight, lorry, unspecified {RER} 4.39E+00 0.00E+00Application
Spreading ha Fertilising, by broadcaster {CH}| processing 2.51E-03 0.00E+00Atmospheric Emissions from application of treated effluent
Direct N2O (Nitrous Oxide) emissions kg Nitrous oxide, air, high population density 6.56E-03 0.00E+00Indirect N2O (Nitrous Oxide) emissions kg Nitrous oxide, air, high population density 1.31E-03 0.00E+00NH3 (Ammonia) emissions kg Ammonia, air, high population density 1.42E-01 0.00E+00NOx (Nitric Oxide) emissions kg Nitrogen oxides, air, high population density 1.38E-03 0.00E+00
Leaching to groundwaterPhosphorus leaching kg Total phosphorus, soil, agricultural 3.20E-04 0.00E+00Nitrate leaching kg Nitrate, water, river 5.39E-02 0.00E+00
Heavy Metal Emissions to Soil from treated effluentArsenic kg Arsenic, soil, agricultural 1.19E-05 0.00E+00
4

# Item units Ecoinvent Process QuantityTreatment Scenario No-treatment scenario
Cadmium kg Cadmium, soil, agricultural 1.19E-05 0.00E+00Chromium kg Chromium III, soil, agricultural 2.37E-04 0.00E+00Copper kg Copper, soil, agricultural 1.92E-02 0.00E+00Lead kg Lead, soil, agricultural 1.19E-04 0.00E+00Zinc kg Zinc, soil, agricultural 2.13E-02 0.00E+00Nickel kg Nickel, soil, agricultural 3.56E-04 0.00E+00Mercury kg Mercury, soil, agricultural 4.74E-06 0.00E+00
3. Field Application of Composted Solid FractionTransport to Agricultural Field
Transport compost by lorry to Northern France tkm Transport, freight, lorry, unspecified {RER} 1.10E+01 0.00E+00Application
Spreading ha Fertilising, by broadcaster {CH}| processing 6.12E-04 0.00E+00Tillage, cultivating ha Tillage, rotary cultivator {CH}| processing 6.12E-04 0.00E+00
Atmospheric Emissions from application of compostDirect N2O (Nitrous Oxide) emissions kg Nitrous oxide, air, high population density 4.17E-03 0.00E+00Indirect N2O (Nitrous Oxide) emissions kg Nitrous oxide, air, high population density 8.34E-04 0.00E+00NH3 (Ammonia) emissions kg Ammonia, air, high population density 9.02E-02 0.00E+00NOx (Nitric Oxide) emissions kg Nitrogen oxides, air, high population density 8.75E-04 0.00E+00
Leaching to groundwaterPhosporus leaching kg Total phosphorus, soil, agricultural 2.10E-03 0.00E+00Nitrate leaching kg Nitrate, water, river 3.55E-02 0.00E+00
Heavy Metal Emissions to Soil from compostArsenic kg Arsenic, soil, agricultural 8.22E-05 0.00E+00Cadmium kg Cadmium, soil, agricultural 4.11E-06 0.00E+00Chromium kg Chromium III, soil, agricultural 2.74E-04 0.00E+00Copper kg Copper, soil, agricultural 1.01E-02 0.00E+00Lead kg Lead, soil, agricultural 1.37E-04 0.00E+00Zinc kg Zinc, soil, agricultural 1.45E-02 0.00E+00Nickel kg Nickel, soil, agricultural 3.01E-04 0.00E+00Mercury kg Mercury, soil, agricultural 5.48E-06 0.00E+00
4. Avoided C, P&N, P fertilizer mix due to Biological Effluent ApplicationAvoided Production
5

# Item units Ecoinvent Process QuantityTreatment Scenario No-treatment scenario
Avoided production of N Fertilizer mix as N kg
8% Nitrogen fertilizer, as N {RER}| urea production; 89% Nitrogen fertilizer, as N {RER}| calcium ammonium nitrate production; 3% Nitrogen fertilizer, as N {RER}| ammonium sulphate production
5.34E-01 0.00E+00
Avoided production of P Fertilizer mix as P2O5 kg Phosphate fertilizer, as P2O5 {RER}| triple superphosphate production
1.74E-01 0.00E+00
Avoided Transport to Agricultural FieldTransport mineral fertilizer mix by lorry tkm Transport, freight, lorry, unspecified {RER} 2.53E-01 0.00E+00Transport mineral fertilizer mix by train tkm Transport, Freight Train [Europe without Swiss]Imarket for 1.52E+00 0.00E+00Spreading ha Fertilising, by broadcaster {CH}| processing 4.08E-03 0.00E+00
Avoided Atmospheric Emissions from P&N fertilizer mix applicationDirect N2O (Nitrous Oxide) emissions kg Nitrous oxide, air, high population density 8.39E-03 0.00E+00Indirect N2O (Nitrous Oxide) emissions kg Nitrous oxide, air, high population density 8.39E-04 0.00E+00NH3 (Ammonia) emissions kg Ammonia, air, high population density 1.30E-02 0.00E+00NOx (Nitric Oxide) emissions kg Nitrogen oxides, air, high population density 1.76E-03 0.00E+00
Avoided Leaching to groundwaterPhosphorus leaching kg Total phosphorus, soil, agricultural 8.36E-05 0.00E+00Nitrate leaching kg Nitrate, water, river 6.89E-02 0.00E+00
Avoided Heavy Metal Emissions to SoilArsenic kg Arsenic, soil, agricultural 3.03E-06 0.00E+00Cadmium kg Cadmium, soil, agricultural 1.09E-05Chromium kg Chromium III, soil, agricultural 8.93E-05 0.00E+00Copper kg Copper, soil, agricultural 8.64E-06Lead kg Lead, soil, agricultural 4.39E-05 0.00E+00Zinc kg Zinc, soil, agricultural 2.09E-04 0.00E+00Nickel kg Nickel, soil, agricultural 8.09E-06 0.00E+00Mercury kg Mercury, soil, agricultural 2.77E-08 0.00E+00
5. Avoided C, P&N, P fertilizer mix due to Compost ApplicationAvoided Production
Avoided production of P&N Fertilizer mix as P2O5 kg86% Phosphate fertilizer, as P2O5 {RER}| diammonium phosphate production; 14% Phosphate fertilizer, as P2O5 {RER}| monoammonium phosphate production
2.13E-01 0.00E+00
Avoided production of P&N Fertilizer mix as N kg92% Nitrogen fertilizer, as N {RER}| diammonium phosphate production; 8% Nitrogen fertilizer, as N {RER}| monoammonium phosphate production
8.26E-02 0.00E+00
Avoided production of P Fertilizer mix as P2O5 kg Phosphate fertilizer, as P2O5 {RER}| triple superphosphate production
8.79E-01 0.00E+00
6

# Item units Ecoinvent Process QuantityTreatment Scenario No-treatment scenario
Avoided Transport to Agricultural FieldTransport mineral fertilizer mix by lorry tkm Transport, freight, lorry, unspecified {RER} 2.38E-01 0.00E+00Transport mineral fertilizer mix by train tkm Transport, Freight Train [Europe without Swiss]Imarket for 1.43E+00 0.00E+00
Avoided ApplicationSpreading ha Fertilising, by broadcaster {CH}| processing 1.26E-02 0.00E+00
Avoided Atmospheric Emissions from P&N fertilizer mix applicationDirect N2O (Nitrous Oxide) emissions kg Nitrous oxide, air, high population density 1.30E-03 0.00E+00Indirect N2O (Nitrous Oxide) emissions kg Nitrous oxide, air, high population density 1.30E-04 0.00E+00NH3 (Ammonia) emissions kg Ammonia, air, high population density 2.00E-03 0.00E+00NOx (Nitric Oxide) emissions kg Nitrogen oxides, air, high population density 2.72E-04 0.00E+00
Avoided Leaching to groundwaterPhosphorus leaching kg Total phosphorus, soil, agricultural 5.24E-04 0.00E+00Nitrate leaching kg Nitrate, water, river 1.06E-02 0.00E+00
Avoided Heavy Metal Emissions to SoilArsenic kg Arsenic, soil, agricultural 1.59E-05 0.00E+00Cadmium kg Cadmium, soil, agricultural 7.31E-05 0.00E+00Chromium kg Chromium III, soil, agricultural 5.67E-04 0.00E+00Copper kg Copper, soil, agricultural 4.26E-05 0.00E+00Lead kg Lead, soil, agricultural 2.91E-05 0.00E+00Zinc kg Zinc, soil, agricultural 8.36E-04 0.00E+00Nickel kg Nickel, soil, agricultural 5.65E-05 0.00E+00Mercury kg Mercury, soil, agricultural 4.24E-08 0.00E+00
6. Avoided C, P&N, P fertilizer mix due to Raw Manure ApplicationAvoided Production
Avoided production of N Fertilizer mix as N kg8% Nitrogen fertilizer, as N {RER}| urea production; 89% Nitrogen fertilizer, as N {RER}| calcium ammonium nitrate production; 3% Nitrogen fertilizer, as N {RER}| ammonium sulphate production
0.00E+00 2.79E+00
Avoided production of P Fertilizer mix as P2O5 kg Phosphate fertilizer, as P2O5 {RER}| triple superphosphate production 0.00E+00 2.36E+00
Avoided Transport to Agricultural FieldTransport mineral fertilizer mix by lorry tkm Transport, freight, lorry, unspecified {RER} 0.00E+00 5.13E-01Transport mineral fertilizer mix by train tkm Transport, Freight Train [Europe without Swiss]Imarket for 0.00E+00 3.08E+00
Avoided ApplicationSpreading ha Fertilising, by broadcaster {CH}| processing 0.00E+00 3.37E-02
Avoided Atmospheric Emissions from P&N fertilizer mix application
7

# Item units Ecoinvent Process QuantityTreatment Scenario No-treatment scenario
Direct N2O (Nitrous Oxide) emissions kg Nitrous oxide, air, high population density 0.00E+00 4.39E-02Indirect N2O (Nitrous Oxide) emissions kg Nitrous oxide, air, high population density 0.00E+00 4.39E-03NH3 (Ammonia) emissions kg Ammonia, air, high population density 0.00E+00 6.78E-02NOx (Nitric Oxide) emissions kg Nitrogen oxides, air, high population density 0.00E+00 9.21E-03
Avoided Leaching to groundwaterPhosphorus leaching kg Total phosphorus, soil, agricultural 0.00E+00 1.13E-03Nitrate leaching kg Nitrate, water, river 0.00E+00 3.60E-01
Avoided Heavy Metal Emissions from P&N fertilizer mix applicationArsenic kg Arsenic, soil, agricultural 0.00E+00 3.23E-05Cadmium kg Cadmium, soil, agricultural 0.00E+00 1.46E-04Chromium kg Chromium III, soil, agricultural 0.00E+00 1.19E-03Copper kg Copper, soil, agricultural 0.00E+00 7.93E-05Lead kg Lead, soil, agricultural 0.00E+00 7.62E-05Zinc kg Zinc, soil, agricultural 0.00E+00 1.84E-03Nickel kg Nickel, soil, agricultural 0.00E+00 1.08E-04Mercury kg Mercury, soil, agricultural 0.00E+00 9.44E-08
8

Appendix B. Emissions, chemical consumption and electricity consumptionA. Emission calculationa. Atmospheric emission from raw manure storage
For the calculation of atmospheric emissions from raw manure storage, the amount of raw manure stored per day was assumed to be similar as the amount of raw manure treated per day.
Methane emissions
The IPCC Tier 2 method (IPCC, 2006a) as applied by De Clercq et al. (2015) is used to calculate the methane output, which depends on the amount of volatile solids excreted by the animals (VS) along with the maximum methane producing capacity for the manure (B0).
EF(T) [ kgCH 4
animal . yr ]=(VS(T )[ kg VSanimal . d ] . 365). [B0 (T )[ m3 CH 4
kg VS ].0 .67 [ kg CH 4
m3CH 4 ] .∑s , kMCF(sk) . MS(T , s ,k)]
Eq. A1
Where EF(T)is the annual CH4 emission factor for the livestock category T; VS(T)is the daily volatile solid excreted for the livestock category T; B0 (T ) is maximum methane producing capacity for manure produced by livestock of category T; 0.67 is the density of methane; MCF is the methane conversion factor for each manure management system S by climate region k (%); MS(T ,s , k) is the fraction of livestock category T's manure, handled using the manure management system S in climate region k (-).
Consideration for the calculation: The average VS excreted by 1 pig in Western Europe is 0.3 kg VS d-1 (IPCC, 1996); B0in Western Europe is 0.45 m³ CH4 kg-1 VS (IPCC, 2006a); MCF for manure storage in a pit below the animal confinements with an average temperature of 11°C is 19% (IPCC, 2006a); and MS for swine manure management system of pit storage during more than 1 month in Western Europe is 69.8% (IPCC, 2006 a). In order to get the amount of methane per m 3 of manure, the EF result was divided by the average volume of manure excreted by 1 pig per day in a feeder to finish farm which is 0.00516 m3.animal-1.d-1 (Chastain et al., 1999).
Direct nitrous oxide emissions
The calculation of direct N2O emissions from the manure management is based on IPCC (2006a) as applied by De Clercq et al. (2015).
N2 OD (mm)[ kg N2Oyr ]=[∑s [∑T (N (T ) . Nex(T )[ kg N
animal . yr ] . MS(T ,S ))] . EF3 ( s) [ kg N2O−Nkg N Manure ]] . 44
28 [ kg N 2Okg N2 O−N ]
Eq. A2
Where N2 OD (mm) is the direct N2O emissions from the Manure Management in the country; N (T ) is the number of head of livestock species per category T in the country; Nex(T) is annual average N excretion per head of species/category T in the country; MS(T ,S )is the fraction of the total annual nitrogen excretion for each livestock species/category T that is managed in manure management system S in the country, (-); EF3 (s) is the emission factor for direct N2O emissions from the manure
9

management system S in the country, expressed in kg N2O-N/kg N for the manure management
system S; and 4428 is the factor to convert 1 kg N2O-N into 1 kg N2O gas.
Consideration for the calculation: MS for swine manure management system of pit storage during more than 1 month in Western Europe is 69.8% (IPCC, 2006a) and EF3 from pig slurry stored underneath the stable is 0.2% (IPCC, 2006a). In order to obtain the amount of N2O per day, the N (T ) .
Nex(T) (kg N.yr-1) was assumed to correspond with the amount of nitrogen in the raw manure to be stored per day. Amount of raw manure stored per day was assumed equal to the amount of raw manure treated per day. The obtained value of N2O per day was subsequently divided by the volume of raw manure to be treated per day to obtain the amount of N2O per FU.
Indirect nitrous oxide emissions
There may also be nitrogen losses in other forms (f.e. ammonia and nitrous oxides) during manure management. Nitrogen volatilized as ammonia may be deposited at sites downwind from the manure handling areas and contribute to indirect N2O emissions. The amount of indirect N2O emissions resulting from N losses due to volatilisation from the manure management can be quantified according to IPCC (2006a) and as applied by De Clercq et al. (2015):
Nvolatilization−MMS[ kg NH3−N +NOx−NVolatilized
animal . yr ]=∑
s¿¿
Eq. A3
N 2 OG (mm ) [ kg N2 Oyr ]=(N volatilization−MMS . EF4 [ kg N2O−N
kg NH 3−N+NOx−NVolatilized ]) . 4428 Eq. A4
Where:
N volatilization−MMS is the amount of manure nitrogen that is lost due to the volatilisation of NH3 and NOx; N (T ) is the number of heads of livestock species/category T in the country; Nex(T) is the annual average N excretion per head of species/category T in the country; MS(T ,S )is the fraction of the total annual nitrogen excretion for each livestock species/category T that is managed in the manure
management system S in the country, (-); ¿GasMS
¿ ¿ is the percent of the manure nitrogen for the
livestock category T that volatilises as NH3 and NOx in the manure management system S (%). N 2 OG (mm ) are the indirect N2O emissions due to the volatilization of N from the manure management in the country;EF 4 is the emission factor for the N2O emissions from atmospheric deposition of
nitrogen on soils and water surfaces; 4428 is the conversion factor of kg N2O-N to kg N2O gas.
Consideration for the calculation: EF 4 default is 0.01 kg N2O-N.(kg NH3-N + NOx-N volatilised)-1; MS for swine manure management system of pit storage during more than 1 month in Western
Europe is 69.8% (IPCC, 2006a); and ¿GasMS
¿ ¿ for pig manure stored underneath the stables is 25%
(IPCC, 2006a). A similar approach as in the direct N2O calculation was used to obtain the amount of N2O per FU.
Ammonia emissions
10

The ammonia emission was determined based on the Tier 2 methodology for the calculation of the NH3-N emissions from the manure management, according to the EMEP-EEA (2009) table 3-8 and as applied by Wesnæs et al, 2013. The default NH3-N EF (ammonia emission factor) for fattening pigs and sows slurry storage is 0.14 kg NH3-N.kg TAN-1. The proportion of TAN for fattening pigs and sows is 0.7 of the total N. The resulting estimates of NH3-N emissions are then converted to NH3 by
multiplying with 1714 . The amount of nitrogen per FU was used to estimate the amount of ammonia
emissions per FU.
Nitrogen oxide emissions
The Nitrogen oxide emission was determined based on the Tier 2 technology-specific approach methodology for the calculation of the nitric oxide emissions from manure management, according to the EMEP-EEA (2009) Table 3-9 as applied by Grönroos et al, 2013. The default EFstorage_slurry NO (nitric oxide emission factor) for animal manure storage is 0.0001 kg NO.kg TAN-1. The proportion of TAN for fattening pigs and sows is 0.7 of the total N. The amount of nitrogen per FU was used to estimate the amount of nitrogen oxide emissions per FU.
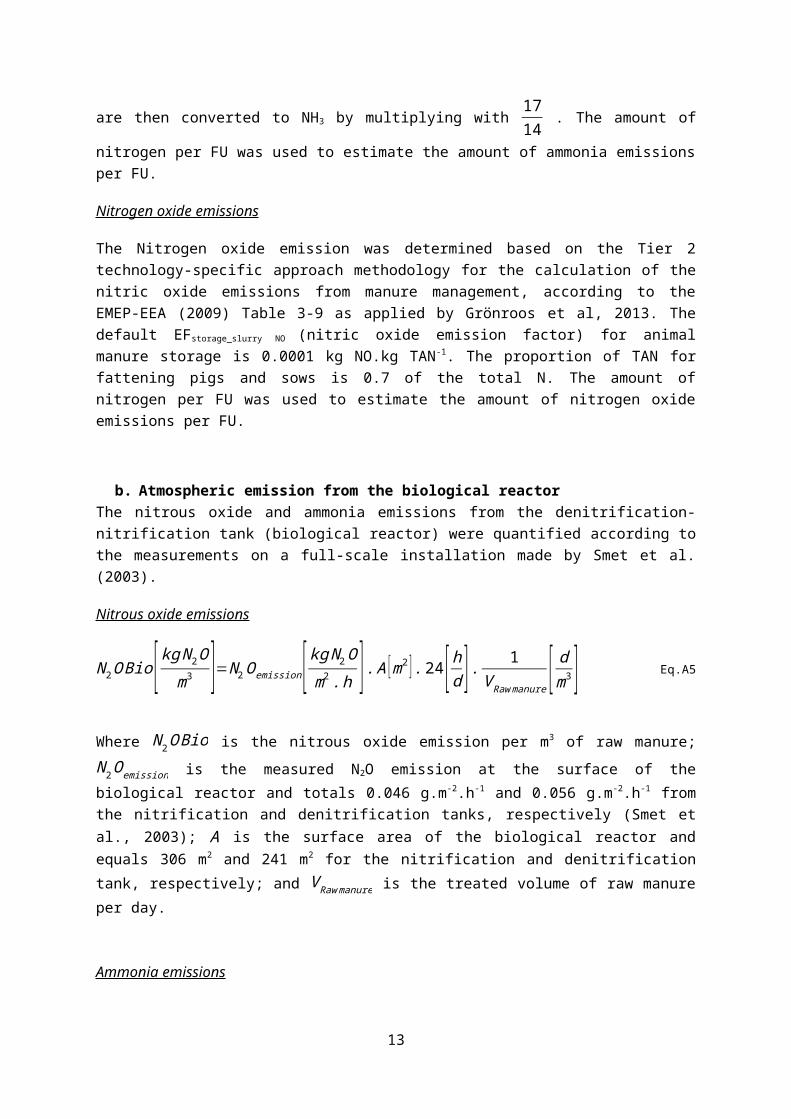
b. Atmospheric emission from the biological reactorThe nitrous oxide and ammonia emissions from the denitrification-nitrification tank (biological reactor) were quantified according to the measurements on a full-scale installation made by Smet et al. (2003).
Nitrous oxide emissions
N2 O Bio[ kg N2 Om3 ]=N2Oemission [ kg N2O
m2. h ] . A [m2 ] .24 [ hd ] . 1
V Rawmanure [ dm3 ] Eq.A5
Where N 2 O Bio is the nitrous oxide emission per m3 of raw manure; N 2 Oemission is the measured N2O emission at the surface of the biological reactor and totals 0.046 g.m-2.h-1 and 0.056 g.m-2.h-1 from the nitrification and denitrification tanks, respectively (Smet et al., 2003); A is the surface area of the biological reactor and equals 306 m2 and 241 m2 for the nitrification and denitrification tank, respectively; and V Rawmanure is the treated volume of raw manure per day.
Ammonia emissions
NH 3 Bio[ kg NH 3
m3 ]=NH3emission [ NH3
m2 . h ] . A [m2 ] . 24 [ hd ] . 1
V Raw manure [ dm3 ] Eq.A6
Where NH 3 Bio is the ammonia emission per m3 of raw manure; NH 3emission is the measured NH3
emission at the surface of the biological reactor, only detected from the denitrification tank, and was 0.051 g.m-2.h-1 (Smet et al., 2003); A is the surface area of the biological reactor, 241 m2 for the nitrification and denitrification tanks respectively; and V Rawmanure the volume of raw manure per day.
11

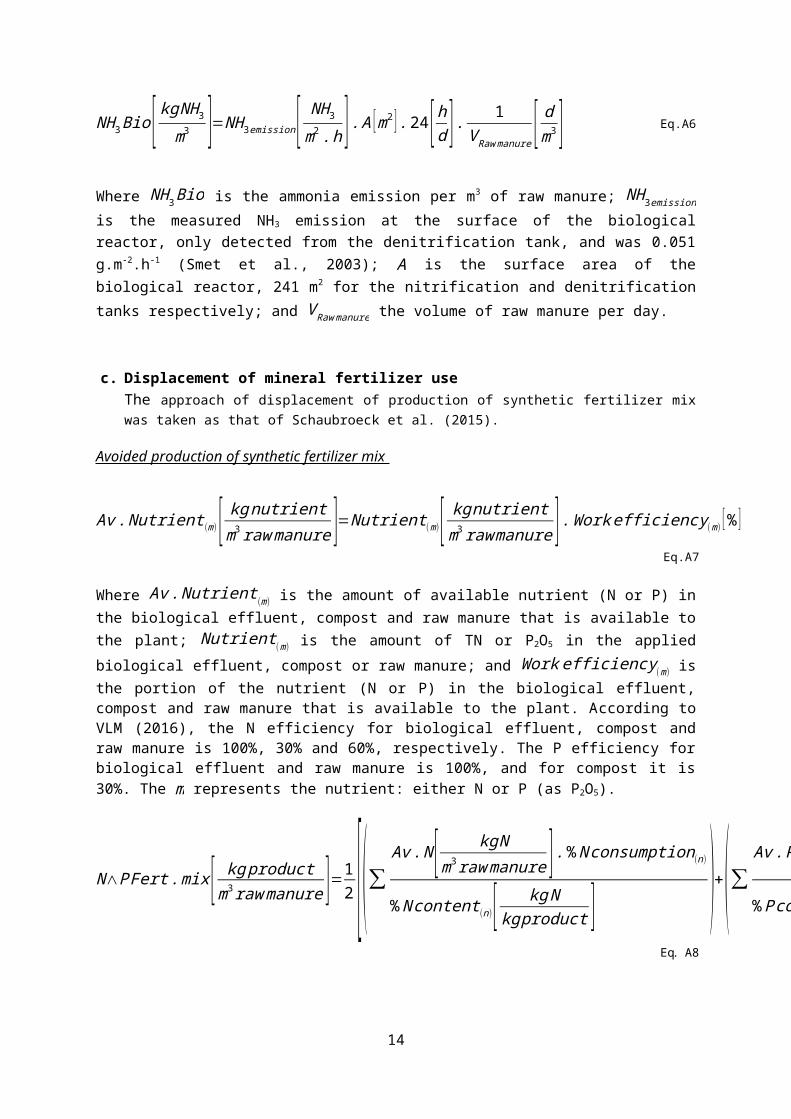
c. Displacement of mineral fertilizer useThe approach of displacement of production of synthetic fertilizer mix was taken as that of Schaubroeck et al. (2015).
Avoided production of synthetic fertilizer mix
Av . Nutrient(m )[ kg nutrientm3 raw manure ]=Nutrient(m )[ kg nutrient
m3 raw manure ] . Work efficiency (m ) [ % ] Eq.A7
Where Av . Nutrient(m ) is the amount of available nutrient (N or P) in the biological effluent, compost and raw manure that is available to the plant; Nutrient (m) is the amount of TN or P2O5 in the applied biological effluent, compost or raw manure; and Work efficiency(m ) is the portion of the nutrient (N or P) in the biological effluent, compost and raw manure that is available to the plant. According to VLM (2016), the N efficiency for biological effluent, compost and raw manure is 100%, 30% and 60%, respectively. The P efficiency for biological effluent and raw manure is 100%, and for compost it is 30%. The m represents the nutrient: either N or P (as P2O5).
N∧P Fert . mix [ kg productm3 raw manure ]=1
2 [(∑ Av . N [ kg Nm3raw manure ] . % N consumption(n)
% N content (n)[ kg Nkg product ] )+(∑ Av . P [ kg P
m3raw manure ] . % P consumption(n)
% P content (n)[ kg Pkg product ] )]
Eq. A8
Where N∧P Fert . mixis the amount of synthetic N&P fertilizer mix ; Av . N or available N is the amount of N in the biological effluent, compost and raw manure that is available to the plant; Av . P or available P is the amount of P2O5 in the biological effluent, compost and raw manure that is available to the plant; % N consumption(n) is the percentage of N (mass-based) consumption share of the fertilizer mix; % P consumption(n ) is the percentage of P (mass-based) consumption share of the fertilizer mix; % N content (n) is the mass fraction of N content in each fertilizer; and % P content (n) is the mass fraction of P content in each individual fertilizer. The n indicates the individual fertilizer considered in the N&P fertilizer mix, being monoammonium phosphate (MAP) or diammonium phosphate (DAP).
N Fert . mix [ kg productm3 raw manure ]=(∑ Av . N [ kg N
m3 raw manure ] . % N consumption(o)
% N content (o )[ kg Nkg product ] ) Eq. A9
Where N Fert .mixis the amount of synthetic N fertilizer mix ; Av . N or available N is the amount of N in the biological effluent, compost and raw manure that is available to the plant; % N consumption(o) is the percentage of N (mass-based) consumption share of the fertilizer mix; and % N content (o) is the mass fraction of N content in each fertilizer. The o indicates the individual fertilizer considered in the N fertilizer mix, being urea, calcium ammonium nitrate (CAN), or ammonium sulphate.
12
P Fert . mix [ kg productm3raw manure ]=( Av .P [ kg P
m3 raw manure ] . % P consumption❑
% P content [ kg Pkg product ] ) Eq. A10
Where P Fert .mixis the amount of synthetic P fertilizer mix ; Av . P or available P is the amount of P in the biological effluent, compost and raw manure that is available to the plant; % N consumption(p ) is the percentage of P (mass-based) consumption share of the fertilizer mix; and % N content ( p) is the mass fraction of P content in each fertilizer. The p indicates the individual fertilizer considered in the P fertilizer mix, that is triple super phosphate (TSP).
Avoided transportation of synthetic fertilizer mix
Fert . mix transport (q )[ ton product . kmm3 raw manure ]=Fert . mix(q )[ kg product
m3 raw manure ] . distance [ km ] . 1103 [ ton product
kg product ]Eq.A11
Where Fert .mix transport (q ) is the transportation work provided by a lorry or train; Fert . mix(q ) is the amount of synthetic fertilizer mix; and distance is transportation distance from manufacture to cropland, which are 100 km by lorry and 600 km by train (Nemecek and Kägi, 2007). The q represents the fertilizer mix type, either N&P, N or P fertilizer mix.
d. Atmospheric emission from field application of biological effluent, compost, raw manure and synthetic fertilizer
Direct nitrous oxide emissions
The calculation of the direct N2O emissions from managed soils is based on IPCC (2006b) as applied by De Clercq et al. (2015)
N2 ODirect−N [ kg N2 Oyr ]=( FSN+FON )[ kg N input
yr ] .EF 1[ kg N 2O−Nkg N input ] . 44
28 [ kg N2Okg N2O−N ] Eq.A12
Where N2 ODirect−N is the annual direct N2O-N emissions from N input; FSN is the annual amount of synthetic fertilizer N applied to soil; FON is the annual amount of animal manure, compost and other organic N additions applied to soil; EF1is the emission factor for N2O emissions from N inputs; and 4428 is the conversion factor of kg N2O-N to kg N2O gas.
Consideration for the calculation: EF1 from various synthetic and organic N (including animal excreta used as fertilizer) applications to soils and from other organic fertilizers is 0.01 (IPCC, 2006b). To obtain the amount of N2O per day, FSN and FON was assumed to correspond with the amount of nitrogen in the effluent, compost, raw manure or synthetic fertilizer per day. The amount of N2O per day was subsequently divided by the volume of raw manure to be treated per day to obtain the amount of N2O per FU.
13
Indirect nitrous oxide emissions
The indirect N2O emissions from the atmospheric deposition of N volatilized (as NH3 and NOx) from managed soils were estimated based on IPCC (2006b) as applied by De Clercq et al. (2015).
For animal manure, compost and other organic N, holds:
N 2 OIndirect [ kg N 2Oyr ]=FON [ kg N input
yr ] . ¿GasM
[ kg NH 3−N+NOx−NVolatilized
kg N input ]. EF 4[ kg N2 O−N
kg NH3−N+NOx−NVolatilized ] . 4428 [ kg N2 O
kg N 2 O−N ]¿ Eq. A13
For synthetic fertilizer N holds:
N 2 OIndirect [ kg N 2Oyr ]=FSN [ kg N input
yr ] . ¿GasF
[ kg NH 3−N+NOx−N Volatilized
kg N input ].EF 4[ kg N 2O−N
kg NH 3−N+NOx−NVolatilized ] . 4428 [ kg N 2O
kg N2 O−N ]¿
Eq.A14
Where N 2 OIndirect is the indirect nitrous oxide emission per year from spreading the biological effluent, compost, or raw manure; FSN is the annual amount of synthetic fertilizer N applied to the soil; FON is the annual amount of animal manure, compost and other organic N additions applied to
the soil; ¿GasM
¿ ¿is the fraction of applied organic fertilizer N (FON) that volatilizes as NH3 and NOx;
¿GasF
¿ ¿is the fraction of applied synthetic fertilizer N that volatilizes as NH3 and NOx; EF 4 is the
emission factor for N2O emissions from atmospheric deposition of N on soils and water surfaces; and 4428 is the conversion factor of kg N2O-N to kg N2O gas.
Consideration for the calculation: ¿GasM
¿ ¿ from all organic N fertilizers applied, and dung and urine
deposited by grazing animals, is 0.2; ¿GasF
¿ ¿ from a synthetic fertilizer is 0.1; and EF 4 from various
synthetic and organic N is 0.01 (IPCC, 2006b). A similar approach as in the direct N2O calculation was used to obtain the amount of N2O per FU.
Ammonia emissions
The ammonia emission was determined based on the Tier 2 methodology for the calculation of the NH3-N emissions from manure management according to EMEP-EEA (2009) table 3-8 and as applied by Wesnæs et al, 2013. The default NH3-N EF (ammonia emission factor) for fattening pigs and sows (slurry form) is 0.40 kg NH3-N.kg TAN-1. The proportion of TAN for fattening pigs and sows is 0.7 of the total N. For a mineral fertilizer, 0.02 kg NH3-N is emitted per kg N. The resulting estimates of
14

NH3-N emissions are then converted to NH3 by multiplying with 1714 . The amount of nitrogen per FU
was used to estimate the amount of ammonia emission per FU.
Nitrogen oxide emissions
During the denitrification process in the soil, NOx may also be produced. These emission were estimated, based on the direct N2O emission according to Nemecek and Kägi (2007). To obtain the amount of NOx, the amount of direct N2O emission was multiplied with 0.21.
e. Nitrate and phosphorus leaching to the ground water from biological effluent, compost, raw manure and synthetic fertilizer application
Nitrate leaching
Leaching of nitrate to the groundwater due to fertilizer application was calculated using the Smaling (1993) model proposed by Roy et al. (2003) and applied by Brockmann et. al. (2014).
NO3−N leach[ kg NO3−Nm3raw manure ]=
N applied [ kg Nd ] .(0.021 .P ¿+ irr[ mm
year ]−3.90) . 1100
V Raw manure[ m3
d ] Eq.A15
Where Napplied is the nitrogen content in the applied biological effluent, compost, raw manure or mineral fertilizer; and P¿+irr is the sum of mean annual precipitation, which is 800 mm.year-1 in Belgium, and irrigation which is assumed to be zero as irrigation is not applied in Flanders. This equation is applied for a soil with <35% clay content. Most of the farming soils in Flanders contain 2-16% of clay (De Neve et al., 2006).
Phosphorus leaching
Phosphorus leaching to the groundwater was estimated based on the SALCA-P model, summarized and used by Nemecek and Schnetzer (2012) and applied by Brockmann et. al. (2014).
Pleach [ kg Pm3raw manure ]=
Papplied [ kg P2 O5
d ] . Plost [ kg Pkg P2 O5 ]
V Raw manure[m3
d ] Eq.A16
Where Pleach is the amount of phosphorus leaching to the groundwater; Papplied is the phosphorus content in the applied biological effluent, compost, raw manure or mineral fertilizer; and Plost is the average amount of phosphorus lost through run-off to surface waters or/and phosphorus leaching to
the ground water; losses are 0.00048, 0.00184, and 0.00096 kgP
kg P2O5 for mineral fertilizer, biological
effluent/raw manure, and compost, respectively.
f. Heavy metal emission from biological effluent, composted solid fraction and raw manure.
15
Average heavy metal content in pig manure in mg.kg DM-1 based on Møller et al. (2002)Heavy Metal in mg.kg DM -1
As Cd Cu Zn Pb Ni Cr Hg DM
Pig Manure
Raw manure 3.00 0.30 640.00 770.00 5.00 9.00 10.00 0.30 5.63%*
Effluent 3.00 0.50 810.00 900.00 5.00 15.00 10.00 0.20 2.70%**
Compost 3.48 0.17 429.59 615.36 5.81 12.77 11.61 0.23 50.00%**
*%DM was obtained by mass balance calculation from liquid fraction and solid fraction **%DM was obtained from Møller et al. (2002) ***%DM was obtained from Brockmann et al. (2014)
Heavy metal in biological effluent
Heavy metalEffluent [ kg Heavy metalm3 Rawmanure ]=
V eEffluent [m3Effluent
d ] . ρEffluent [ kgEffluent
m3Effluent ]. DM [ kgDM
kgEffluent ] . Heavy metal [mg Heavy metal
kgDM ] . 1106 [ kg Heavy metal
mgHeavy metal ]V Raw manure[ m3 Rawmanure
d ]
Eq.A17
Heavy metal in compost
Heavy metalCompost [ kg Heavy metalm3 Raw manure ]=
V Compost [ m3Compost
d ] . ρCompost [ kgCompost
m3Compost ] . DM [ kgDM
kgCompost ] . Heavy metal [ mgHeavy metal
kgDM ] . 1106 [ kg Heavy metal
mgHeavy metal ]V Raw manure[ m3 Raw manure
d ]
Eq.A18Heavy metal in raw manure
Heavy metalRawmanure [ kg Heavy metalm3 Raw manure ]=ρRawmanure[ kgRaw manure
m3Rawmanure ] . DM [ kgDM
kgRawmanure ] . Heavy metal [ mgHeavy metal
kgDM ] . 1106 [ kg Heavy metal
mg Heavy metalmetal ]
Eq.A19
g. Heavy metal emission from avoided fertilizer
Average heavy metal content in mineral fertilizers (Brockmann et al., 2014) and the average of heavy metal content in each fertilizer mix Remy (2010).
Heavy Metal in mg.kg -1 *As Cd Cu Zn Pb Ni Cr Hg
Pig ManureRaw manure 3.00 0.30 640.00 770.00 5.00 9.00 10.00 0.30Effluent 3.00 0.50 810.00 900.00 5.00 15.00 10.00 0.20Compost 3.48 0.17 429.59 615.36 5.81 12.77 11.61 0.23N&P fertilizer mixMonoammonium phosphate 9.08 13.88 35.77 287.05 5.54 29.31 216.41 0.05Diammonium phosphate 7.97 43.10 26.50 330.00 0.87 35.10 272.00 0.01
16

Heavy Metal in mg.kg -1 *As Cd Cu Zn Pb Ni Cr Hg
Average N&P fertilizer mix 8.11 39.38 27.68 324.52 1.47 34.36 264.91 0.02N fertilizer mixUrea 0.09 0.01 0.83 3.66 0.35 0.27 0.61 0.01Calcium ammonium nitrate 0.31 0.05 1.33 37.01 19.18 0.03 0.80 0.01Ammonium sulphate 0.15 0.01 0.82 0.41 0.06 0.27 0.82 0.01Average N fertilizer mix 0.30 0.04 1.29 34.37 17.75 0.04 0.79 0.01P fertilizer mixTriple super phosphate 6.31 28.57 15.47 357.89 14.86 21.13 231.52 0.02Average P fertilizer mix 6.31 28.57 15.47 357.89 14.86 21.13 231.52 0.02
* For pig manure and its products, the heavy metal concentration is in mg.kg DM-1 and for synthetic fertilizer, the heavy metal concentration is in mg.kg product-1
Heavy metal in mineral fertilizer
Heavy metal SynFertilizer [ kg Heavy metalm3raw manure ]=Amount of SynFertilizer [ kg Product
m3 Raw manure ] . Heavy metal [ mgHeavy metal
kgProduct ] . 1103 [ kg Heavy metal
mg Heavy metal❑ ]
Eq.A20
B. Chemical consumption
Met h anolConsumption [ kg CH3 OHm3 Raw manure ]=
QMet feed [m3CH 3OHd ] .tMet feed [ d ] . ρMet [ kgCH 3OH
m3 CH3 OH ]V Manure [m3 Raw manure ]
Eq.A21
Where QMet feedis the flow of methanol feed and equals 1.5941 m3Met d-1 (from the simulated model); tMet feedis the methanol feeding duration during one complete cycle, 0.3333 d (from the simulated model); ρMet is the methanol density at 25oC = 792 kg.m-3; and V Manure is the volume of treated raw manure in one complete cycle, ± 222 m3 (from the simulated model). Hence, MethanolConsumption is 1.90 kg CH3OH.m-3 raw manure.
C. Electricity consumption
a. Total electricity for pumping manure
The power estimation for pumping was calculated using Eq. A22 (Perry and Green, 1999; as applied by De Meester (2013)).
P [Watt ]=Q [ m3
s ] .H [ m ] . g[ ms2 ] . ρ [ kg
m3 ]η
Eq.A22
Where P is the pump power; Q is the flow capacity, obtained from the simulated model; H is the calculated total dynamic head, calculated based on Eq.A23; g is the gravity constant (9.8 m.s -2); ρ is the fluid density (kg.m-3); and η is the pump efficiency –ratio of energy delivered by the pump to the
17
energy supplied to the pump shaft, which depends on the pump type and the flow rate (De Meester, 2013) and which normally ranges between 60-80% (Zane Satterfield, 2013).
1. The flow capacity (Q)
Most of the pump flows were obtained from the simulation model except for pumping from the raw manure buffer to the centrifuge and the thin manure buffer tank, and pumping from the settling tank to the raw manure buffer tank. The flow capacity of pump 1 and pump 6 refers to the flow of a centrifugal pump with 70% efficiency, and is 0.0315 m3.s-1. Normal pump efficiencies range between 60-80% (Zane Satterfield, 2013).
2. The liquid Density (ρ)
The liquid Density (ρ) of different fluids
Fluid DM (%) DM (Kg.m-3)
Density (Kg.m-3) Reference
Pig ManureRaw manure 5.63% 55.77 990 Calculated based on mass
balanceLiquid fraction 2.71% 27.70 1020 DM from Møller et al. (2002),
Density was assumed similar to pig urine from Backhurst et al. (1974)
Solid fraction 31% 786 786 DM from Møller et al. (2002), Density was calculated from mass balance
Sedimentation sludge 5.63% 55.77 990 Assumed similar to raw manureChemical
Methanol - 792 PubChem
3. The dynamic head (H) was obtained from the Bernoulli equation as applied by De Meester (2013) and is valid for a flow in closed systems such as pipes:
H [ m ]=∆ z [ m ]+∆ p [ kg
m ∙ s2 ]ρ [ kg
m3 ] . g[ ms2 ]
+(∆u [m
s ])2
g [ ms2 ] . α
+hL [ m ] Eq.A23
Where ∆ z is the difference in height between the starting and end position of the pipe; ∆ p is the static pressure difference between the starting and end position of the pipe (assumed zero for flow in atmospheric conditions); ∆ u is the difference in flow velocity (assumed zero for flow in pipes with a constant diameter); α is the correction factor for velocity distribution in the pipe; and hL is the total resistance head or head loss from the pipe and fittings.
3.1 The total resistance head (hL)
For the pipe that has one or more fittings (elbows, gates, valves), the total head loss for the system is the sum of the continuous losses due to friction, hf (the friction head loss) and the local losses, hm, due to flow obstruction elements that cause a change in the flow velocity profile, such as elbows, valves or gauges.
18

hL [ m ]=hf [m ]+hm [ m ] Eq.A24
h f [ m ]=fL [ m ] .(u [m
s ])2
D [ m ] .2 g [ms2 ]
Eq.A25
hm [ m ]=K(u[ m
s ])2
2g [ms2 ]
Eq.A26
Where u is the fluid velocity; g is the gravitational acceleration (9.81 m.s-2); L is the length of the pipe; D is the pipe diameter; f is the friction factor (unitless) and K is the friction loss factor or resistance coefficient (unitless). The elbows, valves, etc. all have a different K-value and hence a different contribution to the total head loss. The term hm (and likewise, hf) can consist of more than one term (e.g. hm1*n1 + hm2*n2 + …) for all types of obstructions (or parts with different friction factors).
The friction factor f can be quantified depending on the flow regime (Crowe, et. al, 2000):
Laminar flow
f =64ℜ (for Re<2000) Eq.A27
Turbulent flow
f = 0.25
[ log10( k s [m ]3.7 D [ m ]
+ 5.74ℜ0.9 )]
2 (for 4000<Re<108) Eq.A28
Where Re is the Reynolds number; D is the diameter; and k s is the equivalent sand-grain roughness depending on the piping material, which is 0.046 mm for commercial steel and wrought iron.
The resistance coefficient (K) values depend on the pipe fittings (elbow and valve). The assumed number of elbows and valves are shown in Table I. Elbows were assumed to be standard 90° Elbow Curved (K value = 0.75 from Menon, 2004) for all elbow fittings. The valves for pumping methanol to the denitrification tank were assumed to be fully open diaphragm valves (K value = 2.3 from Menon, 2004), as it is well suited for applications where tight, accurate closure is important (Spellman, 2013). The valve between the nitrification and denitrification tank pipe was assumed to be a fully open globe valve (K value = 6 from Menon, 2004), since it is preferred for frequent opening and closing because it seats very tightly and can be adjusted with fewer turns than gate valves (Spellman, 2013).
The length (L) and diameter (D) of pipes. The length of all pipes was estimated and determined based on the reference manure treatment plant using Google Earth (2016). The diameter of the pipe was assumed the be the same for all pipes.
19

The Reynold Number (Re). It was obtained from the equation:
ℜ=
ρ [ kgm3 ] . u [m
s ] . D [m ]
μ[ kgm s ]
Eq.A29
Where μ is the dynamic viscosity. Reynold numbers lower than 2000 indicate laminar flows. Reynold numbers above 4000 are situated in the turbulent region.
Table I. The total resistance head or head loss (hL) calculation in the pig manure treatment plant system
Pump Route L (m) D (m)
Number of
Elbows
Elbow K
value
Number of valves
Valve K
value
hm
(m)hf
(m)hL
(m)
Raw manure buffer tank to centrifuge and liquid manure buffer tank
48.35 0.1 4 0.75 0 - 9.24 2.46 11.7
Liquid manure buffer tank to denitrification tank
35.57 0.1 4 0.75 0 - 0.34 0.16 0.49
Methanol tank to denitrification tank
36.17 0.1 2 0.75 1 2.3 1.90E-05 1.07E-06 0.00
Recirculation between nitrification and denitrification tank
24.29 0.1 2 0.75 1 6 0.43 0.74 1.16
Nitrification tank to Settling tank 34.16 0.1 5 0.75 0 - 0.44 0.27 0.71Settling tank to Raw manure buffer tank
33.18 0.1 3 0.75 0 - 6.34 1.85 8.19
3.2 Difference in height between the starting and end position of the pipe (Z)
Pump Route Z (m) Assumption
Raw manure buffer tank to centrifuge 5 Maximum difference in height when the raw manure buffer tank is nearly empty
Liquid manure buffer tank to denitrification tank 5 Maximum difference in height when the liquid
manure buffer tank is nearly empty
Methanol tank to denitrification tank 5 Maximum difference in height when the methanol buffer tank is nearly empty
Recirculation between nitrification and denitrification tank 0 The height difference is zero as both work as
communicating vesselsNitrification tank to Settling tank 0 The height difference is negligible
Settling tank to Raw manure buffer tank 5 Maximum difference in height when the raw manure buffer tank is full
4. Calculation of the power of each pump and electricity consumption per m 3 treated raw manure
Electricity consumption:
20

EC Pumping [ kW hm3 raw manure ]= P [ kW ] . tPumping [h ]
V Manure [m3raw manure ] Eq.A30
Where tPumping is the working time during one complete cycle (obtained from the simulation model); and V Manure is the volume of treated raw manure during one complete cycle, which is ± 222 m3.
The power (Watt) of each pump in the pig manure treatment plant system
Pump Route Q (m3.s-1) H (m)ρ
(Kg.m-3)g (m.s-2) Power
(watt)
Pump efficiency
(%)
Working time (h)
Electricity consumption
(kWh.m-3)
Raw manure buffer to centrifuge and thin manure buffer tank
3.15E-02 1.67E+01 990 9.8 7.29E+03 70 1.96E+00 6.43E-02
Thin manure buffer tank to denitrification
tank 17.92E-03 5.49E+00 1020 9.8 6.21E+02 70 6.25E+00 1.75E-02
Methanol tank to denitrification tank 1 1.85E-05 5.00E+00 792 9.8 1.02E+00 70 8.00E+00 3.69E-05
Recirculation between nitrification and
denitrification tank 11.09E-02 7.36E-01 1020.00 9.8 1.14E+02 70 1.96E+01 1.01E-02
Nitrification tank 1 to Settling tank 1 9.33E-03 7.13E-01 1020.00 9.8 9.51E+01 70 5.75E+00 2.46E-03
Settling tank 1 to Raw manure buffer 3.15E-02 1.32E+01 990 9.8 5.76E+03 70 1.70 E01 4.42E-03
b. Electricity for centrifugation
Since it is very difficult to obtain a generic equation for determining the power consumption of a centrifugation process, the power consumption is modeled by using default powers of different types of equipment as described by Perry and Green (1999).
The type of centrifuge used in the manure treatment plant system is a decanter centrifuge and its liquid throughput is 0.0315 m3.s-1 or 31.5 l.s-1 (assumed that the liquid throughput was equal to the flow rate of raw manure pumped into the centrifuge). In reference to Perry and Green (1999), a decanter type centrifuge with a liquid throughput speed near 31.5 l.s -1 has a typical motor size of 223.8 kW. Hence the electricity consumption is:
ECCentrifuge [ kW hm3 raw manure ]= 223.8 [ kW ] .tCentrifuge [ h ]
V Manure [m3raw manure ] Eq.A31
t Centrifuge [h ]=t manure pumping [ h ]=V Manure [m3raw manure ] . 1QManure [ h
m3 raw manure ] Eq.A32
21

Where t centrifuge is the centrifuge working time during one complete cycle, and is assumed to be similar to the raw manure pumping working time (tmanure pumping) during one complete cycle, which is 1.9576 h (from the simulation model); V Manure is the volume of treated raw manure during one complete cycle, which is ± 222 m3 (from the simulated model); and QManureis the flow at which the raw manure is pumped to the centrifuge, which is 113.4 m3.h-1 (from the simulated model). Hence, ECCentrifuge is 1.973 kWh.m-3 raw manure.
c. Electricity for mixing during denitrification
EC Mixing[ kW hm3raw manure ]=
PMixing[ kWm3 ] .V Denit [m3 ] . tMixing [ d ] . 24
1 [ hd ]
V Manure [m3 raw manure ]Eq.A33
Where PMixingthe mixing power for anaerobic reactors = 0.008 kW.m-3 (Tchobanoglous et al., 2003); V Denitis the volume of liquid in the denitrification tank, which is 1444 m3; tMixingis the mixing duration of one complete cycle, which is 22.08 h (the sum of time for pumping feed, pumping methanol and aeration); and V Manure is the volume of treated raw manure in one complete cycle, which is ± 222 m3
(from the simulation model). Hence, EC Mixing is 1.15 kWh.m-3 raw manure.
d. Electricity for aeration
EC Aeration [ kW hm3 Rawmanure ]=
QAiration[ m3Air
d ] . t Aeration [ d ] . ρAir [ kg Air
m3Air ] .%O2[ kgO2
kg Air ] . 1Aeration capacity [ kW h
kgO2 ]V Manure [m3 Raw manure ]
Eq.A34
Where QAirthe aeration air flow, 146880 m3air.d-1 (from the simulation model); t Aerationis the aeration duration of one complete cycle, 0.3264 d (from the simulation model); ρAir the air density at 20oC = 1.225 kg.m-3; %O2 is the percentage of O2 in air which is 21%; Aeration capacity =3-5 kg O2.kWh-1
(Smet et al., 2003); and V Manure is the volume of treated raw manure in one complete cycle, ± 222 m3
(from the simulation model). Hence, EC Aeration is 13.89 kWh.m-3 raw manure.
22

Appendix C. Infrastructure details
A. The infrastructure size detailsDescription for supporting building: Description for methanol tank:
Description for concrete tanks and reactors: Description for effluent pond:
23
Design Value Unit Source
Supporting building for office, unloading
station and underground raw manure storage,
centrifuge, and solid fraction temporary
storage
Height 12.00 m Google Earth, 2016Base area 1300 m2 Google Earth, 2016Wall thickness 0.40 m Schaubroeck, et al., 2015Volume of concrete wall
721.92 m3 Calculated
Buffer tank 1 (raw manure)
Volume 924.00 m3 CalculatedHeight 6.00 m Assumed the height is similar to denitrification and
nitrification tankBase area 154.00 m2 Google Earth, 2016Wall thickness 0.40 m Schaubroeck, et al., 2015Volume of concrete wall
177.46 m3 Calculated
Buffer tank 2 (liquid fraction)
Volume 724.86 m3 CalculatedBase area 120.81 m2 Assumed the height is similar to denitrification and
nitrification tankHeight 6.00 m Google Earth, 2016Wall thickness 0.40 m Schaubroeck, et al., 2015Volume of concrete wall
96.55 m3 Calculated
Denitrification & Nitrification Reactor
Volume 3282.00 m3 Corbala Robles, et. Al 2016Base area 547.00 m2 Corbala Robles, et. al 2016Height 6.00 m Corbala Robles, et. al 2016Wall thickness 0.40 m Schaubroeck, et al., 2015Volume of concrete wall
352.49 m3 Calculated
Methanol Tank
Volume 42.42 m3 CalculatedBase area 7.07 m2 Assumed the height is similar to that of the
denitrification and nitrification tanksHeight 6.00 m Google Earth, 2016Wall thickness 0.0032 m Typical wall thickness of steel tank is 1/8th inchVolume of steels wall
0.20 m3 Calculated
Settling tank
Volume 2179.17 m3 CalculatedBase area 363.19 m2 Assumed the height is similar to that of the
denitrification and nitrification tanksHeight 6.00 m Google Earth, 2016Wall thickness 0.40 m Schaubroeck, et al., 2015Volume of concrete wall
159.15 m3 Calculated
Effluent Lagoon
Width 51.3 m Google Earth, 2016
Length 51.3 m Google Earth, 2016
Depth 1.50 m Depth of polishing lagoon ranges between 1-1.5 m (Kayombo et al., 2005)
Slope 0.25 o Assumed slope 1/4Water surface area 2631.69 m2 CalculatedMid depth area 2052.09 m2 CalculatedVolume of pond 2407.59 m3 CalculatedPond surface area covered with HDPE liner
3741.44 m2 Calculated
24

Appendix D. Fertilizer application and manure storage
The spreading and tillage processes are specified per hectare amounts in the Ecoinvent database, for this, the areal application rate of each fertilizer must be calculated. These rates were calculated based on the ‘effective N’-limit and ‘effective P’-limit following the regulation in Flanders (VLM, 2016). Since the fertilizer’s areal application rate depends on the crop and the soil type, the following assumptions were made: i) The dosage was based on sandy soil as the most common soil textures in Flanders are sandy or loamy sand (De Neve, et al., 2006); ii) Maize was used as a reference crop, as in Flanders, grain maize is one of the most cultivated cereals which covered 65,957 ha of the total arable land in 2013 (Boone et al., 2016). To calculate the allowable amount of product to be applied on the field, the effective concentrations of the total N or P in the considered fertilizer were first determined. Then, based on the ‘effective N’-limit and ‘effective P’-limit for a maize crop in a sandy soil, the allowed amount of product applied per hectare could be derived. The allowed amount of product was different for calculations based on N or P content, and so the lower one was chosen considering the regulation.
Table S4.1 The calculated application rates for manure products and synthetic fertilizer.
Raw manure Effluent Compost
N&P fertilizer mix
c
N fertilizer mix c
P fertilizer mix c
N content a 4.65 0.62 3.57 0.17 0.26 -P content a 1.02 0.09 12.37 0.21 - 0.20% Effective N 60 100 30 100 100 100% Effective P 100 100 50 100 100 100‘Effective N’ application limit(kg N.ha-1)
135 135 135 135 135 135
‘Effective P’ application limit(kg P.ha-1)
70 70 70 70 70 70
Allowed applied product-based on effective N limit b
48.35 217.81 126.05 774.69 528.09 -
Allowed applied product-based on effective P limit b
29.68 346.34 4.94 149.41 - 152.17
a The unit is kg nutrient.m-3 for manure-based products and kg nutrient.(kg product)-1 for synthetic fertilizersb The unit is m3.ha-1 for manure-based products and kg product.ha-1 for mineral fertilizersc The N and P content of the fertilizer mix is based on the N and P content of the individual fertilizer multiplied by
their %N and %P mass consumption share in Table S1.6
Table S4.2 The calculated atmospheric emission factors for the manure storage process of raw manure.
unit Raw manure Source
CH4 kg per m3 manure 2.28 IPCC (2006a)NH3 kg per kg Ninput 0.1190 EMEP-EEA (2009)Direct N2O kg per kg Ninput 0.0009 IPCC (2006a)Indirect N2O kg per kg Ninput 0.0012 IPCC (2006a)NOx kg per kg Ninput 0.0002 EMEP-EEA (2009)
25

Table S4.3 The calculated atmospheric emission factors for the field application process of manure-based products and synthetic fertilizers.
unit Raw manure Effluent Compost Synthetic
fertilizerNH3
a kg per kg TANinput 0.4857 0.4857 0.4857 0.0243Direct N2O b kg per kg Ninput 0.0157 0.0157 0.0157 0.0157Indirect N2O b kg per kg Ninput 0.0031 0.0031 0.0031 0.0016
NOx c kg per kg Direct
N2O0.2100 0.2100 0.2100 0.2100
a The emission model from EMEP-EEA (2009)b The emission model from IPCC (2006b)c The emission model from Nemecek and Kägi (2007)
Table S4.4 The calculated leaching factor for the field application process of manure-based products and synthetic fertilizers.
unit Raw manure Effluent Compost Synthetic
fertilizerNitrate a kg per kg Ninput 0.1290 0.1290 0.1290 0.1290Phosphorus b kg P per kg P2O5 input 0.0018 0.0018 0.0009 0.0005
a The Smaling (1993) model proposed by Roy et al. (2003)b The SALCA-P model summarised and used by Nemecek and Schnetzer (2012)
Table S4.5 The heavy metal content in manure-based products (Møller et al., 2007) and synthetic fertilizers (Brockmann et al., 2014).
Heavy Metal in mg.kg -1 *As Cd Cu Zn Pb Ni Cr Hg
Pig Manure†
Raw manure 3.00 0.30 640.00 770.00 5.00 9.00 10.00 0.30Effluent 3.00 0.50 810.00 900.00 5.00 15.00 10.00 0.20Compost 3.48 0.17 429.59 615.36 5.81 12.77 11.61 0.23N&P fertilizer mixMonoammonium phosphate 9.08 13.88 35.77 287.05 5.54 29.31 216.41 0.05Diammonium phosphate 7.97 43.10 26.50 330.00 0.87 35.10 272.00 0.01Average N&P fertilizer mix 8.11 39.38 27.68 324.52 1.47 34.36 264.91 0.02N fertilizer mixUrea 0.09 0.01 0.83 3.66 0.35 0.27 0.61 0.01Calcium ammonium nitrate 0.31 0.05 1.33 37.01 19.18 0.03 0.80 0.01Ammonium sulphate 0.15 0.01 0.82 0.41 0.06 0.27 0.82 0.01Average N fertilizer mix 0.30 0.04 1.29 34.37 17.75 0.04 0.79 0.01P fertilizer mixTriple super phosphate 6.31 28.57 15.47 357.89 14.86 21.13 231.52 0.02Average P fertilizer mix 6.31 28.57 15.47 357.89 14.86 21.13 231.52 0.02
* For Pig Manure and its product, the heavy metal in mg.kg DM -1 and for synthetic fertilizer, the heavy metal in mg.kg product -1
† Data on heavy metals content in raw manure, effluent (assumed similar to the manure liquid fraction), and compost (assumed similar to the manure solid fraction) were obtained from Møller et al. (2007).
26

The average composition of Belgian synthetic fertilizer mixes were based on fertilizer consumption statistics from the International Fertilizer Industry Association for different kinds of synthetic fertilizers in Belgium (for single N and P fertilizer mixes) and Western and Central Europe (binary N&P fertilizer mixes) in the year of 2013 (IFA, 2016; Table S1.6). The product mass consumption share in % of each individual fertilizer was used to determine the average heavy metal content in each fertilizer mix, as presented in Table S1.5. Furthermore, the %N and %P mass consumption share of each individual fertilizer were used to determine the average N and P content in each fertilizer mix, presented in Table S1.1.
Table S4.6 The consumption share of average Belgian and West European fertilizer mixes (IFA, 2016)**.
Compounds Consumption Mass-based consumption
share of fertilizer mix
N&P fertilizer mix (N,P) ktonnes
P2O5/yr
ktonnes
N/yr
ktonnes
Product/yr
% P %N %Product
Monoammonium phosphate (11,52) 131 28 252 14 8 13
Diammonium phosphate (18,46) 794 311 1752 86 92 87
N fertilizer mix (N,P) ktonnes N/yr % N
Urea (46/0) 10 22 8 4
Calcium ammonium nitrate (24,0) 119 502 89 92
Ammonium sulphate (21,0) 4 19 3 4
P fertilizer mix (N,P) ktonnes P2O5/yr % P
Triple super phosphate (0/46) 2.1 2 100 100
* (N,P) represents the mass fraction of N and P content in each fertilizer**The average composition of Belgian synthetic fertilizer mixes was based on fertilizer consumption statistics
from the International Fertilizer Industry Association for different kinds of synthetic fertilizers in Belgium (for single N and P fertilizer mixes) and Western and Central Europe (binary N&P fertilizer mixes) in the year of 2013 (IFA, 2016).
27

Appendix E. midpoint and endpoint environmental impactsTable S5.1 Environmental impacts from the treatment of 1 m3 raw pig manure calculated at midpoint with the ReCiPe method (version 1.12) – the treatment scenario
Climate Change (kg CO2 eq)
Ozone depletion
(kg CO2 eq)
Terrestrial acidification(kg SO2 eq)
Freshwater eutrophication
(kg P eq)
Marine eutrophication
(kg N eq)
Human toxicity (kg 1,4-DB eq)
Photochemical oxidant formation
(kg NMVOC)
Particulate matter
formation(kg PM10 eq)
Terrestrial ecotoxicity(kg 1,4-DB
eq)
Freshwater ecotoxicity
(kg 1,4-DB eq)
Marine ecotoxicity
(kg 1,4-DB eq)
Ionising radiation (kBq U235 eq)
Agricultural land occupation (m2a)
Urban land occupation (m2a)
Natural land transformation (m2)
Water depletion
(m3)
Metal depletion (kg Fe eq)
Fossil depletion (kg oil eq)
THE TREATMENT SCENARIOConstruction 7.18E-01 7.01E-08 4.71E-03 3.82E-04 6.80E-04 7.93E-01 3.05E-03 1.88E-03 1.01E-04 3.02E-02 2.81E-02 6.96E-02 8.45E-02 3.23E-02 1.06E-04 8.07E-03 2.58E-01 1.44E-01
Manure Treatment Operation
Transport to Treatment Plant 2.69E+00 4.97E-07 1.43E-02 1.97E-04 1.34E-03 9.36E-01 2.11E-02 7.33E-03 1.51E-03 2.34E-02 3.07E-02 2.25E-01 4.04E-02 1.85E-01 1.00E-03 8.43E-03 1.07E-01 9.77E-01
Chemical Production & Transport 1.23E+00 2.60E-07 1.31E-02 2.42E-04 7.87E-04 4.88E-01 6.04E-03 3.38E-03 2.51E-04 2.08E-02 1.13E-02 8.29E-02 1.30E-02 1.26E-02 5.83E-04 9.04E-03 7.29E-02 1.41E+00
Electricity: Manure Treatment Plant 5.18E+00 1.37E-06 1.15E-02 8.20E-04 7.79E-02 1.06E+00 9.06E-03 4.75E-03 4.91E-04 6.87E-02 6.35E-02 9.51E+00 9.46E-01 2.46E-02 1.11E-03 4.20E-02 3.21E-01 1.68E+00
Emission: Biological Treatment 2.69E+00 0.00E+00 7.86E-03 0.00E+00 2.95E-04 0.00E+00 0.00E+00 1.03E-03 0.00E+00 0.00E+00 0.00E+00 0.00E+00 0.00E+00 0.00E+00 0.00E+00 0.00E+00 0.00E+00 0.00E+00
Composting Operation 2.19E+00 5.23E-07 7.01E-03 2.87E-04 2.28E-02 5.48E-01 8.08E-03 3.27E-03 5.34E-04 2.58E-02 2.62E-02 2.80E+00 2.83E-01 5.50E-02 5.79E-04 1.43E-02 1.20E-01 7.37E-01
Field Application of Effluent
Transport 5.97E-01 1.10E-07 3.17E-03 4.38E-05 2.97E-04 2.08E-01 4.69E-03 1.63E-03 3.36E-04 5.19E-03 6.80E-03 4.99E-02 8.96E-03 4.10E-02 2.22E-04 1.87E-03 2.37E-02 2.17E-01
Spreading 6.62E-02 9.91E-09 4.85E-04 1.01E-05 4.77E-05 1.61E-02 7.58E-04 2.42E-04 5.07E-06 4.16E-04 4.12E-04 5.08E-03 2.28E-03 4.62E-04 1.89E-05 2.13E-04 7.60E-03 2.04E-02
Emission: Effluent Spreading 2.35E+00 0.00E+00 2.66E-02 0.00E+00 9.71E-04 0.00E+00 1.38E-03 3.68E-03 0.00E+00 0.00E+00 0.00E+00 0.00E+00 0.00E+00 0.00E+00 0.00E+00 0.00E+00 0.00E+00 0.00E+00
N & P Leaching 0.00E+00 0.00E+00 0.00E+00 3.20E-04 1.24E-02 0.00E+00 0.00E+00 0.00E+00 0.00E+00 0.00E+00 0.00E+00 0.00E+00 0.00E+00 0.00E+00 0.00E+00 0.00E+00 0.00E+00 0.00E+00
Heavy metal emission 0.00E+00 0.00E+00 0.00E+00 0.00E+00 0.00E+00 1.09E+01 0.00E+00 0.00E+00 1.42E-01 1.35E-02 6.88E-03 0.00E+00 0.00E+00 0.00E+00 0.00E+00 0.00E+00 0.00E+00 0.00E+00
Total 3.01E+00 1.20E-07 3.03E-02 3.74E-04 1.37E-02 1.11E+01 6.82E-03 5.55E-03 1.42E-01 1.92E-02 1.41E-02 5.50E-02 1.12E-02 4.15E-02 2.41E-04 2.08E-03 3.13E-02 2.37E-01
Field Application of Compost
Transport 1.49E+00 2.75E-07 7.91E-03 1.09E-04 7.41E-04 5.18E-01 1.17E-02 4.06E-03 8.38E-04 1.29E-02 1.70E-02 1.24E-01 2.23E-02 1.02E-01 5.54E-04 4.67E-03 5.92E-02 5.41E-01
Spreading 1.61E-02 2.41E-09 1.18E-04 2.47E-06 1.16E-05 3.93E-03 1.85E-04 5.89E-05 1.23E-06 1.01E-04 1.00E-04 1.24E-03 5.55E-04 1.12E-04 4.59E-06 5.19E-05 1.85E-03 4.97E-03
Cultivating 5.01E-02 6.49E-09 3.34E-04 8.79E-06 3.37E-05 1.12E-02 5.10E-04 1.93E-04 2.66E-06 4.22E-04 4.18E-04 3.80E-03 2.27E-03 4.73E-04 1.25E-05 1.96E-04 1.08E-02 1.43E-02
Atmospheric Emission 1.55E+00 0.00E+00 2.30E-01 0.00E+00 8.61E-03 0.00E+00 9.08E-04 3.01E-02 0.00E+00 0.00E+00 0.00E+00 0.00E+00 0.00E+00 0.00E+00 0.00E+00 0.00E+00 0.00E+00 0.00E+00
N & P Leaching 0.00E+00 0.00E+00 0.00E+00 2.10E-03 8.16E-03 0.00E+00 0.00E+00 0.00E+00 0.00E+00 0.00E+00 0.00E+00 0.00E+00 0.00E+00 0.00E+00 0.00E+00 0.00E+00 0.00E+00 0.00E+00
Heavy Metal Deposition 0.00E+00 0.00E+00 0.00E+00 0.00E+00 0.00E+00 7.28E+00 0.00E+00 0.00E+00 7.97E-02 7.42E-03 3.85E-03 0.00E+00 0.00E+00 0.00E+00 0.00E+00 0.00E+00 0.00E+00 0.00E+00
Total 3.10E+00 2.84E-07 2.38E-01 2.22E-03 1.76E-02 7.81E+00 1.33E-02 3.44E-02 8.06E-02 2.09E-02 2.13E-02 1.29E-01 2.52E-02 1.03E-01 5.71E-04 4.92E-03 7.19E-02 5.60E-01
Total Field Application of Organic Fertilizer 6.11E+00 4.04E-07 2.68E-01 2.59E-03 3.13E-02 1.89E+01 2.01E-02 4.00E-02 2.23E-01 4.00E-02 3.54E-02 1.84E-01 3.64E-02 1.44E-01 8.13E-04 7.00E-03 1.03E-01 7.97E-01
Total Treatment Scenario Impact without benefit 2.08E+01 3.12E-06 3.27E-01 4.52E-03 1.35E-01 2.28E+01 6.75E-02 6.12E-02 2.26E-01 2.09E-01 1.95E-01 1.29E+01 1.40E+00 4.54E-01 4.19E-03 8.89E-02 9.82E-01 5.74E+00
Avoided Synthetic Fertilizer from Effluent Application
Production -5.02E+00 -4.11E-07 -2.92E-02 -8.26E-04 -3.40E-03 -1.17E+00 -1.14E-02 -8.06E-03 -6.47E-04 -4.24E-02 -4.31E-02 -2.79E-01 -7.64E-02 -9.73E-02 -8.43E-04 -6.52E-02 -2.80E-01 -8.99E-01
Transport -1.14E-01 -1.63E-08 -6.41E-04 -3.71E-05 -4.43E-04 -4.41E-02 -8.28E-04 -2.98E-04 -2.60E-05 -1.21E-03 -1.28E-03 -2.86E-02 -4.33E-03 -6.03E-03 -3.19E-05 -6.00E-04 -1.20E-02 -3.49E-02
Spreading -1.07E-01 -1.61E-08 -7.87E-04 -1.65E-05 -7.74E-05 -2.62E-02 -1.23E-03 -3.93E-04 -8.23E-06 -6.75E-04 -6.70E-04 -8.23E-03 -3.70E-03 -7.50E-04 -3.06E-05 -3.46E-04 -1.23E-02 -3.31E-02
Atmospheric Emission -2.75E+00 0.00E+00 -3.28E-02 0.00E+00 -1.19E-03 0.00E+00 -1.76E-03 -4.54E-03 0.00E+00 0.00E+00 0.00E+00 0.00E+00 0.00E+00 0.00E+00 0.00E+00 0.00E+00 0.00E+00 0.00E+00
Leaching 0.00E+00 0.00E+00 0.00E+00 -8.36E-05 -1.58E-02 0.00E+00 0.00E+00 0.00E+00 0.00E+00 0.00E+00 0.00E+00 0.00E+00 0.00E+00 0.00E+00 0.00E+00 0.00E+00 0.00E+00 0.00E+00
Heavy metal emission 0.00E+00 -1.57E-06 0.00E+00 0.00E+00 0.00E+00 -1.16E+00 0.00E+00 0.00E+00 -3.83E-04 -2.42E-05 -1.29E-05 0.00E+00 0.00E+00 0.00E+00 0.00E+00 0.00E+00 0.00E+00 0.00E+00
Total -7.99E+00 -2.00E-06 -6.34E-02 -9.63E-04 -2.10E-02 -2.40E+00 -1.52E-02 -1.33E-02 -1.06E-03 -4.43E-02 -4.51E-02 -3.16E-01 -8.44E-02 -1.04E-01 -9.05E-04 -6.61E-02 -3.04E-01 -9.67E-01
Avoided Synthetic Fertilizer from Compost Application
Production -2.15E+00 -4.02E-07 -2.63E-02 -2.46E-03 -5.26E-03 -1.81E+00 -1.01E-02 -1.01E-02 -1.02E-03 -6.02E-02 -5.86E-02 -5.15E-01 -1.29E-01 -5.70E-01 -9.71E-04 -1.30E-01 -3.42E-01 -9.06E-01
Transport -1.07E-01 -1.54E-08 -6.03E-04 -3.48E-05 -4.17E-04 -4.14E-02 -7.78E-04 -2.80E-04 -2.45E-05 -1.14E-03 -1.20E-03 -2.69E-02 -4.07E-03 -5.67E-03 -3.00E-05 -5.64E-04 -1.13E-02 -3.28E-02
Spreading -3.31E-01 -4.96E-08 -2.42E-03 -5.07E-05 -2.38E-04 -8.07E-02 -3.79E-03 -1.21E-03 -2.53E-05 -2.08E-03 -6.70E-08 -2.54E-02 -1.14E-02 -2.31E-03 -9.43E-05 -1.07E-03 -3.80E-02 -1.02E-01
Atmospheric Emission -4.25E-01 0.00E+00 -5.06E-03 0.00E+00 -1.84E-04 0.00E+00 -2.72E-04 -7.01E-04 0.00E+00 0.00E+00 0.00E+00 0.00E+00 0.00E+00 0.00E+00 0.00E+00 0.00E+00 0.00E+00 0.00E+00
Leaching 0.00E+00 0.00E+00 0.00E+00 -5.24E-04 -2.45E-03 0.00E+00 0.00E+00 0.00E+00 0.00E+00 0.00E+00 0.00E+00 0.00E+00 0.00E+00 0.00E+00 0.00E+00 0.00E+00 0.00E+00 0.00E+00
28

Climate Change (kg CO2 eq)
Ozone depletion
(kg CO2 eq)
Terrestrial acidification(kg SO2 eq)
Freshwater eutrophication
(kg P eq)
Marine eutrophication
(kg N eq)
Human toxicity (kg 1,4-DB eq)
Photochemical oxidant formation
(kg NMVOC)
Particulate matter
formation(kg PM10 eq)
Terrestrial ecotoxicity(kg 1,4-DB
eq)
Freshwater ecotoxicity
(kg 1,4-DB eq)
Marine ecotoxicity
(kg 1,4-DB eq)
Ionising radiation (kBq U235 eq)
Agricultural land occupation (m2a)
Urban land occupation (m2a)
Natural land transformation (m2)
Water depletion
(m3)
Metal depletion (kg Fe eq)
Fossil depletion (kg oil eq)
Heavy metal emission 0.00E+00 0.00E+00 0.00E+00 0.00E+00 0.00E+00 -7.38E+00 0.00E+00 0.00E+00 -1.79E-03 -1.25E-04 -6.47E-05 0.00E+00 0.00E+00 0.00E+00 0.00E+00 0.00E+00 0.00E+00 0.00E+00
Total -3.01E+00 -4.67E-07 -3.44E-02 -3.07E-03 -8.55E-03 -9.31E+00 -1.49E-02 -1.23E-02 -2.85E-03 -6.36E-02 -6.19E-02 -5.67E-01 -1.44E-01 -5.78E-01 -1.10E-03 -1.31E-01 -3.91E-01 -1.04E+00
Total Avoided Field Application -1.10E+01 -2.48E-06 -9.78E-02 -4.03E-03 -2.95E-02 -1.17E+01 -3.01E-02 -2.55E-02 -3.92E-03 -1.08E-01 -1.07E-01 -8.84E-01 -2.29E-01 -6.82E-01 -2.00E-03 -1.98E-01 -6.95E-01 -2.01E+00
Total environmental impact of the treatment scenario 9.80E+00 6.39E-07 2.29E-01 4.90E-04 1.06E-01 1.10E+01 3.74E-02 3.61E-02 2.22E-01 1.01E-01 8.81E-02 1.20E+01 1.17E+00 -2.28E-01 2.19E-03 -1.09E-01 2.87E-01 3.73E+00
Table S5.2 Environmental impacts from the treatment of 1 m3 raw pig manure calculated at midpoint with the ReCiPe method (version 1.12) – the no-treatment scenario
Climate Change
(kg CO2 eq)
Ozone depletion
(kg CO2 eq)
Terrestrial acidification(kg SO2 eq)
Freshwater eutrophication
(kg P eq)
Marine eutrophicati
on (kg N eq)
Human toxicity(kg 1,4-DB eq)
Photochemical oxidant
formation(kg NMVOC)
Particulate matter
formation(kg PM10
eq)
Terrestrial ecotoxicity (kg 1,4-DB
eq)
Freshwater
ecotoxicity (kg 1,4-DB
Marine ecotoxicity (kg 1,4-DB eq)
Ionising radiation
(kBq U235 eq)
Agricultural land
occupation (m2a)
Urban land
occupation (m2a)
Natural land trans-
formation (m2)
Water depletion
(m3)
Metal depletion (kg
Fe eq)
Fossil depletion (kg oil eq)
THE NO-TREATMENT SCENARIOEmissions: Raw Manure Storage 2.46E+01 0.00E+00 1.36E+00 0.00E+00 5.09E-02 0.00E+00 8.37E-03 1.77E-01 0.00E+00 0.00E+0
0 0.00E+00 0.00E+00 0.00E+00 0.00E+00 0.00E+00 0.00E+00 0.00E+00 0.00E+00
Field Application of Raw Manure
Transport 9.41E+00 1.74E-06 5.00E-02 6.90E-04 4.69E-03 3.28E+00 7.40E-02 2.57E-02 5.30E-03 8.18E-02 1.07E-01 7.87E-01 1.41E-01 6.47E-01 3.51E-03 2.95E-02 3.75E-01 3.42E+00
Spreading 2.24E+00 3.01E-07 1.53E-02 3.81E-04 1.53E-03 5.12E-01 2.35E-02 8.51E-03 1.32E-04 1.77E-02 1.75E-02 1.70E-01 9.56E-02 1.98E-02 5.79E-04 8.39E-03 4.27E-01 6.52E-01
Atmospheric Emission 2.62E+01 0.00E+00 3.89E+00 0.00E+00 1.46E-01 0.00E+00 1.54E-02 5.10E-01 0.00E+00 0.00E+00 0.00E+00 0.00E+00 0.00E+00 0.00E+00 0.00E+00 0.00E+00 0.00E+00 0.00E+00
N & P Leaching 0.00E+00 0.00E+00 0.00E+00 4.34E-03 1.38E-01 0.00E+00 0.00E+00 0.00E+00 0.00E+00 0.00E+00 0.00E+00 0.00E+00 0.00E+00 0.00E+00 0.00E+00 0.00E+00 0.00E+00 0.00E+00
Heavy Metal Deposition 0.00E+00 0.00E+00 0.00E+00 0.00E+00 0.00E+00 2.17E+01 0.00E+00 0.00E+00 2.70E-01 2.53E-02 1.30E-02 0.00E+00 0.00E+00 0.00E+00 0.00E+00 0.00E+00 0.00E+00 0.00E+00
Total 3.78E+01 2.04E-06 3.95E+00 5.41E-03 2.90E-01 2.55E+01 1.13E-01 5.44E-01 2.75E-01 1.25E-01 1.38E-01 9.57E-01 2.37E-01 6.67E-01 4.08E-03 3.79E-02 8.02E-01 4.07E+00
Total No treatment Scenario without benefit 6.24E+01 2.04E-06 5.31E+00 5.41E-03 3.41E-01 2.55E+01 1.21E-01 7.21E-01 2.75E-01 1.25E-
01 1.38E-01 9.57E-01 2.37E-01 6.67E-01 4.08E-03 3.79E-02 8.02E-01 4.07E+00
Avoided Synthetic Fertilizer from Raw Manure Application
Production -2.87E+01 -2.60E-06 -1.83E-01 -7.96E-03 -2.54E-02 -8.38E+00 -7.16E-02 -5.43E-02 -4.57E-03 -2.99E-01 -2.99E-01 -2.15E+00 -5.68E-01 -1.20E+00 -5.49E-
03 -4.93E-01 -1.89E+00 -5.73E+00
Transport -2.31E-01 -3.31E-08 -1.30E-03 -7.51E-05 -8.98E-04 -8.92E-02 -1.68E-03 -6.04E-04 -5.27E-05 -2.46E-03 -2.58E-03 -5.78E-02 -8.78E-03 -1.22E-02 -6.46E-
05 -1.21E-03 -2.44E-02 -7.08E-02
Spreading -8.88E-01 -1.33E-07 -6.50E-03 -1.36E-04 -6.40E-04 -2.17E-01 -1.02E-02 -3.25E-03 -6.80E-05 -5.58E-03 -5.53E-03 -6.82E-02 -3.06E-02 -6.20E-03 -2.53E-
04 2.86E-03 -1.02E-01 -2.74E-01
Atmospheric Emission -1.44E+01 0.00E+00 -1.71E-01 0.00E+00 -6.24E-03 0.00E+00 -9.21E-03 -2.37E-02 0.00E+00 0.00E+00 0.00E+00 0.00E+00 0.00E+00 0.00E+00 0.00E+00 0.00E+00 0.00E+00 0.00E+00
Leaching 0.00E+00 0.00E+00 0.00E+00 -1.13E-03 -8.28E-02 0.00E+00 0.00E+00 0.00E+00 0.00E+00 0.00E+00 0.00E+00 0.00E+00 0.00E+00 0.00E+00 0.00E+00 0.00E+00 0.00E+00 0.00E+00
Heavy metal emission 0.00E+00 0.00E+00 0.00E+00 0.00E+00 0.00E+00 -1.49E+01 0.00E+00 -5.85E-04 -3.73E-03 -2.51E-04 -1.30E-04 0.00E+00 0.00E+00 0.00E+00 0.00E+00 0.00E+00 0.00E+00 0.00E+00
Total -4.42E+01 -2.76E-06 -3.62E-01 -9.31E-03 -1.16E-01 -2.36E+01 -9.26E-02 -8.19E-02 -8.42E-03 -3.07E-01 -3.07E-01 -2.28E+00 -6.07E-01 -1.22E+00 -5.81E-
03 -4.97E-01 -2.02E+00 -6.08E+00
Total environmental impact of the no
treatment scenario1.81E+01 -7.22E-07 4.94E+00 -3.90E-03 2.25E-01 1.95E+00 2.85E-02 6.39E-01 2.67E-01 -1.82E-
01 -1.70E-01 -1.32E+00 -3.70E-01 -5.55E-01 -1.73E-03 -4.59E-01 -1.21E+00 -2.01E+00
29
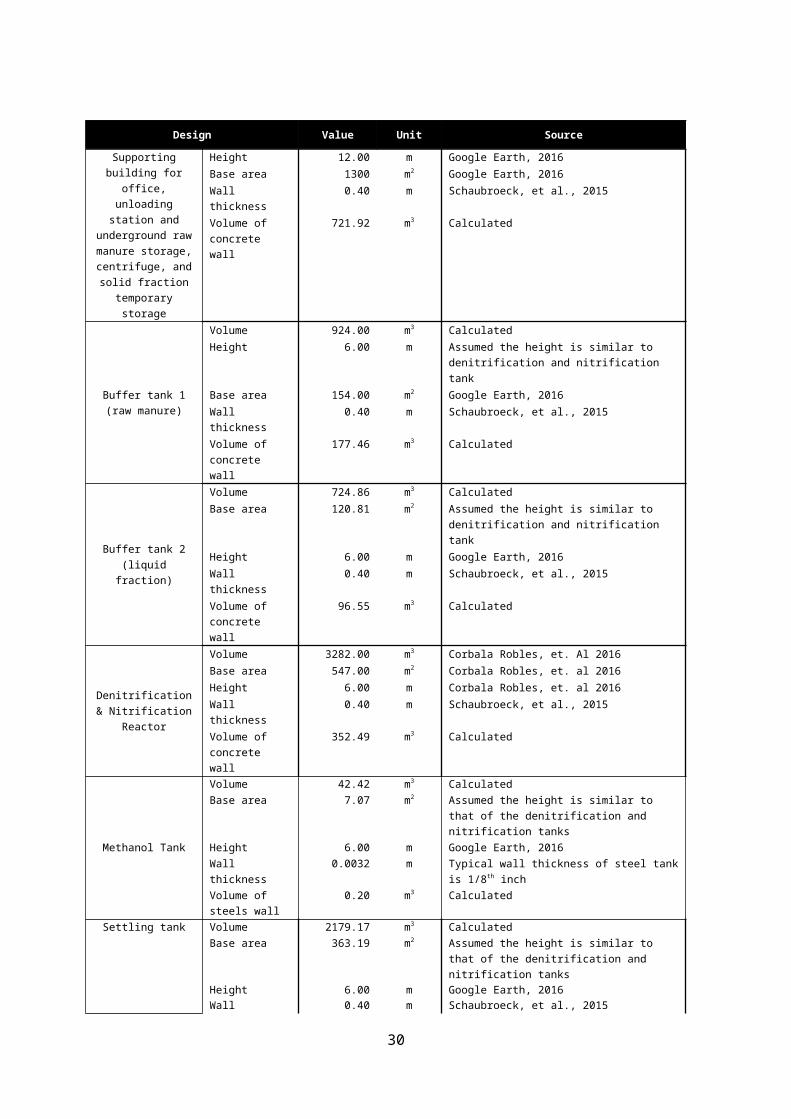
Table S5.3 Environmental impacts from the treatment of 1 m3 raw pig manure calculated at endpoint with the ReCiPe method (version 1.12) – the treatment scenario
Climate change
(DALY)
Ozone depletion (DALY)
Human toxicity (DALY)
Photochemical oxidant
formation (DALY)
Particulate matter
formation (DALY)
Ionising radiation (DALY)
Climate change
(species.yr)
Terrestrial acidification (species.yr)
Freshwater eutrophication
(species.yr)
Terrestrial ecotoxicity (species.yr)
Freshwater ecotoxicity (species.yr)
Marine ecotoxicity (species.yr)
Agricultural land
occupation (species.yr)
Urban land occupations (species.yr)
Natural land transformation
(species.yr)
Metal depletion
($)
Fossil depletion
($)
THE TREATMENT SCENARIOConstruction 1.01E-06 1.57E-10 5.55E-07 1.19E-10 4.88E-07 1.14E-09 5.70E-09 2.73E-11 1.70E-11 1.52E-11 2.59E-11 4.95E-12 1.01E-09 8.54E-10 1.81E-10 1.84E-02 2.37E-02
Manure Treatment Plant Operation
Transport to Treatment Plant 3.76E-06 1.31E-09 6.55E-07 8.24E-10 1.91E-06 3.69E-09 2.13E-08 8.29E-11 8.78E-12 2.28E-10 2.00E-11 5.40E-12 4.96E-10 3.83E-09 1.72E-09 7.65E-03 1.62E-01
Chemical Production & Transport
1.72E-06 6.81E-10 3.42E-07 2.36E-10 8.80E-07 1.36E-09 9.77E-09 7.61E-11 1.08E-11 3.78E-11 1.79E-11 1.99E-12 1.60E-10 2.61E-10 9.12E-10 5.21E-03 2.33E-01
Electricity: Manure Treatment Plant
7.25E-06 2.72E-09 7.43E-07 3.53E-10 1.23E-06 1.56E-07 4.11E-08 6.65E-11 3.65E-11 7.41E-11 5.89E-11 1.12E-11 1.16E-08 5.09E-10 8.32E-10 2.30E-02 2.78E-01
Emission: Biological Treatment
3.76E-06 0.00E+00 0.00E+00 0.00E+00 2.67E-07 0.00E+00 2.13E-08 4.56E-11 0.00E+00 0.00E+00 0.00E+00 0.00E+00 0.00E+00 0.00E+00 0.00E+00 0.00E+00 0.00E+00
Composting Operation 3.06E-06 1.12E-09 3.84E-07 3.15E-10 8.49E-07 4.59E-08 1.74E-08 4.06E-11 1.28E-11 8.04E-11 2.21E-11 4.62E-12 3.47E-09 1.14E-09 6.86E-10 8.60E-03 1.22E-01
Field Application of Effluent
Transport 8.35E-07 2.90E-10 1.45E-07 1.83E-10 4.23E-07 8.18E-10 4.73E-09 1.84E-11 1.95E-12 5.06E-11 4.45E-12 1.20E-12 1.10E-10 8.49E-10 3.82E-10 1.70E-03 3.59E-02
Spreading 9.26E-08 2.59E-11 1.13E-08 2.96E-11 6.29E-08 8.34E-11 5.25E-10 2.81E-12 4.52E-13 7.64E-13 3.57E-13 7.27E-14 2.78E-11 9.56E-12 3.24E-11 5.43E-04 3.37E-03
Emission: Effluent Spreading
3.29E-06 0.00E+00 0.00E+00 5.37E-11 9.57E-07 0.00E+00 1.86E-08 1.54E-10 0.00E+00 0.00E+00 0.00E+00 0.00E+00 0.00E+00 0.00E+00 0.00E+00 0.00E+00 0.00E+00
N & P Leaching 0.00E+00 0.00E+00 0.00E+00 0.00E+00 0.00E+00 0.00E+00 0.00E+00 0.00E+00 1.42E-11 0.00E+00 0.00E+00 0.00E+00 0.00E+00 0.00E+00 0.00E+00 0.00E+00 0.00E+00Heavy metal emission 0.00E+00 0.00E+00 7.63E-06 0.00E+00 0.00E+00 0.00E+00 0.00E+00 0.00E+00 0.00E+00 2.14E-08 1.17E-11 1.21E-12 0.00E+00 0.00E+00 0.00E+00 0.00E+00 0.00E+00
Total 4.21E-06 3.16E-10 7.79E-06 2.66E-10 1.44E-06 9.01E-10 2.39E-08 1.76E-10 1.66E-11 2.15E-08 1.65E-11 2.48E-12 1.38E-10 8.59E-10 4.14E-10 2.24E-03 3.92E-02
Field Application of Compost
Transport 2.08E-06 7.24E-10 3.63E-07 4.56E-10 1.05E-06 2.04E-09 1.18E-08 4.59E-11 4.86E-12 1.26E-10 1.11E-11 2.99E-12 2.75E-10 2.12E-09 9.53E-10 4.23E-03 8.94E-02
Spreading 2.26E-08 6.29E-12 2.75E-09 7.20E-12 1.53E-08 2.03E-11 1.28E-10 6.85E-13 1.10E-13 1.86E-13 8.70E-14 1.77E-14 6.77E-12 2.33E-12 7.89E-12 1.32E-04 8.21E-04
Cultivating 7.02E-08 1.70E-11 7.84E-09 1.99E-11 5.01E-08 6.23E-11 3.98E-10 1.94E-12 3.92E-13 4.01E-13 3.62E-13 7.36E-14 2.76E-11 9.79E-12 2.15E-11 7.71E-04 2.37E-03
Atmospheric Emission 2.16E-06 0.00E+00 0.00E+00 3.54E-11 7.84E-06 0.00E+00 1.23E-08 1.33E-09 0.00E+00 0.00E+00 0.00E+00 0.00E+00 0.00E+00 0.00E+00 0.00E+00 0.00E+00 0.00E+00
N & P Leaching 0.00E+00 0.00E+00 0.00E+00 0.00E+00 0.00E+00 0.00E+00 0.00E+00 0.00E+00 9.31E-11 0.00E+00 0.00E+00 0.00E+00 0.00E+00 0.00E+00 0.00E+00 0.00E+00 0.00E+00
Heavy Metal Deposition 0.00E+00 0.00E+00 5.09E-06 0.00E+00 0.00E+00 0.00E+00 0.00E+00 0.00E+00 0.00E+00 1.20E-08 6.38E-12 6.78E-13 0.00E+00 0.00E+00 0.00E+00 0.00E+00 0.00E+00
Total 4.34E-06 7.47E-10 5.47E-06 5.19E-10 8.96E-06 2.12E-09 2.46E-08 1.38E-09 9.85E-11 1.21E-08 1.79E-11 3.76E-12 3.09E-10 2.13E-09 9.82E-10 5.14E-03 9.26E-02
Total Field Application of
Organic Fertilizer
8.55E-06 1.06E-09 1.33E-05 7.85E-10 1.04E-05 3.02E-09 4.84E-08 1.56E-09 1.15E-10 3.36E-08 3.44E-11 6.24E-12 4.47E-10 2.99E-09 1.40E-09 7.38E-03 1.32E-01
Total Treatment Scenario Impact
without benefit2.91E-05 7.05E-09 1.59E-05 2.63E-09 1.60E-05 2.11E-07 1.65E-07 1.90E-09 2.01E-10 3.40E-08 1.79E-10 3.44E-11 1.72E-08 9.58E-09 5.73E-09 7.02E-02 9.49E-01
Avoided Synthetic Fertilizer from Effluent Application
Production -7.02E-06 -1.06E-09 -8.18E-07 -4.43E-10 -2.10E-06 -4.58E-09 -3.98E-08 -1.69E-10 -3.68E-11 -9.74E-11 -3.64E-11 -7.60E-12 -9.31E-10 -2.01E-09 -1.43E-09 -2.00E-02 -1.49E-01
Transport -1.59E-07 -4.09E-11 -3.08E-08 -3.23E-11 -7.75E-08 -4.69E-10 -9.03E-10 -3.72E-12 -1.65E-12 -3.93E-12 -1.04E-12 -2.25E-13 -5.40E-11 -1.25E-10 -5.44E-11 -8.61E-04 -5.78E-03
Spreading -1.50E-07 -4.20E-11 -1.84E-08 -4.80E-11 -1.02E-07 -1.35E-10 -8.52E-10 -4.57E-12 -7.34E-13 -1.24E-12 -5.80E-13 -1.18E-13 -4.51E-11 -1.55E-11 -5.26E-11 -8.82E-04 -5.48E-03
Atmospheric Emission -3.85E-06 0.00E+00 0.00E+00 -6.87E-11 -1.18E-06 0.00E+00 -2.18E-08 -1.90E-10 0.00E+00 0.00E+00 0.00E+00 0.00E+00 0.00E+00 0.00E+00 0.00E+00 0.00E+00 0.00E+00
Leaching 0.00E+00 0.00E+00 0.00E+00 0.00E+00 0.00E+00 0.00E+00 0.00E+00 0.00E+00 -3.71E-12 0.00E+00 0.00E+00 0.00E+00 0.00E+00 0.00E+00 0.00E+00 0.00E+00 0.00E+00Heavy metal emission 0.00E+00 0.00E+00 -8.15E-07 0.00E+00 0.00E+00 0.00E+00 0.00E+00 0.00E+00 0.00E+00 -5.77E-11 -2.09E-14 -2.26E-15 0.00E+00 0.00E+00 0.00E+00 0.00E+00 0.00E+00
Total -1.12E-05 -1.15E-09 -1.68E-06 -5.92E-10 -3.45E-06 -5.19E-09 -6.33E-08 -3.68E-10 -4.29E-11 -1.60E-10 -3.80E-11 -7.94E-12 -1.03E-09 -2.16E-09 -1.53E-09 -2.18E-02 -1.60E-01
Avoided Synthetic Fertilizer from Compost Application
Production -3.01E-06 -1.02E-09 -1.26E-06 -3.93E-10 -2.62E-06 -8.45E-09 -1.70E-08 -1.53E-10 -1.09E-10 -1.54E-10 -5.17E-11 -1.03E-11 -1.60E-09 -1.18E-08 -1.66E-09 -2.44E-02 -1.50E-01
30

Climate change
(DALY)
Ozone depletion (DALY)
Human toxicity (DALY)
Photochemical oxidant
formation (DALY)
Particulate matter
formation (DALY)
Ionising radiation (DALY)
Climate change
(species.yr)
Terrestrial acidification (species.yr)
Freshwater eutrophication
(species.yr)
Terrestrial ecotoxicity (species.yr)
Freshwater ecotoxicity (species.yr)
Marine ecotoxicity (species.yr)
Agricultural land
occupation (species.yr)
Urban land occupations (species.yr)
Natural land transformation
(species.yr)
Metal depletion
($)
Fossil depletion
($)Transport -1.50E-07 -3.84E-11 -2.90E-08 -3.03E-11 -7.29E-08 -4.40E-10 -8.49E-10 -3.50E-12 -1.55E-12 -3.69E-12 -9.80E-13 -2.11E-13 -5.08E-11 -1.17E-10 -5.11E-11 -8.09E-04 -5.43E-03
Spreading -4.63E-07 -1.29E-10 -5.65E-08 -1.48E-10 -3.15E-07 -4.17E-10 -2.62E-09 -1.41E-11 -2.26E-12 -3.82E-12 -1.79E-12 -3.63E-13 -1.39E-10 -4.78E-11 -1.62E-10 -2.71E-03 -1.69E-02
Atmospheric Emission -5.95E-07 0.00E+00 0.00E+00 -1.06E-11 -1.82E-07 0.00E+00 -3.37E-09 -2.94E-11 0.00E+00 0.00E+00 0.00E+00 0.00E+00 0.00E+00 0.00E+00 0.00E+00 0.00E+00 0.00E+00
Leaching 0.00E+00 0.00E+00 0.00E+00 0.00E+00 0.00E+00 0.00E+00 0.00E+00 0.00E+00 -2.33E-11 0.00E+00 0.00E+00 0.00E+00 0.00E+00 0.00E+00 0.00E+00 0.00E+00 0.00E+00Heavy metal emission 0.00E+00 0.00E+00 -5.17E-06 0.00E+00 0.00E+00 0.00E+00 0.00E+00 0.00E+00 0.00E+00 -2.69E-10 -1.07E-13 -1.14E-14 0.00E+00 0.00E+00 0.00E+00 0.00E+00 0.00E+00
Total -4.22E-06 -1.19E-09 -6.52E-06 -5.81E-10 -3.19E-06 -9.31E-09 -2.39E-08 -1.99E-10 -1.37E-10 -4.30E-10 -5.46E-11 -1.09E-11 -1.79E-09 -1.20E-08 -1.87E-09 -2.79E-02 -1.72E-01
Total Avoided Field
Application-1.54E-05 -2.34E-09 -8.20E-06 -1.17E-09 -6.64E-06 -1.45E-08 -8.72E-08 -5.67E-10 -1.79E-10 -5.90E-10 -9.26E-11 -1.89E-11 -2.82E-09 -1.41E-08 -3.41E-09 -4.97E-02 -3.32E-01
Total Environmental
Impact-Treatment
Scenario
1.37E-05 4.71E-09 7.73E-06 1.46E-09 9.38E-06 1.96E-07 -8.72E-08 -5.67E-10 -1.79E-10 -5.90E-10 -9.26E-11 -1.89E-11 -2.82E-09 -1.41E-08 -3.41E-09 -4.97E-02 -3.32E-01
Table S5.4 Environmental impacts from the treatment of 1 m3 raw pig manure calculated at endpoint with the ReCiPe method (version 1.12) – the no-treatment scenario
Climate change
(DALY)
Ozone depletion (DALY)
Human toxicity (DALY)
Photochemical oxidant formation (DALY)
Particulate matter
formation (DALY)
Ionising radiation (DALY)
Climate change
(species.yr)
Terrestrial acidificatio
n (species.yr)
Freshwater eutrophicati
on (species.yr)
Terrestrial ecotoxicity (species.yr)
Freshwater ecotoxicity (species.yr)
Marine ecotoxicity (species.yr)
Agricultural land
occupation (species.yr)
Urban land occupations (species.yr)
Natural land
transformation
(species.yr)
Metal depletion
($)
Fossil depletion
($)
THE NO TREATMENT SCENARIOEmissions: Raw Manure Storage 3.44E-05 0.00E+00 0.00E+00 3.26E-10 3.17E-05 0.00E+00 1.95E-07 1.80E-09 0.00E+00 0.00E+00 0.00E+00 0.00E+00 0.00E+00 0.00E+00 0.00E+00 0.00E+00 0.00E+00
Field Application of Raw Manure
Transport 1.32E-05 4.58E-09 2.29E-06 2.88E-09 6.67E-06 1.29E-08 7.46E-08 2.90E-10 3.07E-11 7.99E-10 7.02E-11 1.89E-11 1.74E-09 1.34E-08 6.03E-09 2.68E-02 5.66E-01
Spreading 7.63E-07 2.13E-10 9.31E-08 2.44E-10 5.18E-07 6.87E-10 4.32E-09 2.32E-11 3.72E-12 6.29E-12 2.94E-12 5.98E-13 2.29E-10 7.87E-11 2.67E-10 4.47E-03 2.78E-02
Cultivating 7.02E-08 1.70E-11 7.84E-09 1.99E-11 5.01E-08 6.23E-11 3.98E-10 1.94E-12 3.92E-13 4.01E-13 3.62E-13 7.36E-14 2.76E-11 9.79E-12 2.15E-11 7.71E-04 2.37E-03Atmospheric Emission 3.66E-05 0.00E+00 0.00E+00 5.99E-10 9.14E-05 0.00E+00 2.07E-07 5.19E-09 0.00E+00 0.00E+00 0.00E+00 0.00E+00 0.00E+00 0.00E+00 0.00E+00 0.00E+00 0.00E+00
N & P Leaching 0.00E+00 0.00E+00 0.00E+00 0.00E+00 0.00E+00 0.00E+00 0.00E+00 0.00E+00 1.93E-10 0.00E+00 0.00E+00 0.00E+00 0.00E+00 0.00E+00 0.00E+00 0.00E+00 0.00E+00
Heavy Metal Deposition 0.00E+00 0.00E+00 1.52E-05 0.00E+00 0.00E+00 0.00E+00 0.00E+00 0.00E+00 0.00E+00 4.06E-08 2.17E-11 2.30E-12 0.00E+00 0.00E+00 0.00E+00 0.00E+00 0.00E+00
Total 5.06E-05 4.81E-09 1.76E-05 3.75E-09 9.86E-05 1.37E-08 2.87E-07 5.50E-09 2.28E-10 4.14E-08 9.52E-11 2.19E-11 1.99E-09 1.35E-08 6.32E-09 3.20E-02 5.96E-01
Avoided Synthetic Fertilizer from Raw Manure Application
Production -4.02E-05 -6.68E-09 -5.86E-06 -2.79E-09 -1.41E-05 -3.53E-08 -2.28E-07 -1.06E-09 -3.55E-10 -6.89E-10 -2.56E-10 -5.27E-11 -6.97E-09 -2.49E-08 -9.30E-09 -1.35E-01 -9.48E-01
Transport -3.23E-07 -8.28E-11 -6.24E-08 -6.54E-11 -1.57E-07 -9.49E-10 -1.83E-09 -7.53E-12 -3.34E-12 -7.95E-12 -2.11E-12 -4.55E-13 -1.09E-10 -2.53E-10 -1.10E-10 -1.74E-03 -1.17E-02
Spreading -1.24E-06 -3.47E-10 -1.52E-07 -3.97E-10 -8.44E-07 -1.12E-09 -7.04E-09 -3.77E-11 -6.06E-12 -1.02E-11 -4.79E-12 -9.75E-13 -3.73E-10 -1.28E-10 -4.35E-10 -7.28E-03 -4.53E-02Atmospheric Emission
-2.01E-05 0.00E+00 0.00E+00 -3.59E-10 -6.17E-06 0.00E+00 -1.14E-07 -9.94E-10 0.00E+00 0.00E+00 0.00E+00 0.00E+00 0.00E+00 0.00E+00 0.00E+00 0.00E+00 0.00E+00
Leaching 0.00E+00 0.00E+00 0.00E+00 0.00E+00 0.00E+00 0.00E+00 0.00E+00 0.00E+00 -5.03E-11 0.00E+00 0.00E+00 0.00E+00 0.00E+00 0.00E+00 0.00E+00 0.00E+00 0.00E+00Heavy metal emission 0.00E+00 0.00E+00 -1.04E-05 0.00E+00 0.00E+00 0.00E+00 0.00E+00 0.00E+00 0.00E+00 -5.61E-10 -2.16E-13 -2.28E-14 0.00E+00 0.00E+00 0.00E+00 0.00E+00 0.00E+00
Total -6.19E-05 -7.11E-09 -1.65E-05 -3.61E-09 -2.13E-05 -3.73E-08 -3.51E-07 -2.10E-09 -4.14E-10 -1.27E-09 -2.63E-10 -5.42E-11 -7.45E-09 -2.53E-08 -9.85E-09 -1.44E-01 -1.01E+00Total
Environmental Impact-The no-
treatment
2.31E-05 -2.31E-09 1.11E-06 4.61E-10 1.09E-04 -2.37E-08 1.31E-07 5.20E-09 -1.87E-10 4.01E-08 -1.68E-10 -3.23E-11 -5.46E-09 -1.18E-08 -3.53E-09 -1.12E-01 -4.09E-01
31

Appendix F. Sensitivity background processes
Table S6.1 Reduction of midpoint damaging impacts* as a result of using renewable electricity or a more sustainable transportation system.
Reductions to midpoint impacts by changes to:
Label-certified electricity mix
EURO 6 transportation system
Climate change 31% 11%Ozone depletion 56% 12%Terrestrial acidification 4% 6%Freshwater eutrophication 21% 4%Marine eutrophication 47% 1%Human toxicity 5% 4%Photochemical oxidant formation 16% 48%Particulate matter formation 9% 15%Terrestrial ecotoxicity 0% 1%Freshwater ecotoxicity 7% 4%Marine ecotoxicity 9% 8%Ionising radiation 95% 1%Agricultural land occupation 65% 2%Urban land occupation 6% 3%Natural land transformation 30% 17%Water depletion -61% 6%Metal depletion 31% 10%Fossil depletion 37% 13%
*Highlighted: midpoint impacts not discussed in the manuscript according to the hotspot pinpointing analysis.
32
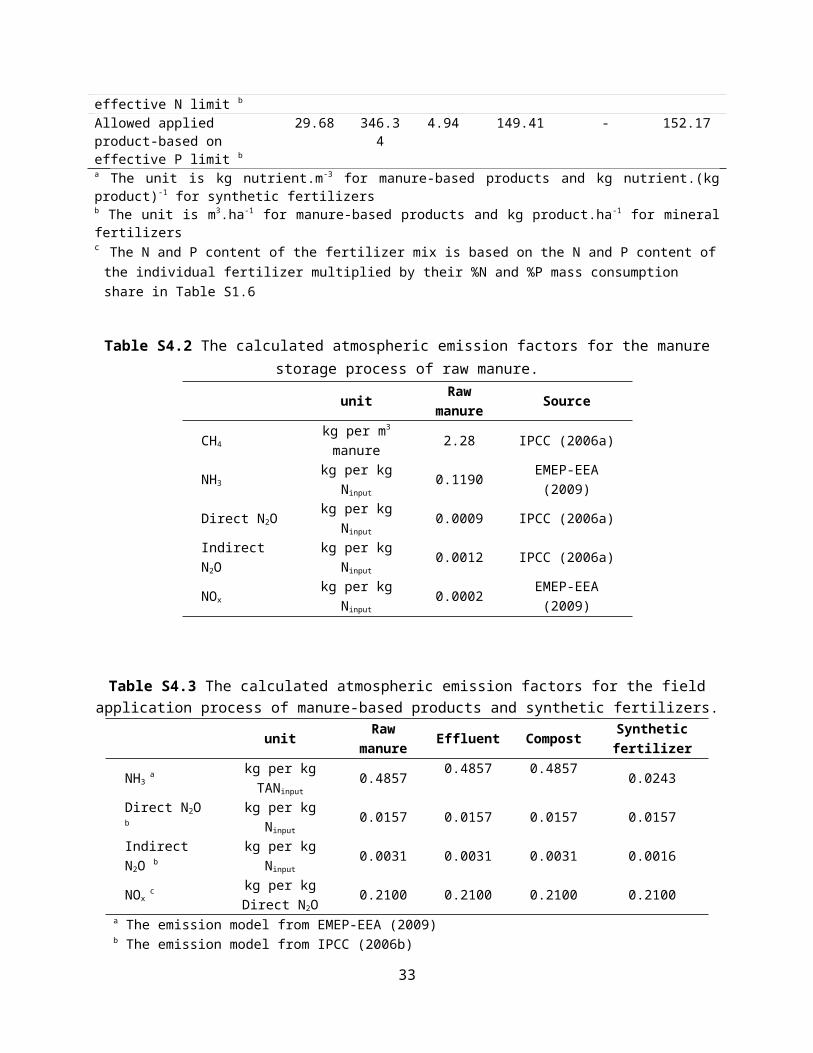
Appendix G. Mass balances (manure treatment process)
Figure S7.1. Mass balances (manure treatment process)
33
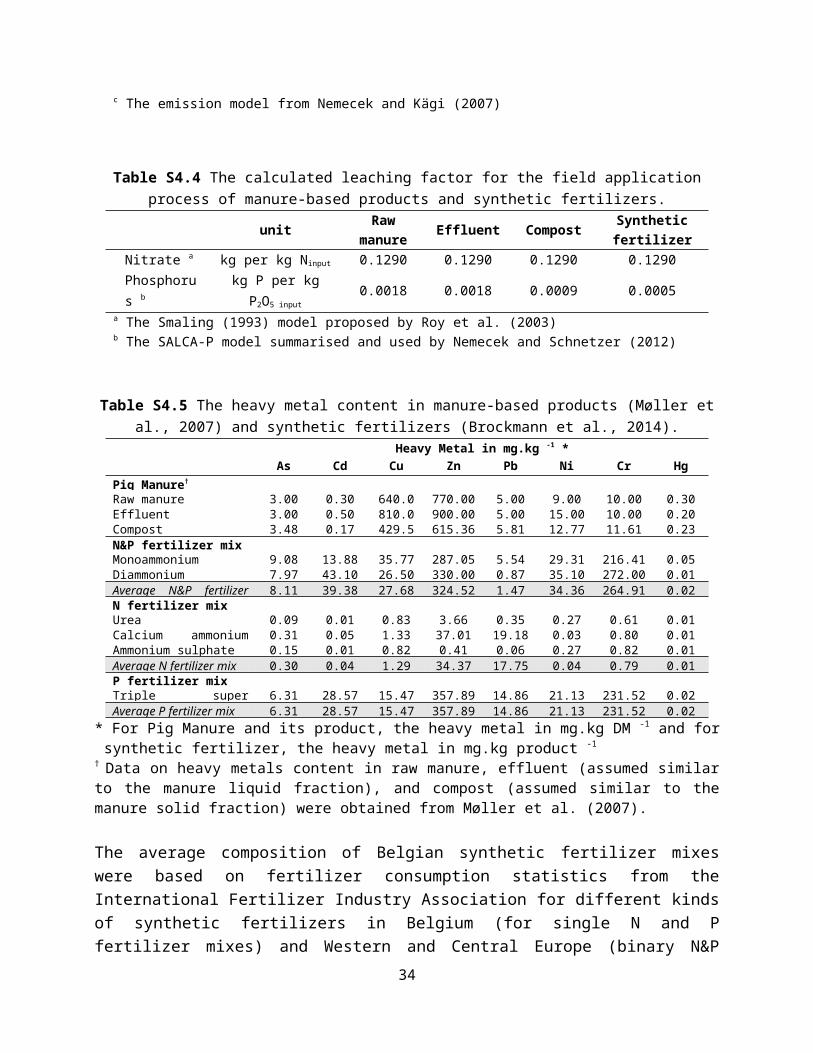
References
Backhurst, J. R., & Harker, J. H. (1974). Evaluation of physical properties of pig manure. Journal of Agricultural Engineering Research, 19(2), 199-207.
Boone, L., Van linden, V., De Meester, S., Vandecasteele, B., Muylle, H., Roldán-Ruiz, I., Nemecek, T., Dewulf, J. (2016). Environmental life cycle assessment of grain maize production: An analysis of factors causing variability. Science of the Total Environment, 553, 551-564. doi: 10.1016/j.scitotenv.2016.02.089
Brockmann, D., Hanhoun, M., Négri, O., & Hélias, A. (2014). Environmental assessment of nutrient recycling from biological pig slurry treatment – Impact of fertilizer substitution and field emissions. Bioresource Technology, 163, 270-279. doi:http://dx.doi.org/10.1016/j.biortech.2014.04.032
Chastain, J. P., Camberato, J. J., Albrecht, J. E., & Adams, J. (1999). Swine manure production and nutrient content. South Carolina Confined Animal Manure Managers Certification Program. Clemson University, SC, 1-17.
Corbala Robles, L., Volcke, E., Samijn, A., Ronsse, F., & Pieters, J. (2016). Effect of foam on temperature prediction and heat recovery potential from biological wastewater treatment. WATER RESEARCH, 95, 340–347.
De Clercq, L., Willeghems, G., Michels, E., Meers, E., & Buysse, J. (2015). The impact of concentrated pig production in Flanders: a spatial analysis. In 150th EAAE seminar: The spatial dimension in analysing the linkages between agriculture, rural development and the environment. European Association of Agricultural Economists (EAAE).
De Meester, S. (2013). Life Cycle Assessment in biorefineries: case studies and methodological development. PhD Thesis, Ghent University, Belgium.
De Neve, S., Van Den Bossche, A., Sleutel, S., & Hofman, G. (2006). Soil nutrient status of organic farms in Flanders: an overview and a comparison with the conventional situation. Biological agriculture & horticulture, 24(3), 217-235.
EMEP-EEA. (2009). EEA air pollutant emission inventory guidebook 2009 – Chapter 4.B Animal husbandry and manure management. European Environment Agency (EEA), Copenhagen.
Google Earth. (2016, February 28). V 7.1.5.1557. Mestverwerking Kerckaert, [map], 51° 04’ 14.93” N, 3° 17’ 07.26” E, Eye alt 231 km. Retrieved from http://www.earth.google.com.
Grönroos, J., Rankinen, K., Cano-Bernal, J. E. Larvus. L. and Alakukku, L. (2013). Life Cycle Inventory & Assessment Report:Source Separation of Dairy Cattle Manure, Finland, Denmark. Syddansk Universitet. Institut for kemi-, bio-og miljøteknologi.
International Fertilizer Industry Association-IFA (2016). Fertilizer production and trade statistics. [WWW Document]. URL http://ifadata.fertilizer.org/ucSearch.aspx
IPCC. (1996). Revised IPCC guidelines for national greenhouse gas inventories: reference manual.
IPCC. (2006a). 2006 IPCC Guidelines for National Greenhouse Gas Inventories. Chapter 10: Emissions from Livestock and Manure Management. http://www.ipcc-nggip.iges.or.jp/public/2006gl/pdf/4_Volume4/V4_10_Ch10_Livestock.pdf
34

IPCC. (2006b). 2006 IPCC Guidelines for National Greenhouse Gas Inventories. Chapter 11: N2O Emissions from Managed Soils, and CO2 Emissions from Lime and Urea Application. http://www.ipcc-nggip.iges.or.jp/public/2006gl/pdf/4_Volume4/V4_11_Ch11_N2O&CO2.pdf
Kayombo, S.; Mbwette, T.S.A.; Katima, J.H.Y.; Ladegaard, N.; Jorgensen, S.E. Waste Stabilization Ponds and Constructed Wetlands Design Manual; United Nations Environment Programme: Osaka, Japan, 2005.
Menon, S. (2004). Piping Calculations Manual. McGraw Hill Professional.
Møller, H. B., Sommer, S. G., & Ahring, B. K. (2002). Separation efficiency and particle size distribution in relation to manure type and storage conditions. Bioresource Technology, 85(2), 189-196.
Møller, H.B., Jensen, H.S., Tobiasen, L., Hansen, M.N. (2007). Heavy metal and phosphorus content of fractions from manure treatment and incineration. Environmental technology, 28(12), 1403-1418. doi: 10.1080/09593332808618900.
Nemecek T, Kägi T (2007): Life Cycle Inventory of Agricultural Production Systems. Data v 2.0. Dübendorf, Switzerland: Swiss Centre for Life Cycle Inventories; 2007.
Nemecek, T., Schnetzer, J., (2012). Methods of Assessment of Direct Field Emissions for LCIs of Agricultural Production Systems. Agroscope Reckenholz-Tänikon Research Station ART, Zurich, Switzerland.
Perry, R. and Green, D. (1999). Perry’s chemical engineers’ handbook. New York, McGraw Hill.
Remy, C. (2010). Life cycle assessment of conventional and source separation systems for urban wastewater management (Master's thesis, Technical University Berlin, Faculty III - Process Sciences). Technical University Berlin. http://dx.doi.org/10.14279/depositonce-2370
Roy, R.N., Misra, R.V., Lesschen, J.P., Smaling, E.M.A. (2003). Assessment of Soil Nutrient Balance – Approaches and Methodologies. FAO Fertilizer and Plant Nutrition Bulletin 14. Food and Agriculture Organization of the United Nations, Rome, Italy.
Schaubroeck, T., De Clippeleir, H., Weissenbacher, N., Dewulf, J., Boeckx, P., Vlaeminck, S. E., & Wett, B. (2015). Environmental sustainability of an energy self-sufficient sewage treatment plant: Improvements through DEMON and co-digestion. Water research, 74, 166-179.
Smaling, E.M.A. (1993). An agro-ecological framework for integrated nutrient management with special reference to Kenya. Wageningen, The Netherlands, Wageningen Agricultural University. (Ph.D. thesis)
Smet, E., Debruyne, J., Deckx, J., & Deboosere, S. (2003). Manure treatment according to the Trevi-concept. Communications in agricultural and applied biological sciences, 68(2; PART A), 125-132.Strous et al., 1998
Spellman, F. R. (2013). Handbook of water and wastewater treatment plant operations. CRC Press.
Tchobanoglous, G., Barton, F., Stensel, H., (2003). Wastewater Engineering Treatment and Reuse, fourth ed. Metcalf & Eddy, New York.
35
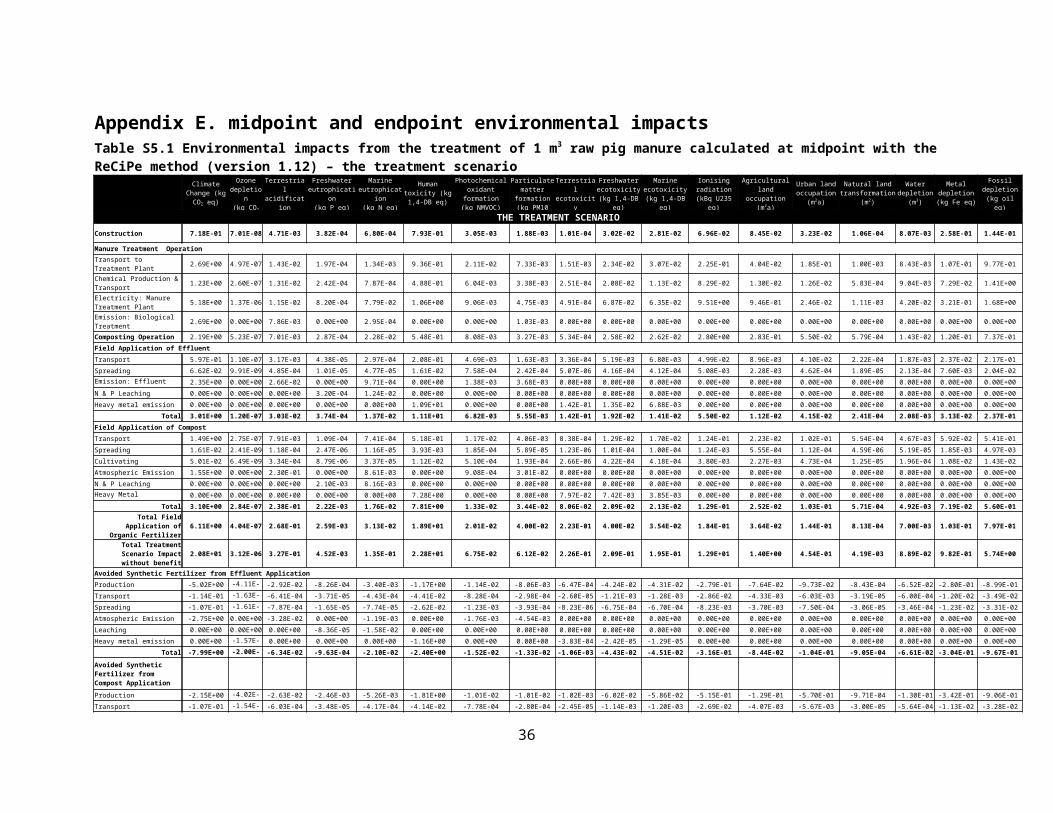
Vlaamse Land Maatschappij (VLM). (2016). Normen en richtwaarden 2016. Vlaamse Landmaatschappij. https://www.vlm.be/nl/SiteCollectionDocuments/Publicaties/mestbank/bemestingsnormen_2016.pdf
Wesnæs, M., Hamelin, L., & Wenzel, H. (2013). Life Cycle Inventory & Assessment Report: Separation of Digested Fattening Pig Slurry for Optimal P Concentration, Denmark. Syddansk Universitet. Institut for kemi-, bio-og miljøteknologi.
Zane Satterfield, P. E. (2013). Reading Centrifugal Pump Curves. The National Engineering Services Center.
36