Embed Size (px)
Citation preview
0
Supplementary Information for
Genomic analyses identify distinct patterns of selection
in domesticated pigs and Tibetan wild boars
Mingzhou Li1,2,13, Shilin Tian3,13, Long Jin1,13, Guangyu Zhou3,13, Ying Li1,13, Yuan
Zhang3,13, Tao Wang1, Carol KL Yeung3, Lei Chen4, Jideng Ma1, Jinbo Zhang3, Anan
Jiang1, Ji Li3, Chaowei Zhou1, Jie Zhang1, Yingkai Liu1, Xiaoqing Sun3, Hongwei Zhao3,
Zexiong Niu3, Pinger Lou1, Linjin Xian1, Xiaoyong Shen3, Shaoqing Liu3, Shunhua
Zhang1, Mingwang Zhang1, Li Zhu1, Surong Shuai1, Lin Bai1, Guoqing Tang1, Haifeng
Liu1, Yanzhi Jiang1, Miaomiao Mai1, Jian Xiao1, Xun Wang1, Qi Zhou5, Zhiquan Wang6,
Paul Stothard6, Ming Xue7, Xiaolian Gao8, Zonggang Luo9, Yiren Gu10, Hongmei Zhu3,
Xiaoxiang Hu11, Yaofeng Zhao11, Graham S. Plastow6, Jinyong Wang4, Zhi Jiang3, Kui
Li12, Ning Li11, Xuewei Li1 & Ruiqiang Li2,3
1 Institute of Animal Genetics and Breeding, College of Animal Science and Technology,
Sichuan Agricultural University, Ya’an, China.
2 Biodynamic Optical Imaging Center (BIOPIC), Peking-Tsinghua Center for Life Sciences,
and School of Life Sciences, Peking University, Beijing, China.
3 Novogene Bioinformatics Institute, Beijing, China.
4 Chongqing Academy of Animal Science, Chongqing, China.
5 Ya’an Vocational College, Ya’an, China.
6 Department of Agricultural, Food and Nutritional Science, University of Alberta, Edmonton,
Canada.
7 National Animal Husbandry Service, Ministry of Agriculture of China, Beijing, China. 8 Department of Biology and Biochemistry, University of Houston, Houston, USA.
9 Department of Animal Science, Southwest University at Rongchang, Chongqing, China.
10 Sichuan Animal Science Academy, Chengdu, China.
11 State Key Laboratory for Agrobiotechnology, College of Biological Sciences, National
Engineering Laboratory for Animal Breeding, China Agricultural University, Beijing, China.
12 Institute of Animal Science, Chinese Academy of Agricultural Sciences, Beijing, China.
13 These authors contributed equally to this work.
Correspondence should be addressed to X.L. (email: [email protected]) or to R.L.
(email: [email protected]).
Nature Genetics: doi:10.1038/ng.2811
1
Table of contents
Supplementary Figs. 1-36 ...................................................................................................... 5
Supplementary Fig. 1. The distribution areas of the original Tibetan wild boar in China. 5 Supplementary Fig. 2. Comparison of Tibetan wild boar and domestic Duroc pig. ......... 6 Supplementary Fig. 3. Synteny between the Tibetan wild boar and Duroc pig genomes. .......................................................................................................................................... 7 Supplementary Fig. 4. Distribution of 19-mer frequency. ................................................ 8 Supplementary Fig. 5. The GC content and CpG frequency for 10 kb, non-overlapping sliding windows across the Tibetan wild boar genome and five other mammalian genomes. .......................................................................................................................... 8 Supplementary Fig. 6. GC content against the sequencing depth of Tibetan wild boar genome. ............................................................................................................................ 9 Supplementary Fig. 7. Depth distribution of fraction bases. ............................................ 9 Supplementary Fig. 8. Distribution of heterozygosity density in the Tibetan wild boar diploid genome. ............................................................................................................... 10 Supplementary Fig. 9. Comparison of gene parameters among the Tibetan wild boar and five other mammalian genomes. .............................................................................. 10 Supplementary Fig. 10. Divergence distribution of classified families of transposable elements. ........................................................................................................................ 11 Supplementary Fig. 11. Length distribution of InDels in the Tibetan wild boar whole genome and in coding sequence (CDS) regions............................................................. 12 Supplementary Fig. 12. Orthology assignment of the Tibetan wild boar, Duroc pig and human genomes. ............................................................................................................ 13 Supplementary Fig. 13. Sequence depth distribution between single- and multi-copy genes in the Tibetan wild boar genome. ......................................................................... 14 Supplementary Fig. 14. Orthology delineation among the protein-coding gene family repertoires of the Tibetan wild boar and five other mammals. ......................................... 14 Supplementary Fig. 15. Venn diagrams showing the distribution of shared and unique gene families. .................................................................................................................. 15 Supplementary Fig. 16. Distribution of pairwise amino acid identity of orthologs between the Tibetan wild boar and five other mammals. ............................................................... 15 Supplementary Fig. 17. Venn diagram showing the distribution of olfactory-related gene repertoires among six mammals. .................................................................................... 16 Supplementary Fig. 18. Identification and comparison of olfactory receptor genes among six mammals using conserved olfactory receptor-specific motifs. ................................... 17 Supplementary Fig. 19. Phylogenetic analysis of the olfactory-related gene repertoires. ........................................................................................................................................ 18 Supplementary Fig. 20. Amino acid identity of olfactory-related genes between Duroc pig, Tibetan wild boar and four other mammals. ............................................................. 18 Supplementary Fig. 21. Average protein similarity of olfactory-related genes and total genes between Duroc pig, Tibetan wild boar and four other mammals. .......................... 19 Supplementary Fig. 22. Comparison of ω values between PSGs in Tibetan wild boar and Duroc pig. ....................................................................................................................... 20 Supplementary Fig. 23. Tibetan wild boar and Duroc pig KA/KS (ω) in functional gene categories. ...................................................................................................................... 21 Supplementary Fig. 24. PSGs in Tibetan wild boar involved in the pathway ‘mTOR
Nature Genetics: doi:10.1038/ng.2811
2
signaling’ and ‘vascular smooth muscle contraction’. ...................................................... 22 Supplementary Fig. 25. Comparison of the proportions of PSGs in Tibetan wild boar and Duroc pig. ....................................................................................................................... 23 Supplementary Fig. 26. PSGs in Duroc pig involved in the pathway of ‘extracellular matrix (ECM)-receptor interaction’. ................................................................................. 23 Supplementary Fig. 27. Inactivation events of six identified pseudogenes related to ‘response to drug’ in the Tibetan wild boar genome. ....................................................... 24 Supplementary Fig. 28. Genetic structure analysis for 103 sequenced individuals using FRAPPE with K = 2 to 9. ................................................................................................. 25 Supplementary Fig. 29. Genome-wide distribution of SNPs. ........................................ 26 Supplementary Fig. 30. Box plot of θπ ratio (θπ, domestic / θπ, Tibetan) and FST values for regions of Tibetan wild boars and Chinese domestic pigs that have undergone positive selection versus the whole genome. ............................................................................... 26 Supplementary Fig. 31. Distribution of selection statistics (Tajima’s D). ....................... 27 Supplementary Fig. 32. LD patterns between the selected regions and whole genome of Tibetan wild boars and Chinese domestic pigs. .............................................................. 28 Supplementary Fig. 33. Analysis of the phylogenetic relationship of Tibetan wild boars (n = 30) and neighboring domestic pigs (n = 15) using SNPs in regions with strong selective sweep signals. ................................................................................................................ 29 Supplementary Fig. 34. Genes embedded in naturally selected regions in Tibetan wild boars related to ‘vitamin B6 binding’ and ‘response to hypoxia’. ..................................... 30 Supplementary Fig. 35. Genes examined in the ‘saliva secretion’ functional category (GO-BP: 0046541) showed signatures of selective sweeps in Chinese domestic pigs. .. 31 Supplementary Fig. 36. Vacuum chewing (Domestic Duroc pig). ................................. 32
Supplementary Tables 1-8, 10-16, 18-22, 24-27 and 29-36 ................................................ 33
Supplementary Table 1. Genome sequencing strategy for the Tibetan wild boar.......... 33 Supplementary Table 2. Estimation of the Tibetan wild boar genome size using K-mer analysis. .......................................................................................................................... 34 Supplementary Table 3. Summary of the Tibetan wild boar genome assembly. ........... 34 Supplementary Table 4. Summary of mapping and coverage depth............................. 35 Supplementary Table 5. Transposon element families in the Tibetan wild boar genome based on various methods. ............................................................................................. 35 Supplementary Table 6. Transposon element families in the Tibetan wild boar genome based on homolog alignment. ......................................................................................... 36 Supplementary Table 7. Summary of InDels in the Tibetan wild boar genome. ............ 37 Supplementary Table 8. Summary of syntenic regions between the Tibetan wild boar and Duroc pig genomes. ................................................................................................. 37 Supplementary Table 10. Summary of non-coding RNA distribution and annotation in the Tibetan wild boar genome. .............................................................................................. 38 Supplementary Table 11. Characteristics of the Tibetan wild boar and Duroc pig genome assemblies. ..................................................................................................................... 39 Supplementary Table 12. Summary of RNA-seq mapping results ................................ 40 Supplementary Table 13. Summary of evidence for the EVidenceModeler (EVM) gene models in the Tibetan wild boar genome. ........................................................................ 41 Supplementary Table 14. Assessment of sequence coverage of the Tibetan wild boar
Nature Genetics: doi:10.1038/ng.2811
3
genome assembly using the CDS regions of the Duroc pig genome. ............................. 41 Supplementary Table 15. Summary of predicted protein-coding genes in the Tibetan wild boar genome compared with other representative mammalian genomes. ...................... 42 Supplementary Table 16. Number of Tibetan wild boar genes with functional classification by various methods. ................................................................................... 42 Supplementary Table 18. Functional gene categories enriched for the Tibetan wild boar- and Duroc pig-specific families. ...................................................................................... 43 Supplementary Table 19. Summary of gene families in six mammals. ......................... 44 Supplementary Table 20. Functional gene categories enriched for the Tibetan wild boar- and Duroc pig-specific expansion families. ..................................................................... 45 Supplementary Table 21. Positively selected genes (PSGs) identified in the Tibetan wild boar and Duroc pig genomes. ......................................................................................... 46 Supplementary Table 22. Functional gene categories enriched for the 215 PSGs in the Tibetan wild boar and 182 PSGs in the Duroc pig. .......................................................... 57 Supplementary Table 24. List of a priori functional candidate genes related to ‘response to hypoxia’, ‘response to UV’ and ‘energy metabolism’. .................................................. 59 Supplementary Table 25. Functional candidate genes related to ‘response to hypoxia’ under positive selection in the Tibetan wild boar (21 PSGs) and Duroc pig (1 PSG). ..... 61 Supplementary Table 26. Functional candidate genes related to ‘response to UV’ under positive selection in the Tibetan wild boar (6 PSGs). ...................................................... 63 Supplementary Table 27. Functional candidate genes related to ‘energy metabolism’ under positive selection in the Tibetan wild boar (17 PSGs) and Duroc pig (21 PSGs). . 64 Supplementary Table 29. Functional gene categories enriched for Tibetan wild boar pseudogenes. ................................................................................................................. 69 Supplementary Table 30. Drug response genes that that appear inactive in the Tibetan wild boar genome. ........................................................................................................... 70 Supplementary Table 31. Summary and mapping statistics of sampled pig populations/breeds. ......................................................................................................... 71 Supplementary Table 32. Summary and mapping statistics of the downloaded pig genome re-sequencing data. .......................................................................................... 73 Supplementary Table 33. Summary of SNP calling on a population-scale. .................. 76 Supplementary Table 34. Tracy-Widom (TW) statistics for the first ten eigenvalues from PCA analysis of pig breeds. ............................................................................................ 76 Supplementary Table 35. Summary of SNPs in Tibetan wild boars and Chinese domestic pigs. ................................................................................................................. 77 Supplementary Table 36. Functional gene categories enriched for genes affected by natural and artificial selection. ......................................................................................... 78
Supplementary Note ............................................................................................................ 80
1 De novo sequencing, assembly and annotation of Tibetan wild boar genome .... 80 1.1 Sequencing strategy and data generation ......................................................... 80 1.2 Sequence quality checking and filtering ............................................................. 80 1.3 Estimation of genome size using K-mer method ................................................ 80 1.4 De novo assembly ............................................................................................. 81 1.5 Detections of heterozygous SNPs and deletion or insertion polymorphisms (InDels) .................................................................................................................... 82
Nature Genetics: doi:10.1038/ng.2811
4
1.6 Repeat annotation.............................................................................................. 82 1.7 Structural annotation of genes ........................................................................... 83 1.8 Functional annotation of genes .......................................................................... 84 1.9 non-coding RNA (ncRNA) annotations ............................................................... 84
2 Lineage-specific genes ............................................................................................. 84 2.1 Gene family cluster and orthology relationships ................................................ 84 2.2 Evidence of transcription for the Tibetan wild boar-specific genes ..................... 85
3 Functional enrichment analyses for genes ............................................................. 85 4 Identification of pseudogenes .................................................................................. 86 5 Population-based re-sequencing and SNP calling.................................................. 86
5.1 Re-sequencing strategy and read mapping ....................................................... 86 5.2 SNP calling ........................................................................................................ 87
6 Demographic history reconstruction ....................................................................... 88 7 Linkage-disequilibrium (LD) analysis ...................................................................... 89
Supplementary URLs ........................................................................................................... 89
Supplementary References ................................................................................................. 90
Nature Genetics: doi:10.1038/ng.2811
5
Supplementary Figs. 1-36
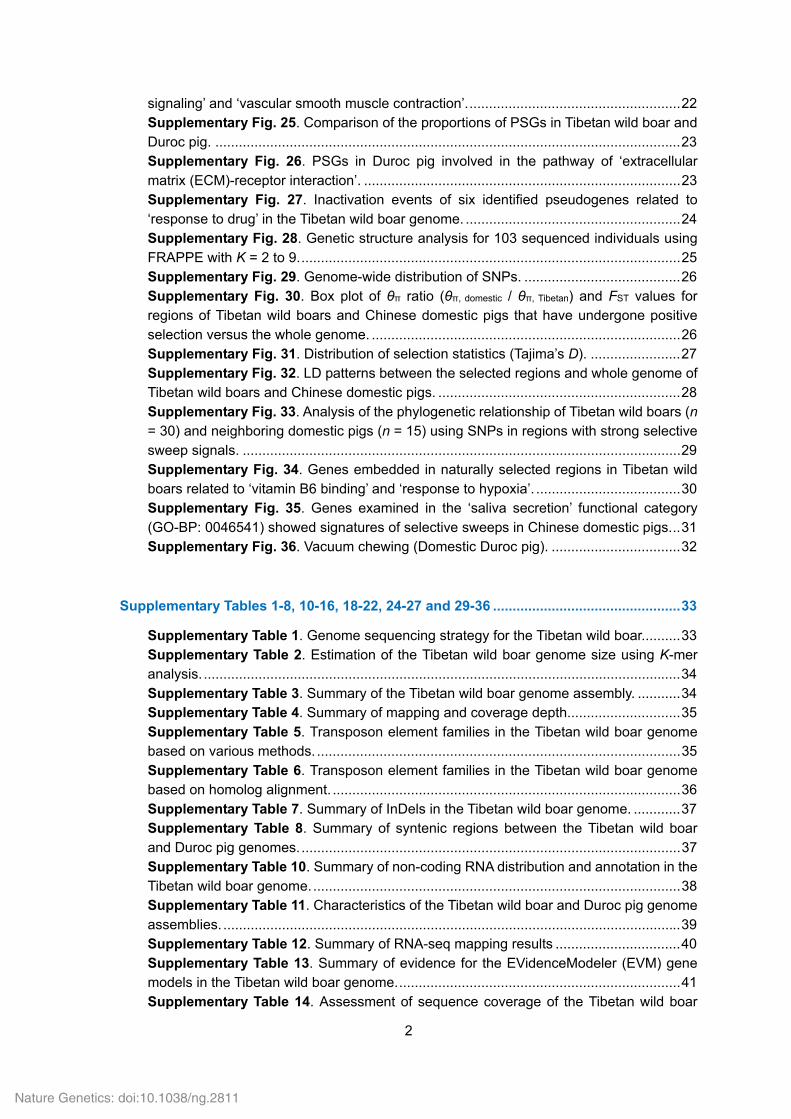
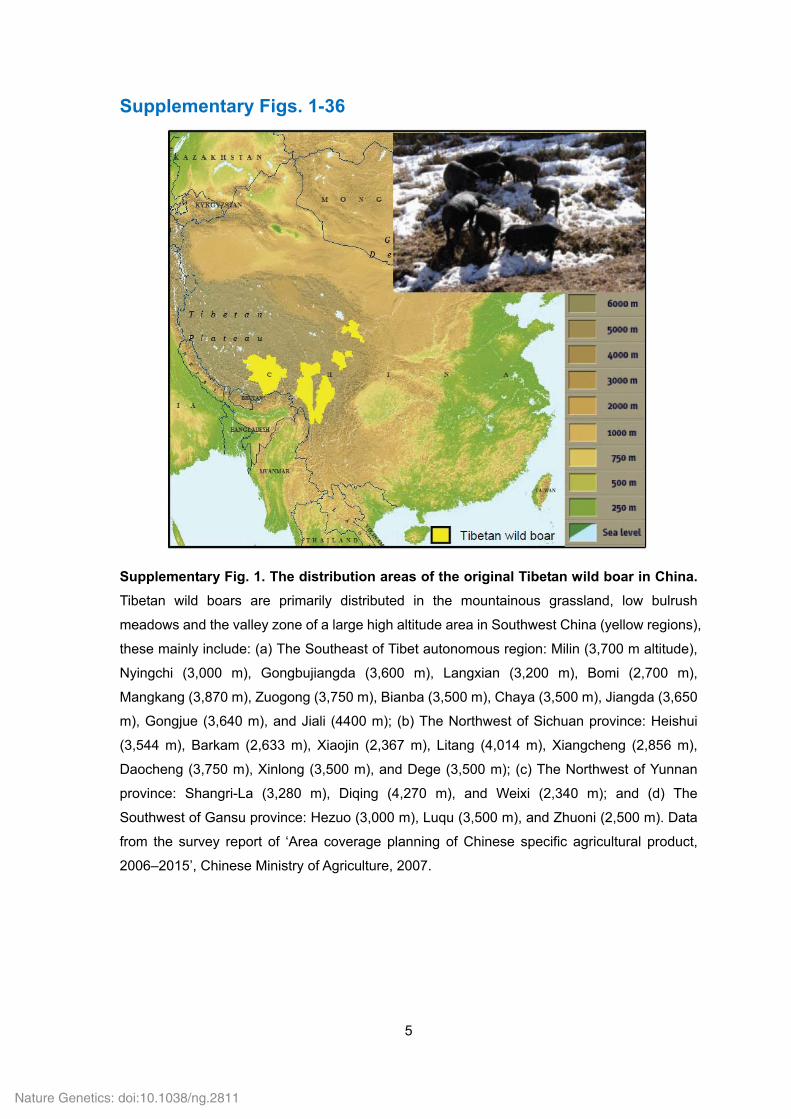
Supplementary Fig. 1. The distribution areas of the original Tibetan wild boar in China.
Tibetan wild boars are primarily distributed in the mountainous grassland, low bulrush
meadows and the valley zone of a large high altitude area in Southwest China (yellow regions),
these mainly include: (a) The Southeast of Tibet autonomous region: Milin (3,700 m altitude),
Nyingchi (3,000 m), Gongbujiangda (3,600 m), Langxian (3,200 m), Bomi (2,700 m),
Mangkang (3,870 m), Zuogong (3,750 m), Bianba (3,500 m), Chaya (3,500 m), Jiangda (3,650
m), Gongjue (3,640 m), and Jiali (4400 m); (b) The Northwest of Sichuan province: Heishui
(3,544 m), Barkam (2,633 m), Xiaojin (2,367 m), Litang (4,014 m), Xiangcheng (2,856 m),
Daocheng (3,750 m), Xinlong (3,500 m), and Dege (3,500 m); (c) The Northwest of Yunnan
province: Shangri-La (3,280 m), Diqing (4,270 m), and Weixi (2,340 m); and (d) The
Southwest of Gansu province: Hezuo (3,000 m), Luqu (3,500 m), and Zhuoni (2,500 m). Data
from the survey report of ‘Area coverage planning of Chinese specific agricultural product,
2006–2015’, Chinese Ministry of Agriculture, 2007.
Nature Genetics: doi:10.1038/ng.2811
6
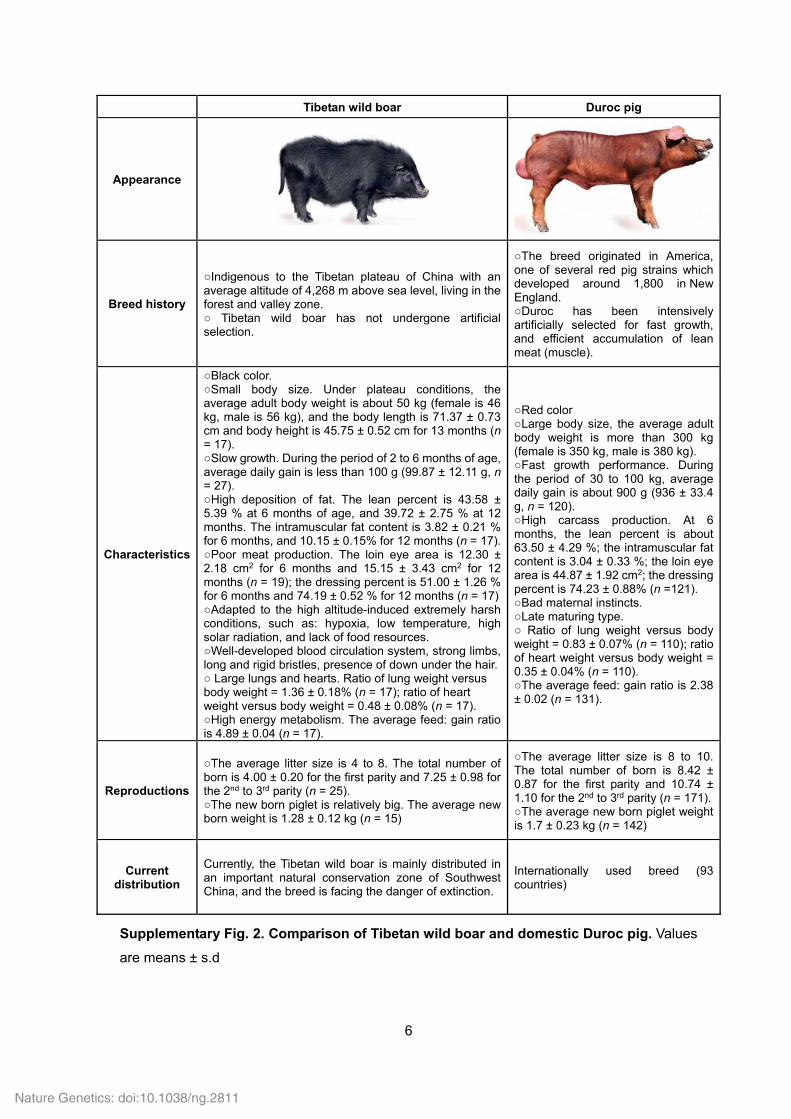
Tibetan wild boar Duroc pig
Appearance
Breed history
○Indigenous to the Tibetan plateau of China with an average altitude of 4,268 m above sea level, living in the forest and valley zone. ○ Tibetan wild boar has not undergone artificial selection.
○The breed originated in America, one of several red pig strains which developed around 1,800 in New England. ○Duroc has been intensively artificially selected for fast growth, and efficient accumulation of lean meat (muscle).
Characteristics
○Black color. ○Small body size. Under plateau conditions, the average adult body weight is about 50 kg (female is 46 kg, male is 56 kg), and the body length is 71.37 ± 0.73 cm and body height is 45.75 ± 0.52 cm for 13 months (n = 17). ○Slow growth. During the period of 2 to 6 months of age, average daily gain is less than 100 g (99.87 ± 12.11 g, n = 27). ○High deposition of fat. The lean percent is 43.58 ± 5.39 % at 6 months of age, and 39.72 ± 2.75 % at 12 months. The intramuscular fat content is 3.82 ± 0.21 % for 6 months, and 10.15 ± 0.15% for 12 months (n = 17).○Poor meat production. The loin eye area is 12.30 ± 2.18 cm2 for 6 months and 15.15 ± 3.43 cm2 for 12 months (n = 19); the dressing percent is 51.00 ± 1.26 % for 6 months and 74.19 ± 0.52 % for 12 months (n = 17)○Adapted to the high altitude-induced extremely harsh conditions, such as: hypoxia, low temperature, high solar radiation, and lack of food resources. ○Well-developed blood circulation system, strong limbs, long and rigid bristles, presence of down under the hair.○ Large lungs and hearts. Ratio of lung weight versus body weight = 1.36 ± 0.18% (n = 17); ratio of heart weight versus body weight = 0.48 ± 0.08% (n = 17). ○High energy metabolism. The average feed: gain ratio is 4.89 ± 0.04 (n = 17).
○Red color ○Large body size, the average adult body weight is more than 300 kg (female is 350 kg, male is 380 kg). ○Fast growth performance. During the period of 30 to 100 kg, average daily gain is about 900 g (936 ± 33.4 g, n = 120). ○High carcass production. At 6 months, the lean percent is about 63.50 ± 4.29 %; the intramuscular fat content is 3.04 ± 0.33 %; the loin eye area is 44.87 ± 1.92 cm2; the dressing percent is 74.23 ± 0.88% (n =121). ○Bad maternal instincts. ○Late maturing type. ○ Ratio of lung weight versus body weight = 0.83 ± 0.07% (n = 110); ratio of heart weight versus body weight = 0.35 ± 0.04% (n = 110). ○The average feed: gain ratio is 2.38 ± 0.02 (n = 131).
Reproductions
○The average litter size is 4 to 8. The total number of born is 4.00 ± 0.20 for the first parity and 7.25 ± 0.98 for the 2nd to 3rd parity (n = 25). ○The new born piglet is relatively big. The average new born weight is 1.28 ± 0.12 kg (n = 15)
○The average litter size is 8 to 10. The total number of born is 8.42 ± 0.87 for the first parity and 10.74 ± 1.10 for the 2nd to 3rd parity (n = 171).○The average new born piglet weight is 1.7 ± 0.23 kg (n = 142)
Current distribution
Currently, the Tibetan wild boar is mainly distributed in an important natural conservation zone of Southwest China, and the breed is facing the danger of extinction.
Internationally used breed (93 countries)
Supplementary Fig. 2. Comparison of Tibetan wild boar and domestic Duroc pig. Values
are means ± s.d
Nature Genetics: doi:10.1038/ng.2811
7
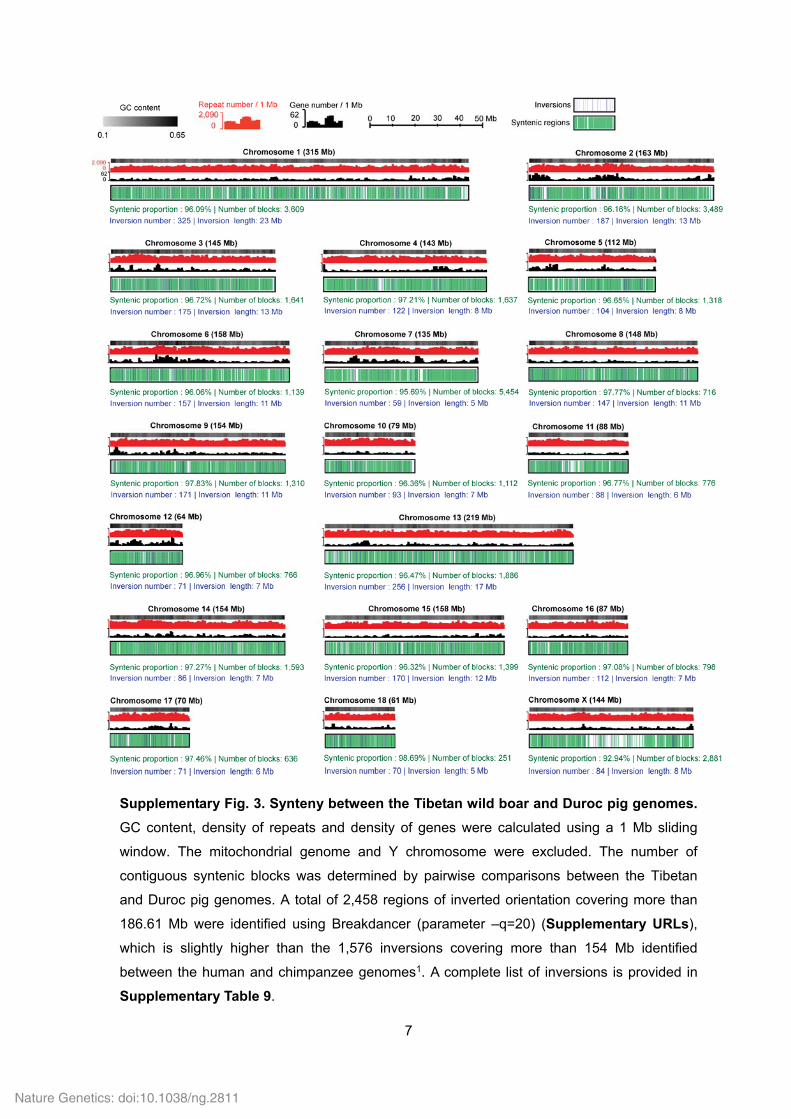
Supplementary Fig. 3. Synteny between the Tibetan wild boar and Duroc pig genomes.
GC content, density of repeats and density of genes were calculated using a 1 Mb sliding
window. The mitochondrial genome and Y chromosome were excluded. The number of
contiguous syntenic blocks was determined by pairwise comparisons between the Tibetan
and Duroc pig genomes. A total of 2,458 regions of inverted orientation covering more than
186.61 Mb were identified using Breakdancer (parameter –q=20) (Supplementary URLs),
which is slightly higher than the 1,576 inversions covering more than 154 Mb identified
between the human and chimpanzee genomes1. A complete list of inversions is provided in
Supplementary Table 9.
Nature Genetics: doi:10.1038/ng.2811
8
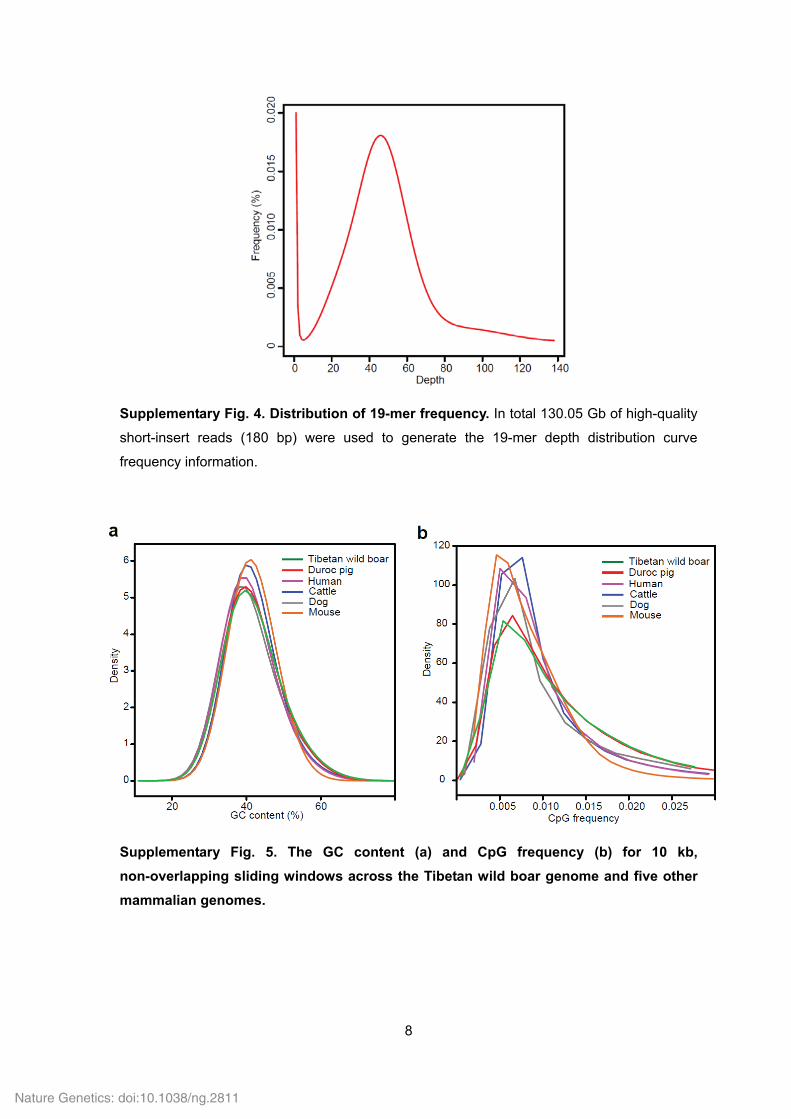
Supplementary Fig. 4. Distribution of 19-mer frequency. In total 130.05 Gb of high-quality
short-insert reads (180 bp) were used to generate the 19-mer depth distribution curve
frequency information.
Supplementary Fig. 5. The GC content (a) and CpG frequency (b) for 10 kb,
non-overlapping sliding windows across the Tibetan wild boar genome and five other
mammalian genomes.
Nature Genetics: doi:10.1038/ng.2811
9
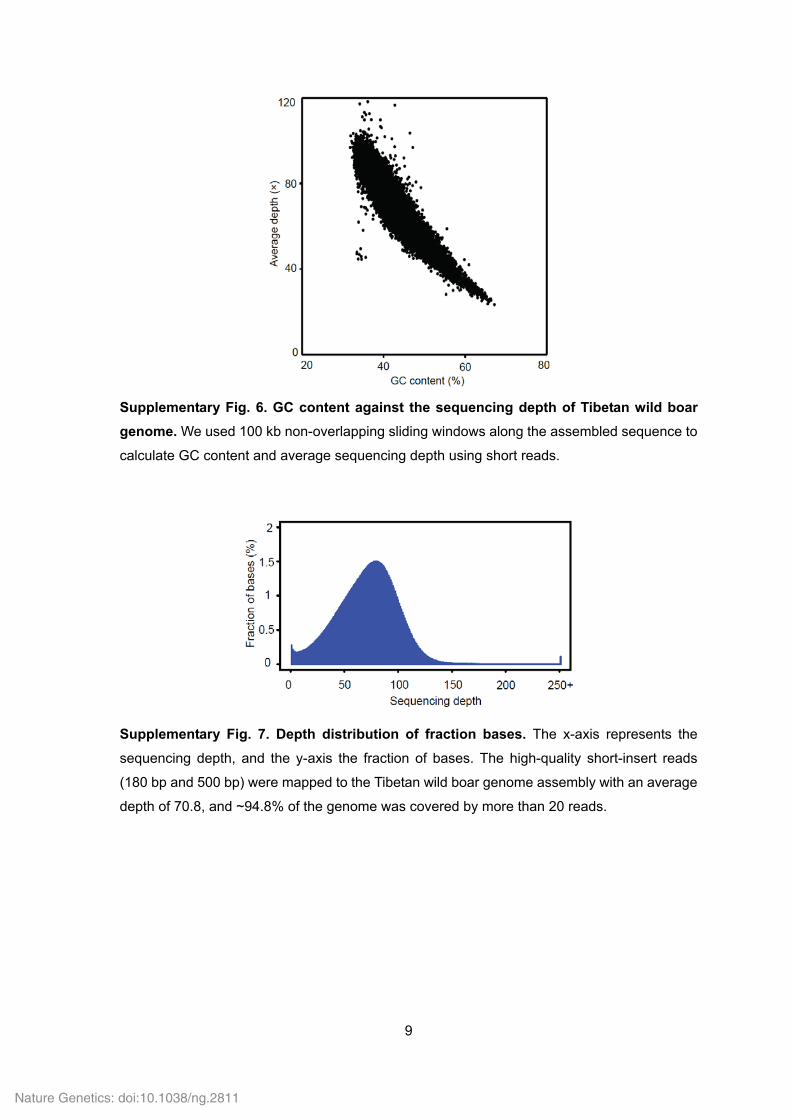
Supplementary Fig. 6. GC content against the sequencing depth of Tibetan wild boar
genome. We used 100 kb non-overlapping sliding windows along the assembled sequence to
calculate GC content and average sequencing depth using short reads.
Supplementary Fig. 7. Depth distribution of fraction bases. The x-axis represents the
sequencing depth, and the y-axis the fraction of bases. The high-quality short-insert reads
(180 bp and 500 bp) were mapped to the Tibetan wild boar genome assembly with an average
depth of 70.8, and ~94.8% of the genome was covered by more than 20 reads.
Nature Genetics: doi:10.1038/ng.2811
10
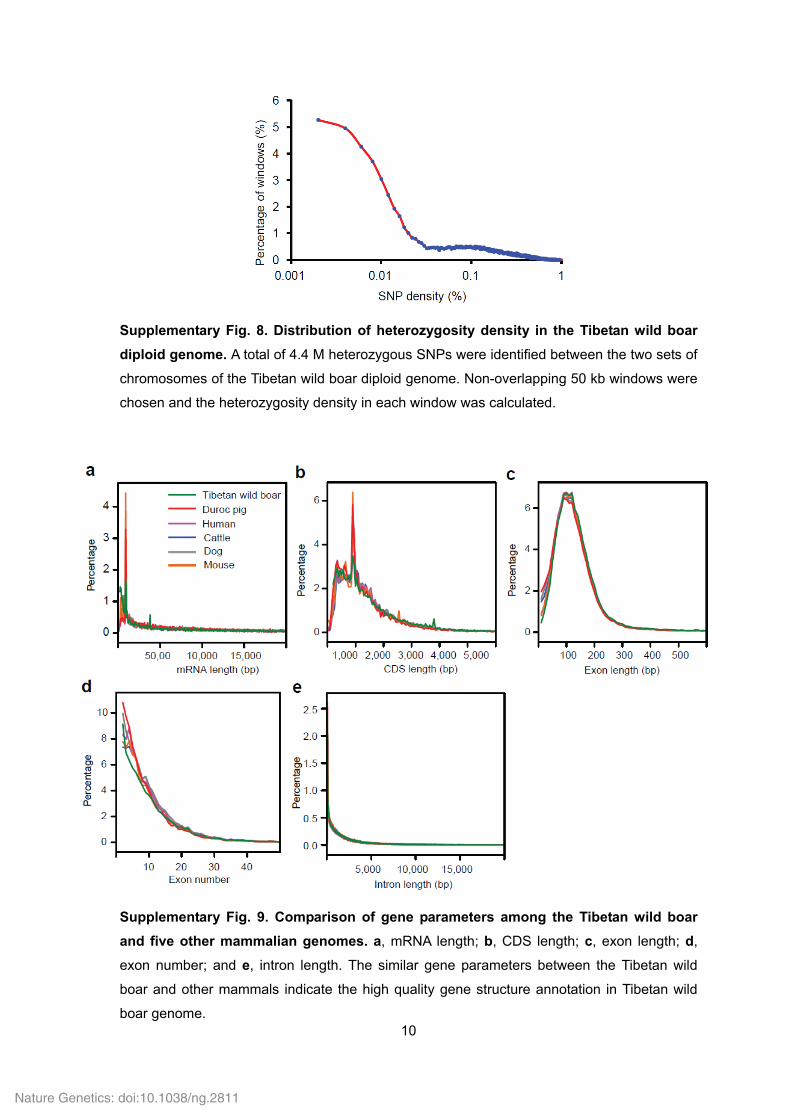
Supplementary Fig. 8. Distribution of heterozygosity density in the Tibetan wild boar
diploid genome. A total of 4.4 M heterozygous SNPs were identified between the two sets of
chromosomes of the Tibetan wild boar diploid genome. Non-overlapping 50 kb windows were
chosen and the heterozygosity density in each window was calculated.
Supplementary Fig. 9. Comparison of gene parameters among the Tibetan wild boar
and five other mammalian genomes. a, mRNA length; b, CDS length; c, exon length; d,
exon number; and e, intron length. The similar gene parameters between the Tibetan wild
boar and other mammals indicate the high quality gene structure annotation in Tibetan wild
boar genome.
Nature Genetics: doi:10.1038/ng.2811
11
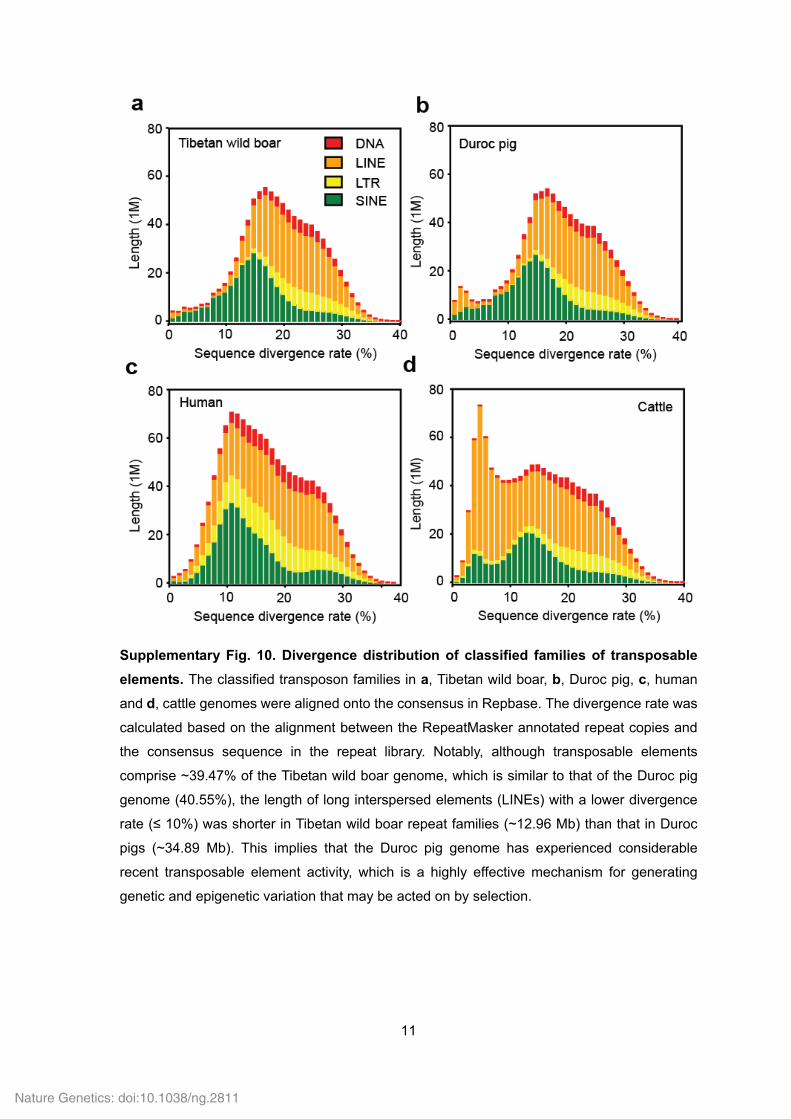
Supplementary Fig. 10. Divergence distribution of classified families of transposable
elements. The classified transposon families in a, Tibetan wild boar, b, Duroc pig, c, human
and d, cattle genomes were aligned onto the consensus in Repbase. The divergence rate was
calculated based on the alignment between the RepeatMasker annotated repeat copies and
the consensus sequence in the repeat library. Notably, although transposable elements
comprise ~39.47% of the Tibetan wild boar genome, which is similar to that of the Duroc pig
genome (40.55%), the length of long interspersed elements (LINEs) with a lower divergence
rate (≤ 10%) was shorter in Tibetan wild boar repeat families (~12.96 Mb) than that in Duroc
pigs (~34.89 Mb). This implies that the Duroc pig genome has experienced considerable
recent transposable element activity, which is a highly effective mechanism for generating
genetic and epigenetic variation that may be acted on by selection.
Nature Genetics: doi:10.1038/ng.2811
12
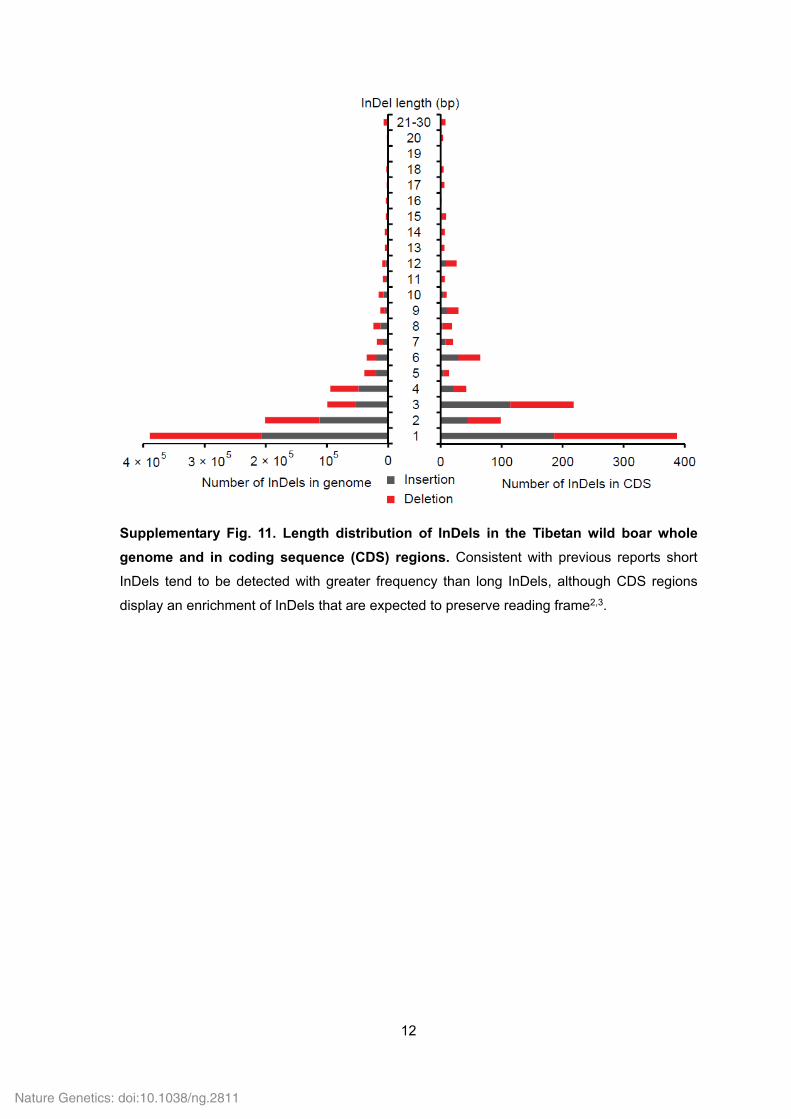
Supplementary Fig. 11. Length distribution of InDels in the Tibetan wild boar whole
genome and in coding sequence (CDS) regions. Consistent with previous reports short
InDels tend to be detected with greater frequency than long InDels, although CDS regions
display an enrichment of InDels that are expected to preserve reading frame2,3.
Nature Genetics: doi:10.1038/ng.2811
13
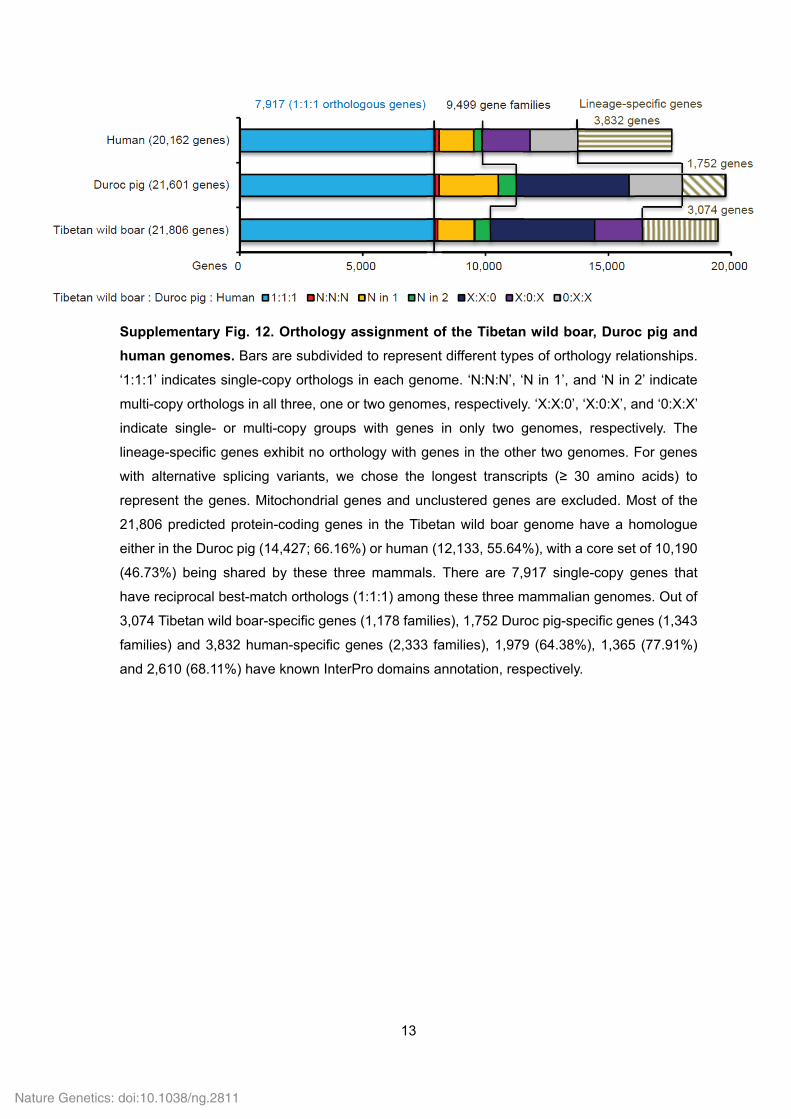
Supplementary Fig. 12. Orthology assignment of the Tibetan wild boar, Duroc pig and
human genomes. Bars are subdivided to represent different types of orthology relationships.
‘1:1:1’ indicates single-copy orthologs in each genome. ‘N:N:N’, ‘N in 1’, and ‘N in 2’ indicate
multi-copy orthologs in all three, one or two genomes, respectively. ‘X:X:0’, ‘X:0:X’, and ‘0:X:X’
indicate single- or multi-copy groups with genes in only two genomes, respectively. The
lineage-specific genes exhibit no orthology with genes in the other two genomes. For genes
with alternative splicing variants, we chose the longest transcripts (≥ 30 amino acids) to
represent the genes. Mitochondrial genes and unclustered genes are excluded. Most of the
21,806 predicted protein-coding genes in the Tibetan wild boar genome have a homologue
either in the Duroc pig (14,427; 66.16%) or human (12,133, 55.64%), with a core set of 10,190
(46.73%) being shared by these three mammals. There are 7,917 single-copy genes that
have reciprocal best-match orthologs (1:1:1) among these three mammalian genomes. Out of
3,074 Tibetan wild boar-specific genes (1,178 families), 1,752 Duroc pig-specific genes (1,343
families) and 3,832 human-specific genes (2,333 families), 1,979 (64.38%), 1,365 (77.91%)
and 2,610 (68.11%) have known InterPro domains annotation, respectively.
Nature Genetics: doi:10.1038/ng.2811
14
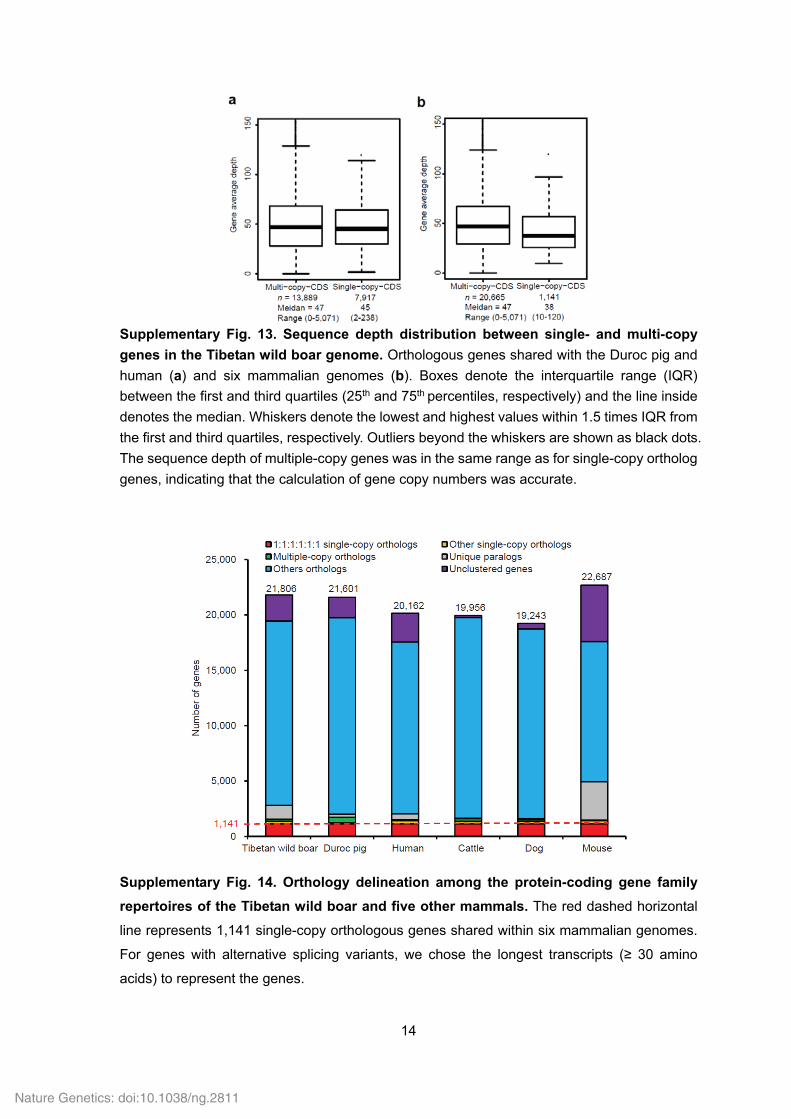
Supplementary Fig. 13. Sequence depth distribution between single- and multi-copy
genes in the Tibetan wild boar genome. Orthologous genes shared with the Duroc pig and
human (a) and six mammalian genomes (b). Boxes denote the interquartile range (IQR)
between the first and third quartiles (25th and 75th percentiles, respectively) and the line inside
denotes the median. Whiskers denote the lowest and highest values within 1.5 times IQR from
the first and third quartiles, respectively. Outliers beyond the whiskers are shown as black dots.
The sequence depth of multiple-copy genes was in the same range as for single-copy ortholog
genes, indicating that the calculation of gene copy numbers was accurate.
Supplementary Fig. 14. Orthology delineation among the protein-coding gene family
repertoires of the Tibetan wild boar and five other mammals. The red dashed horizontal
line represents 1,141 single-copy orthologous genes shared within six mammalian genomes.
For genes with alternative splicing variants, we chose the longest transcripts (≥ 30 amino
acids) to represent the genes.
Nature Genetics: doi:10.1038/ng.2811
15
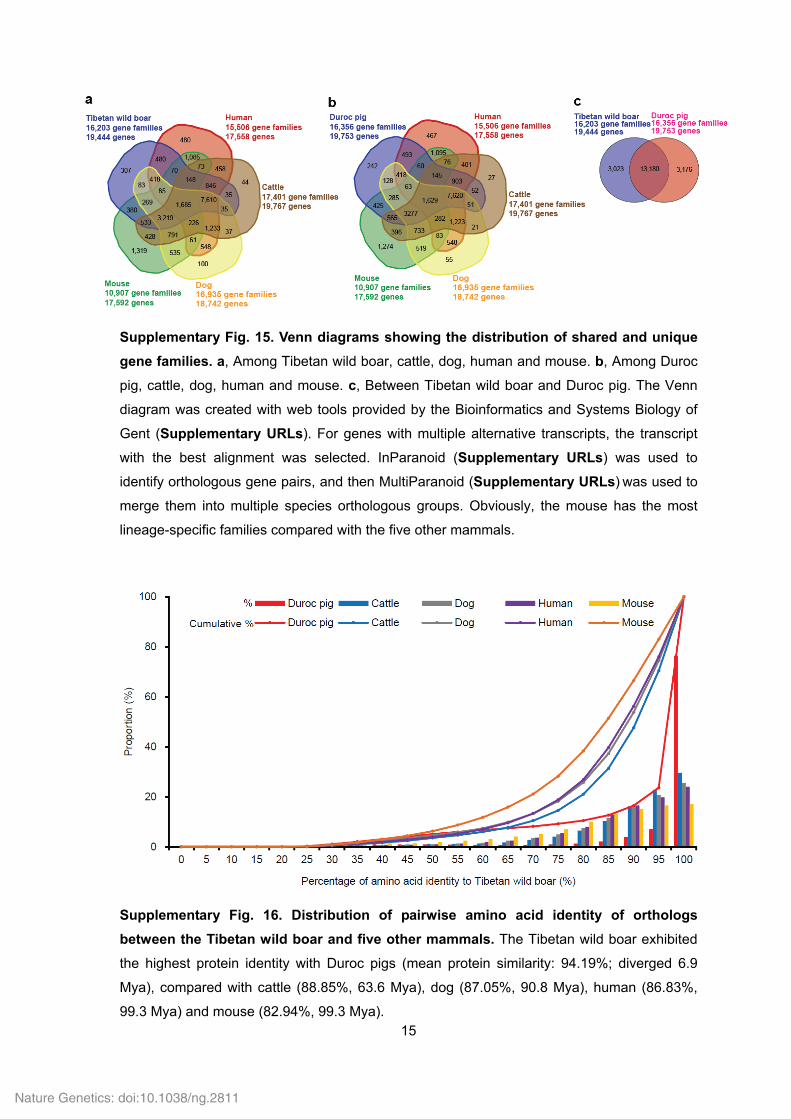
Supplementary Fig. 15. Venn diagrams showing the distribution of shared and unique
gene families. a, Among Tibetan wild boar, cattle, dog, human and mouse. b, Among Duroc
pig, cattle, dog, human and mouse. c, Between Tibetan wild boar and Duroc pig. The Venn
diagram was created with web tools provided by the Bioinformatics and Systems Biology of
Gent (Supplementary URLs). For genes with multiple alternative transcripts, the transcript
with the best alignment was selected. InParanoid (Supplementary URLs) was used to
identify orthologous gene pairs, and then MultiParanoid (Supplementary URLs) was used to
merge them into multiple species orthologous groups. Obviously, the mouse has the most
lineage-specific families compared with the five other mammals.
Supplementary Fig. 16. Distribution of pairwise amino acid identity of orthologs
between the Tibetan wild boar and five other mammals. The Tibetan wild boar exhibited
the highest protein identity with Duroc pigs (mean protein similarity: 94.19%; diverged 6.9
Mya), compared with cattle (88.85%, 63.6 Mya), dog (87.05%, 90.8 Mya), human (86.83%,
99.3 Mya) and mouse (82.94%, 99.3 Mya).
Nature Genetics: doi:10.1038/ng.2811
16
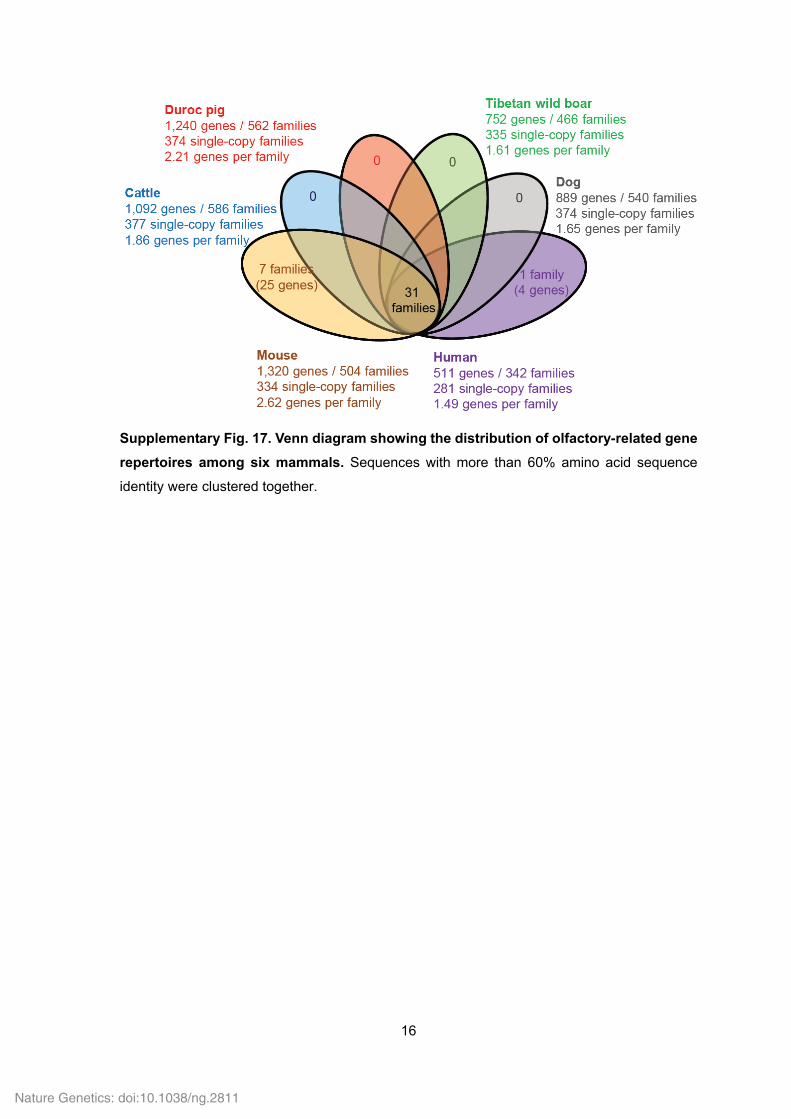
Supplementary Fig. 17. Venn diagram showing the distribution of olfactory-related gene
repertoires among six mammals. Sequences with more than 60% amino acid sequence
identity were clustered together.
Nature Genetics: doi:10.1038/ng.2811
17
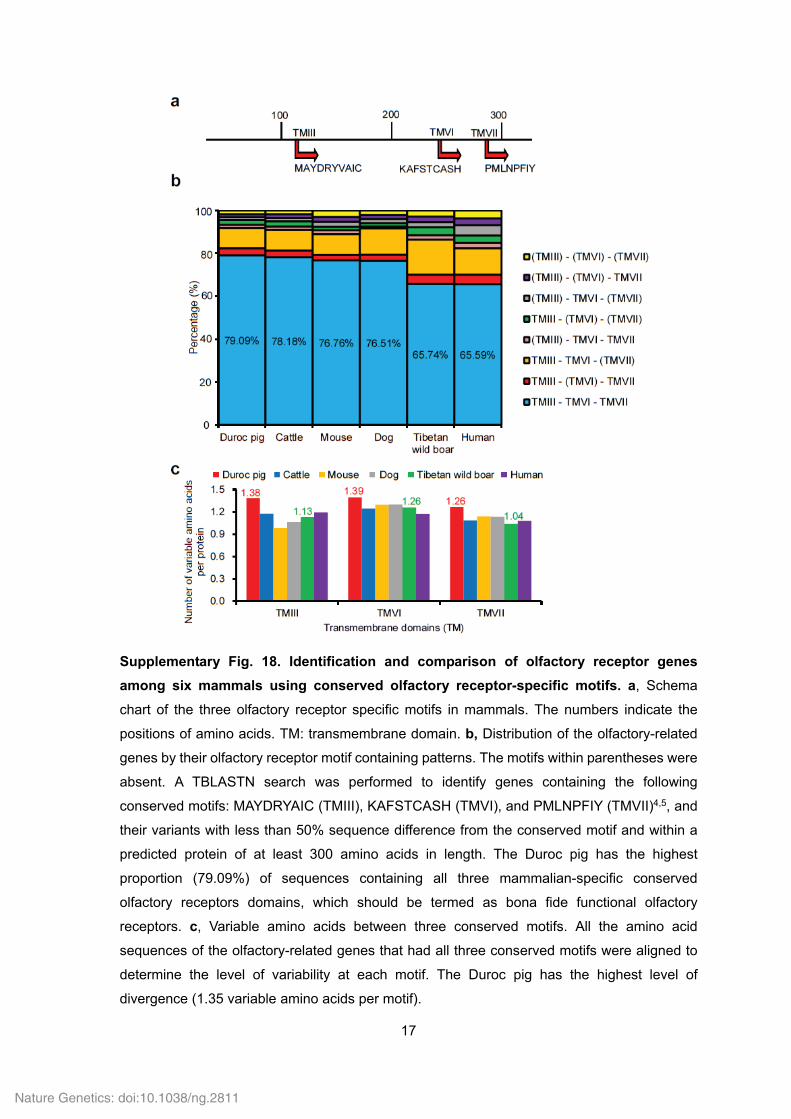
Supplementary Fig. 18. Identification and comparison of olfactory receptor genes
among six mammals using conserved olfactory receptor-specific motifs. a, Schema
chart of the three olfactory receptor specific motifs in mammals. The numbers indicate the
positions of amino acids. TM: transmembrane domain. b, Distribution of the olfactory-related
genes by their olfactory receptor motif containing patterns. The motifs within parentheses were
absent. A TBLASTN search was performed to identify genes containing the following
conserved motifs: MAYDRYAIC (TMIII), KAFSTCASH (TMVI), and PMLNPFIY (TMVII)4,5, and
their variants with less than 50% sequence difference from the conserved motif and within a
predicted protein of at least 300 amino acids in length. The Duroc pig has the highest
proportion (79.09%) of sequences containing all three mammalian-specific conserved
olfactory receptors domains, which should be termed as bona fide functional olfactory
receptors. c, Variable amino acids between three conserved motifs. All the amino acid
sequences of the olfactory-related genes that had all three conserved motifs were aligned to
determine the level of variability at each motif. The Duroc pig has the highest level of
divergence (1.35 variable amino acids per motif).
Nature Genetics: doi:10.1038/ng.2811
18
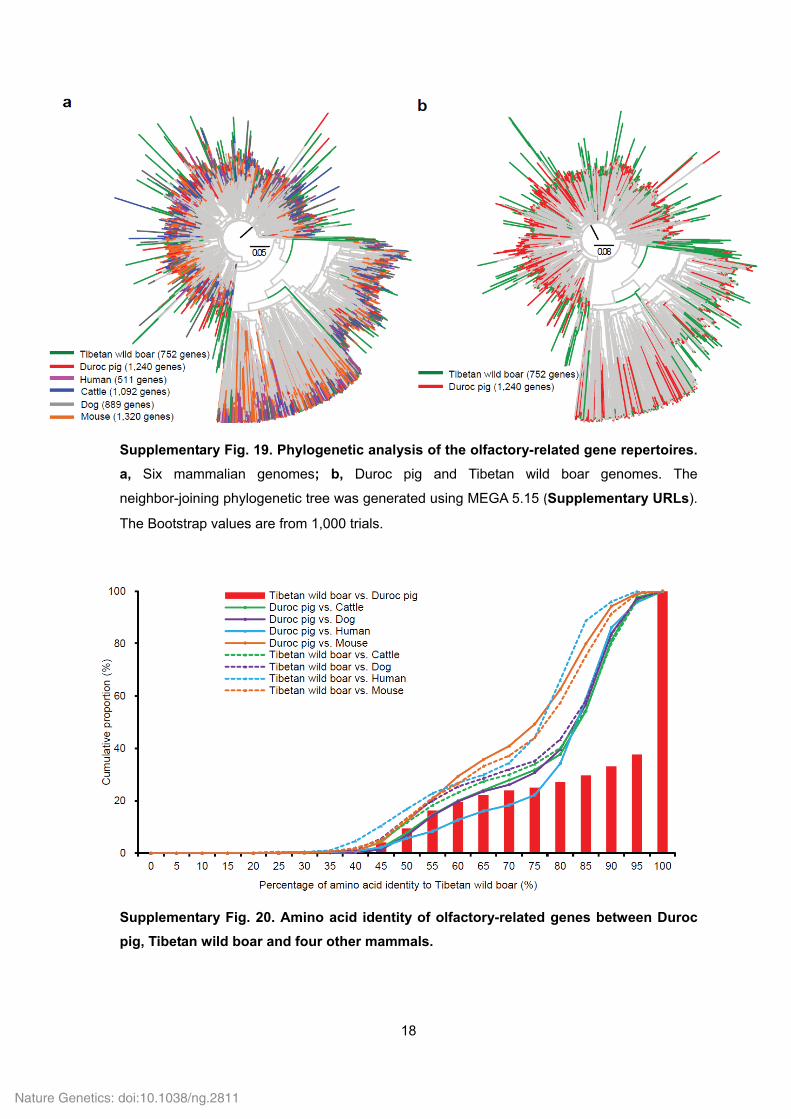
Supplementary Fig. 19. Phylogenetic analysis of the olfactory-related gene repertoires.
a, Six mammalian genomes; b, Duroc pig and Tibetan wild boar genomes. The
neighbor-joining phylogenetic tree was generated using MEGA 5.15 (Supplementary URLs).
The Bootstrap values are from 1,000 trials.
Supplementary Fig. 20. Amino acid identity of olfactory-related genes between Duroc
pig, Tibetan wild boar and four other mammals.
Nature Genetics: doi:10.1038/ng.2811
19
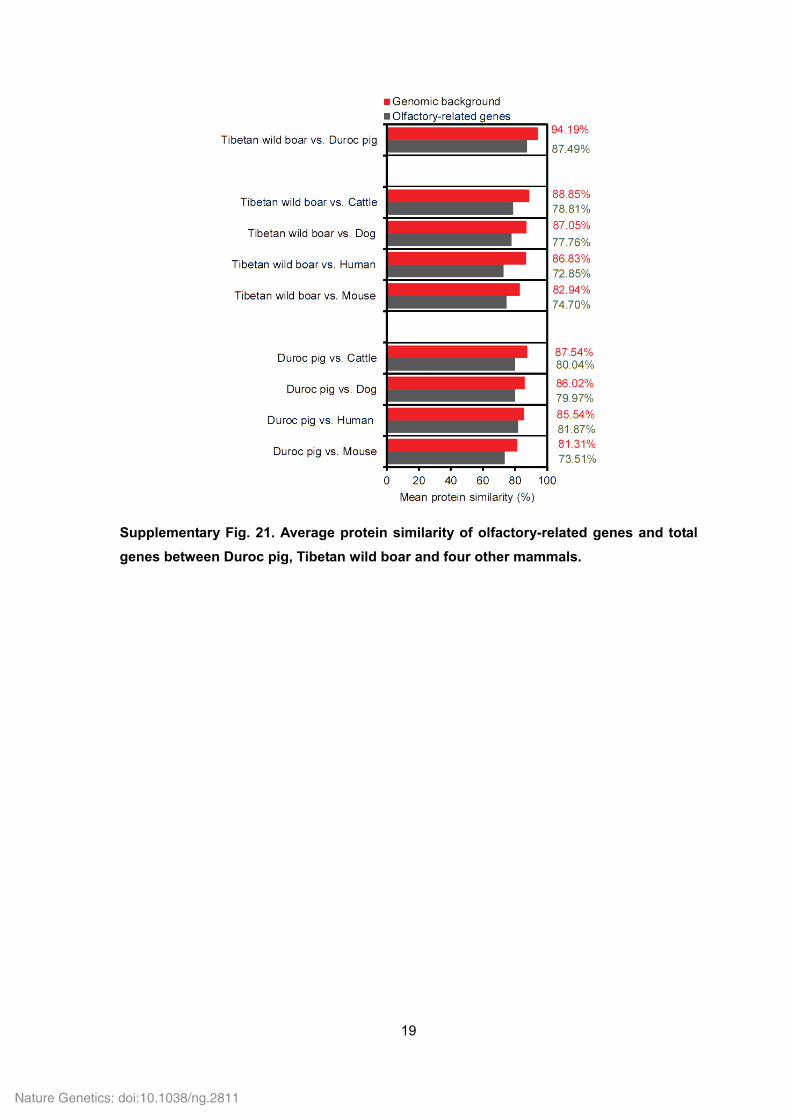
Supplementary Fig. 21. Average protein similarity of olfactory-related genes and total
genes between Duroc pig, Tibetan wild boar and four other mammals.
Nature Genetics: doi:10.1038/ng.2811
20
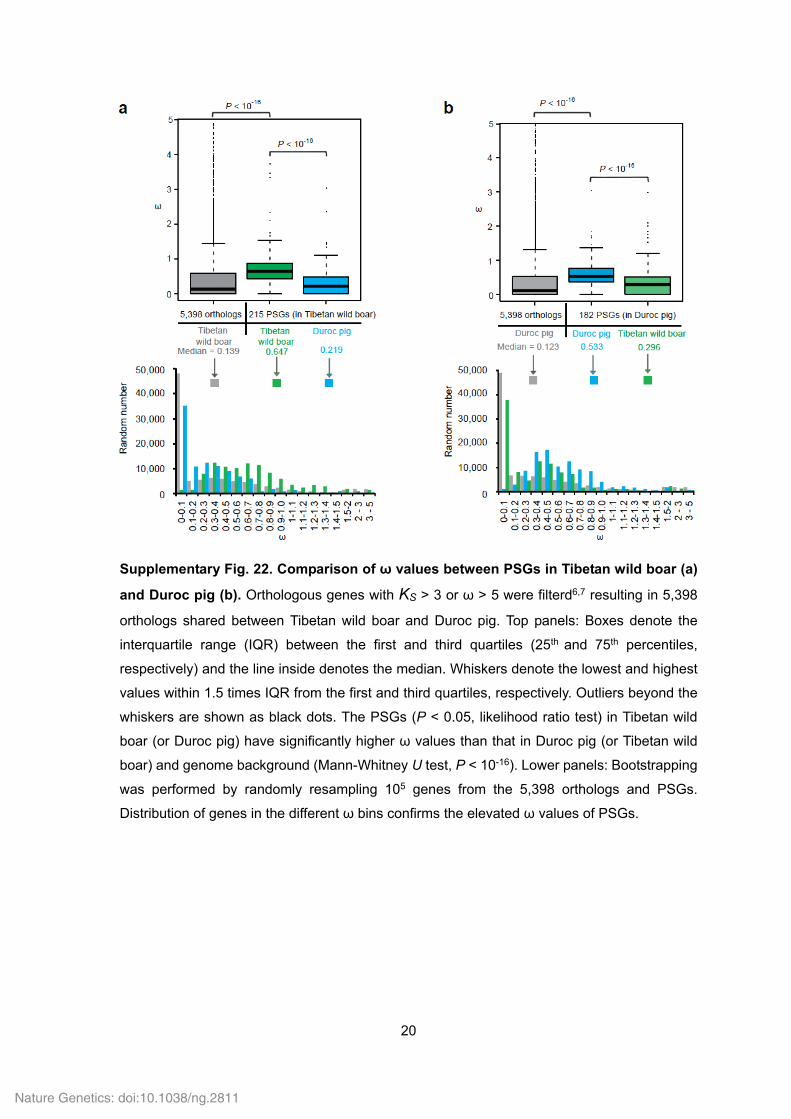
Supplementary Fig. 22. Comparison of ω values between PSGs in Tibetan wild boar (a)
and Duroc pig (b). Orthologous genes with KS > 3 or ω > 5 were filterd6,7 resulting in 5,398
orthologs shared between Tibetan wild boar and Duroc pig. Top panels: Boxes denote the
interquartile range (IQR) between the first and third quartiles (25th and 75th percentiles,
respectively) and the line inside denotes the median. Whiskers denote the lowest and highest
values within 1.5 times IQR from the first and third quartiles, respectively. Outliers beyond the
whiskers are shown as black dots. The PSGs (P < 0.05, likelihood ratio test) in Tibetan wild
boar (or Duroc pig) have significantly higher ω values than that in Duroc pig (or Tibetan wild
boar) and genome background (Mann-Whitney U test, P < 10-16). Lower panels: Bootstrapping
was performed by randomly resampling 105 genes from the 5,398 orthologs and PSGs.
Distribution of genes in the different ω bins confirms the elevated ω values of PSGs.
Nature Genetics: doi:10.1038/ng.2811
21
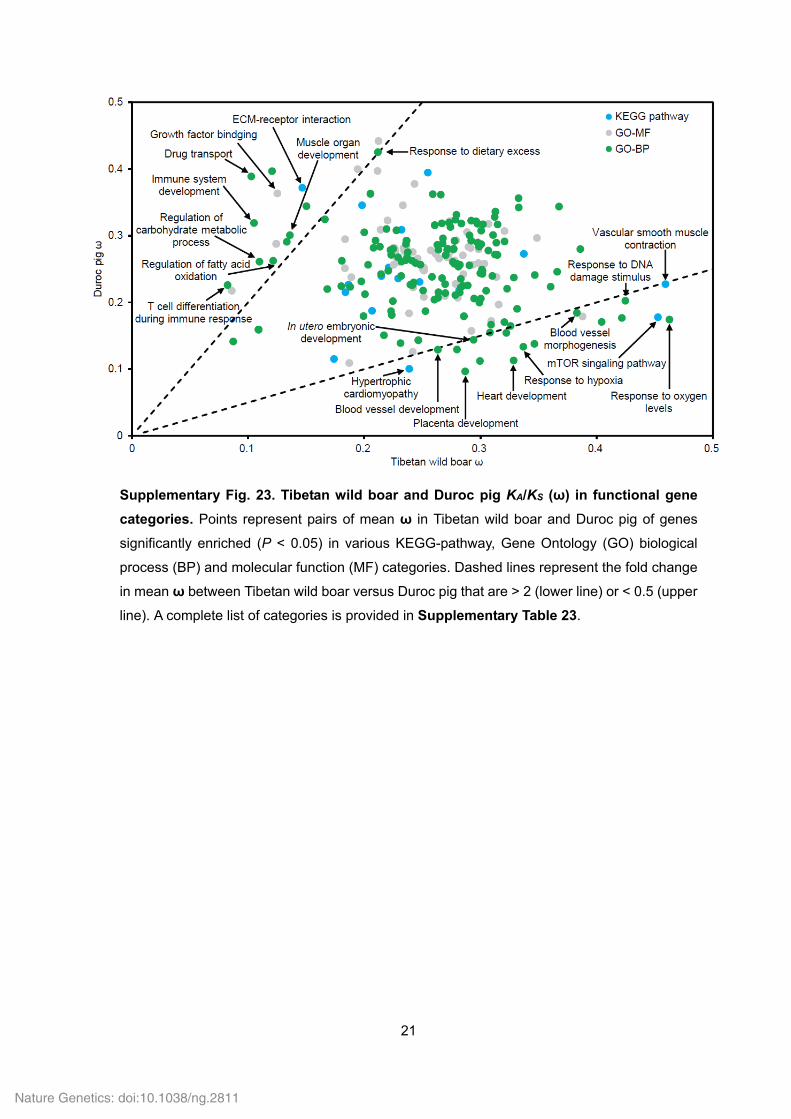
Supplementary Fig. 23. Tibetan wild boar and Duroc pig KA/KS (ω) in functional gene
categories. Points represent pairs of mean ω in Tibetan wild boar and Duroc pig of genes
significantly enriched (P < 0.05) in various KEGG-pathway, Gene Ontology (GO) biological
process (BP) and molecular function (MF) categories. Dashed lines represent the fold change
in mean ω between Tibetan wild boar versus Duroc pig that are > 2 (lower line) or < 0.5 (upper
line). A complete list of categories is provided in Supplementary Table 23.
Nature Genetics: doi:10.1038/ng.2811
22
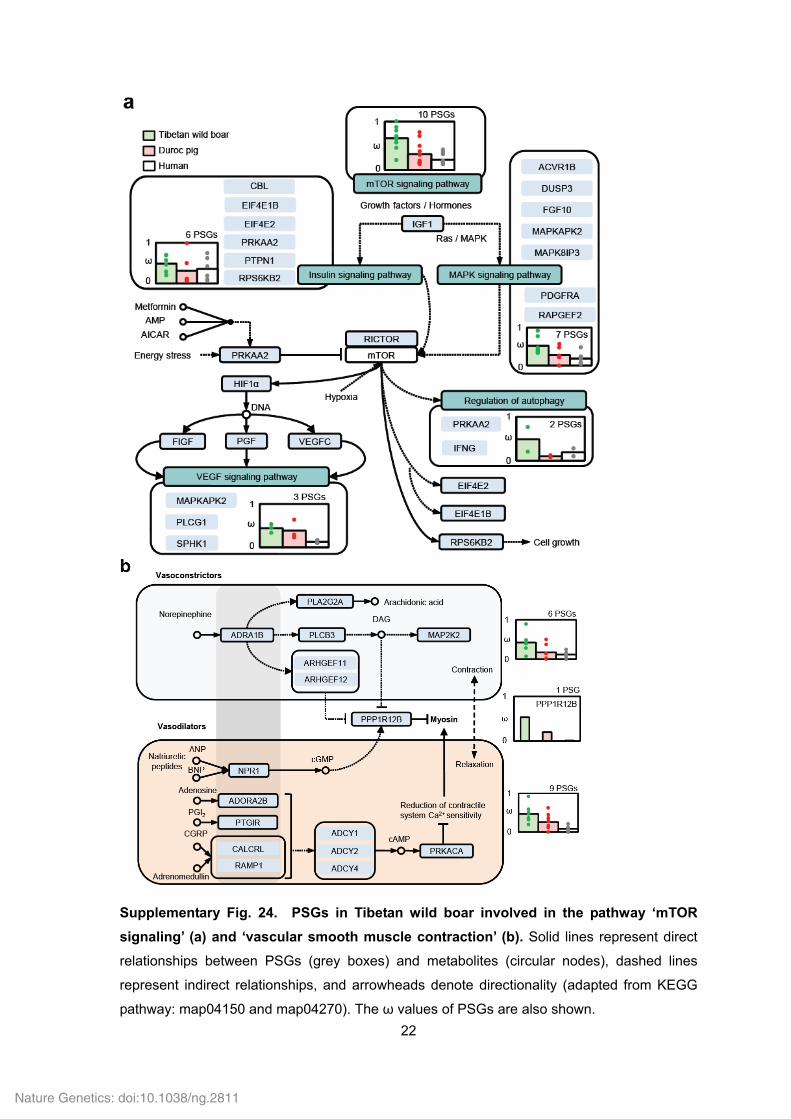
Supplementary Fig. 24. PSGs in Tibetan wild boar involved in the pathway ‘mTOR
signaling’ (a) and ‘vascular smooth muscle contraction’ (b). Solid lines represent direct
relationships between PSGs (grey boxes) and metabolites (circular nodes), dashed lines
represent indirect relationships, and arrowheads denote directionality (adapted from KEGG
pathway: map04150 and map04270). The ω values of PSGs are also shown.
Nature Genetics: doi:10.1038/ng.2811
23
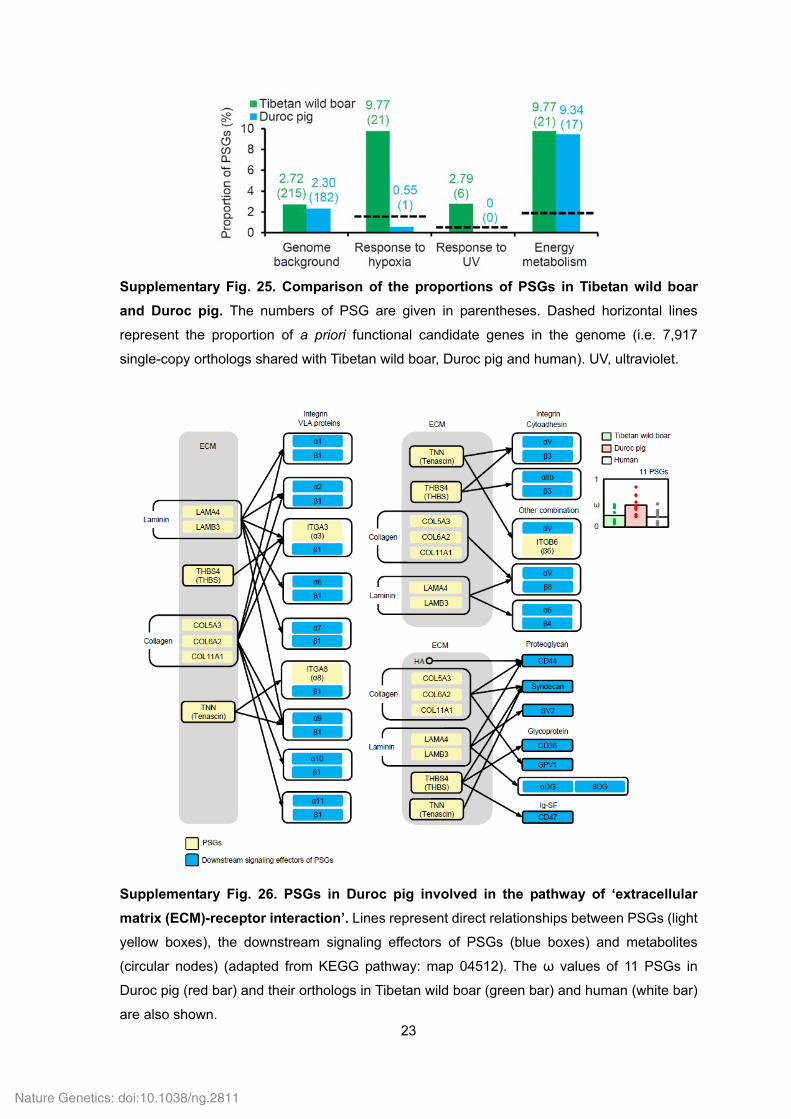
Supplementary Fig. 25. Comparison of the proportions of PSGs in Tibetan wild boar
and Duroc pig. The numbers of PSG are given in parentheses. Dashed horizontal lines
represent the proportion of a priori functional candidate genes in the genome (i.e. 7,917
single-copy orthologs shared with Tibetan wild boar, Duroc pig and human). UV, ultraviolet.
Supplementary Fig. 26. PSGs in Duroc pig involved in the pathway of ‘extracellular
matrix (ECM)-receptor interaction’. Lines represent direct relationships between PSGs (light
yellow boxes), the downstream signaling effectors of PSGs (blue boxes) and metabolites
(circular nodes) (adapted from KEGG pathway: map 04512). The ω values of 11 PSGs in
Duroc pig (red bar) and their orthologs in Tibetan wild boar (green bar) and human (white bar)
are also shown.
Nature Genetics: doi:10.1038/ng.2811
24
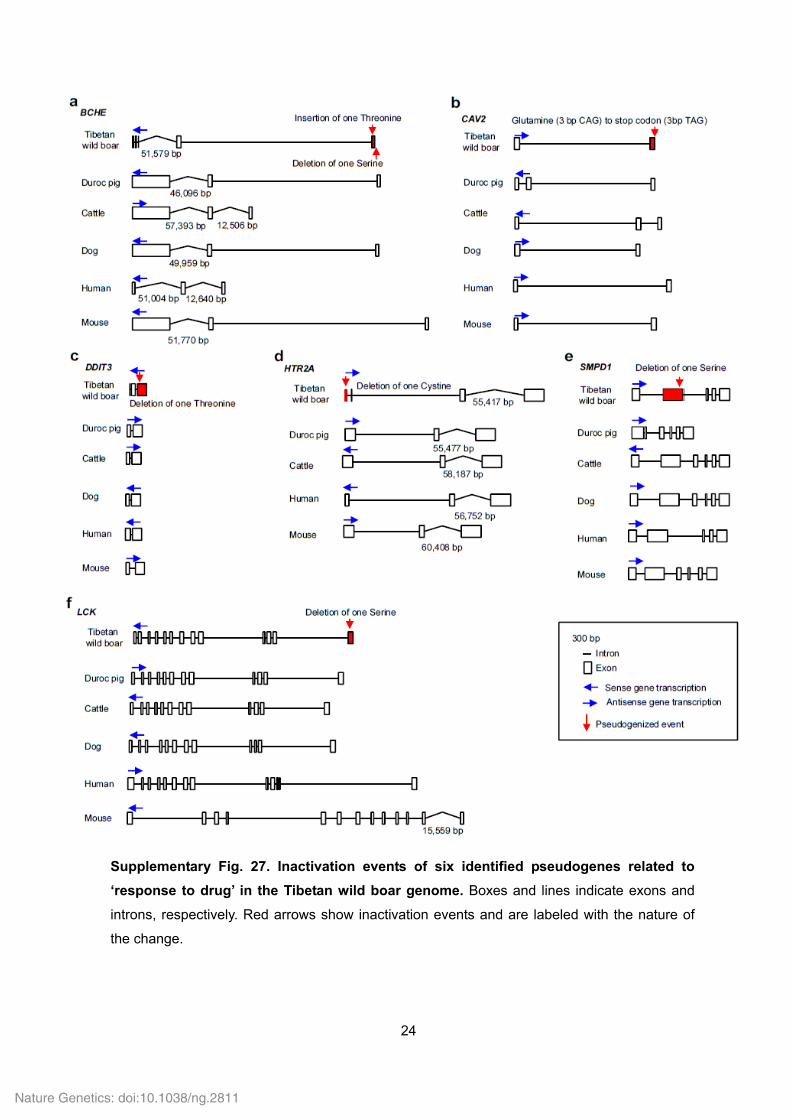
Supplementary Fig. 27. Inactivation events of six identified pseudogenes related to
‘response to drug’ in the Tibetan wild boar genome. Boxes and lines indicate exons and
introns, respectively. Red arrows show inactivation events and are labeled with the nature of
the change.
Nature Genetics: doi:10.1038/ng.2811
25
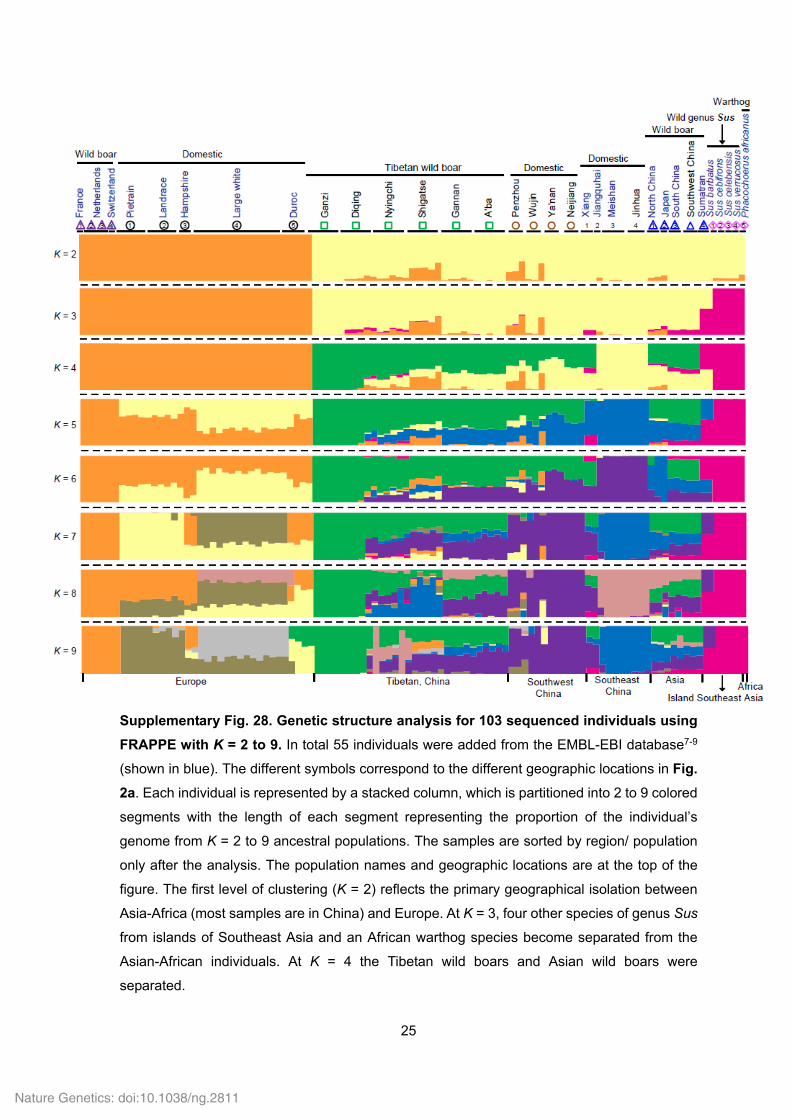
Supplementary Fig. 28. Genetic structure analysis for 103 sequenced individuals using
FRAPPE with K = 2 to 9. In total 55 individuals were added from the EMBL-EBI database7-9
(shown in blue). The different symbols correspond to the different geographic locations in Fig.
2a. Each individual is represented by a stacked column, which is partitioned into 2 to 9 colored
segments with the length of each segment representing the proportion of the individual’s
genome from K = 2 to 9 ancestral populations. The samples are sorted by region/ population
only after the analysis. The population names and geographic locations are at the top of the
figure. The first level of clustering (K = 2) reflects the primary geographical isolation between
Asia-Africa (most samples are in China) and Europe. At K = 3, four other species of genus Sus
from islands of Southeast Asia and an African warthog species become separated from the
Asian-African individuals. At K = 4 the Tibetan wild boars and Asian wild boars were
separated.
Nature Genetics: doi:10.1038/ng.2811
26
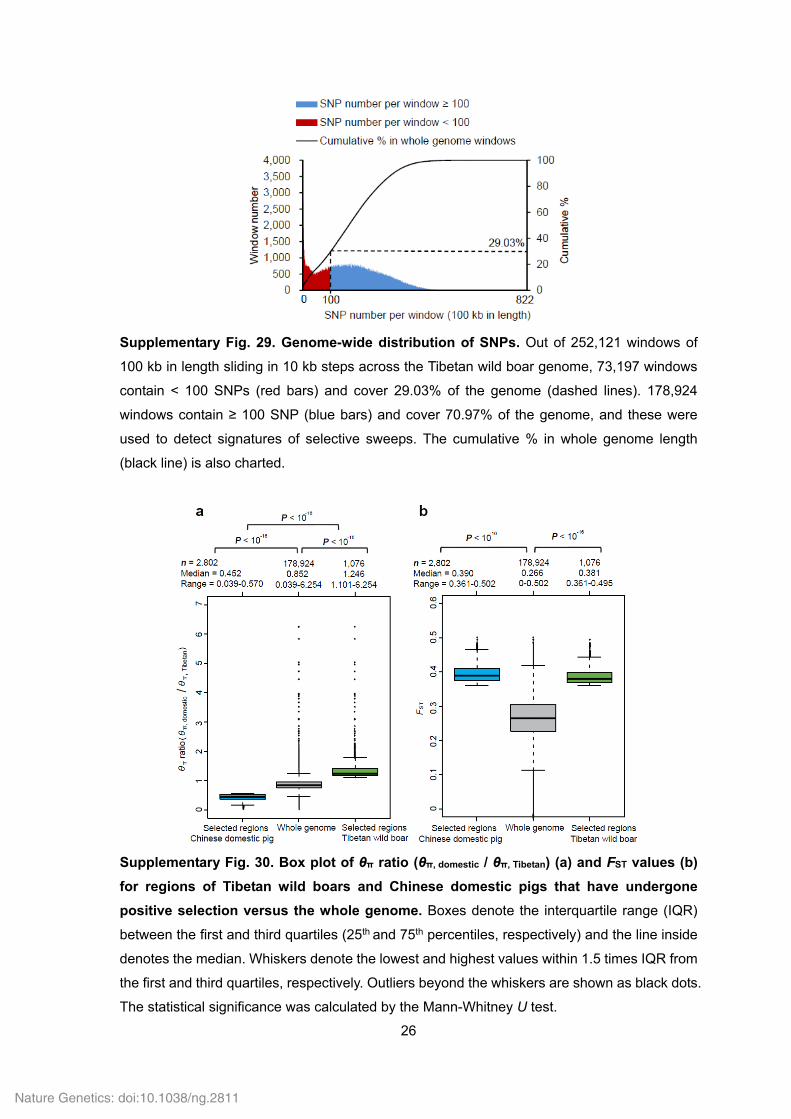
Supplementary Fig. 29. Genome-wide distribution of SNPs. Out of 252,121 windows of
100 kb in length sliding in 10 kb steps across the Tibetan wild boar genome, 73,197 windows
contain < 100 SNPs (red bars) and cover 29.03% of the genome (dashed lines). 178,924
windows contain ≥ 100 SNP (blue bars) and cover 70.97% of the genome, and these were
used to detect signatures of selective sweeps. The cumulative % in whole genome length
(black line) is also charted.
Supplementary Fig. 30. Box plot of θπ ratio (θπ, domestic / θπ, Tibetan) (a) and FST values (b)
for regions of Tibetan wild boars and Chinese domestic pigs that have undergone
positive selection versus the whole genome. Boxes denote the interquartile range (IQR)
between the first and third quartiles (25th and 75th percentiles, respectively) and the line inside
denotes the median. Whiskers denote the lowest and highest values within 1.5 times IQR from
the first and third quartiles, respectively. Outliers beyond the whiskers are shown as black dots.
The statistical significance was calculated by the Mann-Whitney U test.
Nature Genetics: doi:10.1038/ng.2811
27
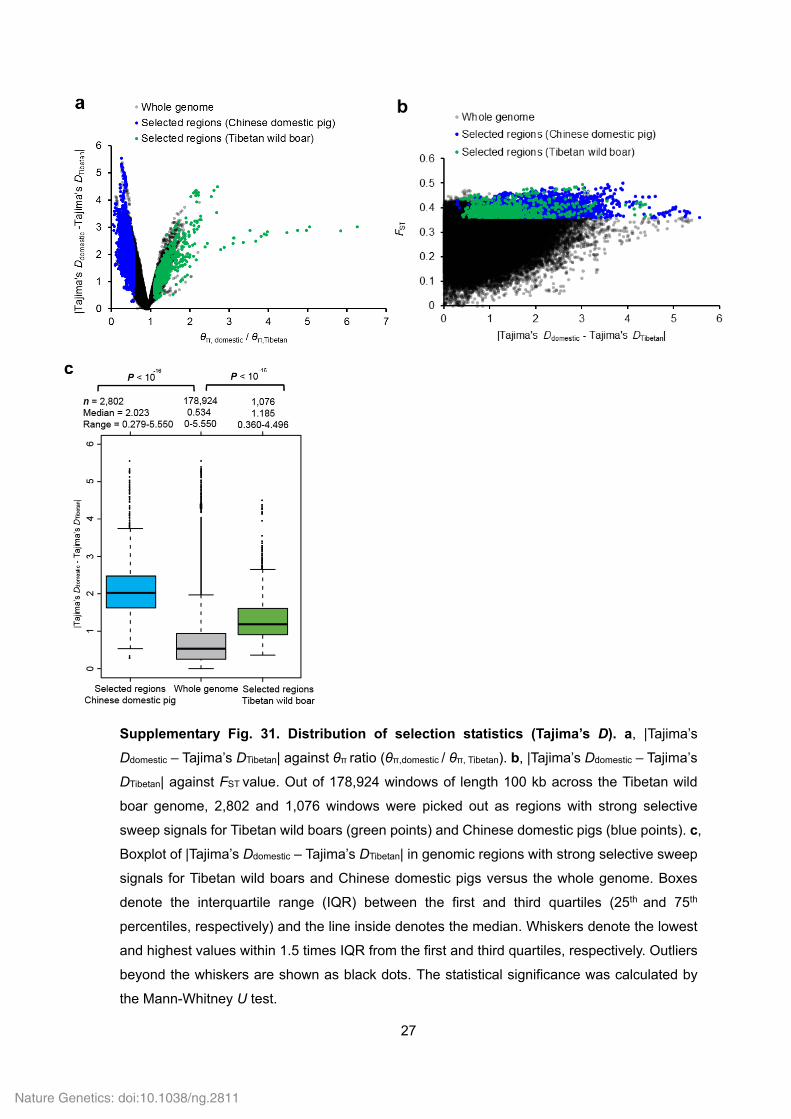
Supplementary Fig. 31. Distribution of selection statistics (Tajima’s D). a, |Tajima’s
Ddomestic – Tajima’s DTibetan| against θπ ratio (θπ,domestic / θπ, Tibetan). b, |Tajima’s Ddomestic – Tajima’s
DTibetan| against FST value. Out of 178,924 windows of length 100 kb across the Tibetan wild
boar genome, 2,802 and 1,076 windows were picked out as regions with strong selective
sweep signals for Tibetan wild boars (green points) and Chinese domestic pigs (blue points). c,
Boxplot of |Tajima’s Ddomestic – Tajima’s DTibetan| in genomic regions with strong selective sweep
signals for Tibetan wild boars and Chinese domestic pigs versus the whole genome. Boxes
denote the interquartile range (IQR) between the first and third quartiles (25th and 75th
percentiles, respectively) and the line inside denotes the median. Whiskers denote the lowest
and highest values within 1.5 times IQR from the first and third quartiles, respectively. Outliers
beyond the whiskers are shown as black dots. The statistical significance was calculated by
the Mann-Whitney U test.
Nature Genetics: doi:10.1038/ng.2811
28
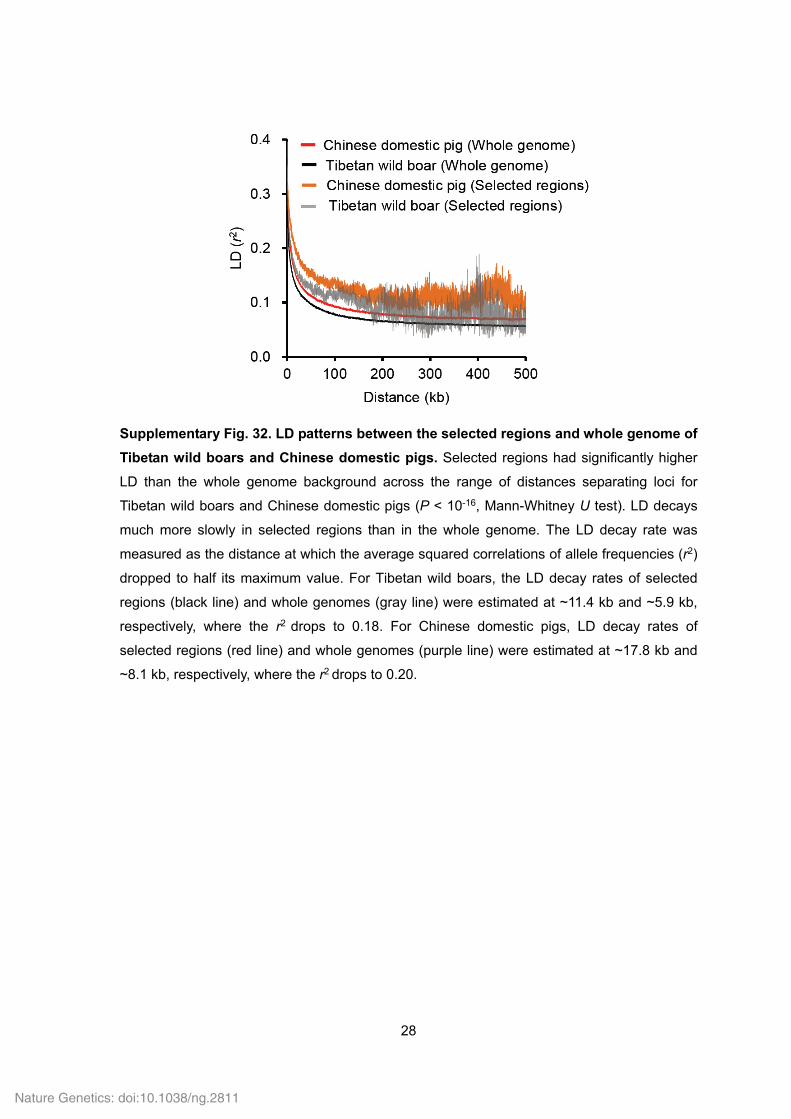
Supplementary Fig. 32. LD patterns between the selected regions and whole genome of
Tibetan wild boars and Chinese domestic pigs. Selected regions had significantly higher
LD than the whole genome background across the range of distances separating loci for
Tibetan wild boars and Chinese domestic pigs (P < 10-16, Mann-Whitney U test). LD decays
much more slowly in selected regions than in the whole genome. The LD decay rate was
measured as the distance at which the average squared correlations of allele frequencies (r2)
dropped to half its maximum value. For Tibetan wild boars, the LD decay rates of selected
regions (black line) and whole genomes (gray line) were estimated at ~11.4 kb and ~5.9 kb,
respectively, where the r2 drops to 0.18. For Chinese domestic pigs, LD decay rates of
selected regions (red line) and whole genomes (purple line) were estimated at ~17.8 kb and
~8.1 kb, respectively, where the r2 drops to 0.20.
Nature Genetics: doi:10.1038/ng.2811
29
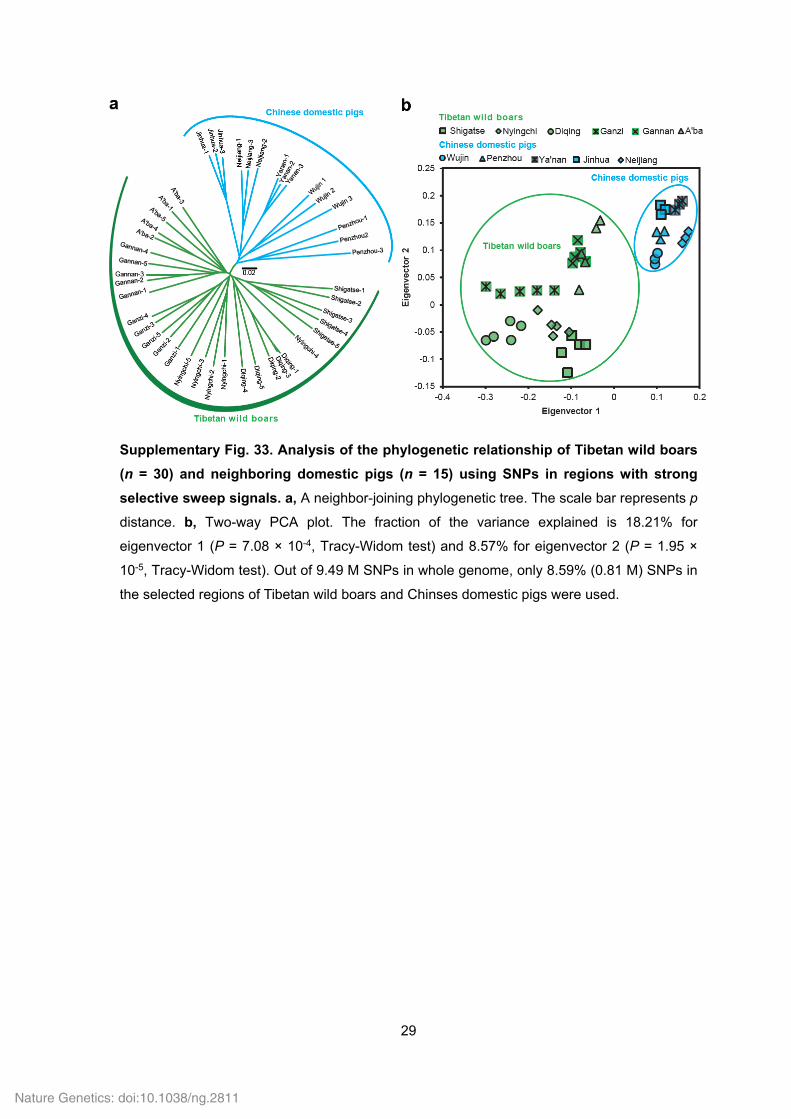
Supplementary Fig. 33. Analysis of the phylogenetic relationship of Tibetan wild boars
(n = 30) and neighboring domestic pigs (n = 15) using SNPs in regions with strong
selective sweep signals. a, A neighbor-joining phylogenetic tree. The scale bar represents p
distance. b, Two-way PCA plot. The fraction of the variance explained is 18.21% for
eigenvector 1 (P = 7.08 × 10⁻⁴, Tracy-Widom test) and 8.57% for eigenvector 2 (P = 1.95 ×
10-5, Tracy-Widom test). Out of 9.49 M SNPs in whole genome, only 8.59% (0.81 M) SNPs in
the selected regions of Tibetan wild boars and Chinses domestic pigs were used.
Nature Genetics: doi:10.1038/ng.2811
30
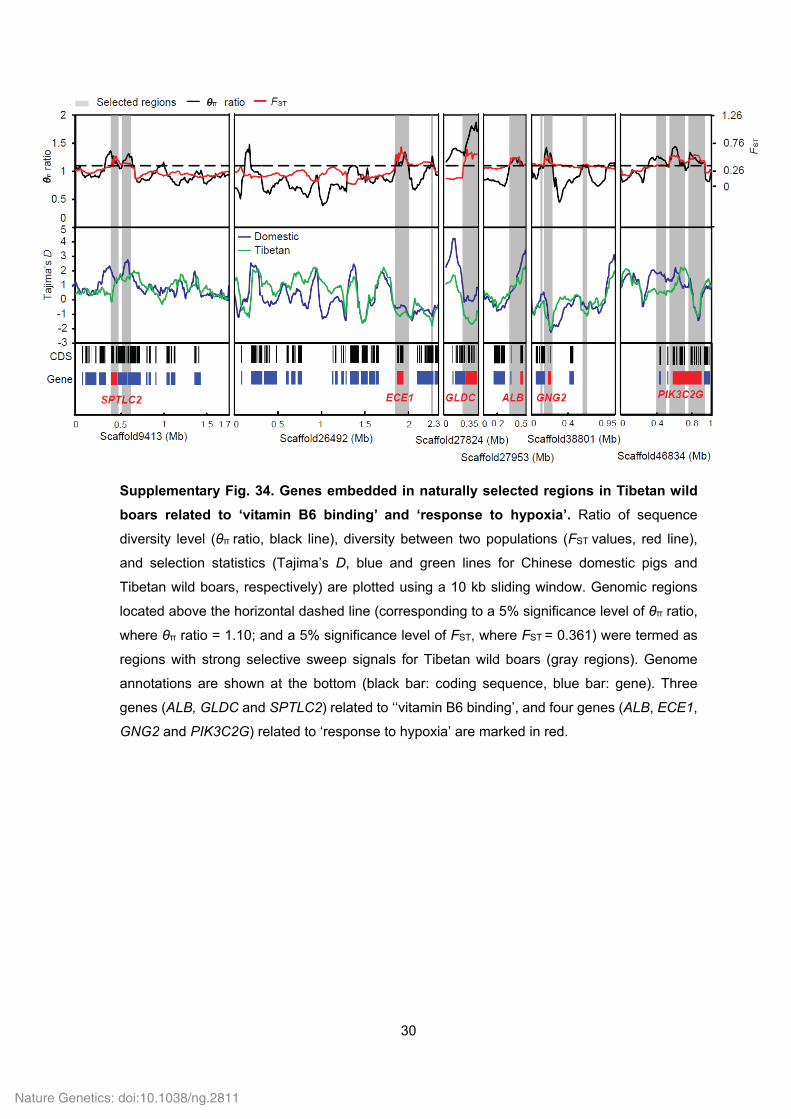
Supplementary Fig. 34. Genes embedded in naturally selected regions in Tibetan wild
boars related to ‘vitamin B6 binding’ and ‘response to hypoxia’. Ratio of sequence
diversity level (θπ ratio, black line), diversity between two populations (FST values, red line),
and selection statistics (Tajima’s D, blue and green lines for Chinese domestic pigs and
Tibetan wild boars, respectively) are plotted using a 10 kb sliding window. Genomic regions
located above the horizontal dashed line (corresponding to a 5% significance level of θπ ratio,
where θπ ratio = 1.10; and a 5% significance level of FST, where FST = 0.361) were termed as
regions with strong selective sweep signals for Tibetan wild boars (gray regions). Genome
annotations are shown at the bottom (black bar: coding sequence, blue bar: gene). Three
genes (ALB, GLDC and SPTLC2) related to ‘‘vitamin B6 binding’, and four genes (ALB, ECE1,
GNG2 and PIK3C2G) related to ‘response to hypoxia’ are marked in red.
Nature Genetics: doi:10.1038/ng.2811
31
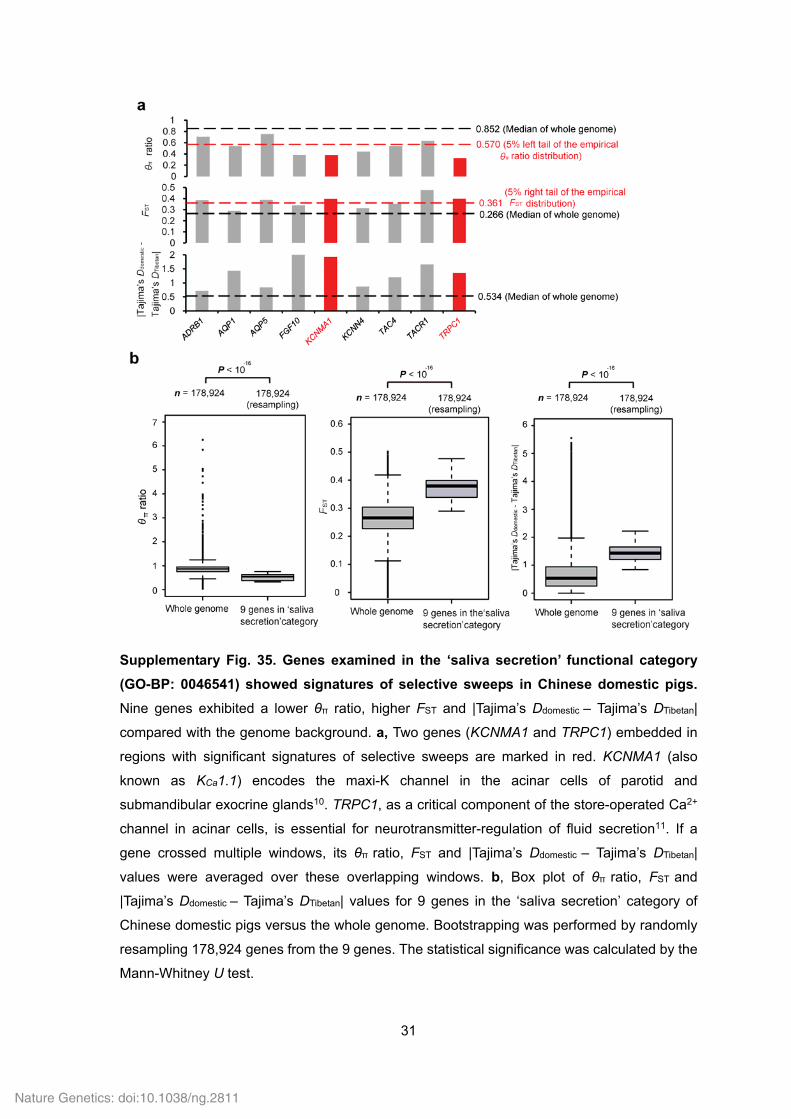
Supplementary Fig. 35. Genes examined in the ‘saliva secretion’ functional category
(GO-BP: 0046541) showed signatures of selective sweeps in Chinese domestic pigs.
Nine genes exhibited a lower θπ ratio, higher FST and |Tajima’s Ddomestic – Tajima’s DTibetan|
compared with the genome background. a, Two genes (KCNMA1 and TRPC1) embedded in
regions with significant signatures of selective sweeps are marked in red. KCNMA1 (also
known as KCa1.1) encodes the maxi-K channel in the acinar cells of parotid and
submandibular exocrine glands10. TRPC1, as a critical component of the store-operated Ca2+
channel in acinar cells, is essential for neurotransmitter-regulation of fluid secretion11. If a
gene crossed multiple windows, its θπ ratio, FST and |Tajima’s Ddomestic – Tajima’s DTibetan|
values were averaged over these overlapping windows. b, Box plot of θπ ratio, FST and
|Tajima’s Ddomestic – Tajima’s DTibetan| values for 9 genes in the ‘saliva secretion’ category of
Chinese domestic pigs versus the whole genome. Bootstrapping was performed by randomly
resampling 178,924 genes from the 9 genes. The statistical significance was calculated by the
Mann-Whitney U test.
Nature Genetics: doi:10.1038/ng.2811
32
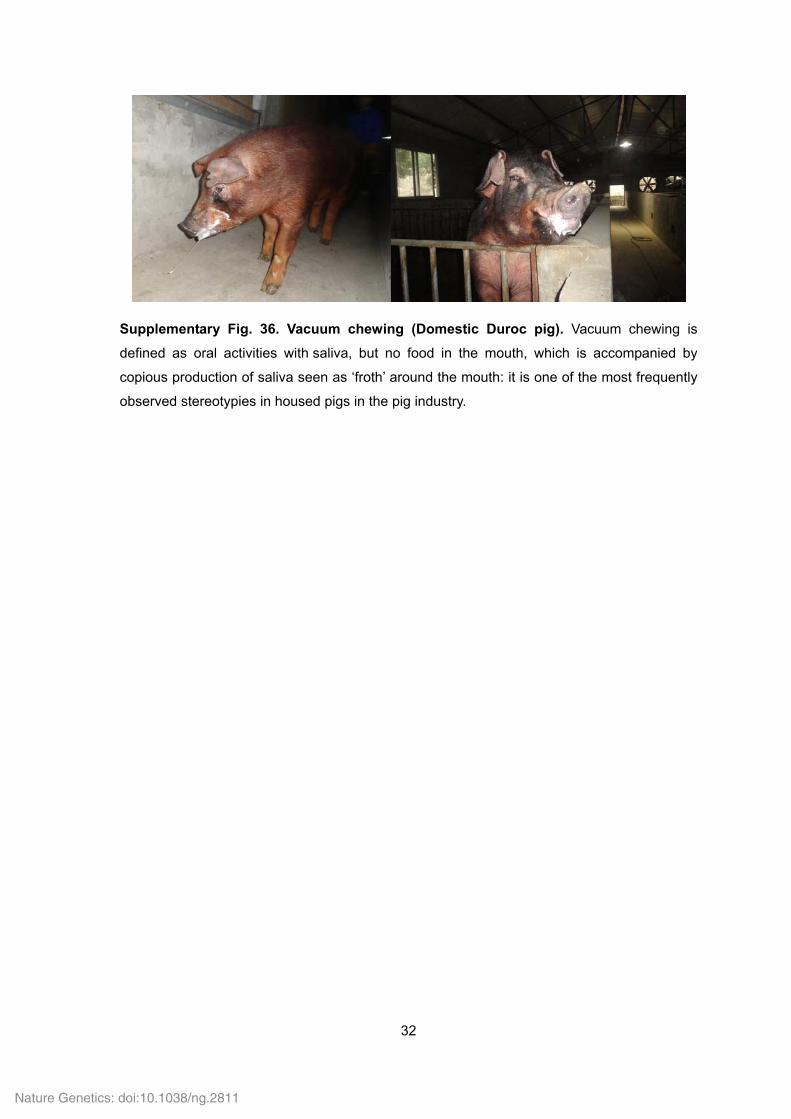
Supplementary Fig. 36. Vacuum chewing (Domestic Duroc pig). Vacuum chewing is
defined as oral activities with saliva, but no food in the mouth, which is accompanied by
copious production of saliva seen as ‘froth’ around the mouth: it is one of the most frequently
observed stereotypies in housed pigs in the pig industry.
Nature Genetics: doi:10.1038/ng.2811
33
Supplementary Tables 1-8, 10-16, 18-22, 24-27 and 29-36
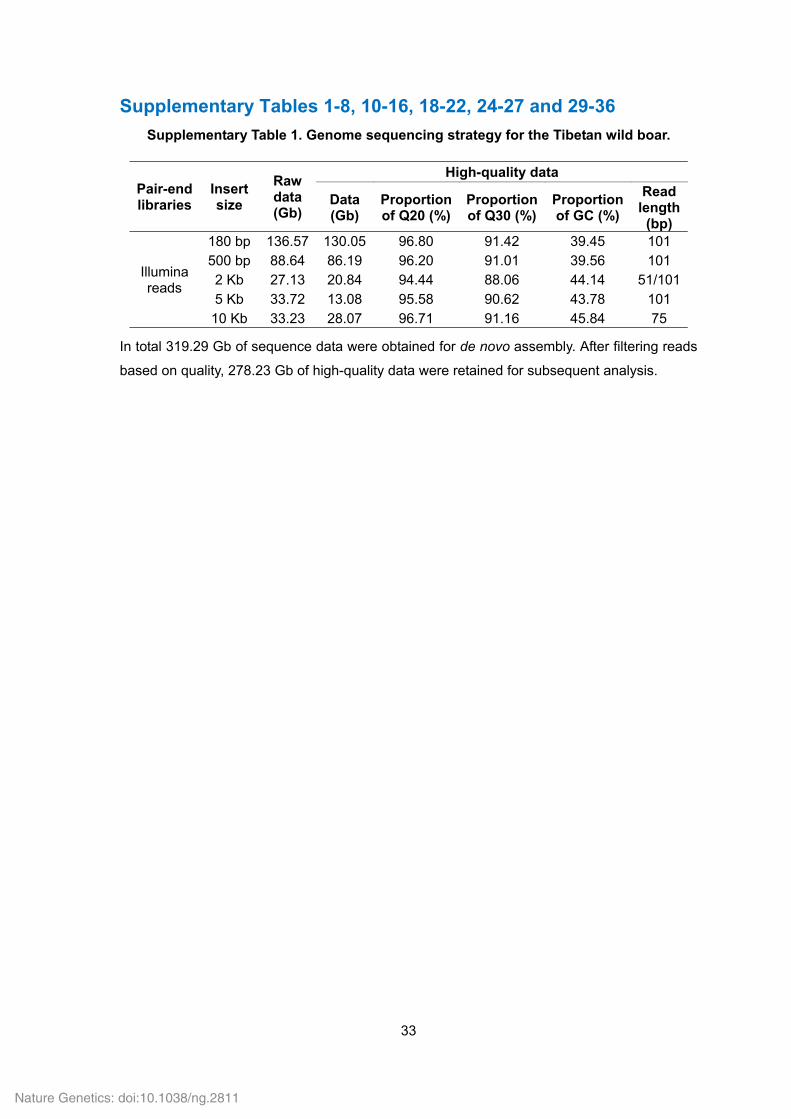
Supplementary Table 1. Genome sequencing strategy for the Tibetan wild boar.
Pair-end libraries
Insert size
Raw data (Gb)
High-quality data
Data (Gb)
Proportion of Q20 (%)
Proportion of Q30 (%)
Proportion of GC (%)
Read length
(bp)
Illumina reads
180 bp 136.57 130.05 96.80 91.42 39.45 101 500 bp 88.64 86.19 96.20 91.01 39.56 101 2 Kb 27.13 20.84 94.44 88.06 44.14 51/1015 Kb 33.72 13.08 95.58 90.62 43.78 101
10 Kb 33.23 28.07 96.71 91.16 45.84 75
In total 319.29 Gb of sequence data were obtained for de novo assembly. After filtering reads
based on quality, 278.23 Gb of high-quality data were retained for subsequent analysis.
Nature Genetics: doi:10.1038/ng.2811
34
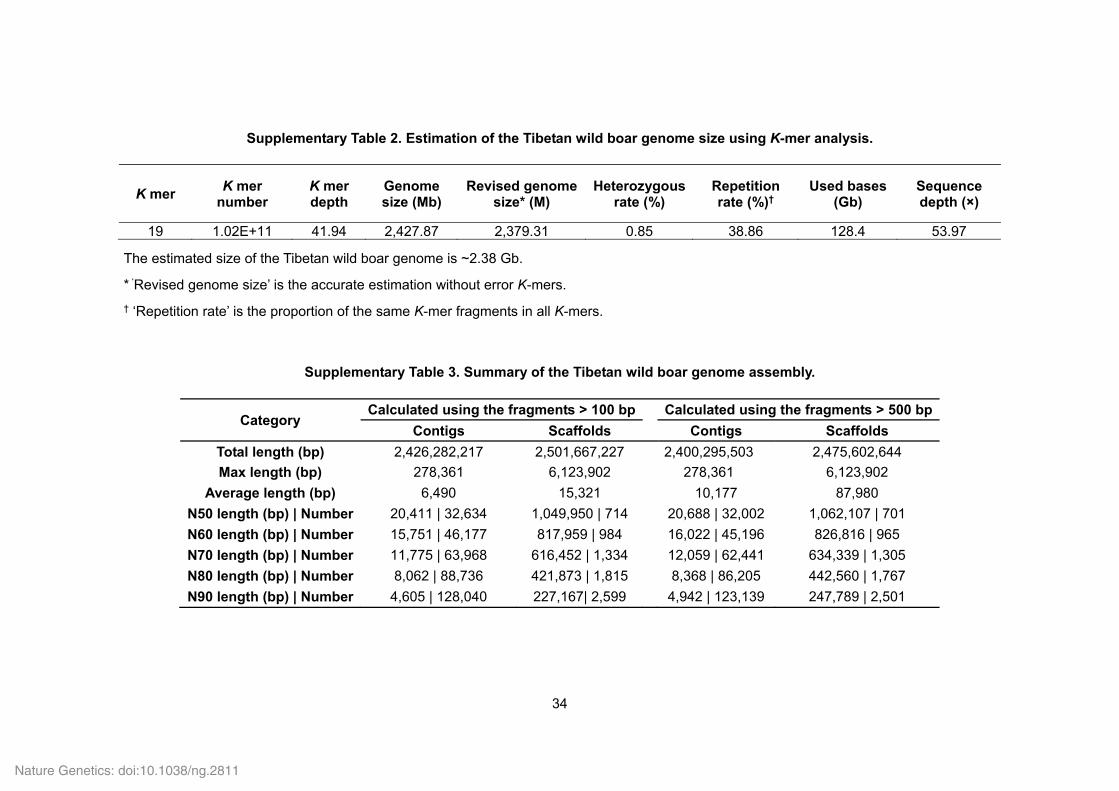
Supplementary Table 2. Estimation of the Tibetan wild boar genome size using K-mer analysis.
K mer K mer
number K mer depth
Genome size (Mb)
Revised genome size* (M)
Heterozygous rate (%)
Repetition rate (%)†
Used bases (Gb)
Sequence depth (×)
19 1.02E+11 41.94 2,427.87 2,379.31 0.85 38.86 128.4 53.97
The estimated size of the Tibetan wild boar genome is ~2.38 Gb.
* ‘Revised genome size’ is the accurate estimation without error K-mers.
† ‘Repetition rate’ is the proportion of the same K-mer fragments in all K-mers.
Supplementary Table 3. Summary of the Tibetan wild boar genome assembly.
Category Calculated using the fragments > 100 bp
Calculated using the fragments > 500 bp
Contigs Scaffolds Contigs Scaffolds
Total length (bp) 2,426,282,217 2,501,667,227 2,400,295,503 2,475,602,644
Max length (bp) 278,361 6,123,902 278,361 6,123,902
Average length (bp) 6,490 15,321 10,177 87,980
N50 length (bp) | Number 20,411 | 32,634 1,049,950 | 714 20,688 | 32,002 1,062,107 | 701
N60 length (bp) | Number 15,751 | 46,177 817,959 | 984 16,022 | 45,196 826,816 | 965
N70 length (bp) | Number 11,775 | 63,968 616,452 | 1,334 12,059 | 62,441 634,339 | 1,305
N80 length (bp) | Number 8,062 | 88,736 421,873 | 1,815 8,368 | 86,205 442,560 | 1,767
N90 length (bp) | Number 4,605 | 128,040 227,167| 2,599 4,942 | 123,139 247,789 | 2,501
Nature Genetics: doi:10.1038/ng.2811
35
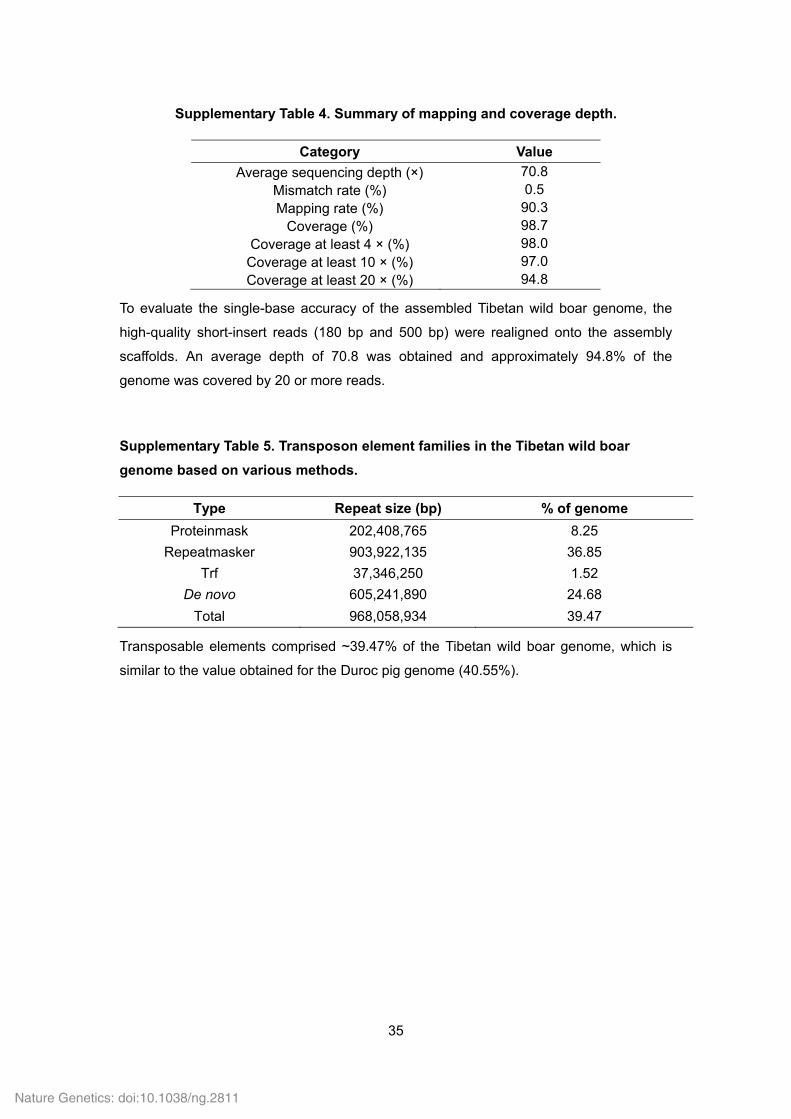
Supplementary Table 4. Summary of mapping and coverage depth.
Category Value
Average sequencing depth (×) 70.8 Mismatch rate (%) 0.5 Mapping rate (%) 90.3
Coverage (%) 98.7 Coverage at least 4 × (%) 98.0
Coverage at least 10 × (%) 97.0 Coverage at least 20 × (%) 94.8
To evaluate the single-base accuracy of the assembled Tibetan wild boar genome, the
high-quality short-insert reads (180 bp and 500 bp) were realigned onto the assembly
scaffolds. An average depth of 70.8 was obtained and approximately 94.8% of the
genome was covered by 20 or more reads.
Supplementary Table 5. Transposon element families in the Tibetan wild boar
genome based on various methods.
Type Repeat size (bp) % of genome
Proteinmask 202,408,765 8.25
Repeatmasker 903,922,135 36.85
Trf 37,346,250 1.52
De novo 605,241,890 24.68
Total 968,058,934 39.47
Transposable elements comprised ~39.47% of the Tibetan wild boar genome, which is
similar to the value obtained for the Duroc pig genome (40.55%).
Nature Genetics: doi:10.1038/ng.2811
36
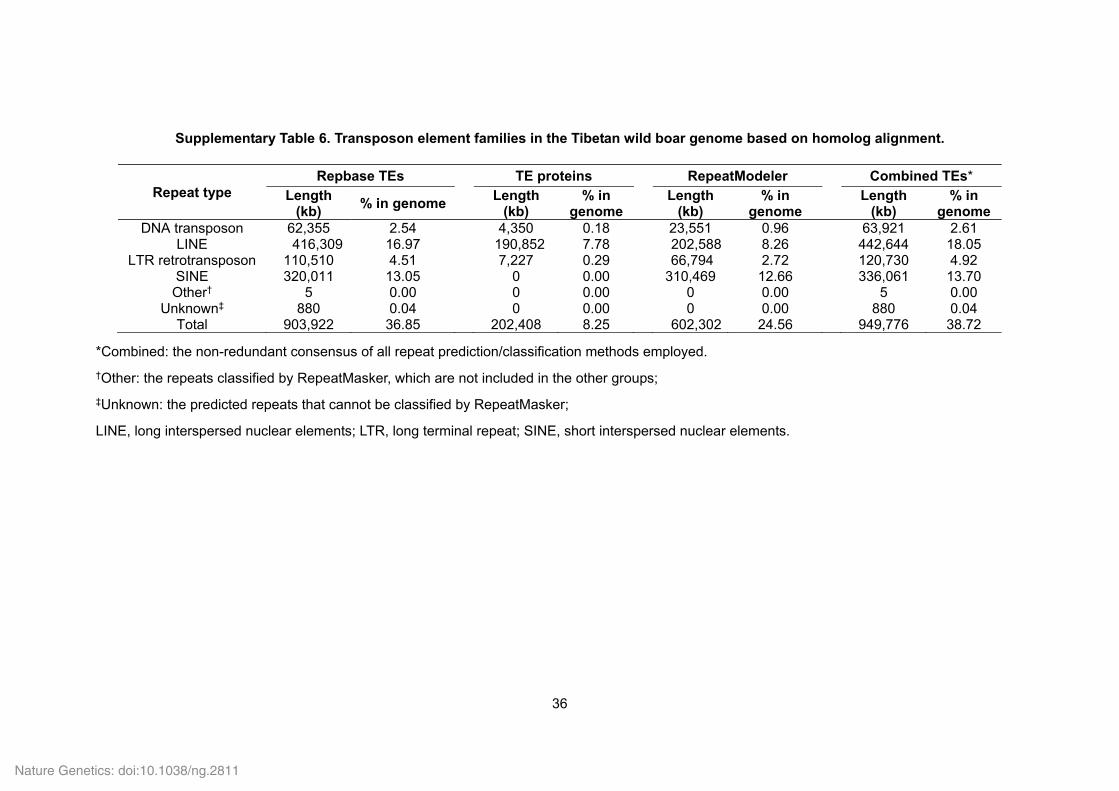
Supplementary Table 6. Transposon element families in the Tibetan wild boar genome based on homolog alignment.
Repeat type Repbase TEs TE proteins RepeatModeler Combined TEs*
Length (kb)
% in genomeLength
(kb) % in
genome
Length (kb)
% in genome
Length (kb)
% in genome
DNA transposon 62,355 2.54 4,350 0.18 23,551 0.96 63,921 2.61 LINE 416,309 16.97 190,852 7.78 202,588 8.26 442,644 18.05
LTR retrotransposon 110,510 4.51 7,227 0.29 66,794 2.72 120,730 4.92 SINE 320,011 13.05 0 0.00 310,469 12.66 336,061 13.70 Other† 5 0.00 0 0.00 0 0.00 5 0.00
Unknown‡ 880 0.04 0 0.00 0 0.00 880 0.04 Total 903,922 36.85 202,408 8.25 602,302 24.56 949,776 38.72
*Combined: the non-redundant consensus of all repeat prediction/classification methods employed.
†Other: the repeats classified by RepeatMasker, which are not included in the other groups;
‡Unknown: the predicted repeats that cannot be classified by RepeatMasker;
LINE, long interspersed nuclear elements; LTR, long terminal repeat; SINE, short interspersed nuclear elements.
Nature Genetics: doi:10.1038/ng.2811
37
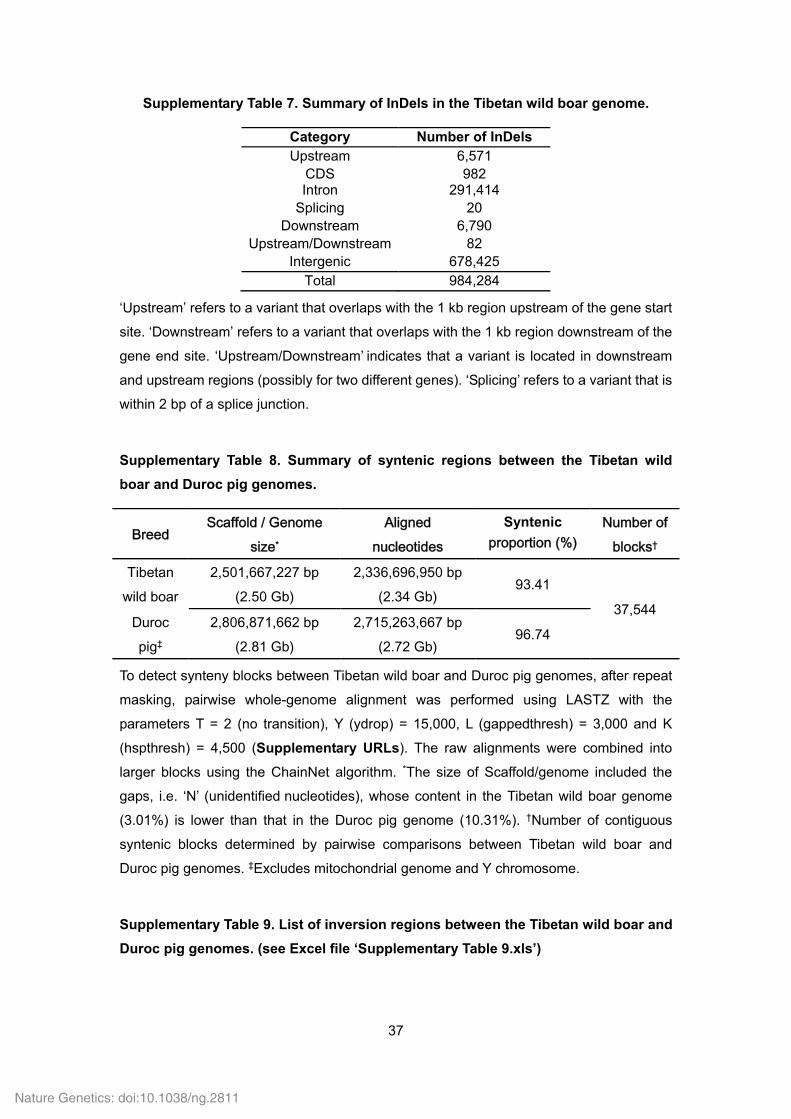
Supplementary Table 7. Summary of InDels in the Tibetan wild boar genome.
Category Number of InDels Upstream 6,571
CDS 982 Intron 291,414
Splicing 20 Downstream 6,790
Upstream/Downstream 82 Intergenic 678,425
Total 984,284
‘Upstream’ refers to a variant that overlaps with the 1 kb region upstream of the gene start
site. ‘Downstream’ refers to a variant that overlaps with the 1 kb region downstream of the
gene end site. ‘Upstream/Downstream’ indicates that a variant is located in downstream
and upstream regions (possibly for two different genes). ‘Splicing’ refers to a variant that is
within 2 bp of a splice junction.
Supplementary Table 8. Summary of syntenic regions between the Tibetan wild
boar and Duroc pig genomes.
Breed Scaffold / Genome
size* Aligned
nucleotides
Syntenic proportion (%)
Number of blocks†
Tibetan wild boar
2,501,667,227 bp (2.50 Gb)
2,336,696,950 bp (2.34 Gb)
93.41
37,544 Duroc pig‡
2,806,871,662 bp (2.81 Gb)
2,715,263,667 bp (2.72 Gb)
96.74
To detect synteny blocks between Tibetan wild boar and Duroc pig genomes, after repeat
masking, pairwise whole-genome alignment was performed using LASTZ with the
parameters T = 2 (no transition), Y (ydrop) = 15,000, L (gappedthresh) = 3,000 and K
(hspthresh) = 4,500 (Supplementary URLs). The raw alignments were combined into
larger blocks using the ChainNet algorithm. *The size of Scaffold/genome included the
gaps, i.e. ‘N’ (unidentified nucleotides), whose content in the Tibetan wild boar genome
(3.01%) is lower than that in the Duroc pig genome (10.31%). †Number of contiguous
syntenic blocks determined by pairwise comparisons between Tibetan wild boar and
Duroc pig genomes. ‡Excludes mitochondrial genome and Y chromosome.
Supplementary Table 9. List of inversion regions between the Tibetan wild boar and
Duroc pig genomes. (see Excel file ‘Supplementary Table 9.xls’)
Nature Genetics: doi:10.1038/ng.2811
38
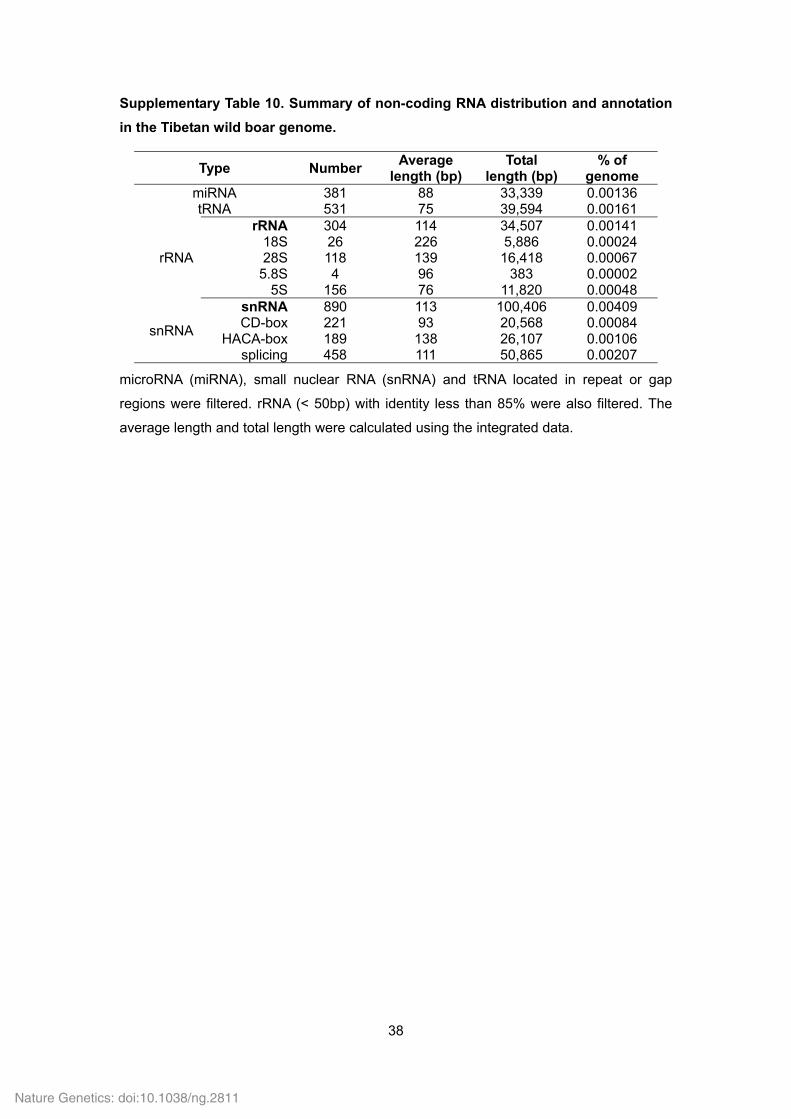
Supplementary Table 10. Summary of non-coding RNA distribution and annotation
in the Tibetan wild boar genome.
Type Number Average
length (bp) Total
length (bp)% of
genome miRNA 381 88 33,339 0.00136 tRNA 531 75 39,594 0.00161
rRNA
rRNA 304 114 34,507 0.00141 18S 26 226 5,886 0.00024 28S 118 139 16,418 0.00067
5.8S 4 96 383 0.00002 5S 156 76 11,820 0.00048
snRNA
snRNA 890 113 100,406 0.00409 CD-box 221 93 20,568 0.00084
HACA-box 189 138 26,107 0.00106 splicing 458 111 50,865 0.00207
microRNA (miRNA), small nuclear RNA (snRNA) and tRNA located in repeat or gap
regions were filtered. rRNA (< 50bp) with identity less than 85% were also filtered. The
average length and total length were calculated using the integrated data.
Nature Genetics: doi:10.1038/ng.2811
39
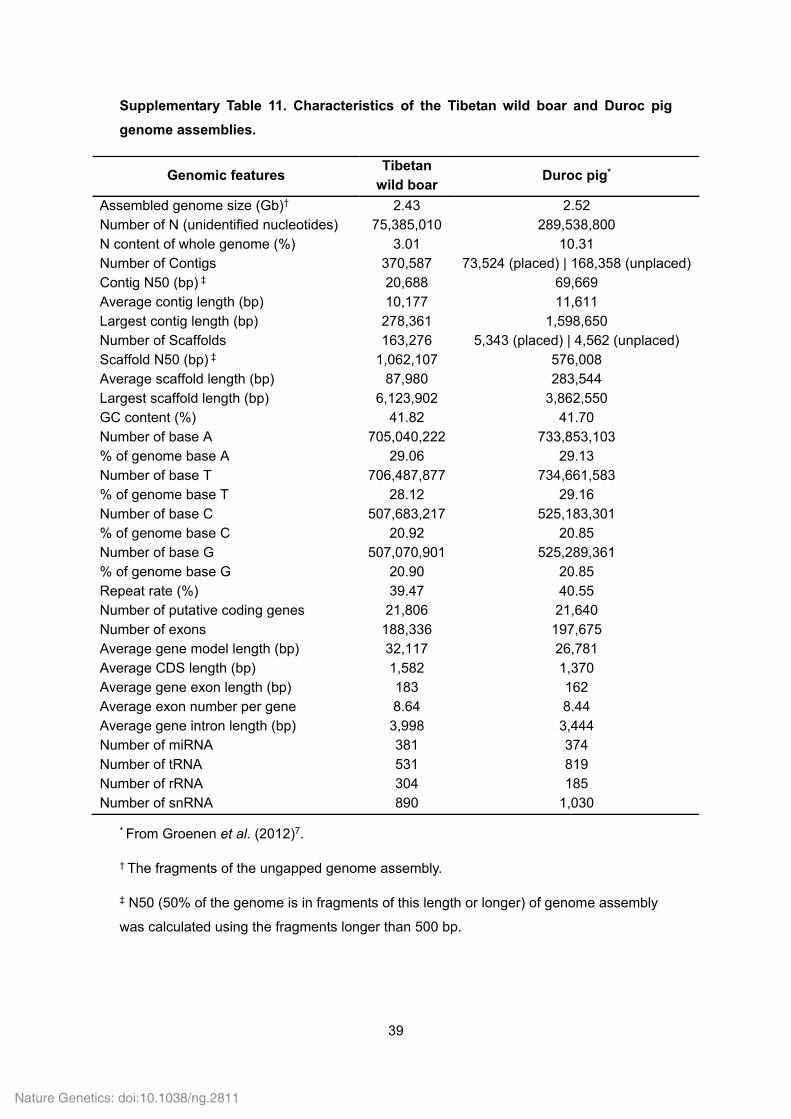
Supplementary Table 11. Characteristics of the Tibetan wild boar and Duroc pig
genome assemblies.
Genomic features Tibetan
wild boar Duroc pig*
Assembled genome size (Gb)† 2.43 2.52 Number of N (unidentified nucleotides) 75,385,010 289,538,800 N content of whole genome (%) 3.01 10.31 Number of Contigs 370,587 73,524 (placed) | 168,358 (unplaced)Contig N50 (bp) ‡ 20,688 69,669 Average contig length (bp) 10,177 11,611 Largest contig length (bp) 278,361 1,598,650 Number of Scaffolds 163,276 5,343 (placed) | 4,562 (unplaced) Scaffold N50 (bp) ‡ 1,062,107 576,008 Average scaffold length (bp) 87,980 283,544 Largest scaffold length (bp) 6,123,902 3,862,550 GC content (%) 41.82 41.70 Number of base A 705,040,222 733,853,103 % of genome base A 29.06 29.13 Number of base T 706,487,877 734,661,583 % of genome base T 28.12 29.16 Number of base C 507,683,217 525,183,301 % of genome base C 20.92 20.85 Number of base G 507,070,901 525,289,361 % of genome base G 20.90 20.85 Repeat rate (%) 39.47 40.55 Number of putative coding genes 21,806 21,640 Number of exons 188,336 197,675 Average gene model length (bp) 32,117 26,781 Average CDS length (bp) 1,582 1,370 Average gene exon length (bp) 183 162 Average exon number per gene 8.64 8.44 Average gene intron length (bp) 3,998 3,444 Number of miRNA 381 374 Number of tRNA 531 819 Number of rRNA 304 185 Number of snRNA 890 1,030
* From Groenen et al. (2012)7.
† The fragments of the ungapped genome assembly.
‡ N50 (50% of the genome is in fragments of this length or longer) of genome assembly
was calculated using the fragments longer than 500 bp.
Nature Genetics: doi:10.1038/ng.2811
40
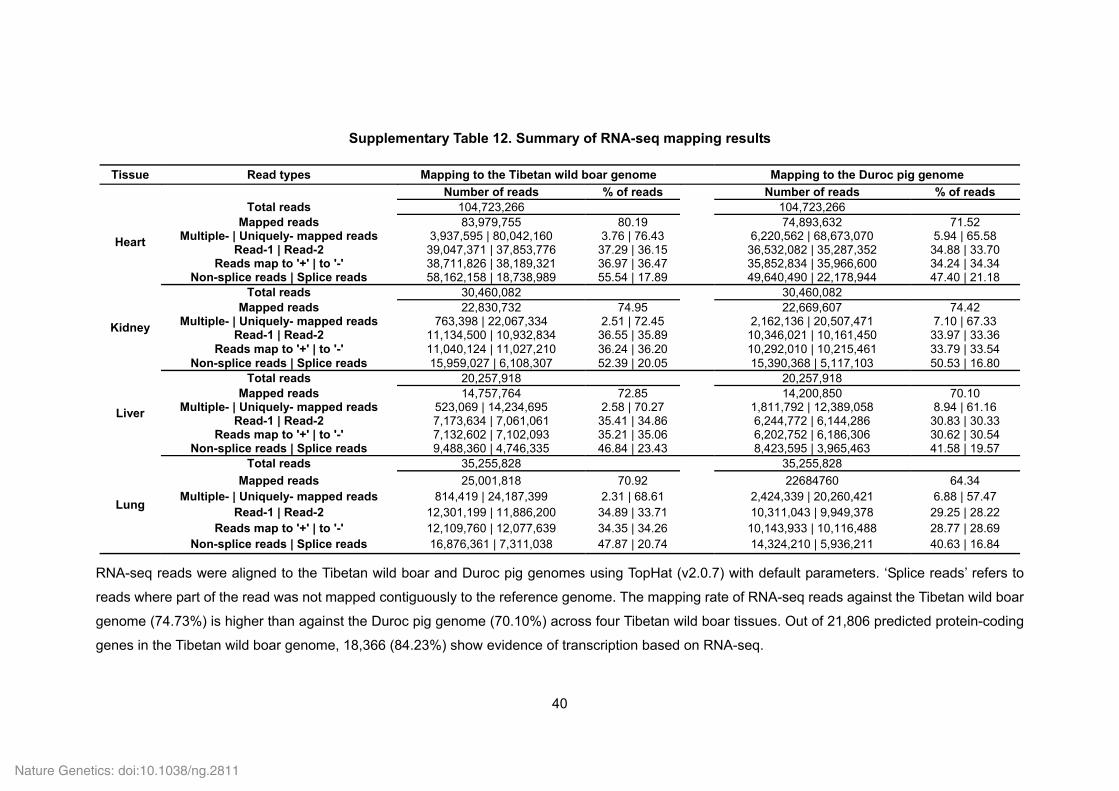
Supplementary Table 12. Summary of RNA-seq mapping results
Tissue Read types Mapping to the Tibetan wild boar genome Mapping to the Duroc pig genome
Number of reads % of reads Number of reads % of reads
Heart
Total reads 104,723,266 104,723,266 Mapped reads 83,979,755 80.19 74,893,632 71.52
Multiple- | Uniquely- mapped reads 3,937,595 | 80,042,160 3.76 | 76.43 6,220,562 | 68,673,070 5.94 | 65.58 Read-1 | Read-2 39,047,371 | 37,853,776 37.29 | 36.15 36,532,082 | 35,287,352 34.88 | 33.70
Reads map to '+' | to '-' 38,711,826 | 38,189,321 36.97 | 36.47 35,852,834 | 35,966,600 34.24 | 34.34 Non-splice reads | Splice reads 58,162,158 | 18,738,989 55.54 | 17.89 49,640,490 | 22,178,944 47.40 | 21.18
Kidney
Total reads 30,460,082 30,460,082 Mapped reads 22,830,732 74.95 22,669,607 74.42
Multiple- | Uniquely- mapped reads 763,398 | 22,067,334 2.51 | 72.45 2,162,136 | 20,507,471 7.10 | 67.33 Read-1 | Read-2 11,134,500 | 10,932,834 36.55 | 35.89 10,346,021 | 10,161,450 33.97 | 33.36
Reads map to '+' | to '-' 11,040,124 | 11,027,210 36.24 | 36.20 10,292,010 | 10,215,461 33.79 | 33.54 Non-splice reads | Splice reads 15,959,027 | 6,108,307 52.39 | 20.05 15,390,368 | 5,117,103 50.53 | 16.80
Liver
Total reads 20,257,918 20,257,918 Mapped reads 14,757,764 72.85 14,200,850 70.10
Multiple- | Uniquely- mapped reads 523,069 | 14,234,695 2.58 | 70.27 1,811,792 | 12,389,058 8.94 | 61.16 Read-1 | Read-2 7,173,634 | 7,061,061 35.41 | 34.86 6,244,772 | 6,144,286 30.83 | 30.33
Reads map to '+' | to '-' 7,132,602 | 7,102,093 35.21 | 35.06 6,202,752 | 6,186,306 30.62 | 30.54 Non-splice reads | Splice reads 9,488,360 | 4,746,335 46.84 | 23.43 8,423,595 | 3,965,463 41.58 | 19.57
Lung
Total reads 35,255,828 35,255,828
Mapped reads 25,001,818 70.92 22684760 64.34 Multiple- | Uniquely- mapped reads 814,419 | 24,187,399 2.31 | 68.61 2,424,339 | 20,260,421 6.88 | 57.47
Read-1 | Read-2 12,301,199 | 11,886,200 34.89 | 33.71 10,311,043 | 9,949,378 29.25 | 28.22 Reads map to '+' | to '-' 12,109,760 | 12,077,639 34.35 | 34.26 10,143,933 | 10,116,488 28.77 | 28.69
Non-splice reads | Splice reads 16,876,361 | 7,311,038 47.87 | 20.74 14,324,210 | 5,936,211 40.63 | 16.84
RNA-seq reads were aligned to the Tibetan wild boar and Duroc pig genomes using TopHat (v2.0.7) with default parameters. ‘Splice reads’ refers to
reads where part of the read was not mapped contiguously to the reference genome. The mapping rate of RNA-seq reads against the Tibetan wild boar
genome (74.73%) is higher than against the Duroc pig genome (70.10%) across four Tibetan wild boar tissues. Out of 21,806 predicted protein-coding
genes in the Tibetan wild boar genome, 18,366 (84.23%) show evidence of transcription based on RNA-seq.
Nature Genetics: doi:10.1038/ng.2811
41
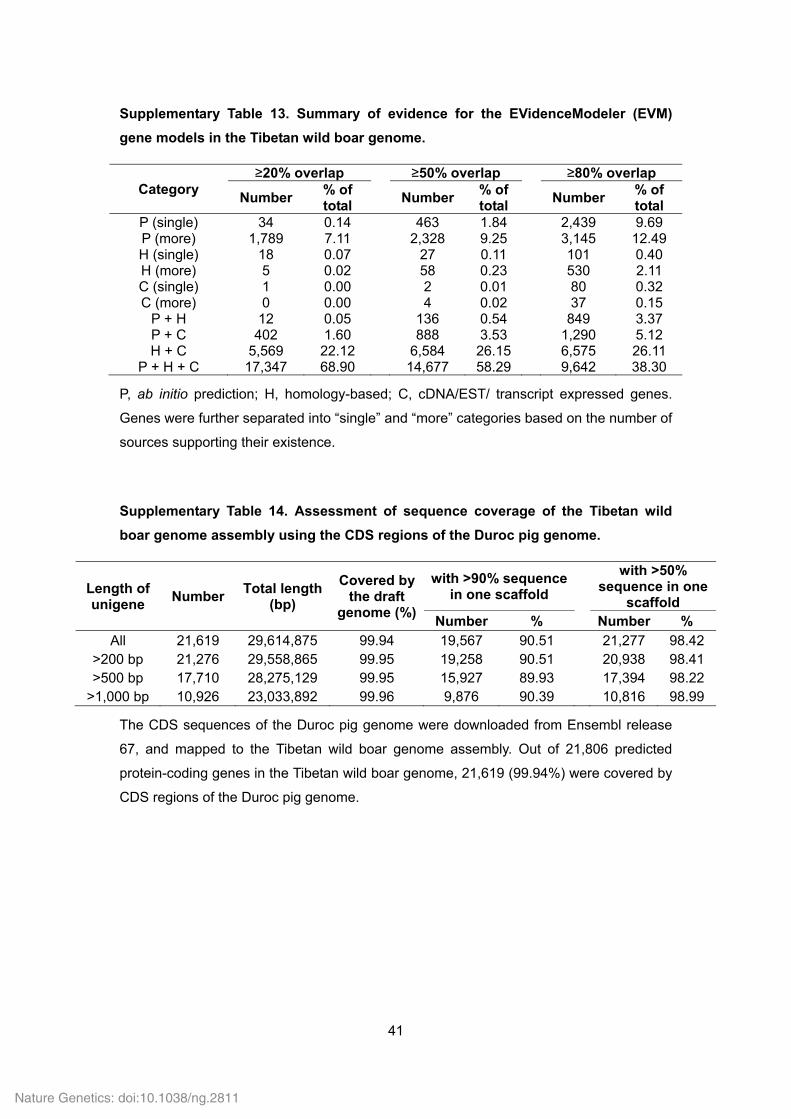
Supplementary Table 13. Summary of evidence for the EVidenceModeler (EVM)
gene models in the Tibetan wild boar genome.
Category ≥20% overlap ≥50% overlap ≥80% overlap
Number % of total
Number% of total
Number % of total
P (single) 34 0.14 463 1.84 2,439 9.69 P (more) 1,789 7.11 2,328 9.25 3,145 12.49 H (single) 18 0.07 27 0.11 101 0.40 H (more) 5 0.02 58 0.23 530 2.11 C (single) 1 0.00 2 0.01 80 0.32 C (more) 0 0.00 4 0.02 37 0.15
P + H 12 0.05 136 0.54 849 3.37 P + C 402 1.60 888 3.53 1,290 5.12 H + C 5,569 22.12 6,584 26.15 6,575 26.11
P + H + C 17,347 68.90 14,677 58.29 9,642 38.30
P, ab initio prediction; H, homology-based; C, cDNA/EST/ transcript expressed genes.
Genes were further separated into “single” and “more” categories based on the number of
sources supporting their existence.
Supplementary Table 14. Assessment of sequence coverage of the Tibetan wild
boar genome assembly using the CDS regions of the Duroc pig genome.
Length of unigene
Number Total length
(bp)
Covered by the draft
genome (%)
with >90% sequence in one scaffold
with >50% sequence in one
scaffold Number % Number %
All 21,619 29,614,875 99.94 19,567 90.51 21,277 98.42>200 bp 21,276 29,558,865 99.95 19,258 90.51 20,938 98.41>500 bp 17,710 28,275,129 99.95 15,927 89.93 17,394 98.22
>1,000 bp 10,926 23,033,892 99.96 9,876 90.39 10,816 98.99
The CDS sequences of the Duroc pig genome were downloaded from Ensembl release
67, and mapped to the Tibetan wild boar genome assembly. Out of 21,806 predicted
protein-coding genes in the Tibetan wild boar genome, 21,619 (99.94%) were covered by
CDS regions of the Duroc pig genome.
Nature Genetics: doi:10.1038/ng.2811
42
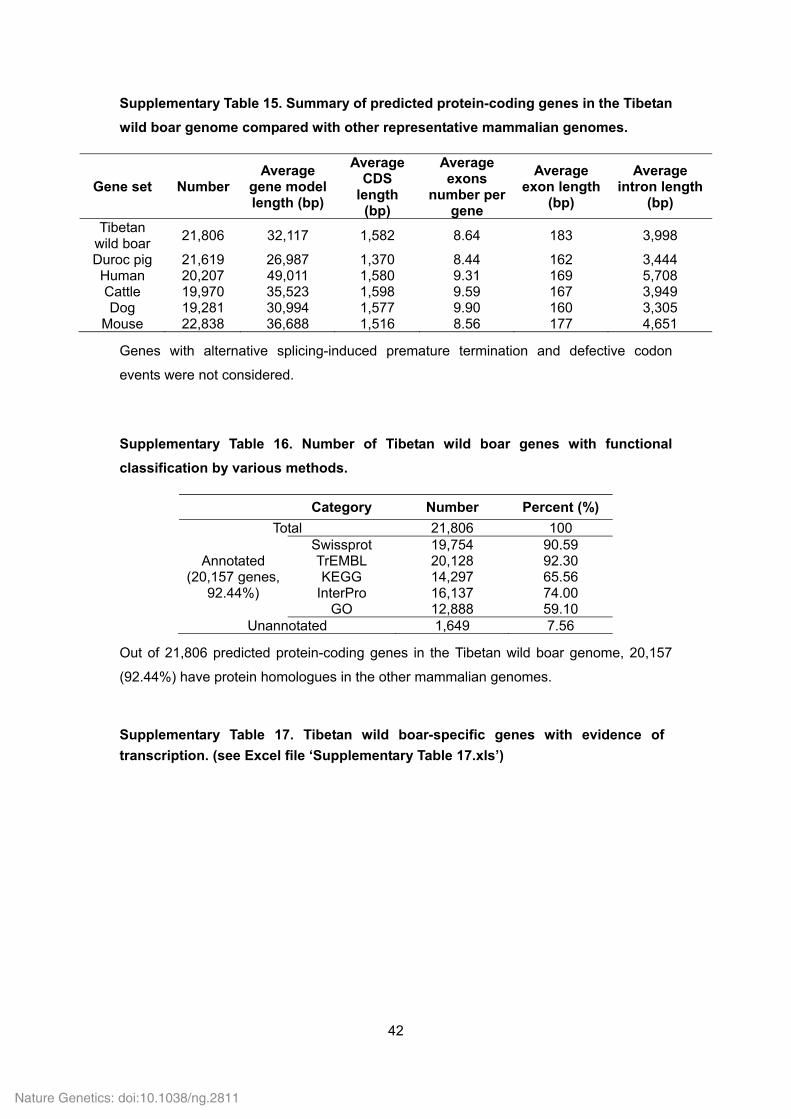
Supplementary Table 15. Summary of predicted protein-coding genes in the Tibetan
wild boar genome compared with other representative mammalian genomes.
Gene set Number Average
gene model length (bp)
Average CDS
length (bp)
Average exons
number per gene
Average exon length
(bp)
Average intron length
(bp)
Tibetan wild boar
21,806 32,117 1,582 8.64 183 3,998
Duroc pig 21,619 26,987 1,370 8.44 162 3,444 Human 20,207 49,011 1,580 9.31 169 5,708 Cattle 19,970 35,523 1,598 9.59 167 3,949 Dog 19,281 30,994 1,577 9.90 160 3,305
Mouse 22,838 36,688 1,516 8.56 177 4,651
Genes with alternative splicing-induced premature termination and defective codon
events were not considered.
Supplementary Table 16. Number of Tibetan wild boar genes with functional
classification by various methods.
Category Number Percent (%)
Total 21,806 100
Annotated (20,157 genes,
92.44%)
Swissprot 19,754 90.59 TrEMBL 20,128 92.30 KEGG 14,297 65.56
InterPro 16,137 74.00 GO 12,888 59.10
Unannotated 1,649 7.56
Out of 21,806 predicted protein-coding genes in the Tibetan wild boar genome, 20,157
(92.44%) have protein homologues in the other mammalian genomes.
Supplementary Table 17. Tibetan wild boar-specific genes with evidence of
transcription. (see Excel file ‘Supplementary Table 17.xls’)
Nature Genetics: doi:10.1038/ng.2811
43
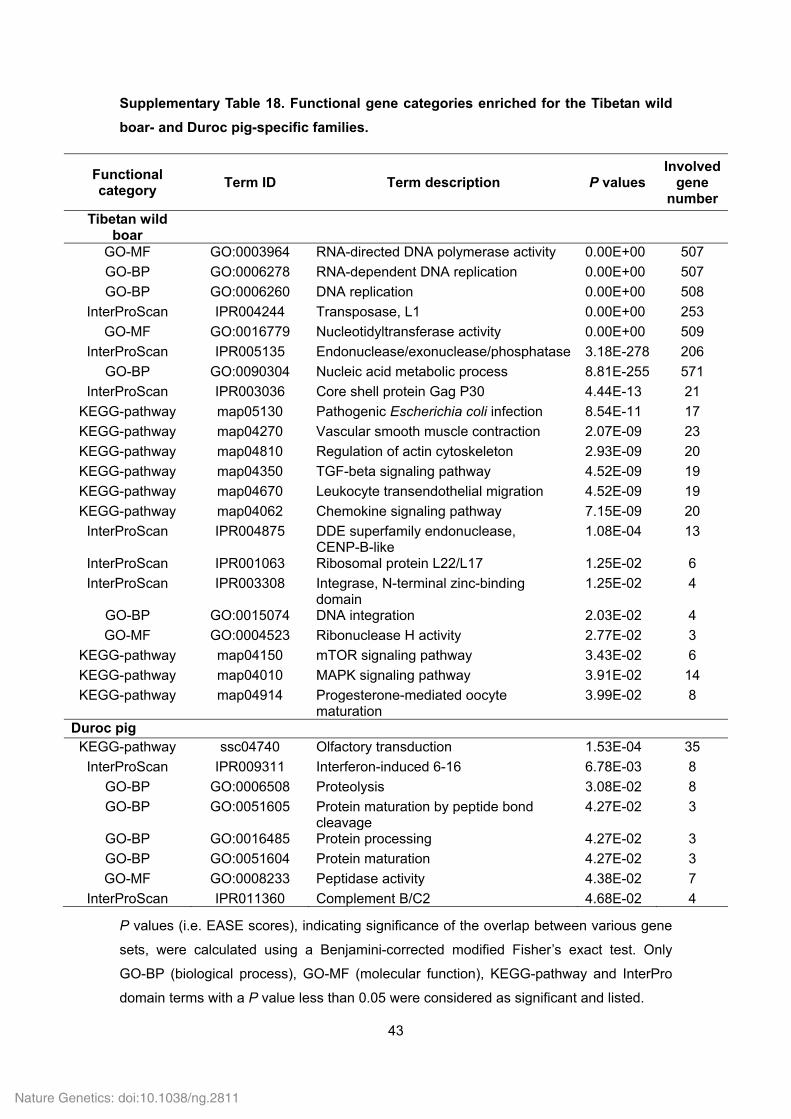
Supplementary Table 18. Functional gene categories enriched for the Tibetan wild
boar- and Duroc pig-specific families.
Functional category
Term ID Term description P values Involved
gene number
Tibetan wild boar
GO-MF GO:0003964 RNA-directed DNA polymerase activity 0.00E+00 507
GO-BP GO:0006278 RNA-dependent DNA replication 0.00E+00 507
GO-BP GO:0006260 DNA replication 0.00E+00 508
InterProScan IPR004244 Transposase, L1 0.00E+00 253
GO-MF GO:0016779 Nucleotidyltransferase activity 0.00E+00 509
InterProScan IPR005135 Endonuclease/exonuclease/phosphatase 3.18E-278 206
GO-BP GO:0090304 Nucleic acid metabolic process 8.81E-255 571
InterProScan IPR003036 Core shell protein Gag P30 4.44E-13 21
KEGG-pathway map05130 Pathogenic Escherichia coli infection 8.54E-11 17
KEGG-pathway map04270 Vascular smooth muscle contraction 2.07E-09 23
KEGG-pathway map04810 Regulation of actin cytoskeleton 2.93E-09 20
KEGG-pathway map04350 TGF-beta signaling pathway 4.52E-09 19
KEGG-pathway map04670 Leukocyte transendothelial migration 4.52E-09 19
KEGG-pathway map04062 Chemokine signaling pathway 7.15E-09 20
InterProScan IPR004875 DDE superfamily endonuclease, CENP-B-like
1.08E-04 13
InterProScan IPR001063 Ribosomal protein L22/L17 1.25E-02 6
InterProScan IPR003308 Integrase, N-terminal zinc-binding domain
1.25E-02 4
GO-BP GO:0015074 DNA integration 2.03E-02 4
GO-MF GO:0004523 Ribonuclease H activity 2.77E-02 3
KEGG-pathway map04150 mTOR signaling pathway 3.43E-02 6
KEGG-pathway map04010 MAPK signaling pathway 3.91E-02 14
KEGG-pathway map04914 Progesterone-mediated oocyte maturation
3.99E-02 8
Duroc pig KEGG-pathway ssc04740 Olfactory transduction 1.53E-04 35
InterProScan IPR009311 Interferon-induced 6-16 6.78E-03 8
GO-BP GO:0006508 Proteolysis 3.08E-02 8
GO-BP GO:0051605 Protein maturation by peptide bond cleavage
4.27E-02 3
GO-BP GO:0016485 Protein processing 4.27E-02 3
GO-BP GO:0051604 Protein maturation 4.27E-02 3
GO-MF GO:0008233 Peptidase activity 4.38E-02 7
InterProScan IPR011360 Complement B/C2 4.68E-02 4
P values (i.e. EASE scores), indicating significance of the overlap between various gene
sets, were calculated using a Benjamini-corrected modified Fisher’s exact test. Only
GO-BP (biological process), GO-MF (molecular function), KEGG-pathway and InterPro
domain terms with a P value less than 0.05 were considered as significant and listed.
Nature Genetics: doi:10.1038/ng.2811
44
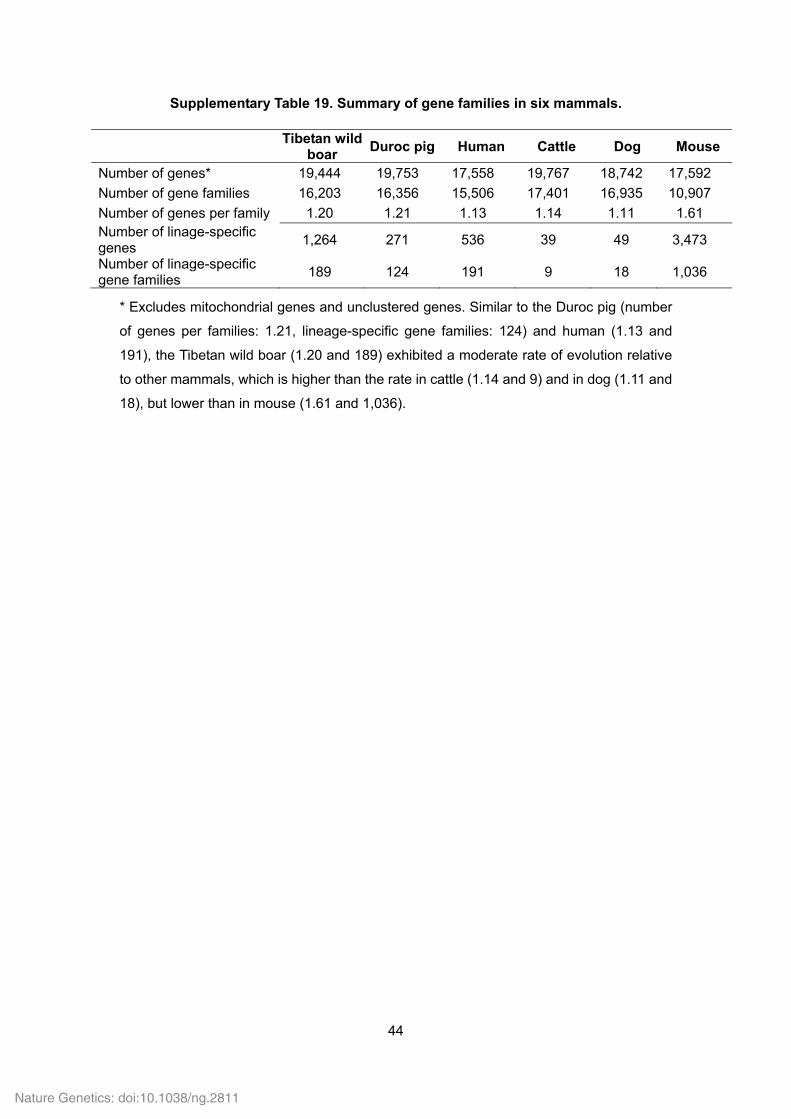
Supplementary Table 19. Summary of gene families in six mammals.
Tibetan wild boar
Duroc pig Human Cattle Dog Mouse
Number of genes* 19,444 19,753 17,558 19,767 18,742 17,592
Number of gene families 16,203 16,356 15,506 17,401 16,935 10,907
Number of genes per family 1.20 1.21 1.13 1.14 1.11 1.61 Number of linage-specific genes
1,264 271 536 39 49 3,473
Number of linage-specific gene families
189 124 191 9 18 1,036
* Excludes mitochondrial genes and unclustered genes. Similar to the Duroc pig (number
of genes per families: 1.21, lineage-specific gene families: 124) and human (1.13 and
191), the Tibetan wild boar (1.20 and 189) exhibited a moderate rate of evolution relative
to other mammals, which is higher than the rate in cattle (1.14 and 9) and in dog (1.11 and
18), but lower than in mouse (1.61 and 1,036).
Nature Genetics: doi:10.1038/ng.2811
45
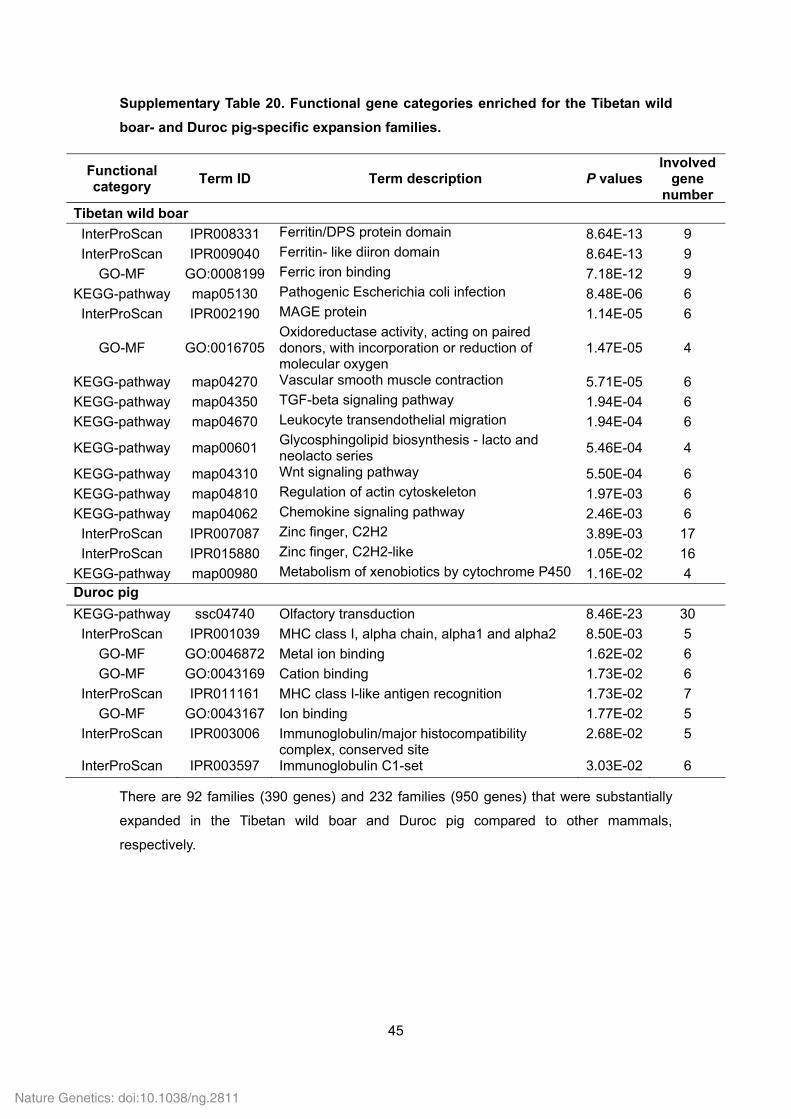
Supplementary Table 20. Functional gene categories enriched for the Tibetan wild
boar- and Duroc pig-specific expansion families.
Functional category
Term ID Term description P values Involved
gene number
Tibetan wild boar
InterProScan IPR008331 Ferritin/DPS protein domain 8.64E-13 9
InterProScan IPR009040 Ferritin- like diiron domain 8.64E-13 9
GO-MF GO:0008199 Ferric iron binding 7.18E-12 9
KEGG-pathway map05130 Pathogenic Escherichia coli infection 8.48E-06 6
InterProScan IPR002190 MAGE protein 1.14E-05 6
GO-MF GO:0016705 Oxidoreductase activity, acting on paired donors, with incorporation or reduction of molecular oxygen
1.47E-05 4
KEGG-pathway map04270 Vascular smooth muscle contraction 5.71E-05 6
KEGG-pathway map04350 TGF-beta signaling pathway 1.94E-04 6
KEGG-pathway map04670 Leukocyte transendothelial migration 1.94E-04 6
KEGG-pathway map00601 Glycosphingolipid biosynthesis - lacto and neolacto series
5.46E-04 4
KEGG-pathway map04310 Wnt signaling pathway 5.50E-04 6
KEGG-pathway map04810 Regulation of actin cytoskeleton 1.97E-03 6
KEGG-pathway map04062 Chemokine signaling pathway 2.46E-03 6
InterProScan IPR007087 Zinc finger, C2H2 3.89E-03 17
InterProScan IPR015880 Zinc finger, C2H2-like 1.05E-02 16
KEGG-pathway map00980 Metabolism of xenobiotics by cytochrome P450 1.16E-02 4 Duroc pig
KEGG-pathway ssc04740 Olfactory transduction 8.46E-23 30
InterProScan IPR001039 MHC class I, alpha chain, alpha1 and alpha2 8.50E-03 5
GO-MF GO:0046872 Metal ion binding 1.62E-02 6
GO-MF GO:0043169 Cation binding 1.73E-02 6
InterProScan IPR011161 MHC class I-like antigen recognition 1.73E-02 7
GO-MF GO:0043167 Ion binding 1.77E-02 5
InterProScan IPR003006 Immunoglobulin/major histocompatibility complex, conserved site
2.68E-02 5
InterProScan IPR003597 Immunoglobulin C1-set 3.03E-02 6
There are 92 families (390 genes) and 232 families (950 genes) that were substantially
expanded in the Tibetan wild boar and Duroc pig compared to other mammals,
respectively.
Nature Genetics: doi:10.1038/ng.2811
46
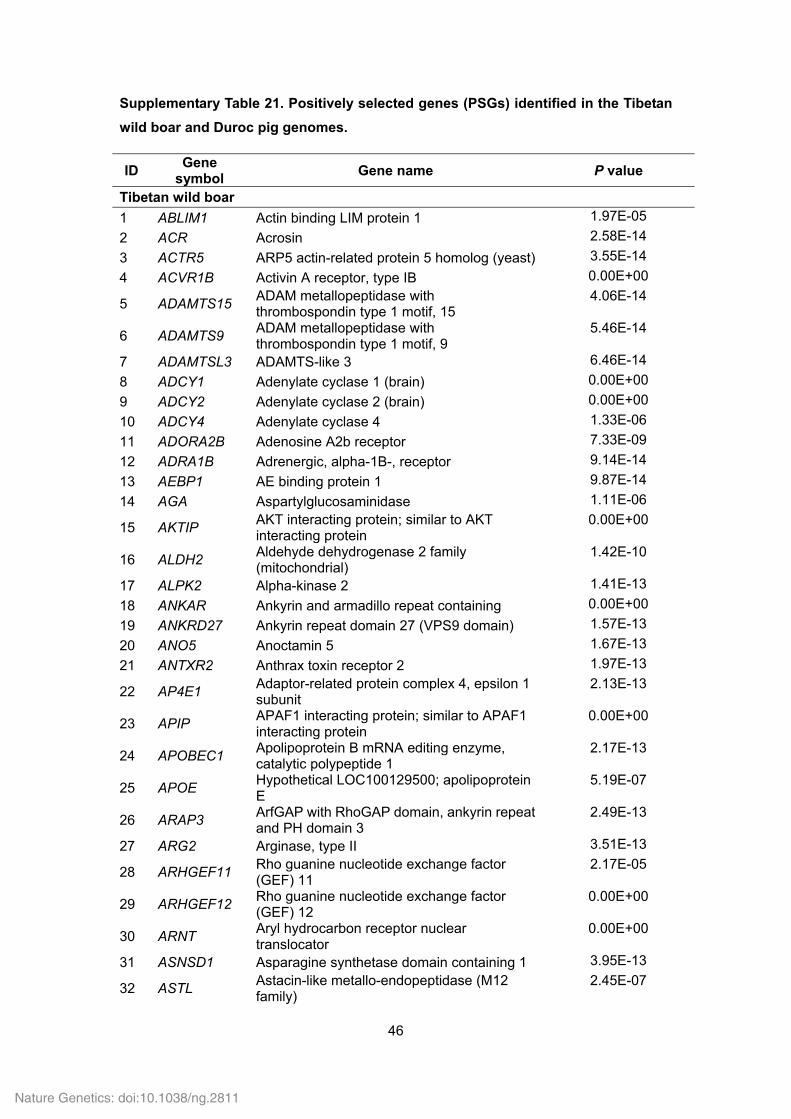
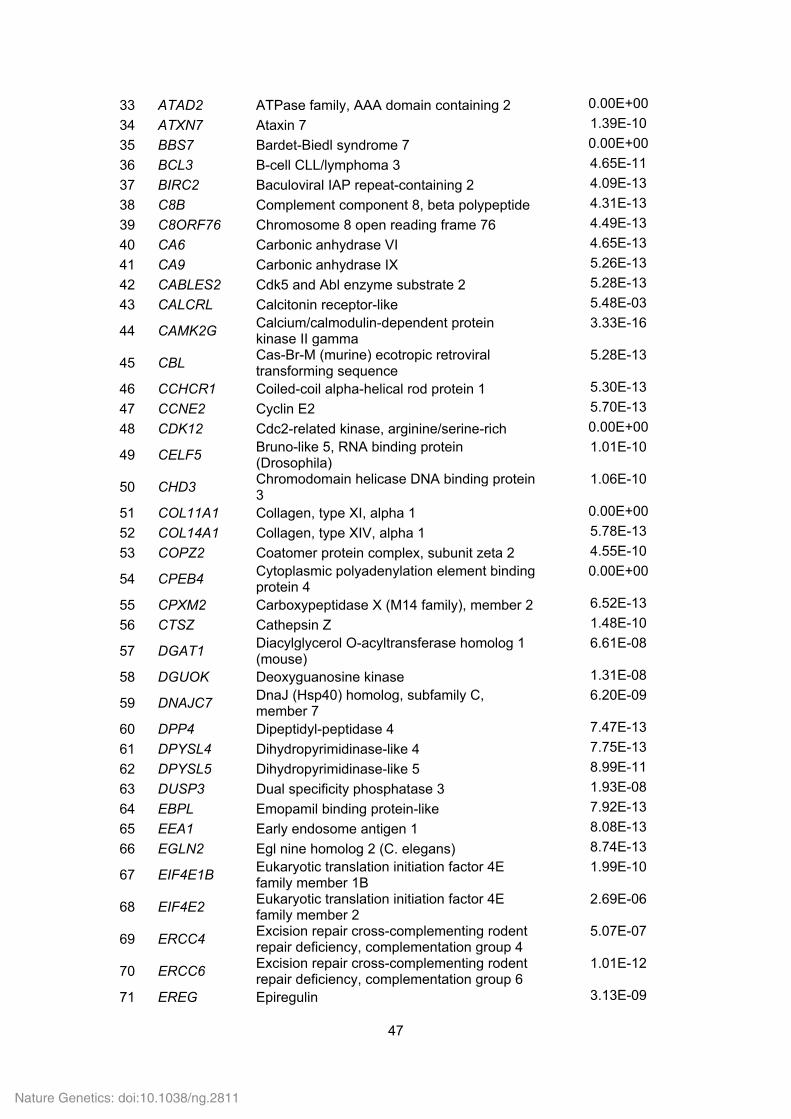
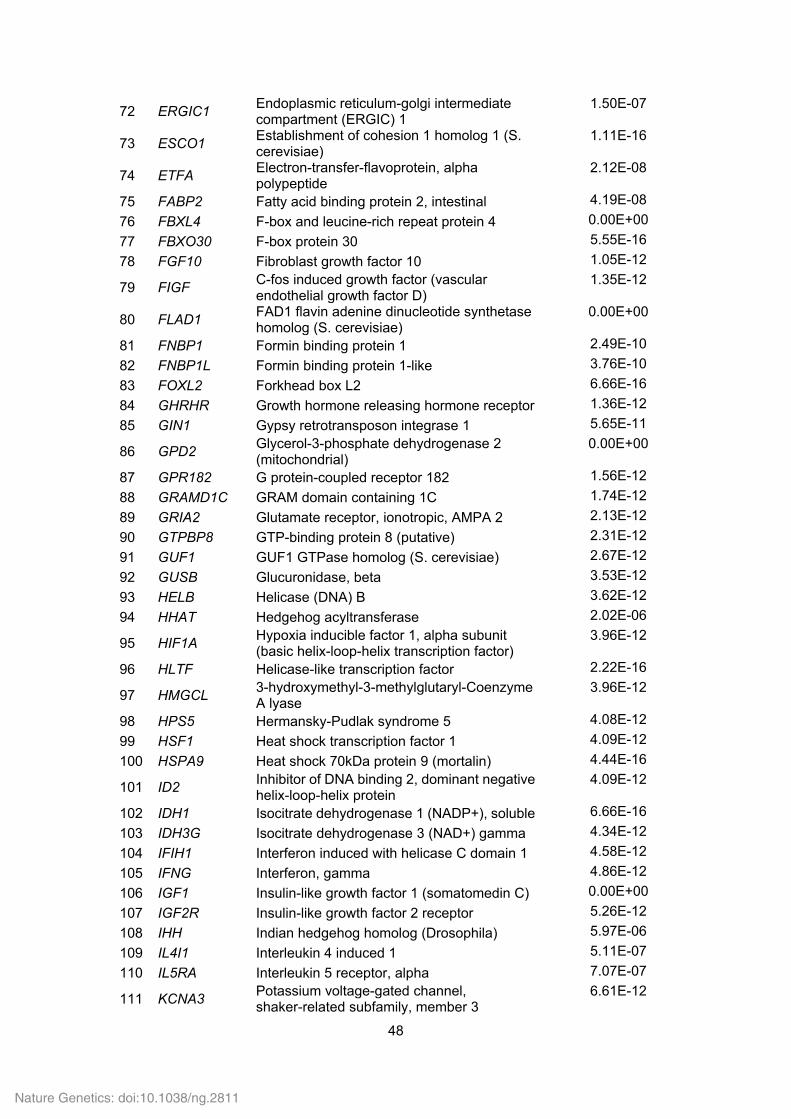
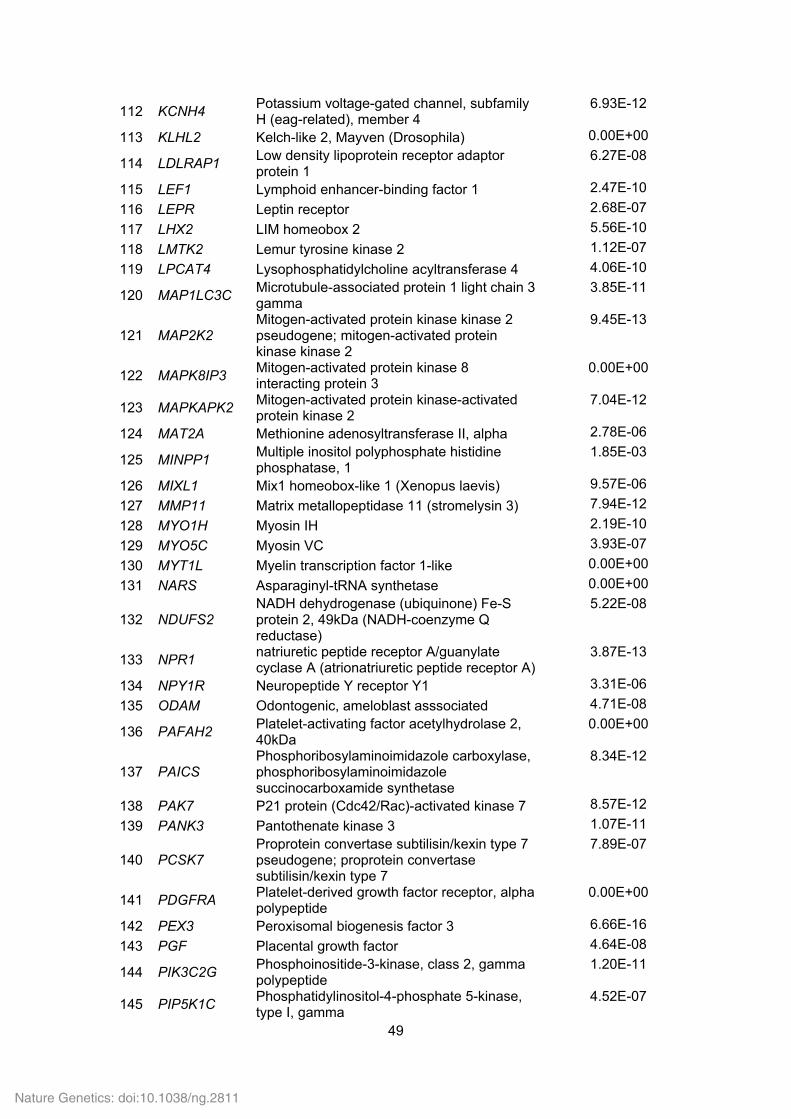
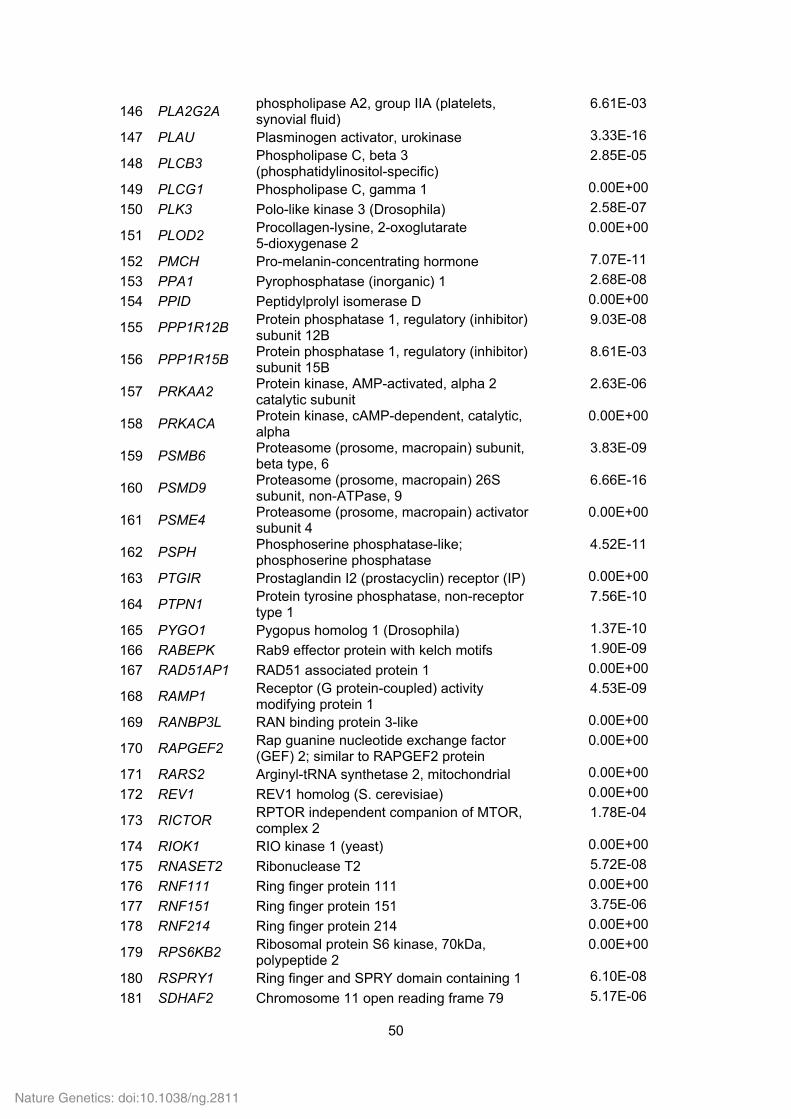
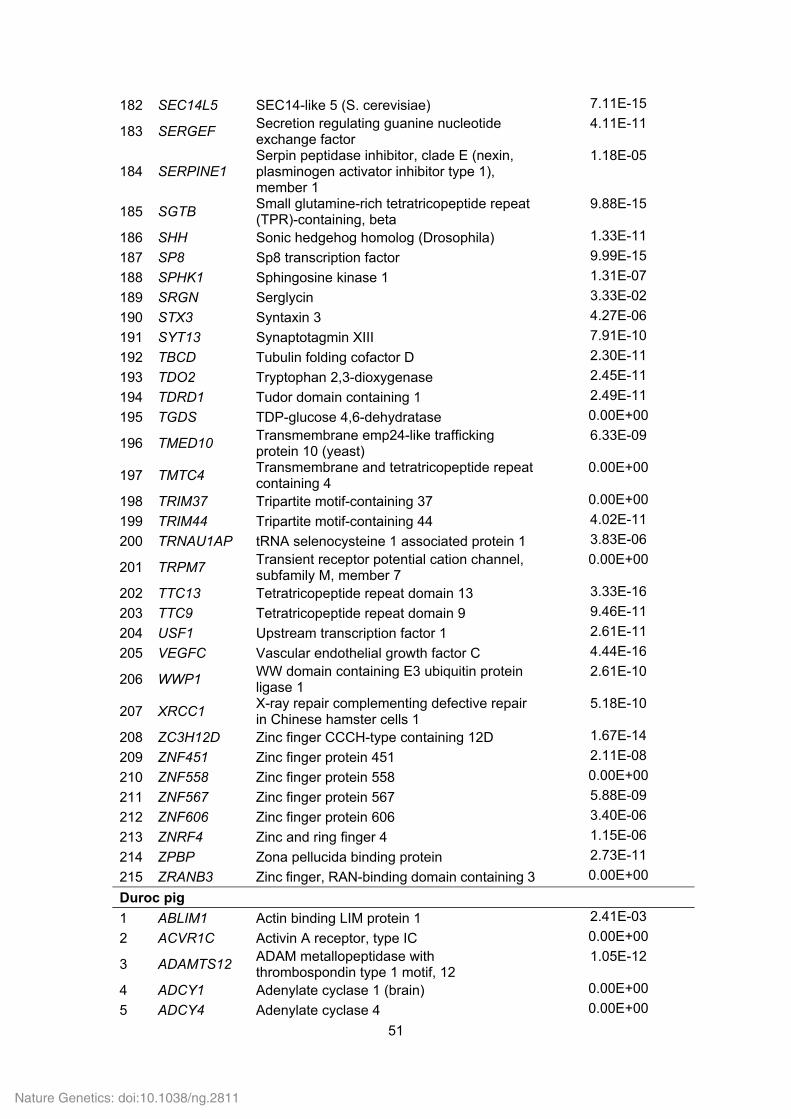
Supplementary Table 21. Positively selected genes (PSGs) identified in the Tibetan
wild boar and Duroc pig genomes.
ID Gene
symbol Gene name P value
Tibetan wild boar
1 ABLIM1 Actin binding LIM protein 1 1.97E-05
2 ACR Acrosin 2.58E-14
3 ACTR5 ARP5 actin-related protein 5 homolog (yeast) 3.55E-14
4 ACVR1B Activin A receptor, type IB 0.00E+00
5 ADAMTS15 ADAM metallopeptidase with thrombospondin type 1 motif, 15
4.06E-14
6 ADAMTS9 ADAM metallopeptidase with thrombospondin type 1 motif, 9
5.46E-14
7 ADAMTSL3 ADAMTS-like 3 6.46E-14
8 ADCY1 Adenylate cyclase 1 (brain) 0.00E+00
9 ADCY2 Adenylate cyclase 2 (brain) 0.00E+00
10 ADCY4 Adenylate cyclase 4 1.33E-06
11 ADORA2B Adenosine A2b receptor 7.33E-09
12 ADRA1B Adrenergic, alpha-1B-, receptor 9.14E-14
13 AEBP1 AE binding protein 1 9.87E-14
14 AGA Aspartylglucosaminidase 1.11E-06
15 AKTIP AKT interacting protein; similar to AKT interacting protein
0.00E+00
16 ALDH2 Aldehyde dehydrogenase 2 family (mitochondrial)
1.42E-10
17 ALPK2 Alpha-kinase 2 1.41E-13
18 ANKAR Ankyrin and armadillo repeat containing 0.00E+00
19 ANKRD27 Ankyrin repeat domain 27 (VPS9 domain) 1.57E-13
20 ANO5 Anoctamin 5 1.67E-13
21 ANTXR2 Anthrax toxin receptor 2 1.97E-13
22 AP4E1 Adaptor-related protein complex 4, epsilon 1 subunit
2.13E-13
23 APIP APAF1 interacting protein; similar to APAF1 interacting protein
0.00E+00
24 APOBEC1 Apolipoprotein B mRNA editing enzyme, catalytic polypeptide 1
2.17E-13
25 APOE Hypothetical LOC100129500; apolipoprotein E
5.19E-07
26 ARAP3 ArfGAP with RhoGAP domain, ankyrin repeat and PH domain 3
2.49E-13
27 ARG2 Arginase, type II 3.51E-13
28 ARHGEF11 Rho guanine nucleotide exchange factor (GEF) 11
2.17E-05
29 ARHGEF12 Rho guanine nucleotide exchange factor (GEF) 12
0.00E+00
30 ARNT Aryl hydrocarbon receptor nuclear translocator
0.00E+00
31 ASNSD1 Asparagine synthetase domain containing 1 3.95E-13
32 ASTL Astacin-like metallo-endopeptidase (M12 family)
2.45E-07
Nature Genetics: doi:10.1038/ng.2811
47
33 ATAD2 ATPase family, AAA domain containing 2 0.00E+00
34 ATXN7 Ataxin 7 1.39E-10
35 BBS7 Bardet-Biedl syndrome 7 0.00E+00
36 BCL3 B-cell CLL/lymphoma 3 4.65E-11
37 BIRC2 Baculoviral IAP repeat-containing 2 4.09E-13
38 C8B Complement component 8, beta polypeptide 4.31E-13
39 C8ORF76 Chromosome 8 open reading frame 76 4.49E-13
40 CA6 Carbonic anhydrase VI 4.65E-13
41 CA9 Carbonic anhydrase IX 5.26E-13
42 CABLES2 Cdk5 and Abl enzyme substrate 2 5.28E-13
43 CALCRL Calcitonin receptor-like 5.48E-03
44 CAMK2G Calcium/calmodulin-dependent protein kinase II gamma
3.33E-16
45 CBL Cas-Br-M (murine) ecotropic retroviral transforming sequence
5.28E-13
46 CCHCR1 Coiled-coil alpha-helical rod protein 1 5.30E-13
47 CCNE2 Cyclin E2 5.70E-13
48 CDK12 Cdc2-related kinase, arginine/serine-rich 0.00E+00
49 CELF5 Bruno-like 5, RNA binding protein (Drosophila)
1.01E-10
50 CHD3 Chromodomain helicase DNA binding protein 3
1.06E-10
51 COL11A1 Collagen, type XI, alpha 1 0.00E+00
52 COL14A1 Collagen, type XIV, alpha 1 5.78E-13
53 COPZ2 Coatomer protein complex, subunit zeta 2 4.55E-10
54 CPEB4 Cytoplasmic polyadenylation element binding protein 4
0.00E+00
55 CPXM2 Carboxypeptidase X (M14 family), member 2 6.52E-13
56 CTSZ Cathepsin Z 1.48E-10
57 DGAT1 Diacylglycerol O-acyltransferase homolog 1 (mouse)
6.61E-08
58 DGUOK Deoxyguanosine kinase 1.31E-08
59 DNAJC7 DnaJ (Hsp40) homolog, subfamily C, member 7
6.20E-09
60 DPP4 Dipeptidyl-peptidase 4 7.47E-13
61 DPYSL4 Dihydropyrimidinase-like 4 7.75E-13
62 DPYSL5 Dihydropyrimidinase-like 5 8.99E-11
63 DUSP3 Dual specificity phosphatase 3 1.93E-08
64 EBPL Emopamil binding protein-like 7.92E-13
65 EEA1 Early endosome antigen 1 8.08E-13
66 EGLN2 Egl nine homolog 2 (C. elegans) 8.74E-13
67 EIF4E1B Eukaryotic translation initiation factor 4E family member 1B
1.99E-10
68 EIF4E2 Eukaryotic translation initiation factor 4E family member 2
2.69E-06
69 ERCC4 Excision repair cross-complementing rodent repair deficiency, complementation group 4
5.07E-07
70 ERCC6 Excision repair cross-complementing rodent repair deficiency, complementation group 6
1.01E-12
71 EREG Epiregulin 3.13E-09
Nature Genetics: doi:10.1038/ng.2811
48
72 ERGIC1 Endoplasmic reticulum-golgi intermediate compartment (ERGIC) 1
1.50E-07
73 ESCO1 Establishment of cohesion 1 homolog 1 (S. cerevisiae)
1.11E-16
74 ETFA Electron-transfer-flavoprotein, alpha polypeptide
2.12E-08
75 FABP2 Fatty acid binding protein 2, intestinal 4.19E-08
76 FBXL4 F-box and leucine-rich repeat protein 4 0.00E+00
77 FBXO30 F-box protein 30 5.55E-16
78 FGF10 Fibroblast growth factor 10 1.05E-12
79 FIGF C-fos induced growth factor (vascular endothelial growth factor D)
1.35E-12
80 FLAD1 FAD1 flavin adenine dinucleotide synthetase homolog (S. cerevisiae)
0.00E+00
81 FNBP1 Formin binding protein 1 2.49E-10
82 FNBP1L Formin binding protein 1-like 3.76E-10
83 FOXL2 Forkhead box L2 6.66E-16
84 GHRHR Growth hormone releasing hormone receptor 1.36E-12
85 GIN1 Gypsy retrotransposon integrase 1 5.65E-11
86 GPD2 Glycerol-3-phosphate dehydrogenase 2 (mitochondrial)
0.00E+00
87 GPR182 G protein-coupled receptor 182 1.56E-12
88 GRAMD1C GRAM domain containing 1C 1.74E-12
89 GRIA2 Glutamate receptor, ionotropic, AMPA 2 2.13E-12
90 GTPBP8 GTP-binding protein 8 (putative) 2.31E-12
91 GUF1 GUF1 GTPase homolog (S. cerevisiae) 2.67E-12
92 GUSB Glucuronidase, beta 3.53E-12
93 HELB Helicase (DNA) B 3.62E-12
94 HHAT Hedgehog acyltransferase 2.02E-06
95 HIF1A Hypoxia inducible factor 1, alpha subunit (basic helix-loop-helix transcription factor)
3.96E-12
96 HLTF Helicase-like transcription factor 2.22E-16
97 HMGCL 3-hydroxymethyl-3-methylglutaryl-Coenzyme A lyase
3.96E-12
98 HPS5 Hermansky-Pudlak syndrome 5 4.08E-12
99 HSF1 Heat shock transcription factor 1 4.09E-12
100 HSPA9 Heat shock 70kDa protein 9 (mortalin) 4.44E-16
101 ID2 Inhibitor of DNA binding 2, dominant negative helix-loop-helix protein
4.09E-12
102 IDH1 Isocitrate dehydrogenase 1 (NADP+), soluble 6.66E-16
103 IDH3G Isocitrate dehydrogenase 3 (NAD+) gamma 4.34E-12
104 IFIH1 Interferon induced with helicase C domain 1 4.58E-12
105 IFNG Interferon, gamma 4.86E-12
106 IGF1 Insulin-like growth factor 1 (somatomedin C) 0.00E+00
107 IGF2R Insulin-like growth factor 2 receptor 5.26E-12
108 IHH Indian hedgehog homolog (Drosophila) 5.97E-06
109 IL4I1 Interleukin 4 induced 1 5.11E-07
110 IL5RA Interleukin 5 receptor, alpha 7.07E-07
111 KCNA3 Potassium voltage-gated channel, shaker-related subfamily, member 3
6.61E-12
Nature Genetics: doi:10.1038/ng.2811
49
112 KCNH4 Potassium voltage-gated channel, subfamily H (eag-related), member 4
6.93E-12
113 KLHL2 Kelch-like 2, Mayven (Drosophila) 0.00E+00
114 LDLRAP1 Low density lipoprotein receptor adaptor protein 1
6.27E-08
115 LEF1 Lymphoid enhancer-binding factor 1 2.47E-10
116 LEPR Leptin receptor 2.68E-07
117 LHX2 LIM homeobox 2 5.56E-10
118 LMTK2 Lemur tyrosine kinase 2 1.12E-07
119 LPCAT4 Lysophosphatidylcholine acyltransferase 4 4.06E-10
120 MAP1LC3C Microtubule-associated protein 1 light chain 3 gamma
3.85E-11
121 MAP2K2 Mitogen-activated protein kinase kinase 2 pseudogene; mitogen-activated protein kinase kinase 2
9.45E-13
122 MAPK8IP3 Mitogen-activated protein kinase 8 interacting protein 3
0.00E+00
123 MAPKAPK2 Mitogen-activated protein kinase-activated protein kinase 2
7.04E-12
124 MAT2A Methionine adenosyltransferase II, alpha 2.78E-06
125 MINPP1 Multiple inositol polyphosphate histidine phosphatase, 1
1.85E-03
126 MIXL1 Mix1 homeobox-like 1 (Xenopus laevis) 9.57E-06
127 MMP11 Matrix metallopeptidase 11 (stromelysin 3) 7.94E-12
128 MYO1H Myosin IH 2.19E-10
129 MYO5C Myosin VC 3.93E-07
130 MYT1L Myelin transcription factor 1-like 0.00E+00
131 NARS Asparaginyl-tRNA synthetase 0.00E+00
132 NDUFS2 NADH dehydrogenase (ubiquinone) Fe-S protein 2, 49kDa (NADH-coenzyme Q reductase)
5.22E-08
133 NPR1 natriuretic peptide receptor A/guanylate cyclase A (atrionatriuretic peptide receptor A)
3.87E-13
134 NPY1R Neuropeptide Y receptor Y1 3.31E-06
135 ODAM Odontogenic, ameloblast asssociated 4.71E-08
136 PAFAH2 Platelet-activating factor acetylhydrolase 2, 40kDa
0.00E+00
137 PAICS Phosphoribosylaminoimidazole carboxylase, phosphoribosylaminoimidazole succinocarboxamide synthetase
8.34E-12
138 PAK7 P21 protein (Cdc42/Rac)-activated kinase 7 8.57E-12
139 PANK3 Pantothenate kinase 3 1.07E-11
140 PCSK7 Proprotein convertase subtilisin/kexin type 7 pseudogene; proprotein convertase subtilisin/kexin type 7
7.89E-07
141 PDGFRA Platelet-derived growth factor receptor, alpha polypeptide
0.00E+00
142 PEX3 Peroxisomal biogenesis factor 3 6.66E-16
143 PGF Placental growth factor 4.64E-08
144 PIK3C2G Phosphoinositide-3-kinase, class 2, gamma polypeptide
1.20E-11
145 PIP5K1C Phosphatidylinositol-4-phosphate 5-kinase, type I, gamma
4.52E-07
Nature Genetics: doi:10.1038/ng.2811
50
146 PLA2G2A phospholipase A2, group IIA (platelets, synovial fluid)
6.61E-03
147 PLAU Plasminogen activator, urokinase 3.33E-16
148 PLCB3 Phospholipase C, beta 3 (phosphatidylinositol-specific)
2.85E-05
149 PLCG1 Phospholipase C, gamma 1 0.00E+00
150 PLK3 Polo-like kinase 3 (Drosophila) 2.58E-07
151 PLOD2 Procollagen-lysine, 2-oxoglutarate 5-dioxygenase 2
0.00E+00
152 PMCH Pro-melanin-concentrating hormone 7.07E-11
153 PPA1 Pyrophosphatase (inorganic) 1 2.68E-08
154 PPID Peptidylprolyl isomerase D 0.00E+00
155 PPP1R12B Protein phosphatase 1, regulatory (inhibitor) subunit 12B
9.03E-08
156 PPP1R15B Protein phosphatase 1, regulatory (inhibitor) subunit 15B
8.61E-03
157 PRKAA2 Protein kinase, AMP-activated, alpha 2 catalytic subunit
2.63E-06
158 PRKACA Protein kinase, cAMP-dependent, catalytic, alpha
0.00E+00
159 PSMB6 Proteasome (prosome, macropain) subunit, beta type, 6
3.83E-09
160 PSMD9 Proteasome (prosome, macropain) 26S subunit, non-ATPase, 9
6.66E-16
161 PSME4 Proteasome (prosome, macropain) activator subunit 4
0.00E+00
162 PSPH Phosphoserine phosphatase-like; phosphoserine phosphatase
4.52E-11
163 PTGIR Prostaglandin I2 (prostacyclin) receptor (IP) 0.00E+00
164 PTPN1 Protein tyrosine phosphatase, non-receptor type 1
7.56E-10
165 PYGO1 Pygopus homolog 1 (Drosophila) 1.37E-10
166 RABEPK Rab9 effector protein with kelch motifs 1.90E-09
167 RAD51AP1 RAD51 associated protein 1 0.00E+00
168 RAMP1 Receptor (G protein-coupled) activity modifying protein 1
4.53E-09
169 RANBP3L RAN binding protein 3-like 0.00E+00
170 RAPGEF2 Rap guanine nucleotide exchange factor (GEF) 2; similar to RAPGEF2 protein
0.00E+00
171 RARS2 Arginyl-tRNA synthetase 2, mitochondrial 0.00E+00
172 REV1 REV1 homolog (S. cerevisiae) 0.00E+00
173 RICTOR RPTOR independent companion of MTOR, complex 2
1.78E-04
174 RIOK1 RIO kinase 1 (yeast) 0.00E+00
175 RNASET2 Ribonuclease T2 5.72E-08
176 RNF111 Ring finger protein 111 0.00E+00
177 RNF151 Ring finger protein 151 3.75E-06
178 RNF214 Ring finger protein 214 0.00E+00
179 RPS6KB2 Ribosomal protein S6 kinase, 70kDa, polypeptide 2
0.00E+00
180 RSPRY1 Ring finger and SPRY domain containing 1 6.10E-08
181 SDHAF2 Chromosome 11 open reading frame 79 5.17E-06
Nature Genetics: doi:10.1038/ng.2811
51
182 SEC14L5 SEC14-like 5 (S. cerevisiae) 7.11E-15
183 SERGEF Secretion regulating guanine nucleotide exchange factor
4.11E-11
184 SERPINE1 Serpin peptidase inhibitor, clade E (nexin, plasminogen activator inhibitor type 1), member 1
1.18E-05
185 SGTB Small glutamine-rich tetratricopeptide repeat (TPR)-containing, beta
9.88E-15
186 SHH Sonic hedgehog homolog (Drosophila) 1.33E-11
187 SP8 Sp8 transcription factor 9.99E-15
188 SPHK1 Sphingosine kinase 1 1.31E-07
189 SRGN Serglycin 3.33E-02
190 STX3 Syntaxin 3 4.27E-06
191 SYT13 Synaptotagmin XIII 7.91E-10
192 TBCD Tubulin folding cofactor D 2.30E-11
193 TDO2 Tryptophan 2,3-dioxygenase 2.45E-11
194 TDRD1 Tudor domain containing 1 2.49E-11
195 TGDS TDP-glucose 4,6-dehydratase 0.00E+00
196 TMED10 Transmembrane emp24-like trafficking protein 10 (yeast)
6.33E-09
197 TMTC4 Transmembrane and tetratricopeptide repeat containing 4
0.00E+00
198 TRIM37 Tripartite motif-containing 37 0.00E+00
199 TRIM44 Tripartite motif-containing 44 4.02E-11
200 TRNAU1AP tRNA selenocysteine 1 associated protein 1 3.83E-06
201 TRPM7 Transient receptor potential cation channel, subfamily M, member 7
0.00E+00
202 TTC13 Tetratricopeptide repeat domain 13 3.33E-16
203 TTC9 Tetratricopeptide repeat domain 9 9.46E-11
204 USF1 Upstream transcription factor 1 2.61E-11
205 VEGFC Vascular endothelial growth factor C 4.44E-16
206 WWP1 WW domain containing E3 ubiquitin protein ligase 1
2.61E-10
207 XRCC1 X-ray repair complementing defective repair in Chinese hamster cells 1
5.18E-10
208 ZC3H12D Zinc finger CCCH-type containing 12D 1.67E-14
209 ZNF451 Zinc finger protein 451 2.11E-08
210 ZNF558 Zinc finger protein 558 0.00E+00
211 ZNF567 Zinc finger protein 567 5.88E-09
212 ZNF606 Zinc finger protein 606 3.40E-06
213 ZNRF4 Zinc and ring finger 4 1.15E-06
214 ZPBP Zona pellucida binding protein 2.73E-11
215 ZRANB3 Zinc finger, RAN-binding domain containing 3 0.00E+00
Duroc pig
1 ABLIM1 Actin binding LIM protein 1 2.41E-03
2 ACVR1C Activin A receptor, type IC 0.00E+00
3 ADAMTS12 ADAM metallopeptidase with thrombospondin type 1 motif, 12
1.05E-12
4 ADCY1 Adenylate cyclase 1 (brain) 0.00E+00
5 ADCY4 Adenylate cyclase 4 0.00E+00
Nature Genetics: doi:10.1038/ng.2811
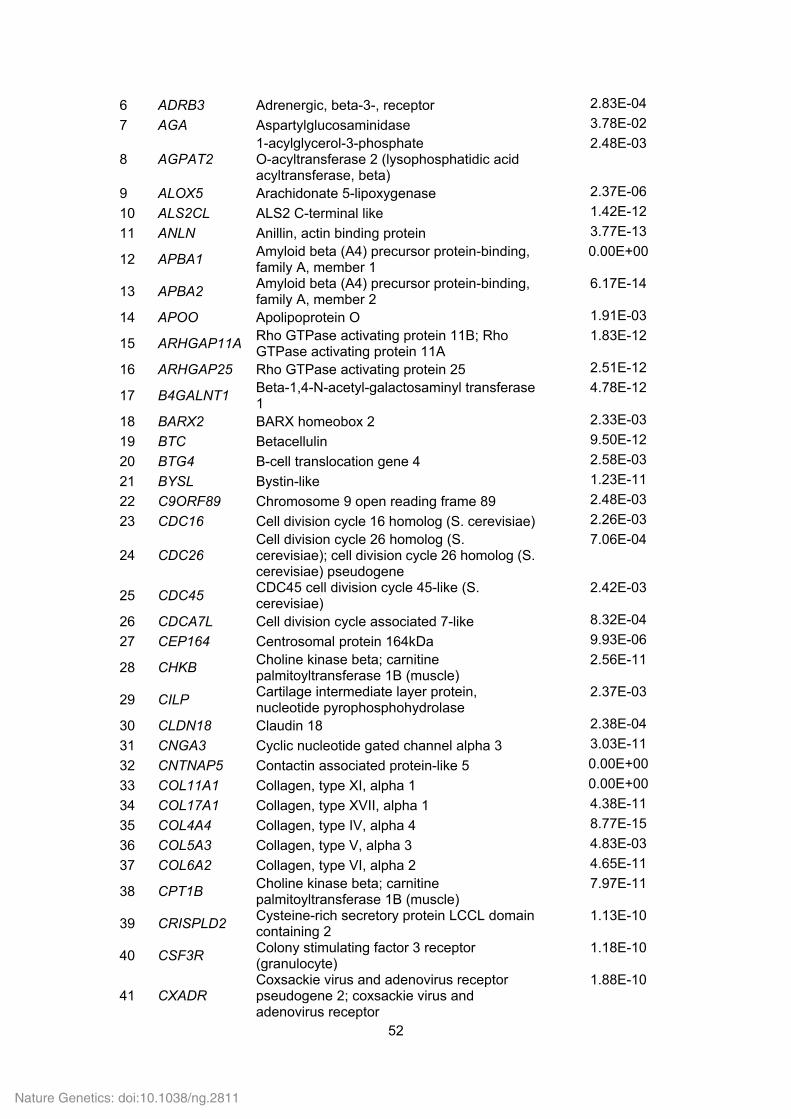
52
6 ADRB3 Adrenergic, beta-3-, receptor 2.83E-04
7 AGA Aspartylglucosaminidase 3.78E-02
8 AGPAT2 1-acylglycerol-3-phosphate O-acyltransferase 2 (lysophosphatidic acid acyltransferase, beta)
2.48E-03
9 ALOX5 Arachidonate 5-lipoxygenase 2.37E-06
10 ALS2CL ALS2 C-terminal like 1.42E-12
11 ANLN Anillin, actin binding protein 3.77E-13
12 APBA1 Amyloid beta (A4) precursor protein-binding, family A, member 1
0.00E+00
13 APBA2 Amyloid beta (A4) precursor protein-binding, family A, member 2
6.17E-14
14 APOO Apolipoprotein O 1.91E-03
15 ARHGAP11ARho GTPase activating protein 11B; Rho GTPase activating protein 11A
1.83E-12
16 ARHGAP25 Rho GTPase activating protein 25 2.51E-12
17 B4GALNT1 Beta-1,4-N-acetyl-galactosaminyl transferase 1
4.78E-12
18 BARX2 BARX homeobox 2 2.33E-03
19 BTC Betacellulin 9.50E-12
20 BTG4 B-cell translocation gene 4 2.58E-03
21 BYSL Bystin-like 1.23E-11
22 C9ORF89 Chromosome 9 open reading frame 89 2.48E-03
23 CDC16 Cell division cycle 16 homolog (S. cerevisiae) 2.26E-03
24 CDC26 Cell division cycle 26 homolog (S. cerevisiae); cell division cycle 26 homolog (S. cerevisiae) pseudogene
7.06E-04
25 CDC45 CDC45 cell division cycle 45-like (S. cerevisiae)
2.42E-03
26 CDCA7L Cell division cycle associated 7-like 8.32E-04
27 CEP164 Centrosomal protein 164kDa 9.93E-06
28 CHKB Choline kinase beta; carnitine palmitoyltransferase 1B (muscle)
2.56E-11
29 CILP Cartilage intermediate layer protein, nucleotide pyrophosphohydrolase
2.37E-03
30 CLDN18 Claudin 18 2.38E-04
31 CNGA3 Cyclic nucleotide gated channel alpha 3 3.03E-11
32 CNTNAP5 Contactin associated protein-like 5 0.00E+00
33 COL11A1 Collagen, type XI, alpha 1 0.00E+00
34 COL17A1 Collagen, type XVII, alpha 1 4.38E-11
35 COL4A4 Collagen, type IV, alpha 4 8.77E-15
36 COL5A3 Collagen, type V, alpha 3 4.83E-03
37 COL6A2 Collagen, type VI, alpha 2 4.65E-11
38 CPT1B Choline kinase beta; carnitine palmitoyltransferase 1B (muscle)
7.97E-11
39 CRISPLD2 Cysteine-rich secretory protein LCCL domain containing 2
1.13E-10
40 CSF3R Colony stimulating factor 3 receptor (granulocyte)
1.18E-10
41 CXADR Coxsackie virus and adenovirus receptor pseudogene 2; coxsackie virus and adenovirus receptor
1.88E-10
Nature Genetics: doi:10.1038/ng.2811
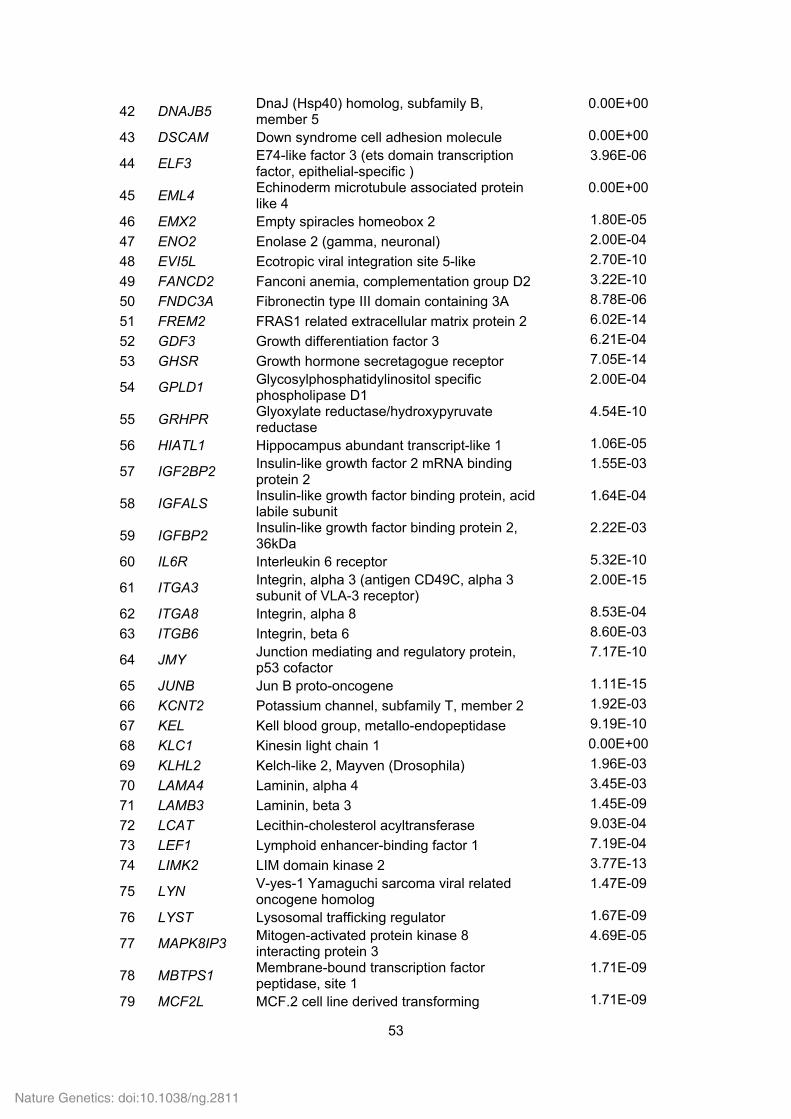
53
42 DNAJB5 DnaJ (Hsp40) homolog, subfamily B, member 5
0.00E+00
43 DSCAM Down syndrome cell adhesion molecule 0.00E+00
44 ELF3 E74-like factor 3 (ets domain transcription factor, epithelial-specific )
3.96E-06
45 EML4 Echinoderm microtubule associated protein like 4
0.00E+00
46 EMX2 Empty spiracles homeobox 2 1.80E-05
47 ENO2 Enolase 2 (gamma, neuronal) 2.00E-04
48 EVI5L Ecotropic viral integration site 5-like 2.70E-10
49 FANCD2 Fanconi anemia, complementation group D2 3.22E-10
50 FNDC3A Fibronectin type III domain containing 3A 8.78E-06
51 FREM2 FRAS1 related extracellular matrix protein 2 6.02E-14
52 GDF3 Growth differentiation factor 3 6.21E-04
53 GHSR Growth hormone secretagogue receptor 7.05E-14
54 GPLD1 Glycosylphosphatidylinositol specific phospholipase D1
2.00E-04
55 GRHPR Glyoxylate reductase/hydroxypyruvate reductase
4.54E-10
56 HIATL1 Hippocampus abundant transcript-like 1 1.06E-05
57 IGF2BP2 Insulin-like growth factor 2 mRNA binding protein 2
1.55E-03
58 IGFALS Insulin-like growth factor binding protein, acid labile subunit
1.64E-04
59 IGFBP2 Insulin-like growth factor binding protein 2, 36kDa
2.22E-03
60 IL6R Interleukin 6 receptor 5.32E-10
61 ITGA3 Integrin, alpha 3 (antigen CD49C, alpha 3 subunit of VLA-3 receptor)
2.00E-15
62 ITGA8 Integrin, alpha 8 8.53E-04
63 ITGB6 Integrin, beta 6 8.60E-03
64 JMY Junction mediating and regulatory protein, p53 cofactor
7.17E-10
65 JUNB Jun B proto-oncogene 1.11E-15
66 KCNT2 Potassium channel, subfamily T, member 2 1.92E-03
67 KEL Kell blood group, metallo-endopeptidase 9.19E-10
68 KLC1 Kinesin light chain 1 0.00E+00
69 KLHL2 Kelch-like 2, Mayven (Drosophila) 1.96E-03
70 LAMA4 Laminin, alpha 4 3.45E-03
71 LAMB3 Laminin, beta 3 1.45E-09
72 LCAT Lecithin-cholesterol acyltransferase 9.03E-04
73 LEF1 Lymphoid enhancer-binding factor 1 7.19E-04
74 LIMK2 LIM domain kinase 2 3.77E-13
75 LYN V-yes-1 Yamaguchi sarcoma viral related oncogene homolog
1.47E-09
76 LYST Lysosomal trafficking regulator 1.67E-09
77 MAPK8IP3 Mitogen-activated protein kinase 8 interacting protein 3
4.69E-05
78 MBTPS1 Membrane-bound transcription factor peptidase, site 1
1.71E-09
79 MCF2L MCF.2 cell line derived transforming 1.71E-09
Nature Genetics: doi:10.1038/ng.2811
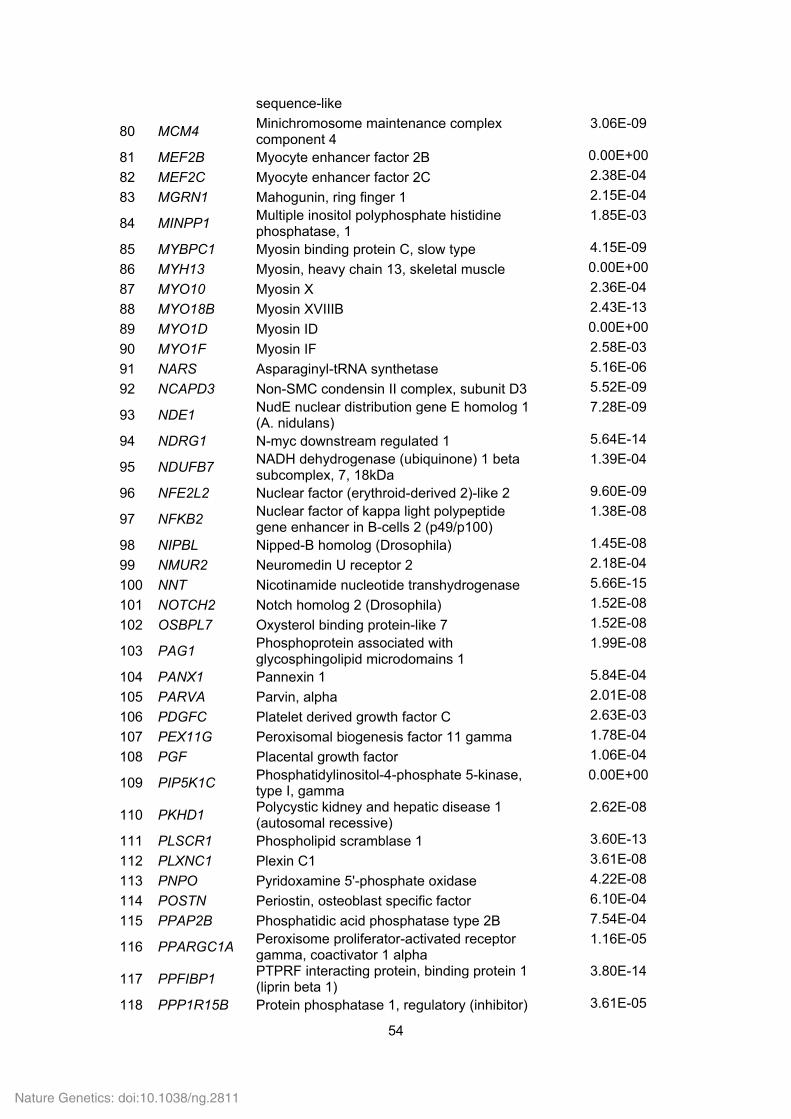
54
sequence-like
80 MCM4 Minichromosome maintenance complex component 4
3.06E-09
81 MEF2B Myocyte enhancer factor 2B 0.00E+00
82 MEF2C Myocyte enhancer factor 2C 2.38E-04
83 MGRN1 Mahogunin, ring finger 1 2.15E-04
84 MINPP1 Multiple inositol polyphosphate histidine phosphatase, 1
1.85E-03
85 MYBPC1 Myosin binding protein C, slow type 4.15E-09
86 MYH13 Myosin, heavy chain 13, skeletal muscle 0.00E+00
87 MYO10 Myosin X 2.36E-04
88 MYO18B Myosin XVIIIB 2.43E-13
89 MYO1D Myosin ID 0.00E+00
90 MYO1F Myosin IF 2.58E-03
91 NARS Asparaginyl-tRNA synthetase 5.16E-06
92 NCAPD3 Non-SMC condensin II complex, subunit D3 5.52E-09
93 NDE1 NudE nuclear distribution gene E homolog 1 (A. nidulans)
7.28E-09
94 NDRG1 N-myc downstream regulated 1 5.64E-14
95 NDUFB7 NADH dehydrogenase (ubiquinone) 1 beta subcomplex, 7, 18kDa
1.39E-04
96 NFE2L2 Nuclear factor (erythroid-derived 2)-like 2 9.60E-09
97 NFKB2 Nuclear factor of kappa light polypeptide gene enhancer in B-cells 2 (p49/p100)
1.38E-08
98 NIPBL Nipped-B homolog (Drosophila) 1.45E-08
99 NMUR2 Neuromedin U receptor 2 2.18E-04
100 NNT Nicotinamide nucleotide transhydrogenase 5.66E-15
101 NOTCH2 Notch homolog 2 (Drosophila) 1.52E-08
102 OSBPL7 Oxysterol binding protein-like 7 1.52E-08
103 PAG1 Phosphoprotein associated with glycosphingolipid microdomains 1
1.99E-08
104 PANX1 Pannexin 1 5.84E-04
105 PARVA Parvin, alpha 2.01E-08
106 PDGFC Platelet derived growth factor C 2.63E-03
107 PEX11G Peroxisomal biogenesis factor 11 gamma 1.78E-04
108 PGF Placental growth factor 1.06E-04
109 PIP5K1C Phosphatidylinositol-4-phosphate 5-kinase, type I, gamma
0.00E+00
110 PKHD1 Polycystic kidney and hepatic disease 1 (autosomal recessive)
2.62E-08
111 PLSCR1 Phospholipid scramblase 1 3.60E-13
112 PLXNC1 Plexin C1 3.61E-08
113 PNPO Pyridoxamine 5'-phosphate oxidase 4.22E-08
114 POSTN Periostin, osteoblast specific factor 6.10E-04
115 PPAP2B Phosphatidic acid phosphatase type 2B 7.54E-04
116 PPARGC1A Peroxisome proliferator-activated receptor gamma, coactivator 1 alpha
1.16E-05
117 PPFIBP1 PTPRF interacting protein, binding protein 1 (liprin beta 1)
3.80E-14
118 PPP1R15B Protein phosphatase 1, regulatory (inhibitor) 3.61E-05
Nature Genetics: doi:10.1038/ng.2811
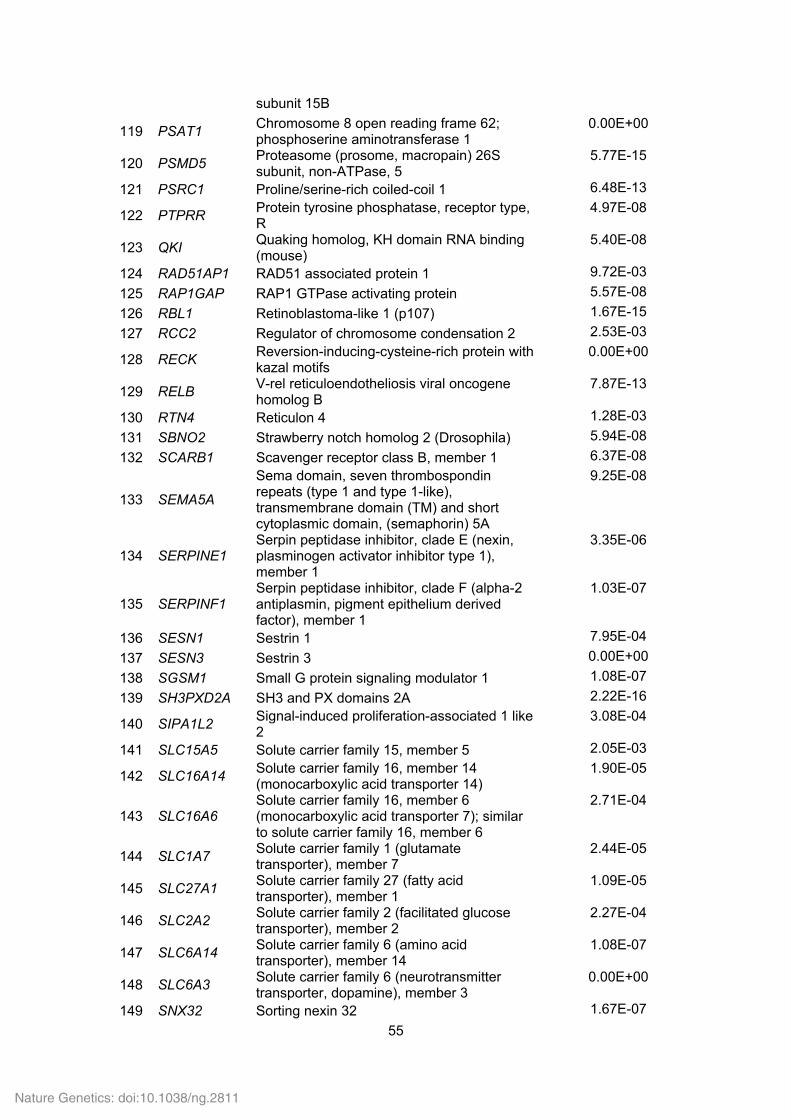
55
subunit 15B
119 PSAT1 Chromosome 8 open reading frame 62; phosphoserine aminotransferase 1
0.00E+00
120 PSMD5 Proteasome (prosome, macropain) 26S subunit, non-ATPase, 5
5.77E-15
121 PSRC1 Proline/serine-rich coiled-coil 1 6.48E-13
122 PTPRR Protein tyrosine phosphatase, receptor type, R
4.97E-08
123 QKI Quaking homolog, KH domain RNA binding (mouse)
5.40E-08
124 RAD51AP1 RAD51 associated protein 1 9.72E-03
125 RAP1GAP RAP1 GTPase activating protein 5.57E-08
126 RBL1 Retinoblastoma-like 1 (p107) 1.67E-15
127 RCC2 Regulator of chromosome condensation 2 2.53E-03
128 RECK Reversion-inducing-cysteine-rich protein with kazal motifs
0.00E+00
129 RELB V-rel reticuloendotheliosis viral oncogene homolog B
7.87E-13
130 RTN4 Reticulon 4 1.28E-03
131 SBNO2 Strawberry notch homolog 2 (Drosophila) 5.94E-08
132 SCARB1 Scavenger receptor class B, member 1 6.37E-08
133 SEMA5A
Sema domain, seven thrombospondin repeats (type 1 and type 1-like), transmembrane domain (TM) and short cytoplasmic domain, (semaphorin) 5A
9.25E-08
134 SERPINE1 Serpin peptidase inhibitor, clade E (nexin, plasminogen activator inhibitor type 1), member 1
3.35E-06
135 SERPINF1 Serpin peptidase inhibitor, clade F (alpha-2 antiplasmin, pigment epithelium derived factor), member 1
1.03E-07
136 SESN1 Sestrin 1 7.95E-04
137 SESN3 Sestrin 3 0.00E+00
138 SGSM1 Small G protein signaling modulator 1 1.08E-07
139 SH3PXD2A SH3 and PX domains 2A 2.22E-16
140 SIPA1L2 Signal-induced proliferation-associated 1 like 2
3.08E-04
141 SLC15A5 Solute carrier family 15, member 5 2.05E-03
142 SLC16A14 Solute carrier family 16, member 14 (monocarboxylic acid transporter 14)
1.90E-05
143 SLC16A6 Solute carrier family 16, member 6 (monocarboxylic acid transporter 7); similar to solute carrier family 16, member 6
2.71E-04
144 SLC1A7 Solute carrier family 1 (glutamate transporter), member 7
2.44E-05
145 SLC27A1 Solute carrier family 27 (fatty acid transporter), member 1
1.09E-05
146 SLC2A2 Solute carrier family 2 (facilitated glucose transporter), member 2
2.27E-04
147 SLC6A14 Solute carrier family 6 (amino acid transporter), member 14
1.08E-07
148 SLC6A3 Solute carrier family 6 (neurotransmitter transporter, dopamine), member 3
0.00E+00
149 SNX32 Sorting nexin 32 1.67E-07
Nature Genetics: doi:10.1038/ng.2811
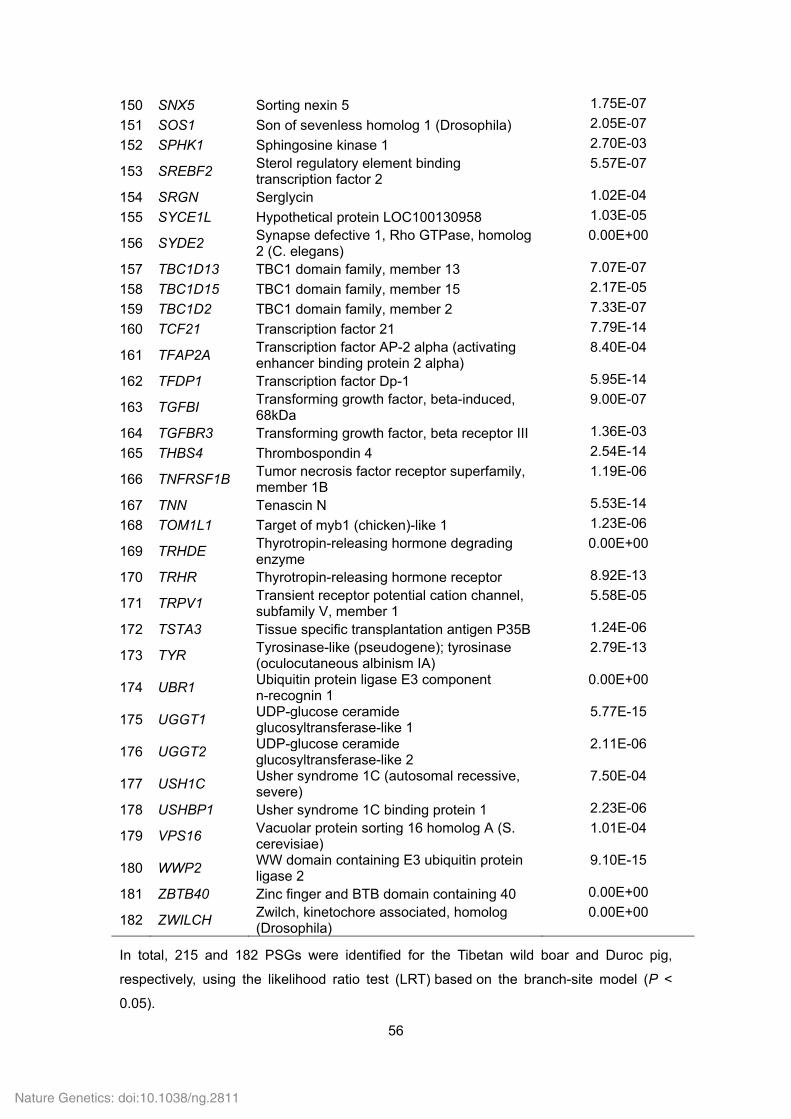
56
150 SNX5 Sorting nexin 5 1.75E-07
151 SOS1 Son of sevenless homolog 1 (Drosophila) 2.05E-07
152 SPHK1 Sphingosine kinase 1 2.70E-03
153 SREBF2 Sterol regulatory element binding transcription factor 2
5.57E-07
154 SRGN Serglycin 1.02E-04
155 SYCE1L Hypothetical protein LOC100130958 1.03E-05
156 SYDE2 Synapse defective 1, Rho GTPase, homolog 2 (C. elegans)
0.00E+00
157 TBC1D13 TBC1 domain family, member 13 7.07E-07
158 TBC1D15 TBC1 domain family, member 15 2.17E-05
159 TBC1D2 TBC1 domain family, member 2 7.33E-07
160 TCF21 Transcription factor 21 7.79E-14
161 TFAP2A Transcription factor AP-2 alpha (activating enhancer binding protein 2 alpha)
8.40E-04
162 TFDP1 Transcription factor Dp-1 5.95E-14
163 TGFBI Transforming growth factor, beta-induced, 68kDa
9.00E-07
164 TGFBR3 Transforming growth factor, beta receptor III 1.36E-03
165 THBS4 Thrombospondin 4 2.54E-14
166 TNFRSF1B Tumor necrosis factor receptor superfamily, member 1B
1.19E-06
167 TNN Tenascin N 5.53E-14
168 TOM1L1 Target of myb1 (chicken)-like 1 1.23E-06
169 TRHDE Thyrotropin-releasing hormone degrading enzyme
0.00E+00
170 TRHR Thyrotropin-releasing hormone receptor 8.92E-13
171 TRPV1 Transient receptor potential cation channel, subfamily V, member 1
5.58E-05
172 TSTA3 Tissue specific transplantation antigen P35B 1.24E-06
173 TYR Tyrosinase-like (pseudogene); tyrosinase (oculocutaneous albinism IA)
2.79E-13
174 UBR1 Ubiquitin protein ligase E3 component n-recognin 1
0.00E+00
175 UGGT1 UDP-glucose ceramide glucosyltransferase-like 1
5.77E-15
176 UGGT2 UDP-glucose ceramide glucosyltransferase-like 2
2.11E-06
177 USH1C Usher syndrome 1C (autosomal recessive, severe)
7.50E-04
178 USHBP1 Usher syndrome 1C binding protein 1 2.23E-06
179 VPS16 Vacuolar protein sorting 16 homolog A (S. cerevisiae)
1.01E-04
180 WWP2 WW domain containing E3 ubiquitin protein ligase 2
9.10E-15
181 ZBTB40 Zinc finger and BTB domain containing 40 0.00E+00
182 ZWILCH Zwilch, kinetochore associated, homolog (Drosophila)
0.00E+00
In total, 215 and 182 PSGs were identified for the Tibetan wild boar and Duroc pig,
respectively, using the likelihood ratio test (LRT) based on the branch-site model (P <
0.05).
Nature Genetics: doi:10.1038/ng.2811
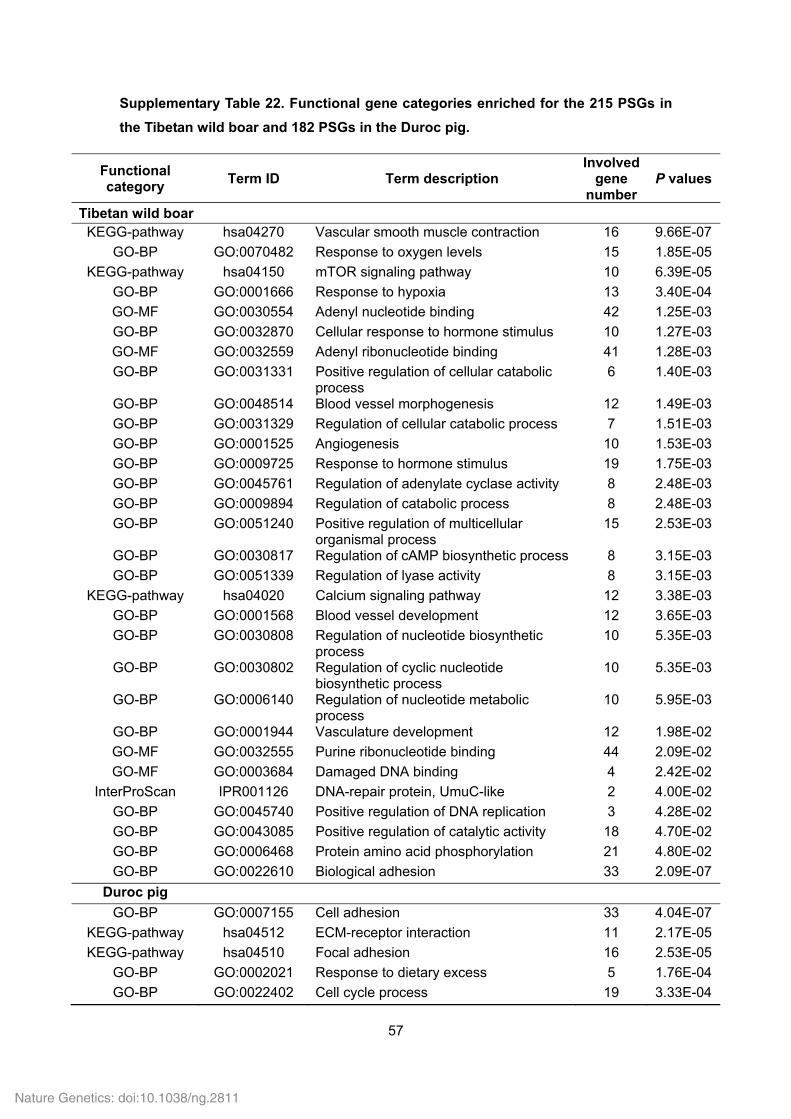
57
Supplementary Table 22. Functional gene categories enriched for the 215 PSGs in
the Tibetan wild boar and 182 PSGs in the Duroc pig.
Functional category
Term ID Term description Involved
gene number
P values
Tibetan wild boar KEGG-pathway hsa04270 Vascular smooth muscle contraction 16 9.66E-07
GO-BP GO:0070482 Response to oxygen levels 15 1.85E-05
KEGG-pathway hsa04150 mTOR signaling pathway 10 6.39E-05
GO-BP GO:0001666 Response to hypoxia 13 3.40E-04
GO-MF GO:0030554 Adenyl nucleotide binding 42 1.25E-03
GO-BP GO:0032870 Cellular response to hormone stimulus 10 1.27E-03
GO-MF GO:0032559 Adenyl ribonucleotide binding 41 1.28E-03
GO-BP GO:0031331 Positive regulation of cellular catabolic process
6 1.40E-03
GO-BP GO:0048514 Blood vessel morphogenesis 12 1.49E-03
GO-BP GO:0031329 Regulation of cellular catabolic process 7 1.51E-03
GO-BP GO:0001525 Angiogenesis 10 1.53E-03
GO-BP GO:0009725 Response to hormone stimulus 19 1.75E-03
GO-BP GO:0045761 Regulation of adenylate cyclase activity 8 2.48E-03
GO-BP GO:0009894 Regulation of catabolic process 8 2.48E-03
GO-BP GO:0051240 Positive regulation of multicellular organismal process
15 2.53E-03
GO-BP GO:0030817 Regulation of cAMP biosynthetic process 8 3.15E-03
GO-BP GO:0051339 Regulation of lyase activity 8 3.15E-03
KEGG-pathway hsa04020 Calcium signaling pathway 12 3.38E-03
GO-BP GO:0001568 Blood vessel development 12 3.65E-03
GO-BP GO:0030808 Regulation of nucleotide biosynthetic process
10 5.35E-03
GO-BP GO:0030802 Regulation of cyclic nucleotide biosynthetic process
10 5.35E-03
GO-BP GO:0006140 Regulation of nucleotide metabolic process
10 5.95E-03
GO-BP GO:0001944 Vasculature development 12 1.98E-02
GO-MF GO:0032555 Purine ribonucleotide binding 44 2.09E-02
GO-MF GO:0003684 Damaged DNA binding 4 2.42E-02
InterProScan IPR001126 DNA-repair protein, UmuC-like 2 4.00E-02
GO-BP GO:0045740 Positive regulation of DNA replication 3 4.28E-02
GO-BP GO:0043085 Positive regulation of catalytic activity 18 4.70E-02
GO-BP GO:0006468 Protein amino acid phosphorylation 21 4.80E-02
GO-BP GO:0022610 Biological adhesion 33 2.09E-07
Duroc pig
GO-BP GO:0007155 Cell adhesion 33 4.04E-07
KEGG-pathway hsa04512 ECM-receptor interaction 11 2.17E-05
KEGG-pathway hsa04510 Focal adhesion 16 2.53E-05
GO-BP GO:0002021 Response to dietary excess 5 1.76E-04
GO-BP GO:0022402 Cell cycle process 19 3.33E-04
Nature Genetics: doi:10.1038/ng.2811
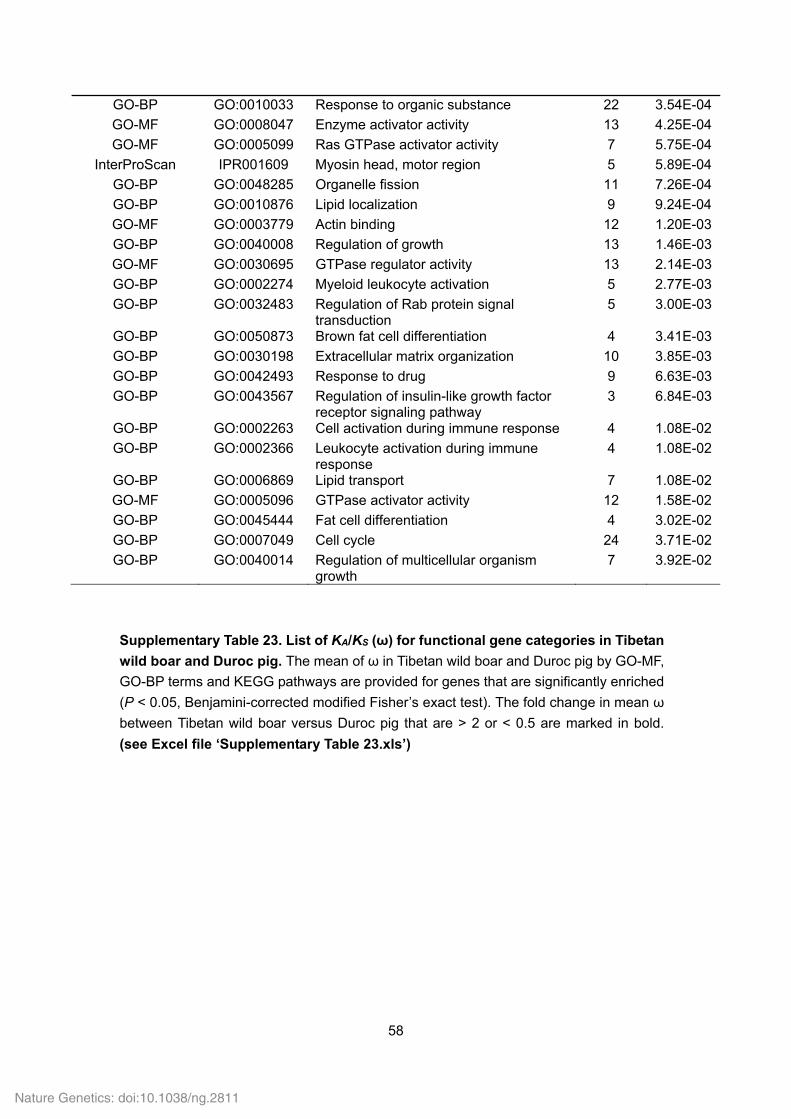
58
GO-BP GO:0010033 Response to organic substance 22 3.54E-04
GO-MF GO:0008047 Enzyme activator activity 13 4.25E-04
GO-MF GO:0005099 Ras GTPase activator activity 7 5.75E-04
InterProScan IPR001609 Myosin head, motor region 5 5.89E-04
GO-BP GO:0048285 Organelle fission 11 7.26E-04
GO-BP GO:0010876 Lipid localization 9 9.24E-04
GO-MF GO:0003779 Actin binding 12 1.20E-03
GO-BP GO:0040008 Regulation of growth 13 1.46E-03
GO-MF GO:0030695 GTPase regulator activity 13 2.14E-03
GO-BP GO:0002274 Myeloid leukocyte activation 5 2.77E-03
GO-BP GO:0032483 Regulation of Rab protein signal transduction
5 3.00E-03
GO-BP GO:0050873 Brown fat cell differentiation 4 3.41E-03
GO-BP GO:0030198 Extracellular matrix organization 10 3.85E-03
GO-BP GO:0042493 Response to drug 9 6.63E-03
GO-BP GO:0043567 Regulation of insulin-like growth factor receptor signaling pathway
3 6.84E-03
GO-BP GO:0002263 Cell activation during immune response 4 1.08E-02
GO-BP GO:0002366 Leukocyte activation during immune response
4 1.08E-02
GO-BP GO:0006869 Lipid transport 7 1.08E-02
GO-MF GO:0005096 GTPase activator activity 12 1.58E-02
GO-BP GO:0045444 Fat cell differentiation 4 3.02E-02
GO-BP GO:0007049 Cell cycle 24 3.71E-02
GO-BP GO:0040014 Regulation of multicellular organism growth
7 3.92E-02
Supplementary Table 23. List of KA/KS (ω) for functional gene categories in Tibetan
wild boar and Duroc pig. The mean of ω in Tibetan wild boar and Duroc pig by GO-MF,
GO-BP terms and KEGG pathways are provided for genes that are significantly enriched
(P < 0.05, Benjamini-corrected modified Fisher’s exact test). The fold change in mean ω
between Tibetan wild boar versus Duroc pig that are > 2 or < 0.5 are marked in bold.
(see Excel file ‘Supplementary Table 23.xls’)
Nature Genetics: doi:10.1038/ng.2811
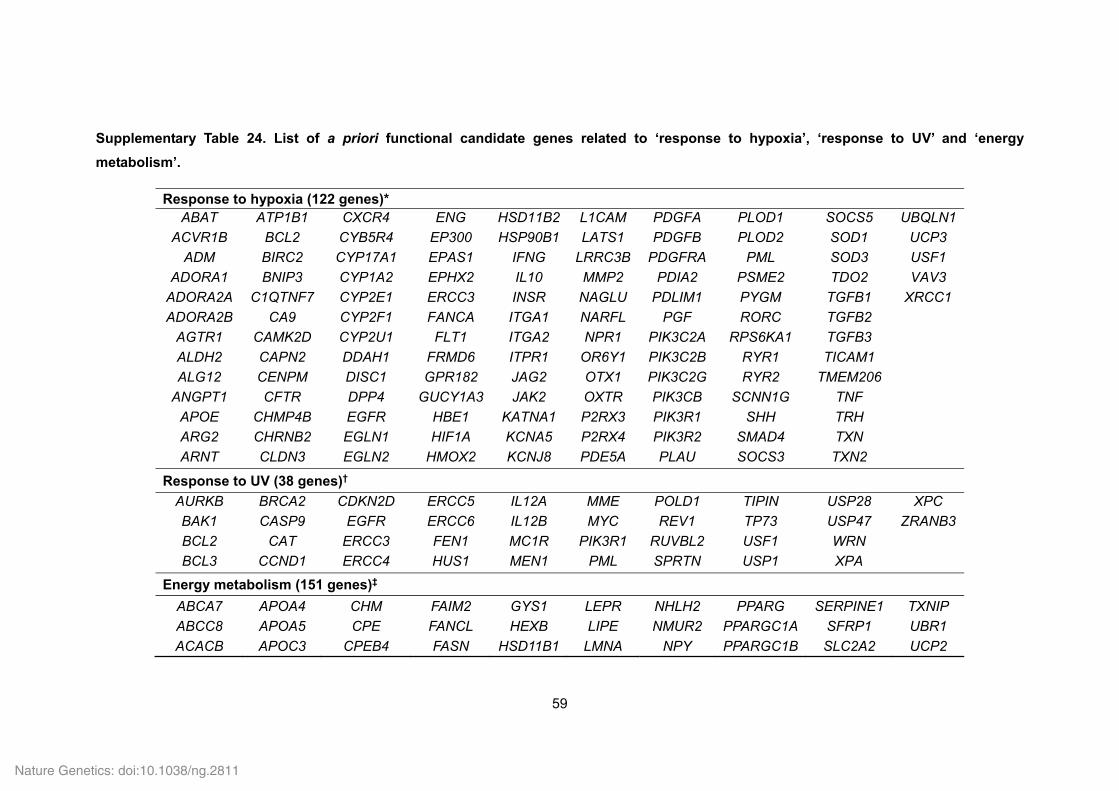
59
Supplementary Table 24. List of a priori functional candidate genes related to ‘response to hypoxia’, ‘response to UV’ and ‘energy
metabolism’.
Response to hypoxia (122 genes)* ABAT ATP1B1 CXCR4 ENG HSD11B2 L1CAM PDGFA PLOD1 SOCS5 UBQLN1
ACVR1B BCL2 CYB5R4 EP300 HSP90B1 LATS1 PDGFB PLOD2 SOD1 UCP3
ADM BIRC2 CYP17A1 EPAS1 IFNG LRRC3B PDGFRA PML SOD3 USF1
ADORA1 BNIP3 CYP1A2 EPHX2 IL10 MMP2 PDIA2 PSME2 TDO2 VAV3
ADORA2A C1QTNF7 CYP2E1 ERCC3 INSR NAGLU PDLIM1 PYGM TGFB1 XRCC1
ADORA2B CA9 CYP2F1 FANCA ITGA1 NARFL PGF RORC TGFB2
AGTR1 CAMK2D CYP2U1 FLT1 ITGA2 NPR1 PIK3C2A RPS6KA1 TGFB3
ALDH2 CAPN2 DDAH1 FRMD6 ITPR1 OR6Y1 PIK3C2B RYR1 TICAM1
ALG12 CENPM DISC1 GPR182 JAG2 OTX1 PIK3C2G RYR2 TMEM206
ANGPT1 CFTR DPP4 GUCY1A3 JAK2 OXTR PIK3CB SCNN1G TNF
APOE CHMP4B EGFR HBE1 KATNA1 P2RX3 PIK3R1 SHH TRH
ARG2 CHRNB2 EGLN1 HIF1A KCNA5 P2RX4 PIK3R2 SMAD4 TXN
ARNT CLDN3 EGLN2 HMOX2 KCNJ8 PDE5A PLAU SOCS3 TXN2
Response to UV (38 genes)†
AURKB BRCA2 CDKN2D ERCC5 IL12A MME POLD1 TIPIN USP28 XPC
BAK1 CASP9 EGFR ERCC6 IL12B MYC REV1 TP73 USP47 ZRANB3
BCL2 CAT ERCC3 FEN1 MC1R PIK3R1 RUVBL2 USF1 WRN
BCL3 CCND1 ERCC4 HUS1 MEN1 PML SPRTN USP1 XPA
Energy metabolism (151 genes)‡
ABCA7 APOA4 CHM FAIM2 GYS1 LEPR NHLH2 PPARG SERPINE1 TXNIP
ABCC8 APOA5 CPE FANCL HEXB LIPE NMUR2 PPARGC1A SFRP1 UBR1
ACACB APOC3 CPEB4 FASN HSD11B1 LMNA NPY PPARGC1B SLC2A2 UCP2
Nature Genetics: doi:10.1038/ng.2811
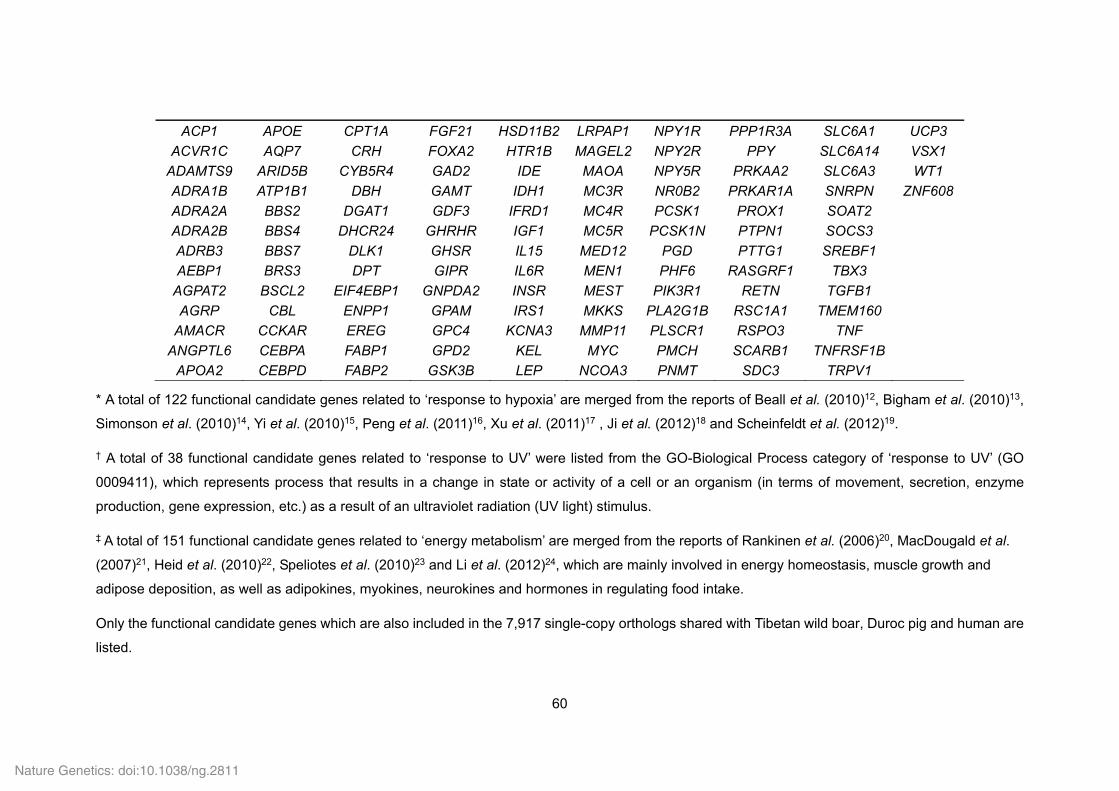
60
ACP1 APOE CPT1A FGF21 HSD11B2 LRPAP1 NPY1R PPP1R3A SLC6A1 UCP3
ACVR1C AQP7 CRH FOXA2 HTR1B MAGEL2 NPY2R PPY SLC6A14 VSX1
ADAMTS9 ARID5B CYB5R4 GAD2 IDE MAOA NPY5R PRKAA2 SLC6A3 WT1
ADRA1B ATP1B1 DBH GAMT IDH1 MC3R NR0B2 PRKAR1A SNRPN ZNF608
ADRA2A BBS2 DGAT1 GDF3 IFRD1 MC4R PCSK1 PROX1 SOAT2
ADRA2B BBS4 DHCR24 GHRHR IGF1 MC5R PCSK1N PTPN1 SOCS3
ADRB3 BBS7 DLK1 GHSR IL15 MED12 PGD PTTG1 SREBF1
AEBP1 BRS3 DPT GIPR IL6R MEN1 PHF6 RASGRF1 TBX3
AGPAT2 BSCL2 EIF4EBP1 GNPDA2 INSR MEST PIK3R1 RETN TGFB1
AGRP CBL ENPP1 GPAM IRS1 MKKS PLA2G1B RSC1A1 TMEM160
AMACR CCKAR EREG GPC4 KCNA3 MMP11 PLSCR1 RSPO3 TNF
ANGPTL6 CEBPA FABP1 GPD2 KEL MYC PMCH SCARB1 TNFRSF1B
APOA2 CEBPD FABP2 GSK3B LEP NCOA3 PNMT SDC3 TRPV1
* A total of 122 functional candidate genes related to ‘response to hypoxia’ are merged from the reports of Beall et al. (2010)12, Bigham et al. (2010)13,
Simonson et al. (2010)14, Yi et al. (2010)15, Peng et al. (2011)16, Xu et al. (2011)17 , Ji et al. (2012)18 and Scheinfeldt et al. (2012)19.
† A total of 38 functional candidate genes related to ‘response to UV’ were listed from the GO-Biological Process category of ‘response to UV’ (GO
0009411), which represents process that results in a change in state or activity of a cell or an organism (in terms of movement, secretion, enzyme
production, gene expression, etc.) as a result of an ultraviolet radiation (UV light) stimulus.
‡ A total of 151 functional candidate genes related to ‘energy metabolism’ are merged from the reports of Rankinen et al. (2006)20, MacDougald et al.
(2007)21, Heid et al. (2010)22, Speliotes et al. (2010)23 and Li et al. (2012)24, which are mainly involved in energy homeostasis, muscle growth and
adipose deposition, as well as adipokines, myokines, neurokines and hormones in regulating food intake.
Only the functional candidate genes which are also included in the 7,917 single-copy orthologs shared with Tibetan wild boar, Duroc pig and human are
listed.
Nature Genetics: doi:10.1038/ng.2811
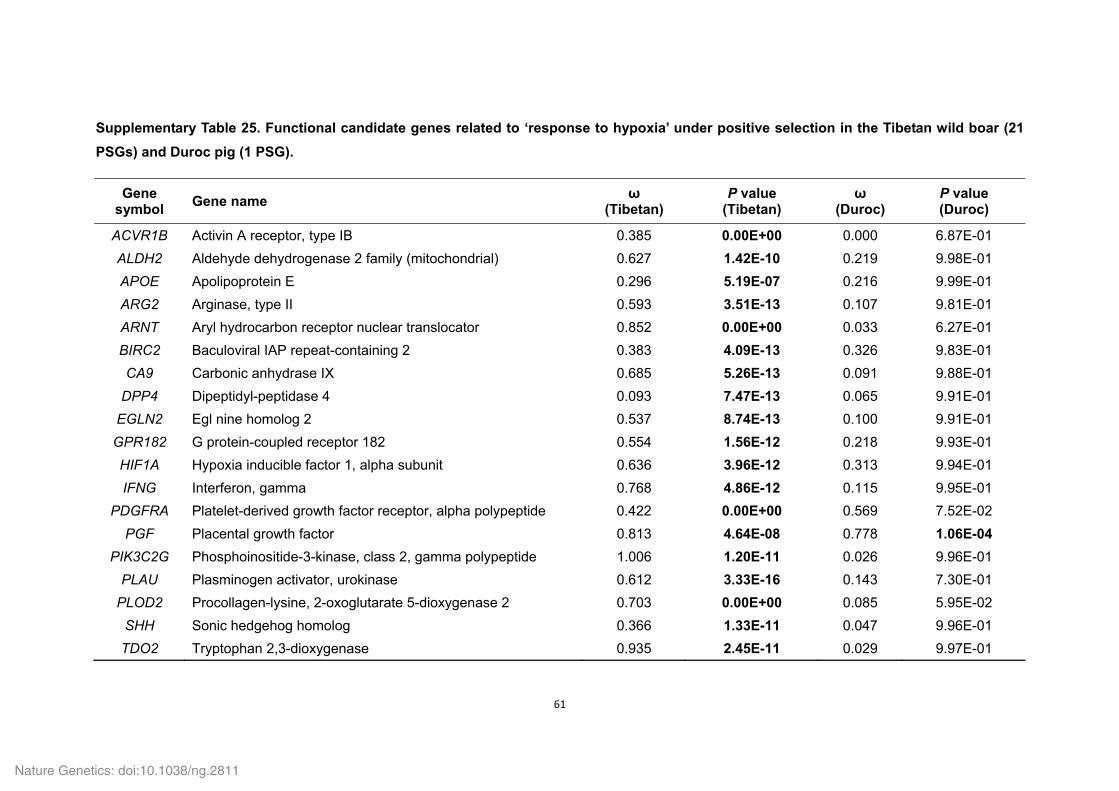
61
Supplementary Table 25. Functional candidate genes related to ‘response to hypoxia’ under positive selection in the Tibetan wild boar (21
PSGs) and Duroc pig (1 PSG).
Gene symbol
Gene name ω
(Tibetan) P value
(Tibetan) ω
(Duroc) P value (Duroc)
ACVR1B Activin A receptor, type IB 0.385 0.00E+00 0.000 6.87E-01
ALDH2 Aldehyde dehydrogenase 2 family (mitochondrial) 0.627 1.42E-10 0.219 9.98E-01
APOE Apolipoprotein E 0.296 5.19E-07 0.216 9.99E-01
ARG2 Arginase, type II 0.593 3.51E-13 0.107 9.81E-01
ARNT Aryl hydrocarbon receptor nuclear translocator 0.852 0.00E+00 0.033 6.27E-01
BIRC2 Baculoviral IAP repeat-containing 2 0.383 4.09E-13 0.326 9.83E-01
CA9 Carbonic anhydrase IX 0.685 5.26E-13 0.091 9.88E-01
DPP4 Dipeptidyl-peptidase 4 0.093 7.47E-13 0.065 9.91E-01
EGLN2 Egl nine homolog 2 0.537 8.74E-13 0.100 9.91E-01
GPR182 G protein-coupled receptor 182 0.554 1.56E-12 0.218 9.93E-01
HIF1A Hypoxia inducible factor 1, alpha subunit 0.636 3.96E-12 0.313 9.94E-01
IFNG Interferon, gamma 0.768 4.86E-12 0.115 9.95E-01
PDGFRA Platelet-derived growth factor receptor, alpha polypeptide 0.422 0.00E+00 0.569 7.52E-02
PGF Placental growth factor 0.813 4.64E-08 0.778 1.06E-04
PIK3C2G Phosphoinositide-3-kinase, class 2, gamma polypeptide 1.006 1.20E-11 0.026 9.96E-01
PLAU Plasminogen activator, urokinase 0.612 3.33E-16 0.143 7.30E-01
PLOD2 Procollagen-lysine, 2-oxoglutarate 5-dioxygenase 2 0.703 0.00E+00 0.085 5.95E-02
SHH Sonic hedgehog homolog 0.366 1.33E-11 0.047 9.96E-01
TDO2 Tryptophan 2,3-dioxygenase 0.935 2.45E-11 0.029 9.97E-01
Nature Genetics: doi:10.1038/ng.2811
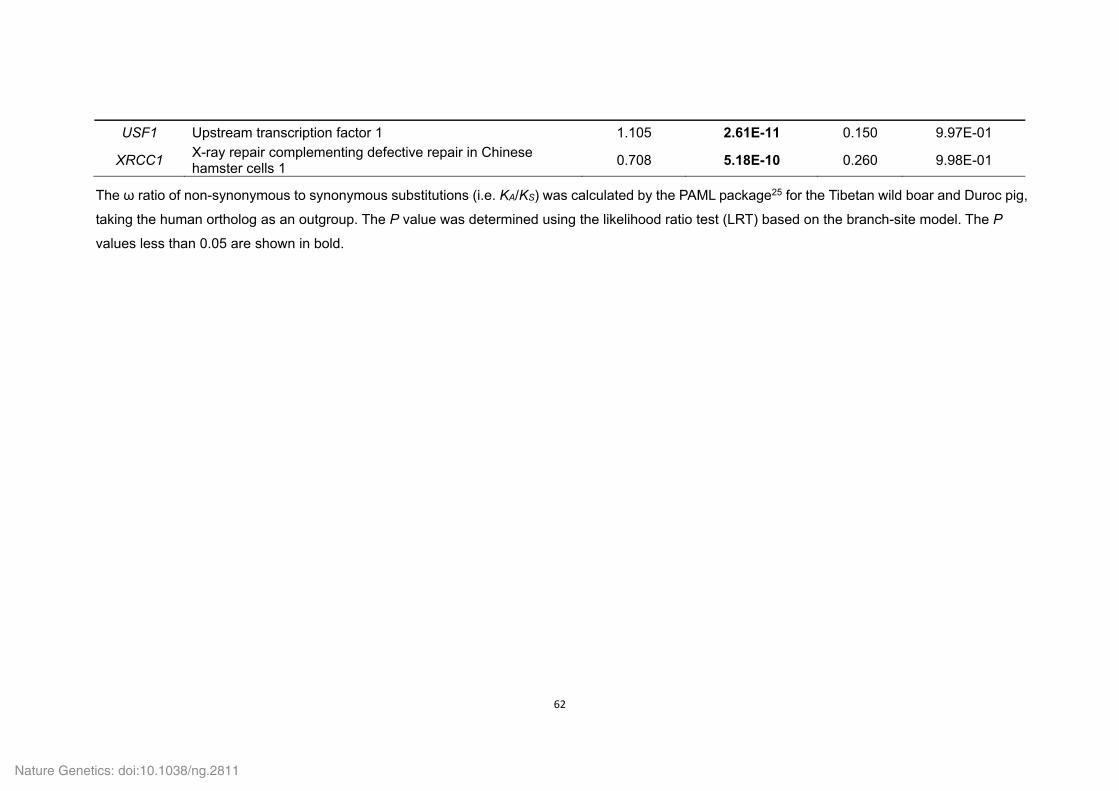
62
USF1 Upstream transcription factor 1 1.105 2.61E-11 0.150 9.97E-01
XRCC1 X-ray repair complementing defective repair in Chinese hamster cells 1
0.708 5.18E-10 0.260 9.98E-01
The ω ratio of non-synonymous to synonymous substitutions (i.e. KA/KS) was calculated by the PAML package25 for the Tibetan wild boar and Duroc pig,
taking the human ortholog as an outgroup. The P value was determined using the likelihood ratio test (LRT) based on the branch-site model. The P
values less than 0.05 are shown in bold.
Nature Genetics: doi:10.1038/ng.2811
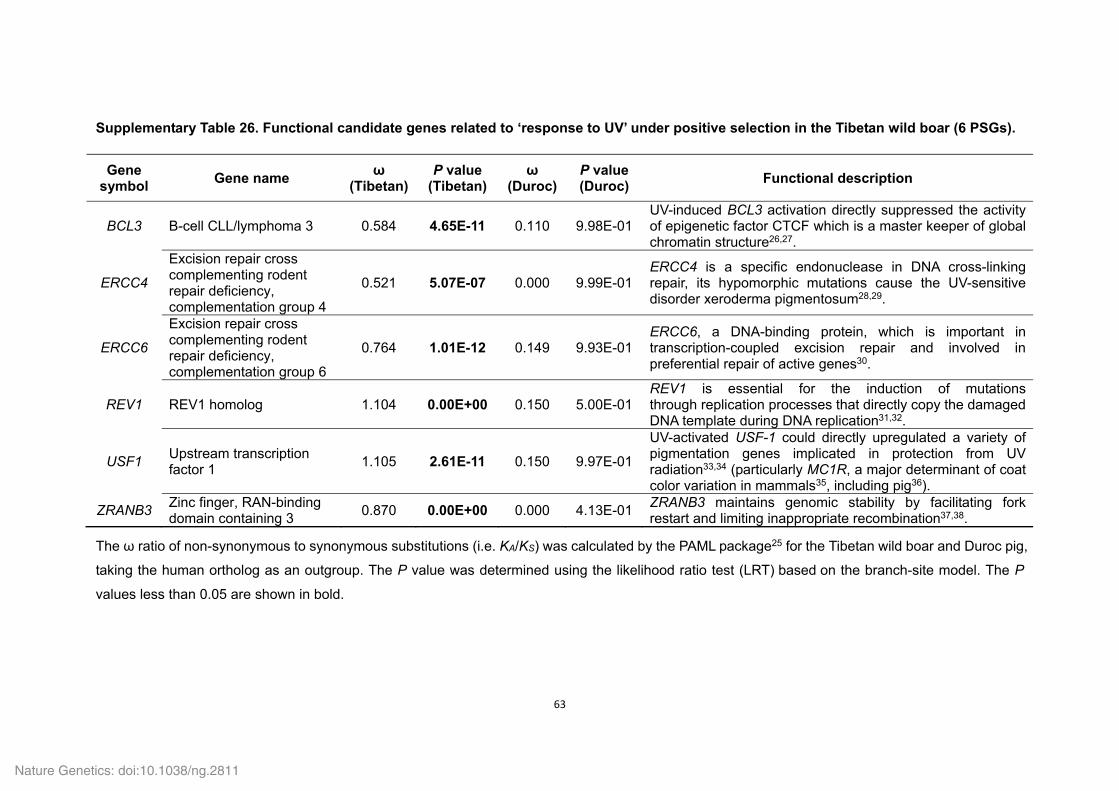
63
Supplementary Table 26. Functional candidate genes related to ‘response to UV’ under positive selection in the Tibetan wild boar (6 PSGs).
Gene symbol
Gene name ω
(Tibetan)P value
(Tibetan)ω
(Duroc)P value (Duroc)
Functional description
BCL3 B-cell CLL/lymphoma 3 0.584 4.65E-11 0.110 9.98E-01 UV-induced BCL3 activation directly suppressed the activity of epigenetic factor CTCF which is a master keeper of global chromatin structure26,27.
ERCC4
Excision repair cross complementing rodent repair deficiency, complementation group 4
0.521 5.07E-07 0.000 9.99E-01 ERCC4 is a specific endonuclease in DNA cross-linking repair, its hypomorphic mutations cause the UV-sensitive disorder xeroderma pigmentosum28,29.
ERCC6
Excision repair cross complementing rodent repair deficiency, complementation group 6
0.764 1.01E-12 0.149 9.93E-01 ERCC6, a DNA-binding protein, which is important in transcription-coupled excision repair and involved in preferential repair of active genes30.
REV1 REV1 homolog 1.104 0.00E+00 0.150 5.00E-01 REV1 is essential for the induction of mutations through replication processes that directly copy the damaged DNA template during DNA replication31,32.
USF1 Upstream transcription factor 1
1.105 2.61E-11 0.150 9.97E-01
UV-activated USF-1 could directly upregulated a variety of pigmentation genes implicated in protection from UV radiation33,34 (particularly MC1R, a major determinant of coat color variation in mammals35, including pig36).
ZRANB3 Zinc finger, RAN-binding domain containing 3
0.870 0.00E+00 0.000 4.13E-01 ZRANB3 maintains genomic stability by facilitating fork restart and limiting inappropriate recombination37,38.
The ω ratio of non-synonymous to synonymous substitutions (i.e. KA/KS) was calculated by the PAML package25 for the Tibetan wild boar and Duroc pig,
taking the human ortholog as an outgroup. The P value was determined using the likelihood ratio test (LRT) based on the branch-site model. The P
values less than 0.05 are shown in bold.
Nature Genetics: doi:10.1038/ng.2811

64
Supplementary Table 27. Functional candidate genes related to ‘energy metabolism’ under positive selection in the Tibetan wild boar (17
PSGs) and Duroc pig (21 PSGs).
Gene symbol
Gene name ω
(Tibetan)P value
(Tibetan)ω
(Duroc)P value (Duroc)
Functional description
ACVR1C Activin A receptor, type IC 0.221 6.83E-01 0.627 0.00E+00
ACVR1C (also known as ALK7) is a type I receptor for the TGFB family of signaling molecules. Growth/differentiation factor 3 regulates adipose-tissue homeostasis and energy balance under nutrient overload in part by signaling through the ALK7 receptor39.
ADRB3 Adrenergic, beta-3-, receptor 0.091 1.00E+00 0.361 2.83E-04ADRB3 is a member of the adrenergic receptor group of G-protein-coupled receptors, which is involved in the regulation of lipolysis and thermogenesis40,41.
AGPAT2 1-acylglycerol-3-phosphate O-acyltransferase 2
0.000 1.00E+00 0.133 2.48E-03
AGPAT2 is a key intermediate in the biosynthesis of triacylglycerol and glycerophospholipids, which catalyzes the acylation of lysophosphatidic acid to form phosphatidic acid42,43.
GDF3 Growth differentiation factor 3 0.286 7.18E-01 0.534 6.21E-04
GDF3 is a member of the TGFβ superfamily, which regulates adipose-tissue homeostasis and energy balance under nutrient overload in part by signaling through the ALK7 receptor.39,44
GHSR Growth hormone secretagogue receptor
0.096 8.47E-01 0.408 7.05E-14
GHSR is a component of the ghrelin signaling pathway and is involved in mediating the pleiotropic effects of ghrelin, which play a role in energy homeostasis and regulation of body weight 45,46
IL6R Interleukin 6 receptor 0.392 9.90E-01 0.799 5.32E-10IL6R is a key mediator of inflammatory response, which is also involved in the modulation of metabolic traits and the etiology of metabolic syndrome 47,48
KEL Kell blood group, metallo-endopeptidase
0.623 9.91E-01 1.175 9.19E-10KEL is a type II transmembrane glycoprotein that is the highly polymorphic Kell blood group antigen49.
NMUR2 Neuromedin U receptor 2 0.247 1.00E+00 0.377 2.18E-04NMUR2 is a receptor for neuromedin U, which is widely distributed in the gut and central nervous system and plays
Nature Genetics: doi:10.1038/ng.2811
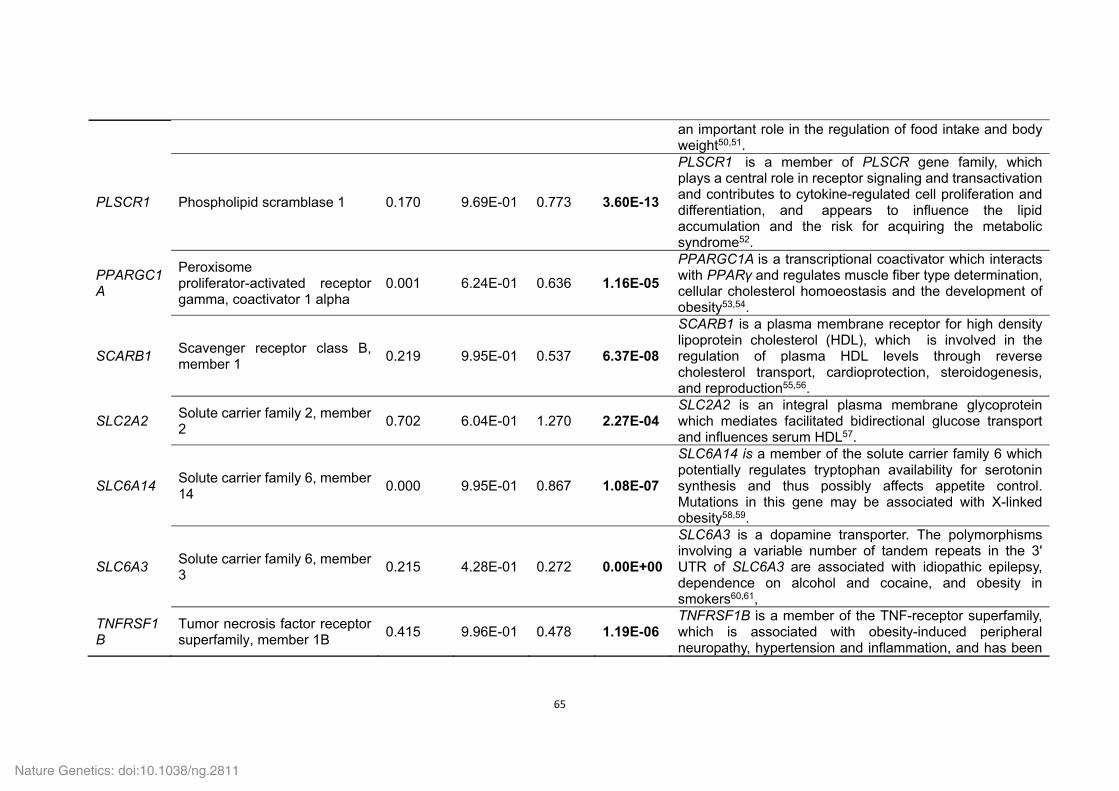
65
an important role in the regulation of food intake and body weight50,51.
PLSCR1 Phospholipid scramblase 1 0.170 9.69E-01 0.773 3.60E-13
PLSCR1 is a member of PLSCR gene family, which plays a central role in receptor signaling and transactivation and contributes to cytokine-regulated cell proliferation and differentiation, and appears to influence the lipid accumulation and the risk for acquiring the metabolic syndrome52.
PPARGC1A
Peroxisome proliferator-activated receptor gamma, coactivator 1 alpha
0.001 6.24E-01 0.636 1.16E-05
PPARGC1A is a transcriptional coactivator which interacts with PPARγ and regulates muscle fiber type determination, cellular cholesterol homoeostasis and the development of obesity53,54.
SCARB1 Scavenger receptor class B, member 1
0.219 9.95E-01 0.537 6.37E-08
SCARB1 is a plasma membrane receptor for high density lipoprotein cholesterol (HDL), which is involved in the regulation of plasma HDL levels through reverse cholesterol transport, cardioprotection, steroidogenesis, and reproduction55,56.
SLC2A2 Solute carrier family 2, member 2
0.702 6.04E-01 1.270 2.27E-04SLC2A2 is an integral plasma membrane glycoprotein which mediates facilitated bidirectional glucose transport and influences serum HDL57.
SLC6A14 Solute carrier family 6, member 14
0.000 9.95E-01 0.867 1.08E-07
SLC6A14 is a member of the solute carrier family 6 which potentially regulates tryptophan availability for serotonin synthesis and thus possibly affects appetite control. Mutations in this gene may be associated with X-linked obesity58,59.
SLC6A3 Solute carrier family 6, member 3
0.215 4.28E-01 0.272 0.00E+00
SLC6A3 is a dopamine transporter. The polymorphisms involving a variable number of tandem repeats in the 3' UTR of SLC6A3 are associated with idiopathic epilepsy, dependence on alcohol and cocaine, and obesity in smokers60,61,
TNFRSF1B
Tumor necrosis factor receptor superfamily, member 1B
0.415 9.96E-01 0.478 1.19E-06TNFRSF1B is a member of the TNF-receptor superfamily, which is associated with obesity-induced peripheral neuropathy, hypertension and inflammation, and has been
Nature Genetics: doi:10.1038/ng.2811
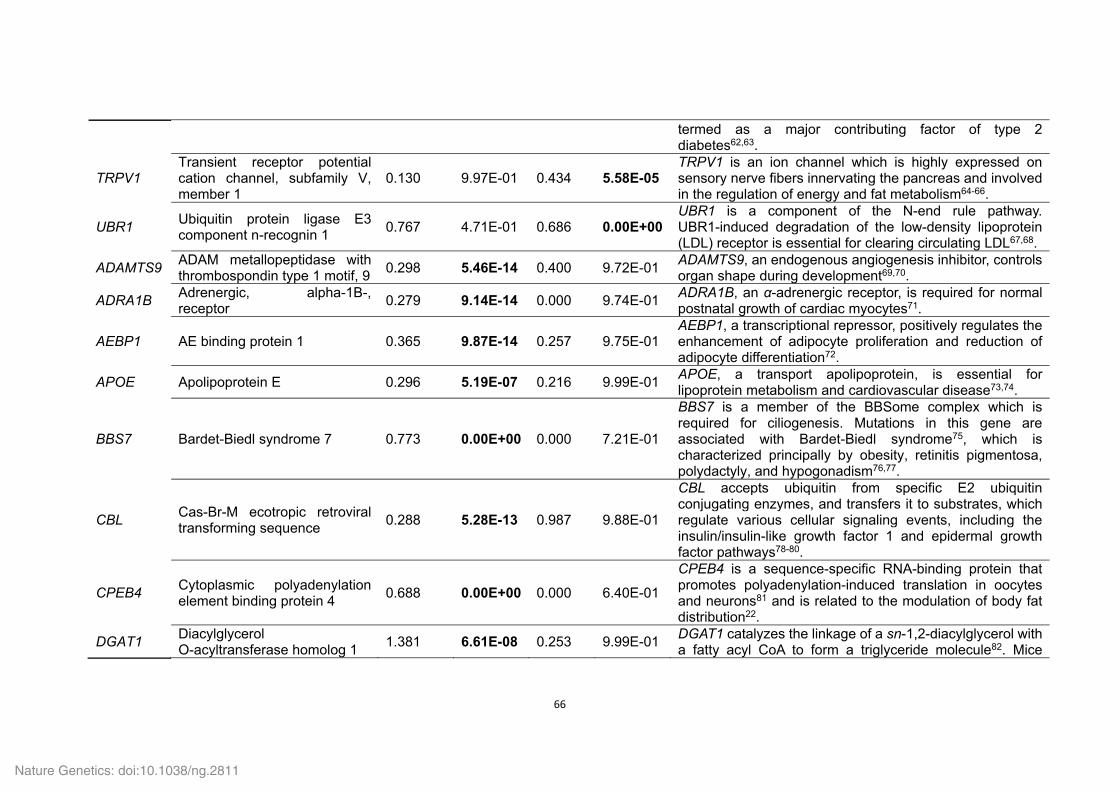
66
termed as a major contributing factor of type 2 diabetes62,63.
TRPV1 Transient receptor potential cation channel, subfamily V, member 1
0.130 9.97E-01 0.434 5.58E-05TRPV1 is an ion channel which is highly expressed on sensory nerve fibers innervating the pancreas and involved in the regulation of energy and fat metabolism64-66.
UBR1 Ubiquitin protein ligase E3 component n-recognin 1
0.767 4.71E-01 0.686 0.00E+00UBR1 is a component of the N-end rule pathway. UBR1-induced degradation of the low-density lipoprotein (LDL) receptor is essential for clearing circulating LDL67,68.
ADAMTS9 ADAM metallopeptidase with thrombospondin type 1 motif, 9
0.298 5.46E-14 0.400 9.72E-01ADAMTS9, an endogenous angiogenesis inhibitor, controls organ shape during development69,70.
ADRA1B Adrenergic, alpha-1B-, receptor
0.279 9.14E-14 0.000 9.74E-01ADRA1B, an α-adrenergic receptor, is required for normal postnatal growth of cardiac myocytes71.
AEBP1 AE binding protein 1 0.365 9.87E-14 0.257 9.75E-01AEBP1, a transcriptional repressor, positively regulates the enhancement of adipocyte proliferation and reduction of adipocyte differentiation72.
APOE Apolipoprotein E 0.296 5.19E-07 0.216 9.99E-01APOE, a transport apolipoprotein, is essential for lipoprotein metabolism and cardiovascular disease73,74.
BBS7 Bardet-Biedl syndrome 7 0.773 0.00E+00 0.000 7.21E-01
BBS7 is a member of the BBSome complex which is required for ciliogenesis. Mutations in this gene are associated with Bardet-Biedl syndrome75, which is characterized principally by obesity, retinitis pigmentosa, polydactyly, and hypogonadism76,77.
CBL Cas-Br-M ecotropic retroviral transforming sequence
0.288 5.28E-13 0.987 9.88E-01
CBL accepts ubiquitin from specific E2 ubiquitin conjugating enzymes, and transfers it to substrates, which regulate various cellular signaling events, including the insulin/insulin-like growth factor 1 and epidermal growth factor pathways78-80.
CPEB4 Cytoplasmic polyadenylation element binding protein 4
0.688 0.00E+00 0.000 6.40E-01
CPEB4 is a sequence-specific RNA-binding protein that promotes polyadenylation-induced translation in oocytes and neurons81 and is related to the modulation of body fat distribution22.
DGAT1 Diacylglycerol O-acyltransferase homolog 1
1.381 6.61E-08 0.253 9.99E-01DGAT1 catalyzes the linkage of a sn-1,2-diacylglycerol with a fatty acyl CoA to form a triglyceride molecule82. Mice
Nature Genetics: doi:10.1038/ng.2811
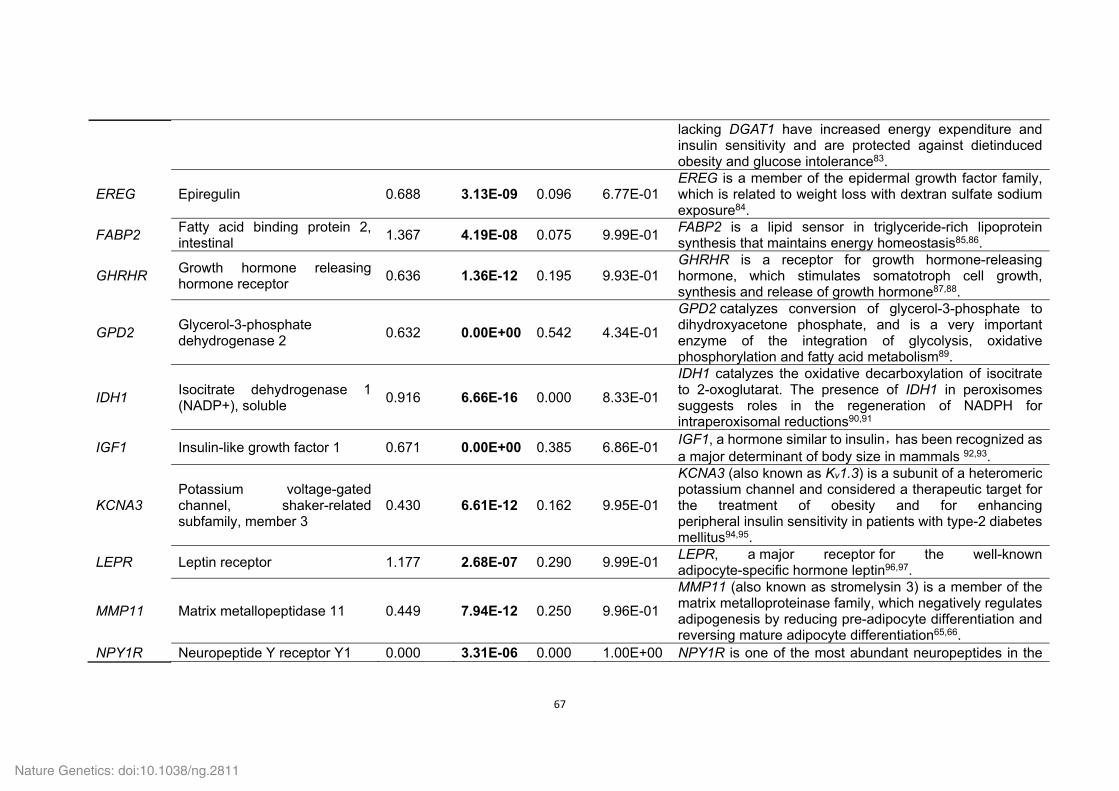
67
lacking DGAT1 have increased energy expenditure and insulin sensitivity and are protected against dietinduced obesity and glucose intolerance83.
EREG Epiregulin 0.688 3.13E-09 0.096 6.77E-01EREG is a member of the epidermal growth factor family, which is related to weight loss with dextran sulfate sodium exposure84.
FABP2 Fatty acid binding protein 2, intestinal
1.367 4.19E-08 0.075 9.99E-01FABP2 is a lipid sensor in triglyceride-rich lipoprotein synthesis that maintains energy homeostasis85,86.
GHRHR Growth hormone releasing hormone receptor
0.636 1.36E-12 0.195 9.93E-01GHRHR is a receptor for growth hormone-releasing hormone, which stimulates somatotroph cell growth, synthesis and release of growth hormone87,88.
GPD2 Glycerol-3-phosphate dehydrogenase 2
0.632 0.00E+00 0.542 4.34E-01
GPD2 catalyzes conversion of glycerol-3-phosphate to dihydroxyacetone phosphate, and is a very important enzyme of the integration of glycolysis, oxidative phosphorylation and fatty acid metabolism89.
IDH1 Isocitrate dehydrogenase 1 (NADP+), soluble
0.916 6.66E-16 0.000 8.33E-01
IDH1 catalyzes the oxidative decarboxylation of isocitrate to 2-oxoglutarat. The presence of IDH1 in peroxisomes suggests roles in the regeneration of NADPH for intraperoxisomal reductions90,91
IGF1 Insulin-like growth factor 1 0.671 0.00E+00 0.385 6.86E-01IGF1, a hormone similar to insulin,has been recognized as a major determinant of body size in mammals 92,93.
KCNA3 Potassium voltage-gated channel, shaker-related subfamily, member 3
0.430 6.61E-12 0.162 9.95E-01
KCNA3 (also known as Kv1.3) is a subunit of a heteromeric potassium channel and considered a therapeutic target for the treatment of obesity and for enhancing peripheral insulin sensitivity in patients with type-2 diabetes mellitus94,95.
LEPR Leptin receptor 1.177 2.68E-07 0.290 9.99E-01LEPR, a major receptor for the well-known adipocyte-specific hormone leptin96,97.
MMP11 Matrix metallopeptidase 11 0.449 7.94E-12 0.250 9.96E-01
MMP11 (also known as stromelysin 3) is a member of the matrix metalloproteinase family, which negatively regulates adipogenesis by reducing pre-adipocyte differentiation and reversing mature adipocyte differentiation65,66.
NPY1R Neuropeptide Y receptor Y1 0.000 3.31E-06 0.000 1.00E+00 NPY1R is one of the most abundant neuropeptides in the
Nature Genetics: doi:10.1038/ng.2811
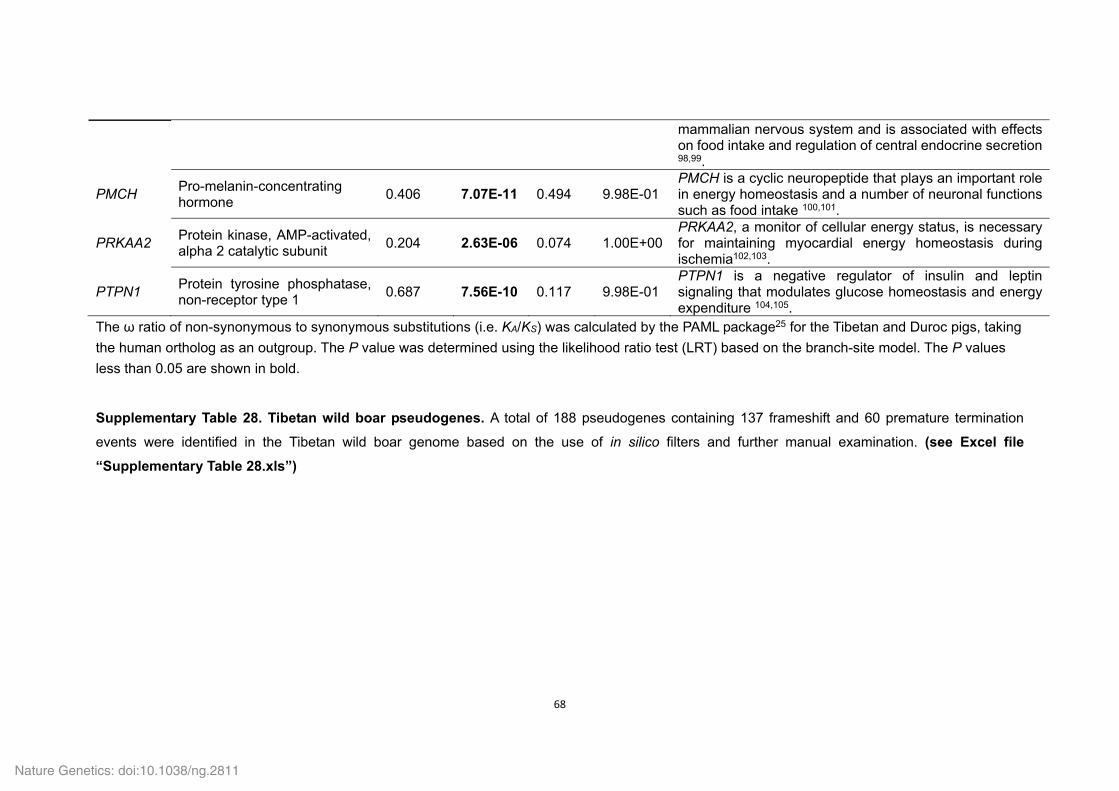
68
mammalian nervous system and is associated with effects on food intake and regulation of central endocrine secretion 98,99.
PMCH Pro-melanin-concentrating hormone
0.406 7.07E-11 0.494 9.98E-01PMCH is a cyclic neuropeptide that plays an important role in energy homeostasis and a number of neuronal functions such as food intake 100,101.
PRKAA2 Protein kinase, AMP-activated, alpha 2 catalytic subunit
0.204 2.63E-06 0.074 1.00E+00PRKAA2, a monitor of cellular energy status, is necessary for maintaining myocardial energy homeostasis during ischemia102,103.
PTPN1 Protein tyrosine phosphatase, non-receptor type 1
0.687 7.56E-10 0.117 9.98E-01PTPN1 is a negative regulator of insulin and leptin signaling that modulates glucose homeostasis and energy expenditure 104,105.
The ω ratio of non-synonymous to synonymous substitutions (i.e. KA/KS) was calculated by the PAML package25 for the Tibetan and Duroc pigs, taking
the human ortholog as an outgroup. The P value was determined using the likelihood ratio test (LRT) based on the branch-site model. The P values
less than 0.05 are shown in bold.
Supplementary Table 28. Tibetan wild boar pseudogenes. A total of 188 pseudogenes containing 137 frameshift and 60 premature termination
events were identified in the Tibetan wild boar genome based on the use of in silico filters and further manual examination. (see Excel file
“Supplementary Table 28.xls”)
Nature Genetics: doi:10.1038/ng.2811
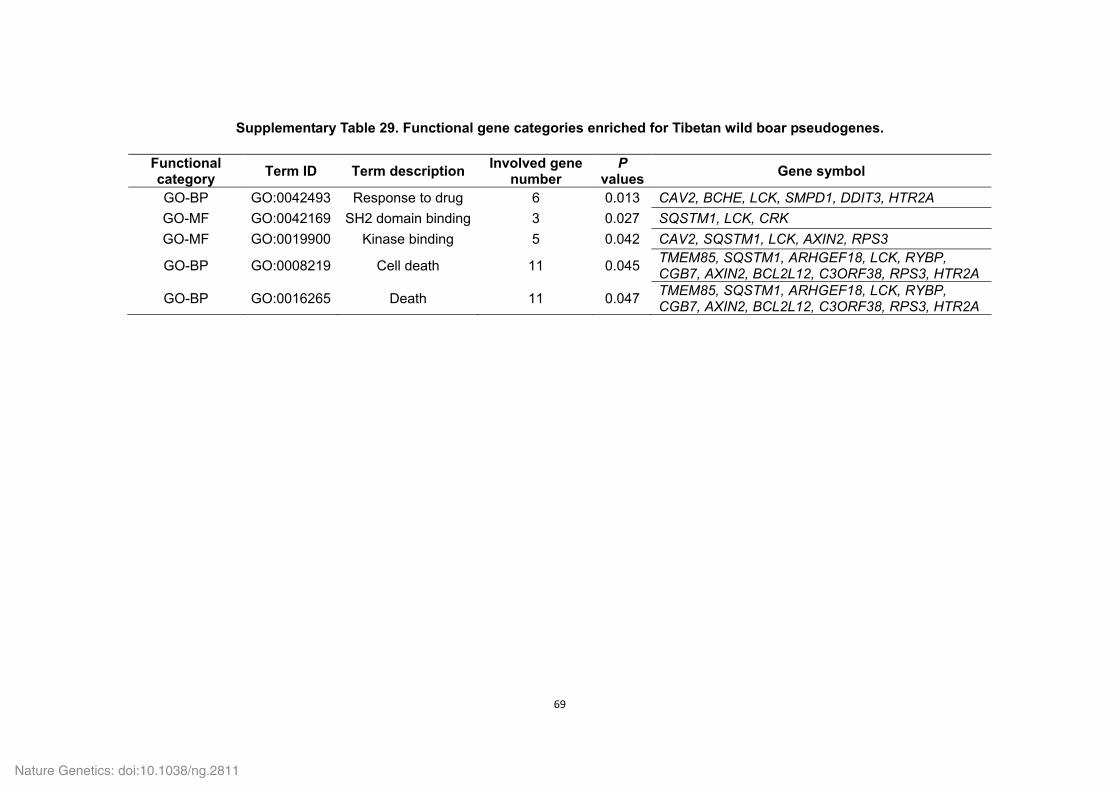
69
Supplementary Table 29. Functional gene categories enriched for Tibetan wild boar pseudogenes.
Functional category
Term ID Term description Involved gene
number P
values Gene symbol
GO-BP GO:0042493 Response to drug 6 0.013 CAV2, BCHE, LCK, SMPD1, DDIT3, HTR2A
GO-MF GO:0042169 SH2 domain binding 3 0.027 SQSTM1, LCK, CRK
GO-MF GO:0019900 Kinase binding 5 0.042 CAV2, SQSTM1, LCK, AXIN2, RPS3
GO-BP GO:0008219 Cell death 11 0.045 TMEM85, SQSTM1, ARHGEF18, LCK, RYBP, CGB7, AXIN2, BCL2L12, C3ORF38, RPS3, HTR2A
GO-BP GO:0016265 Death 11 0.047 TMEM85, SQSTM1, ARHGEF18, LCK, RYBP, CGB7, AXIN2, BCL2L12, C3ORF38, RPS3, HTR2A
Nature Genetics: doi:10.1038/ng.2811
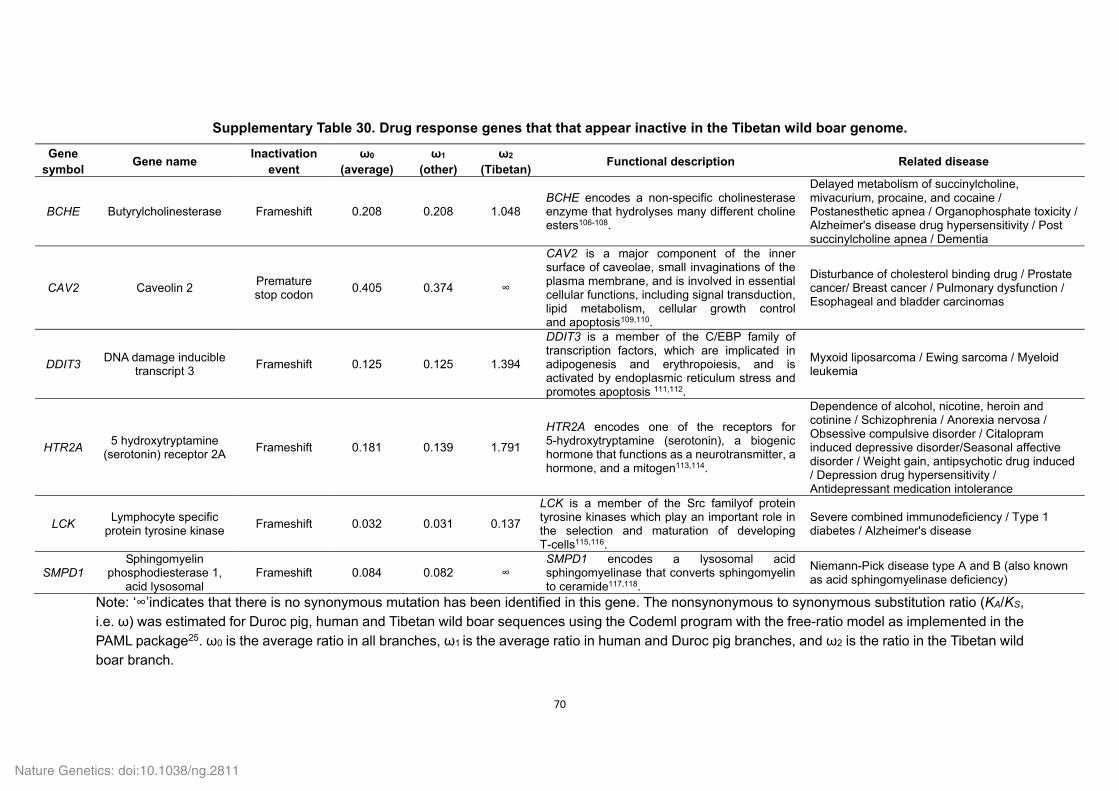
70
Supplementary Table 30. Drug response genes that that appear inactive in the Tibetan wild boar genome.
Gene symbol
Gene name Inactivation
event ω0
(average)ω1
(other) ω2
(Tibetan)Functional description Related disease
BCHE Butyrylcholinesterase Frameshift 0.208 0.208 1.048 BCHE encodes a non-specific cholinesterase enzyme that hydrolyses many different choline esters106-108.
Delayed metabolism of succinylcholine, mivacurium, procaine, and cocaine / Postanesthetic apnea / Organophosphate toxicity / Alzheimer's disease drug hypersensitivity / Post succinylcholine apnea / Dementia
CAV2 Caveolin 2 Premature stop codon
0.405 0.374 ∞
CAV2 is a major component of the inner surface of caveolae, small invaginations of the plasma membrane, and is involved in essential cellular functions, including signal transduction, lipid metabolism, cellular growth control and apoptosis109,110.
Disturbance of cholesterol binding drug / Prostate cancer/ Breast cancer / Pulmonary dysfunction / Esophageal and bladder carcinomas
DDIT3 DNA damage inducible
transcript 3 Frameshift 0.125 0.125 1.394
DDIT3 is a member of the C/EBP family of transcription factors, which are implicated in adipogenesis and erythropoiesis, and is activated by endoplasmic reticulum stress and promotes apoptosis 111,112.
Myxoid liposarcoma / Ewing sarcoma / Myeloid leukemia
HTR2A 5 hydroxytryptamine
(serotonin) receptor 2A Frameshift 0.181 0.139 1.791
HTR2A encodes one of the receptors for 5-hydroxytryptamine (serotonin), a biogenic hormone that functions as a neurotransmitter, a hormone, and a mitogen113,114.
Dependence of alcohol, nicotine, heroin and cotinine / Schizophrenia / Anorexia nervosa / Obsessive compulsive disorder / Citalopram induced depressive disorder/Seasonal affective disorder / Weight gain, antipsychotic drug induced / Depression drug hypersensitivity / Antidepressant medication intolerance
LCK Lymphocyte specific
protein tyrosine kinase Frameshift 0.032 0.031 0.137
LCK is a member of the Src familyof protein tyrosine kinases which play an important role in the selection and maturation of developing T-cells115,116.
Severe combined immunodeficiency / Type 1 diabetes / Alzheimer's disease
SMPD1 Sphingomyelin
phosphodiesterase 1, acid lysosomal
Frameshift 0.084 0.082 ∞ SMPD1 encodes a lysosomal acid sphingomyelinase that converts sphingomyelin to ceramide117,118.
Niemann-Pick disease type A and B (also known as acid sphingomyelinase deficiency)
Note: ‘∞’indicates that there is no synonymous mutation has been identified in this gene. The nonsynonymous to synonymous substitution ratio (KA/KS, i.e. ω) was estimated for Duroc pig, human and Tibetan wild boar sequences using the Codeml program with the free-ratio model as implemented in the PAML package25. ω0 is the average ratio in all branches, ω1 is the average ratio in human and Duroc pig branches, and ω2 is the ratio in the Tibetan wild boar branch.
Nature Genetics: doi:10.1038/ng.2811
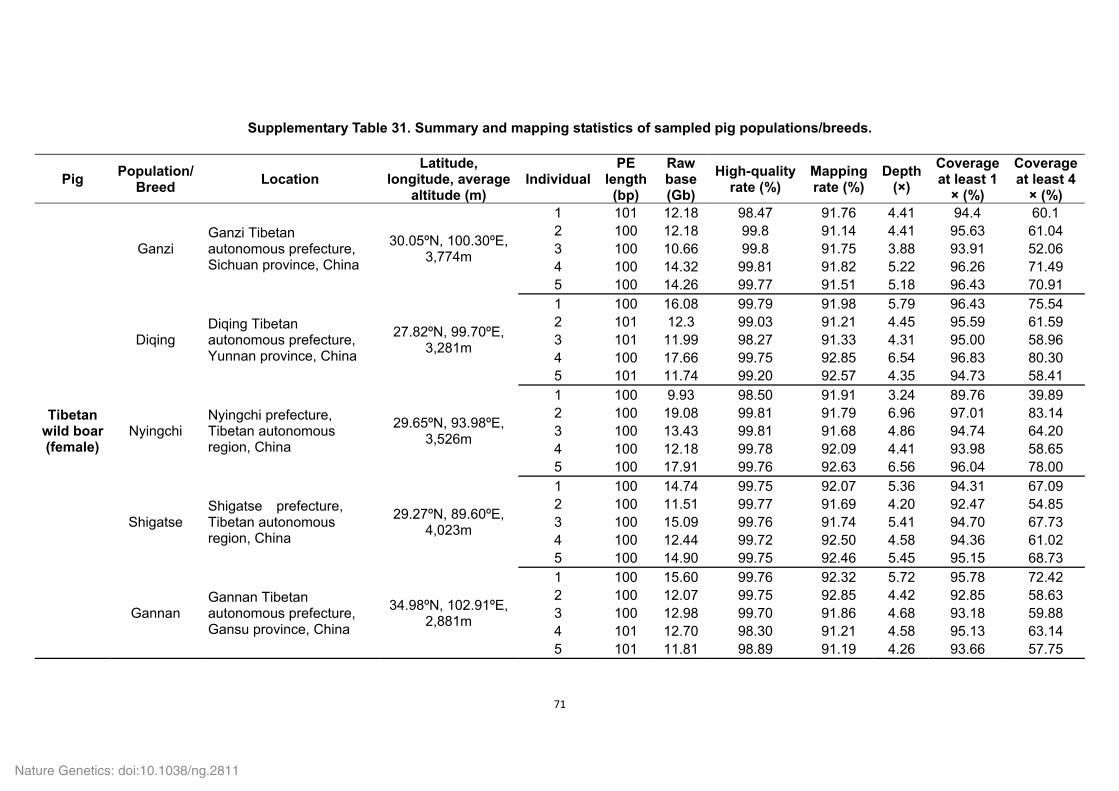
71
Supplementary Table 31. Summary and mapping statistics of sampled pig populations/breeds.
Pig Population/
Breed Location
Latitude, longitude, average
altitude (m) Individual
PE length (bp)
Raw base (Gb)
High-quality rate (%)
Mapping rate (%)
Depth (×)
Coverage at least 1
× (%)
Coverage at least 4
× (%)
Tibetan wild boar (female)
Ganzi Ganzi Tibetan autonomous prefecture, Sichuan province, China
30.05ºN, 100.30ºE, 3,774m
1 101 12.18 98.47 91.76 4.41 94.4 60.1 2 100 12.18 99.8 91.14 4.41 95.63 61.04 3 100 10.66 99.8 91.75 3.88 93.91 52.06 4 100 14.32 99.81 91.82 5.22 96.26 71.49 5 100 14.26 99.77 91.51 5.18 96.43 70.91
Diqing Diqing Tibetan autonomous prefecture, Yunnan province, China
27.82ºN, 99.70ºE, 3,281m
1 100 16.08 99.79 91.98 5.79 96.43 75.54 2 101 12.3 99.03 91.21 4.45 95.59 61.59 3 101 11.99 98.27 91.33 4.31 95.00 58.96 4 100 17.66 99.75 92.85 6.54 96.83 80.30 5 101 11.74 99.20 92.57 4.35 94.73 58.41
Nyingchi Nyingchi prefecture, Tibetan autonomous region, China
29.65ºN, 93.98ºE, 3,526m
1 100 9.93 98.50 91.91 3.24 89.76 39.89 2 100 19.08 99.81 91.79 6.96 97.01 83.14 3 100 13.43 99.81 91.68 4.86 94.74 64.20 4 100 12.18 99.78 92.09 4.41 93.98 58.65 5 100 17.91 99.76 92.63 6.56 96.04 78.00
Shigatse Shigatse prefecture, Tibetan autonomous region, China
29.27ºN, 89.60ºE, 4,023m
1 100 14.74 99.75 92.07 5.36 94.31 67.09 2 100 11.51 99.77 91.69 4.20 92.47 54.85 3 100 15.09 99.76 91.74 5.41 94.70 67.73 4 100 12.44 99.72 92.50 4.58 94.36 61.02 5 100 14.90 99.75 92.46 5.45 95.15 68.73
Gannan Gannan Tibetan autonomous prefecture, Gansu province, China
34.98ºN, 102.91ºE, 2,881m
1 100 15.60 99.76 92.32 5.72 95.78 72.42 2 100 12.07 99.75 92.85 4.42 92.85 58.63 3 100 12.98 99.70 91.86 4.68 93.18 59.88 4 101 12.70 98.30 91.21 4.58 95.13 63.14 5 101 11.81 98.89 91.19 4.26 93.66 57.75
Nature Genetics: doi:10.1038/ng.2811
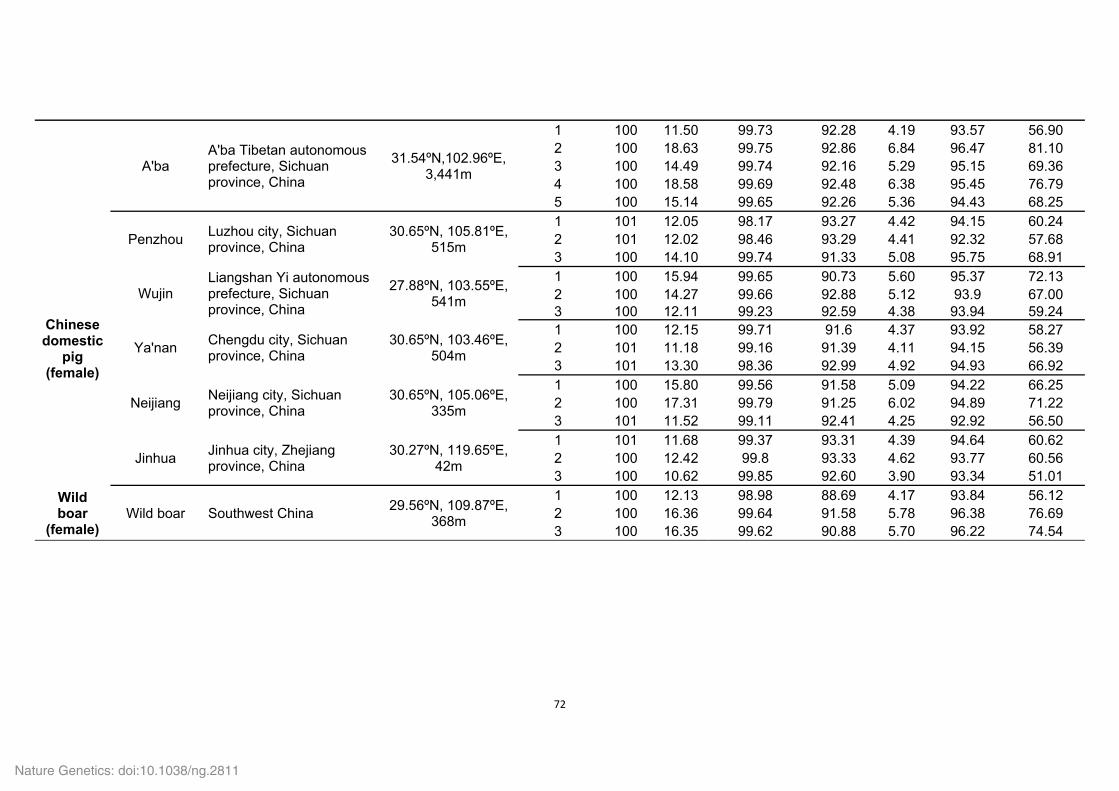
72
A'ba A'ba Tibetan autonomous prefecture, Sichuan province, China
31.54ºN,102.96ºE, 3,441m
1 100 11.50 99.73 92.28 4.19 93.57 56.90 2 100 18.63 99.75 92.86 6.84 96.47 81.10 3 100 14.49 99.74 92.16 5.29 95.15 69.36 4 100 18.58 99.69 92.48 6.38 95.45 76.79 5 100 15.14 99.65 92.26 5.36 94.43 68.25
Chinese domestic
pig (female)
Penzhou Luzhou city, Sichuan province, China
30.65ºN, 105.81ºE, 515m
1 101 12.05 98.17 93.27 4.42 94.15 60.24 2 101 12.02 98.46 93.29 4.41 92.32 57.68 3 100 14.10 99.74 91.33 5.08 95.75 68.91
Wujin Liangshan Yi autonomous prefecture, Sichuan province, China
27.88ºN, 103.55ºE, 541m
1 100 15.94 99.65 90.73 5.60 95.37 72.13 2 100 14.27 99.66 92.88 5.12 93.9 67.00 3 100 12.11 99.23 92.59 4.38 93.94 59.24
Ya'nan Chengdu city, Sichuan province, China
30.65ºN, 103.46ºE, 504m
1 100 12.15 99.71 91.6 4.37 93.92 58.27 2 101 11.18 99.16 91.39 4.11 94.15 56.39 3 101 13.30 98.36 92.99 4.92 94.93 66.92
Neijiang Neijiang city, Sichuan province, China
30.65ºN, 105.06ºE, 335m
1 100 15.80 99.56 91.58 5.09 94.22 66.25 2 100 17.31 99.79 91.25 6.02 94.89 71.22 3 101 11.52 99.11 92.41 4.25 92.92 56.50
Jinhua Jinhua city, Zhejiang province, China
30.27ºN, 119.65ºE, 42m
1 101 11.68 99.37 93.31 4.39 94.64 60.62 2 100 12.42 99.8 93.33 4.62 93.77 60.56 3 100 10.62 99.85 92.60 3.90 93.34 51.01
Wild boar
(female) Wild boar Southwest China
29.56ºN, 109.87ºE, 368m
1 100 12.13 98.98 88.69 4.17 93.84 56.12 2 100 16.36 99.64 91.58 5.78 96.38 76.69 3 100 16.35 99.62 90.88 5.70 96.22 74.54
Nature Genetics: doi:10.1038/ng.2811
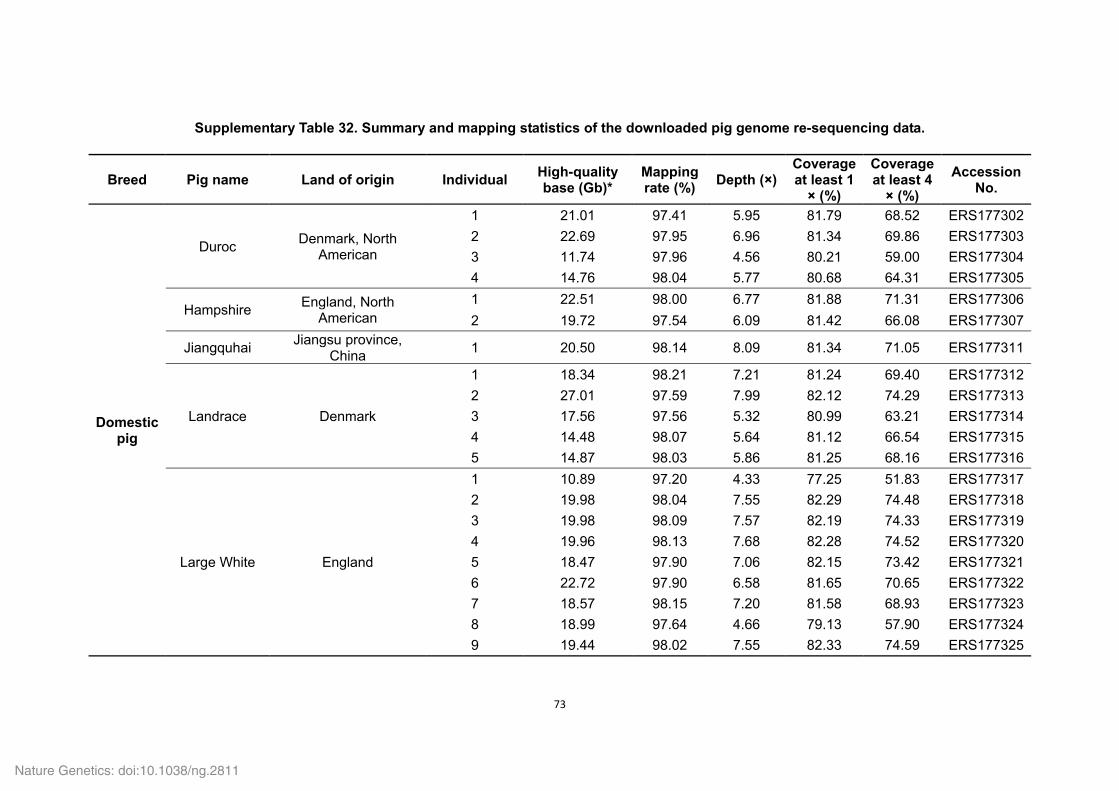
73
Supplementary Table 32. Summary and mapping statistics of the downloaded pig genome re-sequencing data.
Breed Pig name Land of origin Individual High-quality base (Gb)*
Mapping rate (%)
Depth (×)Coverage at least 1
× (%)
Coverage at least 4
× (%)
Accession No.
Domestic pig
Duroc Denmark, North
American
1 21.01 97.41 5.95 81.79 68.52 ERS177302
2 22.69 97.95 6.96 81.34 69.86 ERS177303
3 11.74 97.96 4.56 80.21 59.00 ERS177304
4 14.76 98.04 5.77 80.68 64.31 ERS177305
Hampshire England, North
American 1 22.51 98.00 6.77 81.88 71.31 ERS177306
2 19.72 97.54 6.09 81.42 66.08 ERS177307
Jiangquhai Jiangsu province,
China 1 20.50 98.14 8.09 81.34 71.05 ERS177311
Landrace Denmark
1 18.34 98.21 7.21 81.24 69.40 ERS177312
2 27.01 97.59 7.99 82.12 74.29 ERS177313
3 17.56 97.56 5.32 80.99 63.21 ERS177314
4 14.48 98.07 5.64 81.12 66.54 ERS177315
5 14.87 98.03 5.86 81.25 68.16 ERS177316
Large White England
1 10.89 97.20 4.33 77.25 51.83 ERS177317
2 19.98 98.04 7.55 82.29 74.48 ERS177318
3 19.98 98.09 7.57 82.19 74.33 ERS177319
4 19.96 98.13 7.68 82.28 74.52 ERS177320
5 18.47 97.90 7.06 82.15 73.42 ERS177321
6 22.72 97.90 6.58 81.65 70.65 ERS177322
7 18.57 98.15 7.20 81.58 68.93 ERS177323
8 18.99 97.64 4.66 79.13 57.90 ERS177324
9 19.44 98.02 7.55 82.33 74.59 ERS177325
Nature Genetics: doi:10.1038/ng.2811
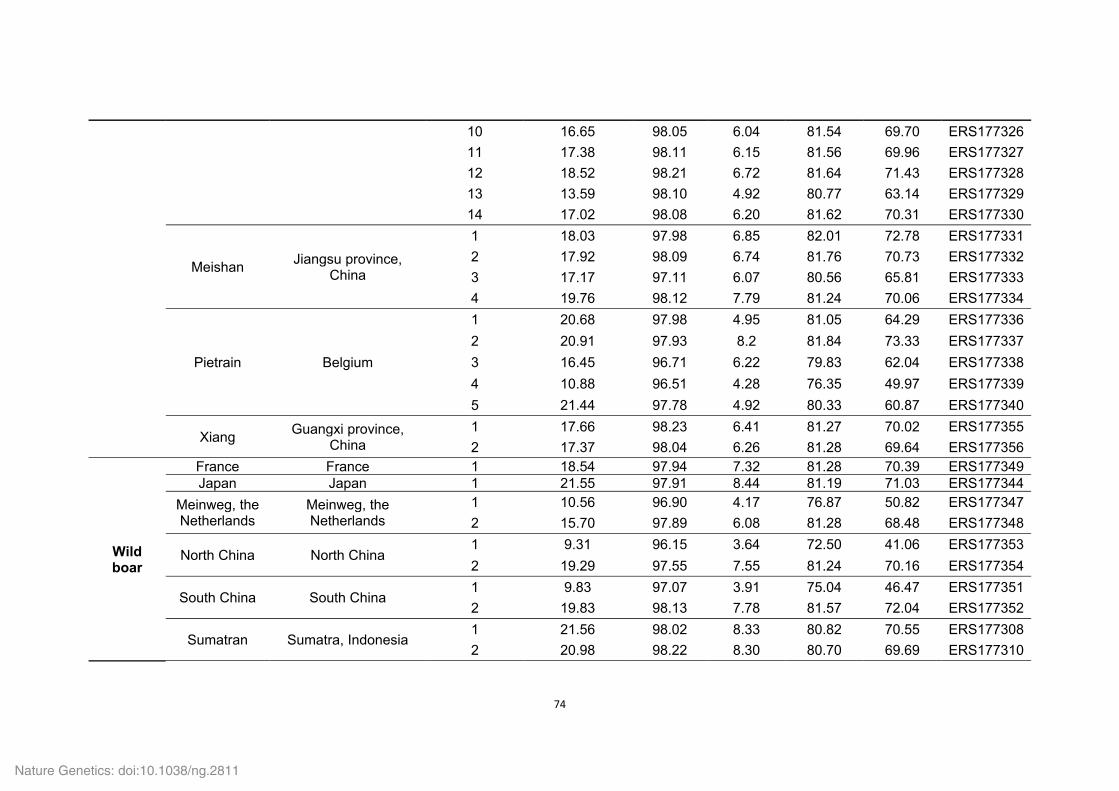
74
10 16.65 98.05 6.04 81.54 69.70 ERS177326
11 17.38 98.11 6.15 81.56 69.96 ERS177327
12 18.52 98.21 6.72 81.64 71.43 ERS177328
13 13.59 98.10 4.92 80.77 63.14 ERS177329
14 17.02 98.08 6.20 81.62 70.31 ERS177330
Meishan Jiangsu province,
China
1 18.03 97.98 6.85 82.01 72.78 ERS177331
2 17.92 98.09 6.74 81.76 70.73 ERS177332
3 17.17 97.11 6.07 80.56 65.81 ERS177333
4 19.76 98.12 7.79 81.24 70.06 ERS177334
Pietrain Belgium
1 20.68 97.98 4.95 81.05 64.29 ERS177336
2 20.91 97.93 8.2 81.84 73.33 ERS177337
3 16.45 96.71 6.22 79.83 62.04 ERS177338
4 10.88 96.51 4.28 76.35 49.97 ERS177339
5 21.44 97.78 4.92 80.33 60.87 ERS177340
Xiang Guangxi province,
China 1 17.66 98.23 6.41 81.27 70.02 ERS177355
2 17.37 98.04 6.26 81.28 69.64 ERS177356
Wild boar
France France 1 18.54 97.94 7.32 81.28 70.39 ERS177349 Japan Japan 1 21.55 97.91 8.44 81.19 71.03 ERS177344
Meinweg, the Netherlands
Meinweg, the Netherlands
1 10.56 96.90 4.17 76.87 50.82 ERS177347
2 15.70 97.89 6.08 81.28 68.48 ERS177348
North China North China 1 9.31 96.15 3.64 72.50 41.06 ERS177353
2 19.29 97.55 7.55 81.24 70.16 ERS177354
South China South China 1 9.83 97.07 3.91 75.04 46.47 ERS177351
2 19.83 98.13 7.78 81.57 72.04 ERS177352
Sumatran Sumatra, Indonesia 1 21.56 98.02 8.33 80.82 70.55 ERS177308
2 20.98 98.22 8.30 80.70 69.69 ERS177310
Nature Genetics: doi:10.1038/ng.2811
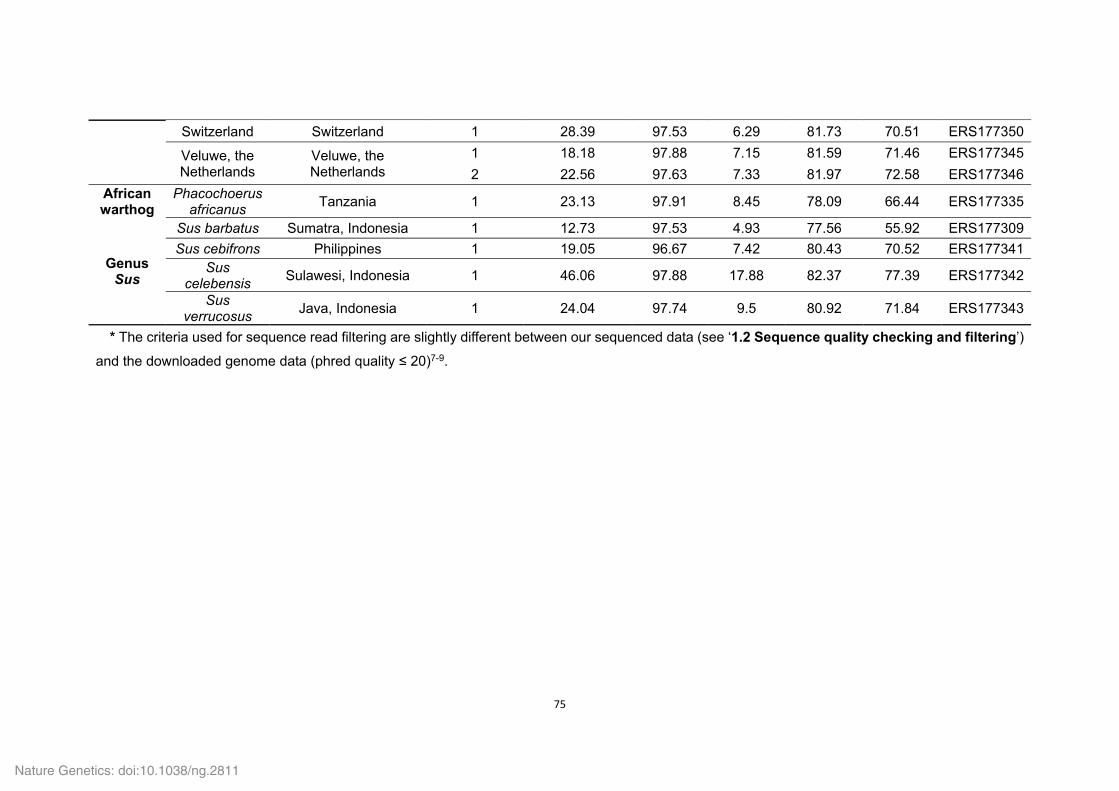
75
Switzerland Switzerland 1 28.39 97.53 6.29 81.73 70.51 ERS177350
Veluwe, the Netherlands
Veluwe, the Netherlands
1 18.18 97.88 7.15 81.59 71.46 ERS177345
2 22.56 97.63 7.33 81.97 72.58 ERS177346 African warthog
Phacochoerus africanus
Tanzania 1 23.13 97.91 8.45 78.09 66.44 ERS177335
Genus Sus
Sus barbatus Sumatra, Indonesia 1 12.73 97.53 4.93 77.56 55.92 ERS177309
Sus cebifrons Philippines 1 19.05 96.67 7.42 80.43 70.52 ERS177341 Sus
celebensis Sulawesi, Indonesia 1 46.06 97.88 17.88 82.37 77.39 ERS177342
Sus verrucosus
Java, Indonesia 1 24.04 97.74 9.5 80.92 71.84 ERS177343
* The criteria used for sequence read filtering are slightly different between our sequenced data (see ‘1.2 Sequence quality checking and filtering’)
and the downloaded genome data (phred quality ≤ 20)7-9.
Nature Genetics: doi:10.1038/ng.2811
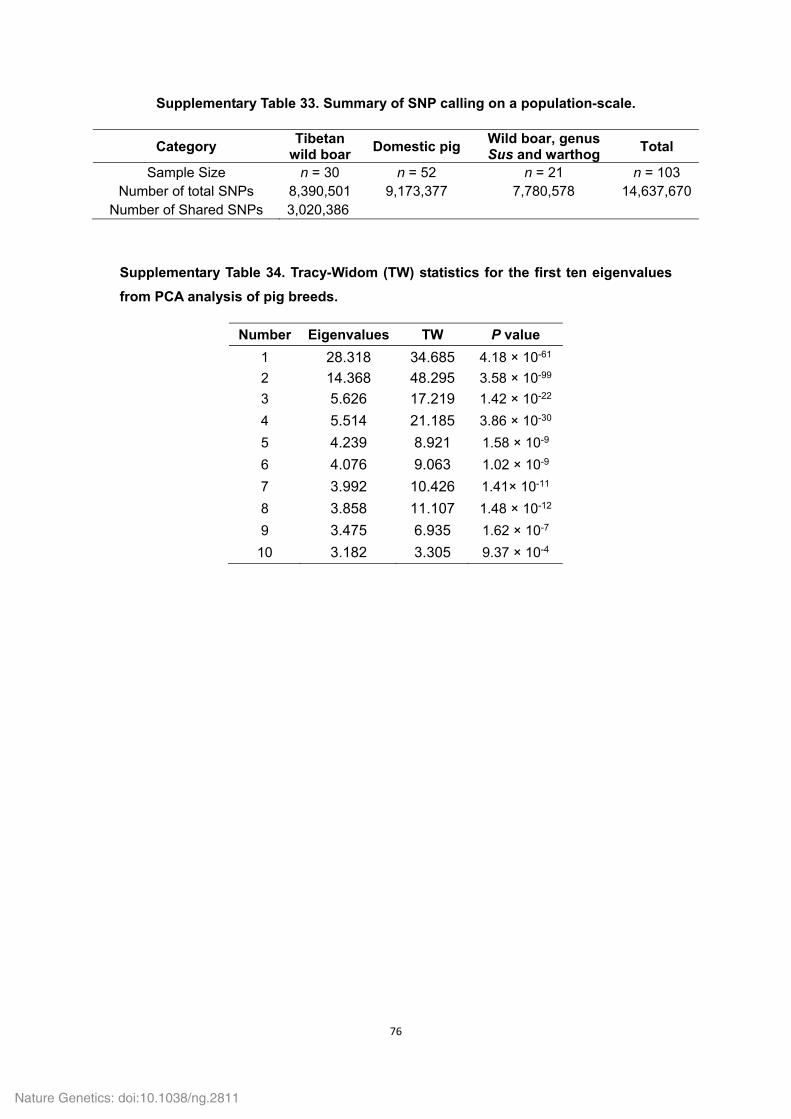
76
Supplementary Table 33. Summary of SNP calling on a population-scale.
Category Tibetan
wild boarDomestic pig
Wild boar, genus Sus and warthog
Total
Sample Size n = 30 n = 52 n = 21 n = 103 Number of total SNPs 8,390,501 9,173,377 7,780,578 14,637,670
Number of Shared SNPs 3,020,386
Supplementary Table 34. Tracy-Widom (TW) statistics for the first ten eigenvalues
from PCA analysis of pig breeds.
Number Eigenvalues TW P value
1 28.318 34.685 4.18 × 10-61
2 14.368 48.295 3.58 × 10-99
3 5.626 17.219 1.42 × 10⁻²²
4 5.514 21.185 3.86 × 10⁻³⁰
5 4.239 8.921 1.58 × 10⁻⁹
6 4.076 9.063 1.02 × 10⁻⁹
7 3.992 10.426 1.41× 10⁻¹¹
8 3.858 11.107 1.48 × 10⁻¹²
9 3.475 6.935 1.62 × 10⁻⁷
10 3.182 3.305 9.37 × 10⁻⁴
Nature Genetics: doi:10.1038/ng.2811
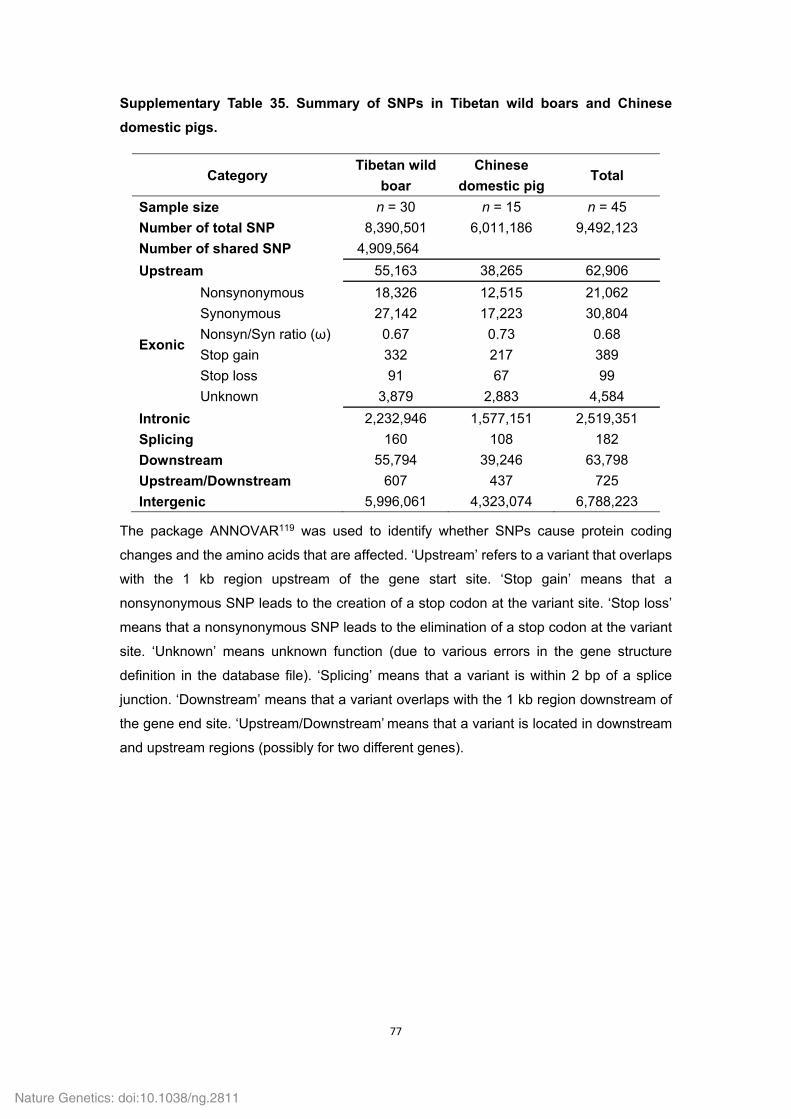
77
Supplementary Table 35. Summary of SNPs in Tibetan wild boars and Chinese
domestic pigs.
Category Tibetan wild
boar
Chinese
domestic pigTotal
Sample size n = 30 n = 15 n = 45
Number of total SNP 8,390,501 6,011,186 9,492,123
Number of shared SNP 4,909,564
Upstream 55,163 38,265 62,906
Exonic
Nonsynonymous 18,326 12,515 21,062
Synonymous 27,142 17,223 30,804
Nonsyn/Syn ratio (ω) 0.67 0.73 0.68
Stop gain 332 217 389
Stop loss 91 67 99
Unknown 3,879 2,883 4,584
Intronic 2,232,946 1,577,151 2,519,351
Splicing 160 108 182
Downstream 55,794 39,246 63,798
Upstream/Downstream 607 437 725
Intergenic 5,996,061 4,323,074 6,788,223
The package ANNOVAR119 was used to identify whether SNPs cause protein coding
changes and the amino acids that are affected. ‘Upstream’ refers to a variant that overlaps
with the 1 kb region upstream of the gene start site. ‘Stop gain’ means that a
nonsynonymous SNP leads to the creation of a stop codon at the variant site. ‘Stop loss’
means that a nonsynonymous SNP leads to the elimination of a stop codon at the variant
site. ‘Unknown’ means unknown function (due to various errors in the gene structure
definition in the database file). ‘Splicing’ means that a variant is within 2 bp of a splice
junction. ‘Downstream’ means that a variant overlaps with the 1 kb region downstream of
the gene end site. ‘Upstream/Downstream’ means that a variant is located in downstream
and upstream regions (possibly for two different genes).
Nature Genetics: doi:10.1038/ng.2811
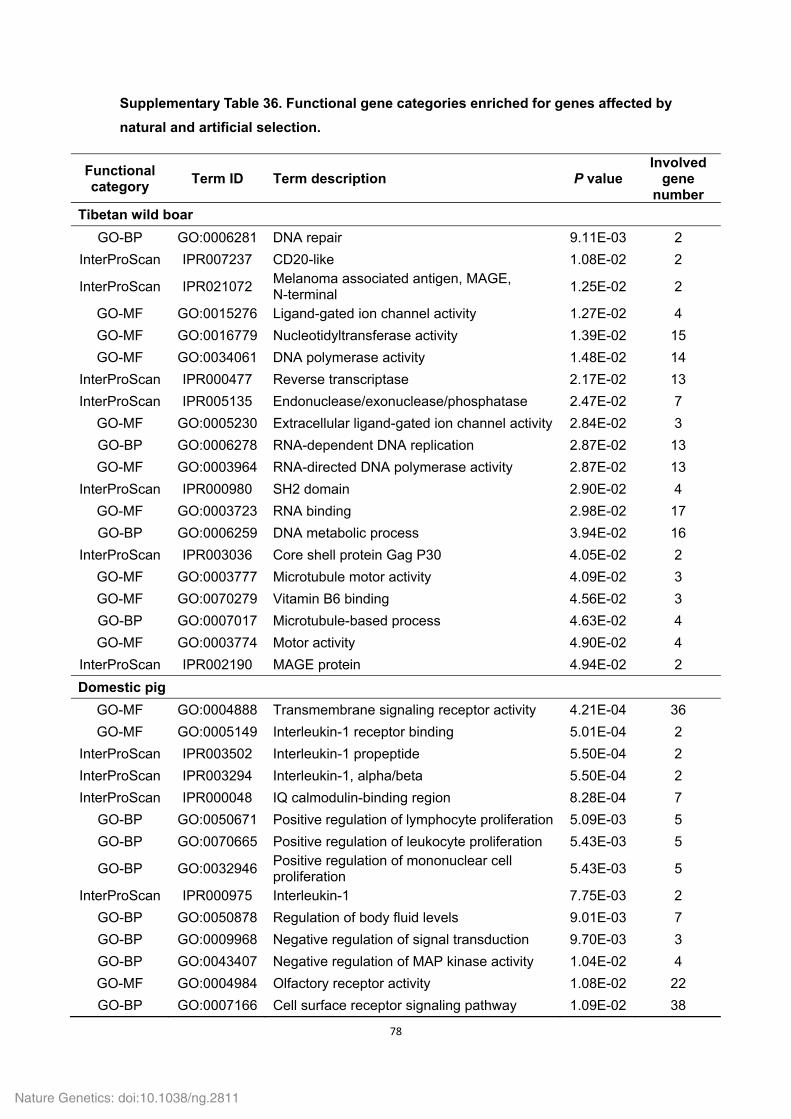
78
Supplementary Table 36. Functional gene categories enriched for genes affected by
natural and artificial selection.
Functional category
Term ID Term description P value Involved
gene number
Tibetan wild boar
GO-BP GO:0006281 DNA repair 9.11E-03 2
InterProScan IPR007237 CD20-like 1.08E-02 2
InterProScan IPR021072 Melanoma associated antigen, MAGE, N-terminal
1.25E-02 2
GO-MF GO:0015276 Ligand-gated ion channel activity 1.27E-02 4
GO-MF GO:0016779 Nucleotidyltransferase activity 1.39E-02 15
GO-MF GO:0034061 DNA polymerase activity 1.48E-02 14
InterProScan IPR000477 Reverse transcriptase 2.17E-02 13
InterProScan IPR005135 Endonuclease/exonuclease/phosphatase 2.47E-02 7
GO-MF GO:0005230 Extracellular ligand-gated ion channel activity 2.84E-02 3
GO-BP GO:0006278 RNA-dependent DNA replication 2.87E-02 13
GO-MF GO:0003964 RNA-directed DNA polymerase activity 2.87E-02 13
InterProScan IPR000980 SH2 domain 2.90E-02 4
GO-MF GO:0003723 RNA binding 2.98E-02 17
GO-BP GO:0006259 DNA metabolic process 3.94E-02 16
InterProScan IPR003036 Core shell protein Gag P30 4.05E-02 2
GO-MF GO:0003777 Microtubule motor activity 4.09E-02 3
GO-MF GO:0070279 Vitamin B6 binding 4.56E-02 3
GO-BP GO:0007017 Microtubule-based process 4.63E-02 4
GO-MF GO:0003774 Motor activity 4.90E-02 4
InterProScan IPR002190 MAGE protein 4.94E-02 2
Domestic pig
GO-MF GO:0004888 Transmembrane signaling receptor activity 4.21E-04 36
GO-MF GO:0005149 Interleukin-1 receptor binding 5.01E-04 2
InterProScan IPR003502 Interleukin-1 propeptide 5.50E-04 2
InterProScan IPR003294 Interleukin-1, alpha/beta 5.50E-04 2
InterProScan IPR000048 IQ calmodulin-binding region 8.28E-04 7
GO-BP GO:0050671 Positive regulation of lymphocyte proliferation 5.09E-03 5
GO-BP GO:0070665 Positive regulation of leukocyte proliferation 5.43E-03 5
GO-BP GO:0032946 Positive regulation of mononuclear cell proliferation
5.43E-03 5
InterProScan IPR000975 Interleukin-1 7.75E-03 2
GO-BP GO:0050878 Regulation of body fluid levels 9.01E-03 7
GO-BP GO:0009968 Negative regulation of signal transduction 9.70E-03 3
GO-BP GO:0043407 Negative regulation of MAP kinase activity 1.04E-02 4
GO-MF GO:0004984 Olfactory receptor activity 1.08E-02 22
GO-BP GO:0007166 Cell surface receptor signaling pathway 1.09E-02 38
Nature Genetics: doi:10.1038/ng.2811
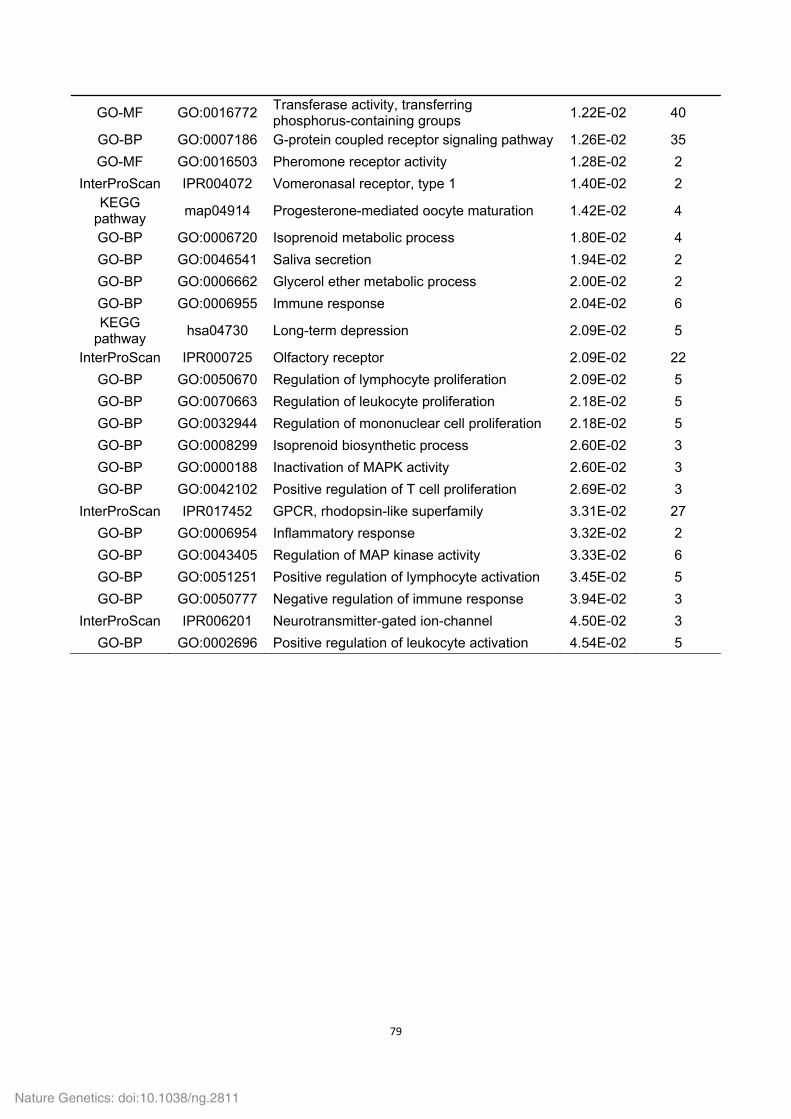
79
GO-MF GO:0016772 Transferase activity, transferring phosphorus-containing groups
1.22E-02 40
GO-BP GO:0007186 G-protein coupled receptor signaling pathway 1.26E-02 35
GO-MF GO:0016503 Pheromone receptor activity 1.28E-02 2
InterProScan IPR004072 Vomeronasal receptor, type 1 1.40E-02 2 KEGG
pathway map04914 Progesterone-mediated oocyte maturation 1.42E-02 4
GO-BP GO:0006720 Isoprenoid metabolic process 1.80E-02 4
GO-BP GO:0046541 Saliva secretion 1.94E-02 2
GO-BP GO:0006662 Glycerol ether metabolic process 2.00E-02 2
GO-BP GO:0006955 Immune response 2.04E-02 6 KEGG
pathway hsa04730 Long-term depression 2.09E-02 5
InterProScan IPR000725 Olfactory receptor 2.09E-02 22
GO-BP GO:0050670 Regulation of lymphocyte proliferation 2.09E-02 5
GO-BP GO:0070663 Regulation of leukocyte proliferation 2.18E-02 5
GO-BP GO:0032944 Regulation of mononuclear cell proliferation 2.18E-02 5
GO-BP GO:0008299 Isoprenoid biosynthetic process 2.60E-02 3
GO-BP GO:0000188 Inactivation of MAPK activity 2.60E-02 3
GO-BP GO:0042102 Positive regulation of T cell proliferation 2.69E-02 3
InterProScan IPR017452 GPCR, rhodopsin-like superfamily 3.31E-02 27
GO-BP GO:0006954 Inflammatory response 3.32E-02 2
GO-BP GO:0043405 Regulation of MAP kinase activity 3.33E-02 6
GO-BP GO:0051251 Positive regulation of lymphocyte activation 3.45E-02 5
GO-BP GO:0050777 Negative regulation of immune response 3.94E-02 3
InterProScan IPR006201 Neurotransmitter-gated ion-channel 4.50E-02 3
GO-BP GO:0002696 Positive regulation of leukocyte activation 4.54E-02 5
Nature Genetics: doi:10.1038/ng.2811
80
Supplementary Note
1 De novo sequencing, assembly and annotation of Tibetan wild boar
genome
1.1 Sequencing strategy and data generation
We used a whole genome shotgun strategy and next-generation sequencing
technologies on the Illumina HiSeq 2000 platform to sequence the genome of
Tibetan wild boar. DNA were extracted from a female Tibetan wild boar from
Daocheng County (~ 3,750 m altitude) in the Tibetan plateau of China. All the
animals and samples used in this study were collected according to the
guidelines for the care and use of experimental animals established by the
Ministry of Agriculture of China. Short-insert (180 bp and 500 bp) and
long-insert (2 kb, 5 kb and 10 kb) DNA libraries were constructed according to
the manufacturer’s specifications (Illumina), and read lengths were 101 bp, 75
bp and 51 bp (Supplementary Table 1). In total, we generated ~319.3 Gb of
sequence.
1.2 Sequence quality checking and filtering
To avoid reads with artificial bias (i.e. low quality paired reads, which mainly
result from base-calling duplicates and adapter contamination), we removed
the following type of reads:
(a) Reads with ≥ 10% unidentified nucleotides (N);
(b) Reads with > 10 nt aligned to the adapter, allowing ≤ 10% mismatches;
(c) Reads with > 50% bases having phred quality < 5; and
(d) Putative PCR duplicates generated by PCR amplification in the library
construction process (i.e. read 1 and read 2 of two paired-end reads that were
completely identical).
Consequently, 278.2 Gb (114.5 x coverage) was retained for assembly, of
which the quality of 95% and 90% of the bases were ≥ Q20 and ≥Q30,
respectively (Supplementary Table 1).
1.3 Estimation of genome size using K-mer method
To estimate the genome size of the Tibetan wild boar, we selected 130.05 Gb
high-quality reads from the short-insert reads (180 bp), and generated 19-mer
Nature Genetics: doi:10.1038/ng.2811
81
frequency information based on the K-mer analysis as implemented in the
software Meryl120,121. The estimate size of Tibetan wild boar genome is
2,379.31 Mb (~2.38 Gb) (Supplementary Fig. 4 and Supplementary Table
2).
1.4 De novo assembly
The paired-end reads of 180 bp, 500 bp and 2 kb DNA libraries were
processed using the error-correction module of ALLPATHS-LG122. We
assembled the Tibetan wild boar genome using SOAPdenovo, a de Bruijn
graph algorithm based de novo genome assembler123.
Firstly, the corrected reads of 180 bp and 500 bp DNA libraries were used to
construct the contig sequences employing 27-mers. Consequently, we
obtained a contig N50 size of 1,124 bp and a contig N90 size of 252 bp with
the fragments longer than 100 bp.
Secondly, we realigned all the reads, including those from the short-insert
libraries (180 bp and 500 bp) and the long-insert libraries (2 kb, 5 kb and 10
kb), onto the contig sequences with 83.60% of the aligned paired-end reads.
Thirdly, we constructed scaffolds using adjacent contigs identified by
paired-end information that had at least four consistent read pairs.
Consequently, the contig N50 and N90 sizes (based on fragments longer than
500 bp) within these scaffolds were improved to 10,830 bp and 2,411 bp,
respectively. The scaffold N50 and N90 sizes were also enhanced to
1,068,344 bp and 231,601 bp.
Fourthly, to close the gaps within the constructed scaffolds (caused mainly
by the presence of repeats that were masked during scaffold construction), we
used the paired-end information to retrieve the read pairs that had one read
well-aligned on the contigs and the other read located in the gap region, and
then performed a local assembly for these collected reads using the package
Gapcloser (version 1.12)123.
This last step improved the contig N50 and N90 sizes to 20,411 bp and
4,605 bp, and the scaffold N50 and N90 sizes to 1,049,950 and 227,167 bp,
respectively, with the fragments longer than 100 bp (Supplementary Table 3).
Consequently, a total length of ungapped sequence of 2.43 Gb was generated
Nature Genetics: doi:10.1038/ng.2811
82
for the Tibetan wild boar genome, similar to the amount generated for the
Duroc pig genome (2.52 Gb) (Table 1 and Supplementary Table 11).
1.5 Detections of heterozygous SNPs and deletion or insertion
polymorphisms (InDels)
To evaluate the heterozygosity rate for the Tibetan wild boar genome, we
realigned the ~216.2 Gb high-quality reads from short-insert libraries (180bp
and 500 bp) onto the genome assembly using the package BWA124
(Supplementary Fig. 7 and Supplementary Table 4). Then we preformed
SNP calling using the package SOAPsnp125, and finally obtained ~4.4 M
heterozygous SNPs for the Tibetan wild boar genome with a high-confidence
(i.e. the coverage depth ≥ 4 and ≤ 150, the genotype quality ≥ 20, copy number
≤ 2 and the distance of adjacent SNPs ≥ 5) (Supplementary Fig. 8), which
represents a heterozygous SNP rate in the wild Tibetan wild boar of 1.82 ×
10-3.
In addition, we performed InDel calling for the Tibetan wild boar genome
using a Bayesian approach implemented in the package SAMtools. The
‘mpileup’ command was used to identify InDels with the parameters ‘-m 2 -F
0.002 -d 1,000’. A total of 984,284 InDels were identified, ranging from 1 bp to
30 bp in length of which 982 (0.10%) were in coding regions (Supplementary
Fig. 11 and Supplementary Table 7).
1.6 Repeat annotation
After the genome assembly, we performed repeat annotation for the Tibetan
wild boar genome.
(a) Identification of known transposable elements (TEs)
We used RepeatMasker Vision 3.3.0 (Supplementary URLs) against the
Repbase TE library (RM database vision 20110920)126, and
RepeatProteinMask (Supplementary URLs) performing WU-BLASTX against
the TE protein database.
(b) De novo repeat prediction
Nature Genetics: doi:10.1038/ng.2811
83
We built a de novo repeat library for the Tibetan wild boar using
RepeatModeler Vision 1.0.5 (Supplementary URLs) which uses two core
programs, i.e. RECON127 and RepeatScout128 to generate the TE families.
(c) Identification of tandem repeats
We identified non-interspersed repeat sequences using RepeatMasker with
the “-nolow” option, including the simple repeat, satellites and low complexity
repeats. We also predicted tandem repeats using the package Tandem Repeat
Finder129, with parameters set to “Match=2, Mismatch=7, Delta=7, PM=80,
PI=10, Minscore=50, and MaxPeriod=12”.
In addition, to compare the TE characters among different genomes, we
performed repeat annotation for the Duroc pig, human and cattle genomes
based on the same pipeline used for the Tibetan wild boar (Supplementary
Fig. 10 and Supplementary Tables 5, 6).
1.7 Structural annotation of genes
The genes in the Tibetan wild boar genome were predicted using ab initio-,
and homology-based methods, and by incorporating evidence of transcription
from the RNA-seq data.
(a) Ab initio prediction
We used the ab initio predication packages Augustus130, Geneid131,
Genscan132, GlimmerHMM133 and SNAP134 with the parameters trained from a
set of high-quality homologous prediction proteins.
(b) Homology-based prediction
The protein repertoires of human, mouse, cattle, dog and the Duroc pig were
downloaded from Ensembl release 67 and mapped onto the repeat-masked
Tibetan wild boar genome using TBLASTn135. Then, homologous genome
sequences were aligned against the matching proteins using Genewise136 to
define gene models. Moreover, we aligned the porcine cDNA and EST
sequences onto the Tibetan wild boar genome, which provided the evidence
for the homology-based prediction.
(c) RNA-seq data
To optimize the genome annotation, four tissue RNA libraries (i.e. heart, liver,
lung and kidney) were constructed using the Illumina mRNA-Seq Prep Kit and
Nature Genetics: doi:10.1038/ng.2811
84
about 27.9 Gb of sequence was generated (100 bp at each end). RNA-seq
reads were aligned to both the Tibetan wild boar and Duroc pig reference
assemblies using TopHat (v2.0.7) 137 with default parameters to identify exons
region and splice positions (Supplementary Table 12). The alignment results
were then used as input for Cufflinks (v2.0.2)138 with default parameters for
genome-based transcript assembly. The final non-redundant reference gene
set was generated by merging genes predicted by three methods using
EvidenceModeler (EVM)139, and genes with ≤ 50 amino acids, or only with de
novo predictive support were removed (Supplementary Table 13). The final
reference gene set of the Tibetan wild boar was comprised of 21,806 genes
which is comparable with the gene repertoire of the Duroc pig genome (21,640
genes) (Supplementary Table 15).
1.8 Functional annotation of genes
Gene functions were assigned according to the best match of the alignment to
the SwissProt and TEMBL databases140, using BLASTP135. We annotated
motifs and domains using InterPro141 by searching against publicly available
databases, including Pfam142, PRINTS, PROSITE, ProDom, and SMART
using InterProScan141. Gene Ontology (GO) terms143 for each gene were
retrieved from the corresponding InterPro descriptions (Supplementary Table
16). Furthermore, we also mapped these Tibetan wild boar genes to the KEGG
pathway144 to identify the best match category for each gene.
1.9 non-coding RNA (ncRNA) annotations
The tRNA genes were predicted by tRNAscan-SE145 with eukaryote
parameters. The rRNA, microRNA (miRNA) and small nuclear (snRNA) were
identified using the Infernal software146 by searching against the Rfam
database147 with default parameters (Supplementary Table 10). In addition,
we filtered the miRNAs, snRNAs and tRNAs which were located in the repeat
or gap regions, as well as the rRNAs of short length (≤ 50 bp) and low identity
(≤ 85%).
2 Lineage-specific genes
2.1 Gene family cluster and orthology relationships
Nature Genetics: doi:10.1038/ng.2811
85
All DNA and protein data for the Duroc pig, human, mouse, cattle and dog
were downloaded from Ensembl database release 67. For genes with
alternative splicing variants, we chose the longest transcripts (≥ 30 amino
acids) to represent the genes. We used the Treefam methodology148 to define
a gene family as a group of genes that descended from a single gene in the
last common ancestor of the considered species. An all-against-all BLASTP135
was applied to determine the similarities between genes in three (Tibetan wild
boar, Duroc pig and human) or in six (Tibetan wild boar, Duroc pig, cattle, dog,
mouse and human) mammalian genomes with the e-value of 1e-7 and
conjoined fragmental alignments for each gene pair by Solar (Supplementary
Figs. 12, 14 and Supplementary URLs).
We assigned a connection (edge) between the two nodes (genes), if more
than 1/3 of the region aligned to both genes. A minimum edge weight that
ranged from 0 to 100 was used to weigh the similarity (edge). For clustering
protein coding genes into gene families, we used the average distance for the
hierarchical clustering algorithm by Hcluster_sg, requiring edge weight ≥ 10,
and the minimum edge density (total number of edges/theoretical number of
edges) ≥ 0.34.
2.2 Evidence of transcription for the Tibetan wild boar-specific genes
A total 27.9 Gb of RNA-seq sequences generated from the four libraries were
mapped to the Tibetan wild boar genome using TopHat137. Gene expression
levels were determined using the normalized RPKM values (reads per
kilobase per million mapped reads) (Supplementary Table 17).
3 Functional enrichment analyses for genes
Functional enrichment analysis of Gene Ontology (GO) terms and pathways
was performed using the DAVID (Database for Annotation, Visualization and
Integrated Discovery) web server149,150. Genes were submitted to DAVID for
enrichment analysis of the significant overrepresentation of GO biological
processes (GO-BP), molecular function (GO-MF) terminologies, and
categories of InterPro domain and KEGG-pathway. In all tests, the whole set of
known genes was appointed as the background, and P values (i.e. EASE
scores), indicating significance of the overlap between various gene sets, were
Nature Genetics: doi:10.1038/ng.2811
86
calculated using a Benjamini-corrected modified Fisher’s exact test. Only
GO-BP, GO-MF, KEGG-pathway or InterPro domain terms with a P value less
than 0.05 were considered as significant and listed.
4 Identification of pseudogenes
We identified 188 pseudogenes in the Tibetan wild boar genome, containing
137 frameshift and 60 premature termination events based on the in silico
filters and further manual examination (Supplementary Table 28). We first
aligned all human protein sequences from Ensembl release 67 onto the
Tibetan wild boar genome using TBLASTn135. Then the best matched regions
of each gene were reduced and re-aligned using GeneWise136, to help define
the exon-intron structure. To avoid splicing errors near the frameshift or
premature termination events, we also aligned human genes onto the human
genome with the same pipeline. Cases with high mapping quality (numbers of
reads covering ≥ 10 and with matched transcription reads), excluding any
splicing error, SNPs or InDels, but containing the frameshift or premature
termination events were considered as pseudogenes. In addition, we aligned
the re-sequencing data sets of 30 Tibetan wild boars to the Tibetan wild boar
genome assembly and further evaluated the candidate pseudogenes.
5 Population-based re-sequencing and SNP calling
5.1 Re-sequencing strategy and read mapping
We sampled a total 48 pigs, including 30 Tibetan wild boars, 15 domestic pigs
in China and three wild boars in Southwest China (Fig. 2a and
Supplementary Table 31). Sequencing was performed on the Illumina HiSeq
2000 platform, and generated a total of 659.4 Gb of paired-end DNA sequence.
The criteria for quality checking and filtering of sequence (see ‘1.2 Sequence
quality checking and filtering’) were also applied.
Consequently, 655.9 Gb (99.5%, out of 659.4 Gb) high quality paired-end
reads were mapped to the Tibetan wild boar genome assembly using the BWA
software124. First, the reference was indexed. Second, the command ‘aln -o 1
-e 10 -t 4 -l 32 -i 15 -q 10’ was used to find the suffix array coordinates of good
matches for each read. Third, the best alignments were generated in the SAM
Nature Genetics: doi:10.1038/ng.2811
87
format given paired-end reads with command ‘sampe’.
Next, we improved the alignment results with the following three steps:
(a) Filter the alignment read with mismatches ≤ 5 and mapping quality = 0;
(b) The alignment results were corrected using the package Picard
(Supplementary URLs) with two core commands. The
‘AddOrReplaceReadGroups’ command was used to replace all read groups in
the INPUT file with a new read group and assigns all reads to this read group
in the OUTPUT BAM. ‘FixMateInformation’ command was used to ensure that
all mate-pair information was in sync between each read and its mate pair;
(c) Remove potential PCR duplication. If multiple read pairs have identical
external coordinates, only retain the pair with the highest mapping quality.
Finally, for each individual, ~91.99% of reads mapped to 94.63% (at least 1 ×)
or 64.55% (at least 4 ×) of the reference genome assembly of the Tibetan wild
boar with 4.95-fold average depth (Supplementary Table 31).
In addition, we downloaded the genome data of 55 individuals (a total of
1,037 Gb genome data) from across the world from the EMBL-EBI database
(accession number ERP001813), including 30 European domestic pigs, 7
domestic pigs in Southeast China, 7 Asian wild boars, 6 European wild boars,
4 other species in the genus Sus, and an African warthog, with 6.72-fold
average depth, 97.77% mapping rate and ~80.69% (at least 1 ×) or ~67.16%
(at least 4 ×) coverage of the Tibetan wild boar genome (Fig. 2a and
Supplementary Table 32). The lower mapping rate of Tibetan wild boar
re-sequences (see ‘1.2 Sequence quality checking and filtering’) than
sequences of other pigs to Tibetan wild boar genome is likely due to more
stringent filtering criteria used in other pig genome studies (e.g. phred quality
≤ 20) 7-9. When reads with phred quality ≤ 20 were filtered, the mapping rates
of Tibetan wild boars to the Tibetan wild boar genome increased to 98.90%,
which is higher than the mapping rate of any downloaded pig genome data set
to the Tibetan wild boar genome.
5.2 SNP calling
After alignment, we performed SNP calling on a population-scale for three
groups (30 Tibetan wild boars, 52 domestic pigs, and 21 wild boars and wild
Nature Genetics: doi:10.1038/ng.2811
88
genus sus) using a Bayesian approach as implemented in the package
SAMtools151. The genotype likelihoods from reads for each individual at each
genomic location were calculated, and the allele frequencies were also
estimated. The ‘mpileup’ command was used to identify SNPs with the
parameters as ‘-q 1 -C 50 -S -D -m 2 -F 0.002 –u’.
Then, only the high quality SNPs (coverage depth ≥ 4 and ≤ 1,000, RMS
mapping quality ≥ 20, the distance of adjacent SNPs ≥ 5 bp and the missing
ratio of samples within each group < 50%) were kept for the subsequent
analysis. In total, we identified 14,637,670 (14.64 M) SNPs from 103
individuals (Supplementary Table 33). We then pooled separately and
obtained SNP sets for each of three groups, including 8,390,501 (8.39 M) from
the 30 Tibetan wild boars, 9,173,377 (9.17 M) from the 52 domestic pigs, and
7,780,578 (7.78 M) from the 21 wild boars as well as individuals of the wild
genus Sus (Supplementary Tables 33 and 35). The small proportion of (3.02
M of 14.64 M, 20.63%) SNPs were shared among the three groups, which
indicated the larger differences of genomic backgrounds among them.
6 Demographic history reconstruction
Demographic history of seven wild boars (three in Europe and four in Asia),
and six Tibetan wild boars from six geographically diverse populations was
inferred using a hidden Markov model (HMM) approach as implemented in
pairwise sequentially Markovian coalescence (PSMC) based on SNP
distribution152 (Fig. 2e). To improve the accuracy of inferred historical
recombination events, we only used the scaffolds larger than 50 kb (~93.85%
of all scaffolds) and ~7.6 M heterozygous SNPs for each individual were used
to reconstruct a demographic history. The program `fq2psmcfa' was used to
transform the consensus sequence into a fasta-like format where the i-th
character in the output sequence indicates whether there is at least one
heterozygote in the bin [100i, 100i+100). Parameters were set as follows:
‘−N30 −t15 −r5 −p ‘4+25*2+4+6’. The porcine generation time (g) = 5 years,
and neutral mutation rate per generation (μ) = 2.5 x 10⁻⁸ were based on
previous reports 7,9.
In addition, climate change and migration are two important factors
Nature Genetics: doi:10.1038/ng.2811
89
influencing population size. Thus, we obtained atmospheric surface air
temperature (℃) and global relative sea level (10 m) data of the past 1 million
years from National Climatic Data Center (NCDC) (Supplementary URLs)
and combined them together with the demographic data into a single plot. Note
that PSMC simulation cannot detect population changes more recent than
10,000 years ago.
7 Linkage-disequilibrium (LD) analysis
To estimate the LD patterns between Tibetan wild boars and Chinese domestic
pigs, we used 6.01 M SNPs of 15 Chinese domestic pigs and merged them
with SNPs of the Tibetan wild boars resulting in 9.49 M SNPs in total. To
evaluate LD decay, the coefficient of determination (r2) between any two loci
was calculated using Haploview153 (Fig. 3a). Parameters were set as follows:
‘-n -dprime -minGeno 0 -missingCutoff 1 -minMAF 0.01’. Average r2 was
calculated for pairwise markers in a 500 kb window and averaged across the
whole genome.
Supplementary URLs
Breakdancer, http://gmt.genome.wustl.edu/breakdancer/1.2/index.html; Bioinf
ormatics and Systems Biology of Gent, http://bioinformatics.psb.ugent.be/w
ebtools/Venn/; InParanoid, http://inparanoid.sbc.su.se/cgi-bin/index.cgi; Multi
Paranoid, http://multiparanoid.sbc.su.se/; MEGA 5.15, http://www.megasoft
ware.net/; LASTZ, http://www.bx.psu.edu/miller_lab/; RepeatMasker, Repea
tProteinMask and RepeatModeler, http://www.RepeatMasker.org; Solar, htt
p://treesoft.svn.sourceforge.net/viewrc/treesoft/, Picard, http://sourceforge.
net/projects/picard/; National Climatic Data Center (NCDC), http://www.ncd
c.noaa.gov/.
Nature Genetics: doi:10.1038/ng.2811
90
Supplementary References
1 Feuk, L. et al. Discovery of human inversion polymorphisms by comparative
analysis of human and chimpanzee DNA sequence assemblies. PLoS Genet. 1,
e56, (2005).
2 Lai, J. et al. Genome-wide patterns of genetic variation among elite maize inbred
lines. Nat. Genet. 42, 1027-1030 (2010).
3 Xu, X. et al. Resequencing 50 accessions of cultivated and wild rice yields markers
for identifying agronomically important genes. Nat. Biotechnol. 30, 105-111,
(2012).
4 Nguyen, D. T. et al. The complete swine olfactory subgenome: expansion of the
olfactory gene repertoire in the pig genome. BMC Genomics 13, 584 (2012).
5 Quignon, P. et al. The dog and rat olfactory receptor repertoires. Genome Biol. 6,
R83 (2005).
6 Castillo-Davis, et al. The functional genomic distribution of protein divergence in
two animal phyla: coevolution, genomic conflict, and constraint. Genome Res. 14,
802-811 (2004).
7 Groenen, M. A. et al. Analyses of pig genomes provide insight into porcine
demography and evolution. Nature 491, 393-398 (2012).
8 Rubin, C. J. et al. Strong signatures of selection in the domestic pig genome. Proc.
Natl. Acad. Sci. USA 109, 19529-19536 (2012).
9 Bosse, M. et al. Regions of homozygosity in the porcine genome: consequence of
demography and the recombination landscape. PLoS Genet. 8, e1003100 (2012).
10 Romanenko, V., Nakamoto, T., Srivastava, A., Melvin, J. E. & Begenisich, T.
Molecular identification and physiological roles of parotid acinar cell maxi-K
channels. J. Biol. Chem. 281, 27964-27972 (2006).
11 Liu, X. et al. Attenuation of store-operated Ca2+ current impairs salivary gland fluid
secretion in TRPC1(-/-) mice. Proc. Natl. Acad. Sci. USA 104, 17542-17547
(2007).
12 Beall, C. M. et al. Natural selection on EPAS1 (HIF2α) associated with low
hemoglobin concentration in Tibetan highlanders. Proc. Natl. Acad. Sci. USA 107,
11459-11464 (2010).
13 Bigham, A. et al. Identifying signatures of natural selection in Tibetan and Andean
populations using dense genome scan data. PLoS Genet. 6 (2010).
14 Simonson, T. S. et al. Genetic evidence for high-altitude adaptation in Tibet.
Science 329, 72-75 (2010).
15 Yi, X. et al. Sequencing of 50 human exomes reveals adaptation to high altitude.
Science 329, 75-78 (2010).
16 Peng, Y. et al. Genetic variations in Tibetan populations and high-altitude
adaptation at the Himalayas. Mol. Biol. Evol. 28, 1075-1081 (2011).
17 Xu, S. et al. A genome-wide search for signals of high-altitude adaptation in
Tibetans. Mol. Biol. Evol. 28, 1003-1011 (2011).
Nature Genetics: doi:10.1038/ng.2811
91
18 Ji, L. D. et al. Genetic adaptation of the hypoxia-inducible factor pathway to
oxygen pressure among eurasian human populations. Mol. Biol. Evol. 29,
3359-3370 (2012).
19 Scheinfeldt, L. B. et al. Genetic adaptation to high altitude in the Ethiopian
highlands. Genome Biol. 13, R1 (2012).
20 Rankinen, T. et al. The human obesity gene map: the 2005 update. Obesity 14,
529-644 (2006).
21 MacDougald, O. A. & Burant, C. F. The rapidly expanding family of adipokines.
Cell. Metab. 6, 159-161 (2007).
22 Heid, I. M. et al. Meta-analysis identifies 13 new loci associated with waist-hip
ratio and reveals sexual dimorphism in the genetic basis of fat distribution. Nat.
Genet. 42, 949-960 (2010).
23 Speliotes, E. K. et al. Association analyses of 249,796 individuals reveal 18 new
loci associated with body mass index. Nat. Genet. 42, 937-948 (2010).
24 Li, M. et al. An atlas of DNA methylomes in porcine adipose and muscle tissues.
Nat. Commun.3, 850 (2012).
25 Yang, Z. PAML: a program package for phylogenetic analysis by maximum
likelihood. Comput. Appl. Biosci. 13, 555-556 (1997).
26 Lace, B. et al. BCL3 gene role in facial morphology. Birth. Defects Res. A Clin. Mol.
Teratol. 94, 918-924 (2012).
27 Wang, Y. & Lu, L. Activation of oxidative stress-regulated Bcl-3 suppresses CTCF
in corneal epithelial cells. PloS One 6, e23984 (2011).
28 Yu, H. et al. Association between single nucleotide polymorphisms in ERCC4 and
risk of squamous cell carcinoma of the head and neck. PloS One 7, e41853
(2012).
29 Krupa, R. et al. Polymorphisms of the DNA repair genes XRCC1 and ERCC4 are
not associated with smoking- and drinking-dependent larynx cancer in a Polish
population. Exp. Oncol. 33, 55-56 (2011).
30 Muftuoglu, M. et al. Cockayne syndrome group B protein stimulates repair of
formamidopyrimidines by NEIL1 DNA glycosylase. J. Biol. Chem. 284, 9270-9279
(2009).
31 Kim, H., Yang, K., Dejsuphong, D. & D'Andrea, A. D. Regulation of Rev1 by the
Fanconi anemia core complex. Nat. Struct. Mol. Biol. 19, 164-170 (2012).
32 Kuang, L. et al. A non-catalytic function of Rev1 in translesion DNA synthesis and
mutagenesis is mediated by its stable interaction with Rad5. DNA repair 12, 27-37
(2013).
33 Pajukanta, P. et al. Familial combined hyperlipidemia is associated with upstream
transcription factor 1 (USF1). Nat. Genet. 36, 371-376 (2004).
34 Corre, S. et al. In vivo and ex vivo UV-induced analysis of pigmentation gene
expressions. J. Invest. Dermatol. 126, 916-918 (2006).
35 Majerus, M. E. & Mundy, N. I. Mammalian melanism: natural selection in black and
Nature Genetics: doi:10.1038/ng.2811
92
white. Trends Genet. 19, 585-588 (2003).
36 Fang, M., Larson, G., Ribeiro, H. S., Li, N. & Andersson, L. Contrasting mode of
evolution at a coat color locus in wild and domestic pigs. PLoS Genet. 5,
e1000341 (2009).
37 Yuan, J., Ghosal, G. & Chen, J. The HARP-like domain-containing protein
AH2/ZRANB3 binds to PCNA and participates in cellular response to replication
stress. Mol. Cell 47, 410-421 (2012).
38 Ciccia, A. et al. Polyubiquitinated PCNA recruits the ZRANB3 translocase to
maintain genomic integrity after replication stress. Mol. Cell 47, 396-409 (2012).
39 Andersson, O., Korach-Andre, M., Reissmann, E., Ibanez, C. F. & Bertolino, P.
Growth/differentiation factor 3 signals through ALK7 and regulates accumulation
of adipose tissue and diet-induced obesity. Proc. Natl. Acad. Sci. USA 105,
7252-7256 (2008).
40 Malik, S. G. et al. Association of β3-adrenergic receptor (ADRB3) Trp64Arg gene
polymorphism with obesity and metabolic syndrome in the Balinese: a pilot study.
BMC Res. Notes 4, 167 (2011).
41 Zawodniak-Szalapska, M. et al. Association of Trp64Arg polymorphism of
β3-adrenergic receptor with insulin resistance in Polish children with obesity. J.
Pediatr. Endocrinol. Metab. 21, 147-154 (2008).
42 Subauste, A. R. et al. Alterations in lipid signaling underlie lipodystrophy
secondary to AGPAT2 mutations. Diabetes 61, 2922-2931 (2012).
43 Agarwal, A. K. et al. AGPAT2 is mutated in congenital generalized lipodystrophy
linked to chromosome 9q34. Nat. Genet. 31, 21-23 (2002).
44 Shen, J. J. et al. Deficiency of growth differentiation factor 3 protects against
diet-induced obesity by selectively acting on white adipose. Mol. Endocrinol. 23,
113-123 (2009).
45 Laviano, A., Molfino, A., Rianda, S. & Rossi Fanelli, F. The growth hormone
secretagogue receptor (ghs-R). Curr. Pharm. Des. 18, 4749-4754 (2012).
46 Gauna, C. et al. Unacylated ghrelin is not a functional antagonist but a full agonist
of the type 1a growth hormone secretagogue receptor (GHS-R). Mol. Cell
Endocrinol. 274, 30-34 (2007).
47 Gottardo, L. et al. A polymorphism at the IL6ST (gp130) locus is associated with
traits of the metabolic syndrome. Obesity 16, 205-210 (2012).
48 Lin, F. H., Chu, N. F., Lee, C. H., Hung, Y. J. & Wu, D. M. Combined effect of
C-reactive protein gene SNP +2147 A/G and interleukin-6 receptor gene SNP
rs2229238 C/T on anthropometric characteristics among school children in Taiwan.
Int. J. Obes. 35, 587-594 (2011).
49 Camara-Clayette, V. et al. Transcriptional regulation of the KEL gene and Kell
protein expression in erythroid and non-erythroid cells. Biochem. J. 356, 171-180
(2001).
50 Ingallinella, P. et al. PEGylation of neuromedin U yields a promising candidate for
Nature Genetics: doi:10.1038/ng.2811
93
the treatment of obesity and diabetes. Bioorgan. Med. Chem. 20, 4751-4759
(2012).
51 Malendowicz, L. K., Ziolkowska, A. & Rucinski, M. Neuromedins U and S
involvement in the regulation of the hypothalamo-pituitary-adrenal axis. Front.
Endocrinol. 3, 156 (2012).
52 Lu, B. et al. Expression of the phospholipid scramblase (PLSCR) gene family
during the acute phase response. Biochim. Biophys. Acta. 1771, 1177-1185
(2007).
53 Charos, A. E. et al. A highly integrated and complex PPARGC1A transcription
factor binding network in HepG2 cells. Genome Res. 22, 1668-1679 (2012).
54 Gemma, C. et al. Maternal pregestational BMI is associated with methylation of
the PPARGC1A promoter in newborns. Obesity 17, 1032-1039 (2009).
55 Connelly, M. A. & Williams, D. L. Scavenger receptor BI: a scavenger receptor
with a mission to transport high density lipoprotein lipids. Curr. Opin. Lipidol. 15,
287-295 (2004).
56 Jeyakumar, S. M., Vajreswari, A. & Giridharan, N. V. Impact of vitamin A on
high-density lipoprotein-cholesterol and scavenger receptor class BI in the obese
rat. Obesity 15, 322-329 (2007).
57 Le, M. T. et al. Impact of Genetic Polymorphisms of SLC2A2, SLC2A5, and KHK
on Metabolic Phenotypes in Hypertensive Individuals. PloS One 8, e52062 (2013).
58 Suviolahti, E. et al. The SLC6A14 gene shows evidence of association with
obesity. J. Clin. Invest. 112, 1762 (2003).
59 Walley, A. J., Asher, J. E. & Froguel, P. The genetic contribution to non-syndromic
human obesity. Nat. Rev. Genet. 10, 431-442 (2009).
60 Epstein, L. H. et al. Dopamine transporter genotype as a risk factor for obesity in
African-American smokers. Obesity Res. 10, 1232-1240 (2002).
61 van Dyck, C. H. et al. Increased dopamine transporter availability associated with
the 9-repeat allele of the SLC6A3 gene. J. Nucl. Med. 46, 745-751 (2005).
62 Benjafield, A. V., Glenn, C. L., Wang, X. L., Colagiuri, S. & Morris, B. J.
TNFRSF1B in genetic predisposition to clinical neuropathy and effect on HDL
cholesterol and glycosylated hemoglobin in type 2 diabetes. Diabetes Care 24,
753-757 (2001).
63 Tabassum, R. et al. Association analysis of TNFRSF1B polymorphisms with type
2 diabetes and its related traits in North India. Genomic Medicine 2, 93-100
(2008).
64 Motter, A. L. & Ahern, G. P. TRPV1-null mice are protected from diet-induced
obesity. FEBS Lett. 582, 2257-2262 (2008).
65 Garami, A. et al. Thermoregulatory phenotype of the Trpv1 knockout mouse:
thermoeffector dysbalance with hyperkinesis. J. Neurosci. 31, 1721-1733 (2011).
66 Suri, A. & Szallasi, A. The emerging role of TRPV1 in diabetes and obesity. Trends
Pharmacol. Sci. 29, 29-36 (2008).
Nature Genetics: doi:10.1038/ng.2811
94
67 Qi, L. et al. TRB3 links the E3 ubiquitin ligase COP1 to lipid metabolism. Science
312, 1763-1766 (2006).
68 Sorrentino, V. & Zelcer, N. Post-transcriptional regulation of lipoprotein receptors
by the E3-ubiquitin ligase inducible degrader of the low-density lipoprotein
receptor. Curr. Opin. Lipidol. 23, 213-219 (2012).
69 Tortorella, M. D., Malfait, F., Barve, R. A., Shieh, H. S. & Malfait, A. M. A review of
the ADAMTS family, pharmaceutical targets of the future. Curr. Pharm. Des. 15,
2359-2374 (2009).
70 Wagstaff, L., Kelwick, R., Decock, J. & Edwards, D. R. The roles of ADAMTS
metalloproteinases in tumorigenesis and metastasis. Front. Biosci. 16, 1861-1872
(2011).
71 Reder, N. P. et al. Adrenergic α-1 pathway is associated with hypertension among
Nigerians in a pathway-focused analysis. PloS One 7, e37145 (2012).
72 Ro, H. S. et al. Adipocyte enhancer-binding protein 1 modulates adiposity and
energy homeostasis. Obesity 15, 288-302 (2007).
73 Elosua, R. et al. Obesity modulates the association among APOE genotype,
insulin, and glucose in men. Obesity Res. 11, 1502-1508 (2012).
74 Wang, J. et al. ApoE and the role of very low density lipoproteins in adipose tissue
inflammation: ApoE and adipose tissue inflammation. Atherosclerosis (2012).
75 Badano, J. L. et al. Identification of a novel Bardet-Biedl syndrome protein, BBS7,
that shares structural features with BBS1 and BBS2. Am. J. Hum. Genet. 72,
650-658 (2003).
76 Nachury, M. V. et al. A core complex of BBS proteins cooperates with the GTPase
Rab8 to promote ciliary membrane biogenesis. Cell 129, 1201-1213 (2007).
77 Katsanis, N. et al. Triallelic inheritance in Bardet-Biedl syndrome, a Mendelian
recessive disorder. Science 293, 2256-2259 (2001).
78 Thirone, A. C., Carvalheira, J. B., Hirata, A. E., Velloso, L. A. & Saad, M. J.
Regulation of Cbl-associated protein/Cbl pathway in muscle and adipose tissues
of two animal models of insulin resistance. Endocrinology 145, 281-293 (2004).
79 Taniguchi, C. M., Emanuelli, B. & Kahn, C. R. Critical nodes in signalling pathways:
insights into insulin action. Nat. Rev. Mol. Cell Bio. 7, 85-96 (2006).
80 Yu, Y. et al. Neuronal Cbl controls biosynthesis of insulin-like peptides in
Drosophila melanogaster. Mol. Cell Biol. 32, 3610-3623 (2012).
81 Huang, Y. S., Kan, M. C., Lin, C. L. & Richter, J. D. CPEB3 and CPEB4 in neurons:
analysis of RNA-binding specificity and translational control of AMPA receptor
GluR2 mRNA. EMBO J. 25, 4865-4876 (2006).
82 Harris, C. A. et al. DGAT enzymes are required for triacylglycerol synthesis and
lipid droplets in adipocytes. J. Lipid. Res. 52, 657-667 (2011).
83 Chen, H. C. Enhancing energy and glucose metabolism by disrupting triglyceride
synthesis: Lessons from mice lacking DGAT1. Nutr. Metab. 3, 10 (2006).
84 Lee, D. et al. Epiregulin is not essential for development of intestinal tumors but is
Nature Genetics: doi:10.1038/ng.2811
95
required for protection from intestinal damage. Mol. Cell. Biol. 24, 8907-8916
(2004).
85 Bohme, M. et al. Association between functional FABP2 promoter haplotypes and
body mass index: analyses of 8,072 participants of the KORA cohort study. Mol.
Nutr. Food. Res. 53, 681-685 (2009).
86 Martinez-Lopez, E. et al. Effect of Ala54Thr polymorphism of FABP2 on
anthropometric and biochemical variables in response to a moderate-fat diet.
Nutrition 29, 46-51 (2013).
87 Camats, N. et al. Contribution of human growth hormone-releasing hormone
receptor (GHRHR) gene sequence variation to isolated severe growth hormone
deficiency (ISGHD) and normal adult height. Clin. Endocrinol. 77, 564-574 (2012).
88 Lee, L. T. et al. Discovery of growth hormone-releasing hormones and receptors in
nonmammalian vertebrates. Proc. Natl. Acad. Sci. USA 104, 2133-2138 (2007).
89 Mracek, T., Drahota, Z. & Houstek, J. The function and the role of the
mitochondrial glycerol-3-phosphate dehydrogenase in mammalian tissues.
Biochim. Biophys. Acta. 1827, 401-410 (2012).
90 Muoio, D. M. & Newgard, C. B. Obesity-related derangements in metabolic
regulation. Annu. Rev. Biochem. 75, 367-401 (2006).
91 Koh, H. J. et al. Cytosolic NADP+ dependent isocitrate dehydrogenase plays a key
role in lipid metabolism. J. Biol. Chem. 279, 39968-39974 (2004).
92 Sutter, N. B. et al. A single IGF1 allele is a major determinant of small size in dogs.
Science 316, 112-115 (2007).
93 Boucher, J. et al. Impaired thermogenesis and adipose tissue development in
mice with fat-specific disruption of insulin and IGF-1 signalling. Nat. Commun.3,
902 (2012).
94 Xu, J. et al. The voltage-gated potassium channel Kv1.3 regulates peripheral
insulin sensitivity. Proc. Natl. Acad. Sci. USA 101, 3112-3117 (2004).
95 Tucker, K., Overton, J. M. & Fadool, D. A. Kv1.3 gene-targeted deletion alters
longevity and reduces adiposity by increasing locomotion and metabolism in
melanocortin 4 receptor-null mice. Int. J. Obes. 32, 1222-1232 (2008).
96 Sadagurski, M. et al. IRS2 signaling in LepR-b neurons suppresses FoxO1 to
control energy balance independently of leptin action. Cell. Metab. 15 (2012).
97 Myers, M. G., Jr. & Olson, D. P. Central nervous system control of metabolism.
Nature 491, 357-363 (2012).
98 Macia, L. et al. Neuropeptide Y1 receptor in immune cells regulates inflammation
and insulin resistance associated with diet-induced obesity. Diabetes 61,
3228-3238 (2012).
99 Rojas, J. M. et al. Central nervous system neuropeptide Y signaling via the Y1
receptor partially dissociates feeding behavior from lipoprotein metabolism in lean
rats. Am. J. Physiol. Endocrinol. Metab. 303, E1479-1488 (2012).
100 Mul, J. D. et al. Pmch expression during early development is critical for normal
Nature Genetics: doi:10.1038/ng.2811
96
energy homeostasis. Am. J. Physiol. Endocrinol. Metab. 298, 477-488 (2010).
101 Kokkotou, E. et al. Melanin-concentrating hormone as a mediator of intestinal
inflammation. Proc. Natl. Acad. Sci. USA 105, 10613-10618 (2008).
102 Wang, S. et al. Activation of AMP-activated protein kinase α2 by nicotine instigates
formation of abdominal aortic aneurysms in mice in vivo. Nat. Med. 18, 902-910
(2012).
103 Lee-Young, R. S. et al. Obesity impairs skeletal muscle AMPK signaling during
exercise: role of AMPK α2 in the regulation of exercise capacity in vivo. Int. J.
Obes. 35, 982-989 (2011).
104 Tiganis, T. PTP1B and TCPTP - nonredundant phosphatases in insulin signaling
and glucose homeostasis. FEBS J. (2012).
105 Tonks, N. K. Protein tyrosine phosphatases: from genes, to function, to disease.
Nat. Rev. Mol. Cell Bio.7, 833-846 (2006).
106 Huang, Y. J. et al. Recombinant human butyrylcholinesterase from milk of
transgenic animals to protect against organophosphate poisoning. Proc. Natl.
Acad. Sci. USA 104, 13603-13608 (2007).
107 Ilyushin, D. G. et al. Chemical polysialylation of human recombinant
butyrylcholinesterase delivers a long-acting bioscavenger for nerve agents in vivo.
Proc. Natl. Acad. Sci. USA 110, 1243-1248 (2013).
108 Geyer, B. C. et al. Plant-derived human butyrylcholinesterase, but not an
organophosphorous-compound hydrolyzing variant thereof, protects rodents
against nerve agents. Proc. Natl. Acad. Sci. USA 107, 20251-20256 (2010).
109 De Boer, A., Van der Sandt, I. & Gaillard, P. The role of drug transporters at the
blood-brain barrier. Annu. Rev. Pharmacol. 43, 629-656 (2003).
110 Das, M. & Das, D. K. Caveolae, caveolin, and cavins: potential targets for the
treatment of cardiac disease. Ann. Med. 44, 530-541 (2012).
111 Narendra, S., Valente, A., Tull, J. & Zhang, S. DDIT3 gene break-apart as a
molecular marker for diagnosis of myxoid liposarcoma assay validation and
clinical experience. Diagn. Mol. Pathol. 20, 218-224 (2011).
112 Nemoto, K. et al. Characteristics of nobiletin-mediated alteration of gene
expression in cultured cell lines. Biochem. Biophys. Res. Commun.,
doi:10.1016/j.bbrc.2013.01.024 (2013).
113 Wilkie, M. J. et al. Polymorphisms in the SLC6A4 and HTR2A genes influence
treatment outcome following antidepressant therapy. Pharmacogenomics J. 9,
61-70 (2009).
114 Wrzosek, M. et al. Serotonin 2A receptor gene (HTR2A) polymorphism in
alcohol-dependent patients. Pharmacol. Rep. 64, 449-453 (2012).
115 Kim, E. J. et al. Alzheimer's disease risk factor lymphocyte-specific protein
tyrosine kinase regulates long-term synaptic strengthening, spatial learning and
memory. Cell Mol. Life Sci., doi:10.1007/s00018-012-1168-1 (2013).
116 Venkitachalam, S., Chueh, F. Y., Leong, K. F., Pabich, S. & Yu, C. L. Suppressor of
Nature Genetics: doi:10.1038/ng.2811
97
cytokine signaling 1 interacts with oncogenic lymphocyte-specific protein tyrosine
kinase. Oncol. Rep. 25, 677-683 (2011).
117 Simonaro, C. M. et al. Imprinting at the SMPD1 locus: implications for acid
sphingomyelinase-deficient Niemann-Pick disease. Am. J. Hum. Genet. 78,
865-870 (2006).
118 Kirkegaard, T. et al. Hsp70 stabilizes lysosomes and reverts Niemann-Pick
disease-associated lysosomal pathology. Nature 463, 549-553 (2010).
119 Wang, K., Li, M. & Hakonarson, H. ANNOVAR: functional annotation of genetic
variants from high-throughput sequencing data. Nucleic Acids Res. 38, e164
(2010).
120 Myers, E. W. et al. A whole-genome assembly of Drosophila. Science 287,
2196-2204 (2000).
121 Li, R. et al. The sequence and de novo assembly of the giant panda genome.
Nature 463, 311-317 (2010).
122 Butler, J. et al. ALLPATHS: De novo assembly of whole-genome shotgun
microreads. Genome Res. 18, 810-820 (2008).
123 Li, R. et al. De novo assembly of human genomes with massively parallel short
read sequencing. Genome Res. 20, 265-272 (2010).
124 Li, H. & Durbin, R. Fast and accurate short read alignment with Burrows-Wheeler
transform. Bioinformatics 25, 1754-1760 (2009).
125 Li, R. et al. SNP detection for massively parallel whole-genome resequencing.
Genome Res. 19, 1124-1132 (2009).
126 Jurka, J. et al. Repbase Update, a database of eukaryotic repetitive elements.
Cytogenet. Genome Res. 110, 462-467 (2005).
127 Bao, Z. & Eddy, S. R. Automated de novo identification of repeat sequence
families in sequenced genomes. Genome Res. 12, 1269-1276 (2002).
128 Price, A. L., Jones, N. C. & Pevzner, P. A. De novo identification of repeat families
in large genomes. Bioinformatics 21 Suppl 1, 351-358 (2005).
129 Benson, G. Tandem repeats finder: a program to analyze DNA sequences. Nucleic
Acids Res. 27, 573-580 (1999).
130 Stanke, M. & Waack, S. Gene prediction with a hidden Markov model and a new
intron submodel. Bioinformatics 19 Suppl 2, 215-225 (2003).
131 Parra, G., Blanco, E. & Guigo, R. GeneID in Drosophila. Genome Res. 10,
511-515 (2000).
132 Salamov, A. A. & Solovyev, V. V. Ab initio gene finding in Drosophila genomic DNA.
Genome Res. 10, 516-522 (2000).
133 Majoros, W. H., Pertea, M. & Salzberg, S. L. TigrScan and GlimmerHMM: two
open source ab initio eukaryotic gene-finders. Bioinformatics 20, 2878-2879
(2004).
134 Korf, I. Gene finding in novel genomes. BMC bioinformatics 5, 59 (2004).
135 Kent, W. J. BLAT--the BLAST-like alignment tool. Genome Res. 12, 656-664
Nature Genetics: doi:10.1038/ng.2811
98
(2002).
136 Birney, E., Clamp, M. & Durbin, R. GeneWise and Genomewise. Genome Res. 14,
988-995 (2004).
137 Trapnell, C., Pachter, L. & Salzberg, S. L. TopHat: discovering splice junctions with
RNA-Seq. Bioinformatics 25, 1105-1111 (2009).
138 Trapnell, C. et al. Transcript assembly and quantification by RNA-Seq reveals
unannotated transcripts and isoform switching during cell differentiation. Nat.
Biotechnol. 28, 511-515 (2010).
139 Haas, B. J. et al. Automated eukaryotic gene structure annotation using
EVidenceModeler and the program to assemble spliced alignments. Genome Biol.
9, R7 (2008).
140 Bairoch, A. & Apweiler, R. The SWISS-PROT protein sequence database and its
supplement TrEMBL in 2000. Nucleic Acids Res. 28, 45-48 (2000).
141 Mulder, N. & Apweiler, R. InterPro and InterProScan: tools for protein sequence
classification and comparison. Methods Mol. Biol. 396, 59-70 (2007).
142 Punta, M. et al. The Pfam protein families database. Nucleic Acids Res. 40,
D290-301 (2012).
143 Ashburner, M. et al. Gene ontology: tool for the unification of biology. The Gene
Ontology Consortium. Nat. Genet. 25, 25-29 (2000).
144 Kanehisa, M. & Goto, S. KEGG: kyoto encyclopedia of genes and genomes.
Nucleic Acids Res. 28, 27-30 (2000).
145 Lowe, T. M. & Eddy, S. R. tRNAscan-SE: a program for improved detection of
transfer RNA genes in genomic sequence. Nucleic Acids Res. 25, 955-964 (1997).
146 Nawrocki, E. P., Kolbe, D. L. & Eddy, S. R. Infernal 1.0: inference of RNA
alignments. Bioinformatics 25, 1335-1337 (2009).
147 Griffiths-Jones, S. et al. Rfam: annotating non-coding RNAs in complete genomes.
Nucleic Acids Res. 33, D121-124 (2005).
148 Li, H. et al. TreeFam: a curated database of phylogenetic trees of animal gene
families. Nucleic Acids Res. 34, D572-580 (2006).
149 Huang da, W., Sherman, B. T. & Lempicki, R. A. Systematic and integrative
analysis of large gene lists using DAVID bioinformatics resources. Nat. Protoc. 4,
44-57 (2009).
150 Huang da, W. et al. DAVID Bioinformatics Resources: expanded annotation
database and novel algorithms to better extract biology from large gene lists.
Nucleic Acids Res. 35, W169-175 (2007).
151 Li, H. et al. The Sequence Alignment/Map format and SAMtools. Bioinformatics 25,
2078-2079 (2009).
152 Li, H. & Durbin, R. Inference of human population history from individual
whole-genome sequences. Nature 475, 493-496 (2011).
153 Barrett, J. C., Fry, B., Maller, J. & Daly, M. J. Haploview: analysis and visualization
of LD and haplotype maps. Bioinformatics 21, 263-265 (2005).
Nature Genetics: doi:10.1038/ng.2811