Embed Size (px)
Citation preview
Supplementary FinancialInformationFor the Quarter Ended – October 31, 2018
For further information, contact:
JILL HOMENUK CHRISTINE VIAUHead, Investor Relations Director, Investor Relations416.867.4770 [email protected] [email protected]
www.bmo.com/investorrelations
Q4 | 18
INDEX
Page Page
Notes to Users 1 Credit Risk Related Schedules 18-29Credit Risk Financial Measures 18
Financial Highlights 2-3 Provision for Credit Losses Segmented Information 19Income Statement Information 2 Write-Offs by Industry and Geographic Region 20Reported Profitability Measures 2 Gross Loans and Acceptances 21Adjusted Profitability Measures 2 Allowance for Credit Losses 22Growth Rates 2 Net Loans and Acceptances 23Balance Sheet Information 2 Gross Impaired Loans and Acceptances 24Capital Measures 2 Net Impaired Loans and Acceptances 25Dividend Information 3 Loans and Acceptances by Geographic Area 26Share Information 3 Changes in Impairment Allowance for Credit Losses 27Additional Bank Information 3 Changes in Impaired Loans and Acceptances 27Other Statistical Information 3 Changes in Impairment Allowance for Credit Losses by Product Type 28
Loans Past Due Not Impaired 29Residential Mortgages, HELOC and Residential Mortgages by Remaining Term of Amortization 29
Summary Income Statements and Highlights (includes U.S. Segment Information) 4-10 Derivative Instruments - Basel 30
Total Bank Consolidated 4Total Personal & Commercial Banking 5 Derivative Instruments - Fair Value 31Canadian P&C 6U.S. P&C 7 Derivative Instruments - Over-the-Counter (Notional Amounts) 32BMO Wealth Management 8BMO Capital Markets 9 Asset Encumbrance, Net Unencumbered Liquid Assets and Deposits 33Corporate Services, including Technology and Operations 10
Pillar 3 Disclosure Requirements Index 34-35
Non-Interest Revenue and Trading Revenue 11 Basel Regulatory Capital, Risk-Weighted Assets and Capital Ratios 36-42
Non-Interest Expense 12 Basel Credit Risk Schedules 43-48
Balance Sheets (As At and Average Daily Balances) 13-14 Basel Counterparty Credit Risk Schedules 49-53
Statement of Comprehensive Income 15 Basel Securitization and Re-Securitization Exposures 54-56
Statement of Changes in Equity 16 Backtesting Under AIRB Approach 57-58
Goodwill and Intangible Assets 17 Basel Glossary 59
Unrealized Gains (Losses) on Fair Value through Other Comprehensive Income Securities 17
Unrealized Gains (Losses) on Available-For-Sale Securities 17
Assets Under Administration and Management 17
This report is unaudited and all amounts are in millions of Canadian dollars, unless otherwise indicated.
October 31, 2018 Supplementary Financial Information
NOTES TO USERS
Use of this Document Taxable Equivalent BasisThe supplemental information contained in this package is designed to improve the readers' understanding of the financial BMO analyzes consolidated revenues on a reported basis. However, like many banks, BMO analyzes performance of BMO Financial Group (the Bank). This information should be used in conjunction with the Bank's Q4 2018 revenue of operating groups and ratios computed using revenue on a taxable equivalent basis (teb).Earnings Release and the 2018 Annual MD&A. Revenue and the provision for income taxes are increased on tax-exempt securities to an equivalent
before-tax basis to facilitate comparisons of income between taxable and tax-exempt sources. TheAdditional financial information is also available in the Q4 2018 Investor Presentation as well as the Conference Call effective income tax rate is also analyzed on a teb for consistency of approach. The offset to the groupWebcast which can be accessed at our website at www.bmo.com/investorrelations. teb adjustments, mostly in BMO Capital Markets, is reflected in Corporate Services.
This report is unaudited and all amounts are in millions of Canadian dollars, unless indicated otherwise. ChangesPeriodically, certain business lines and units within business lines are transferred between client and
Items indicated N.A. were not available. corporate support groups to more closely align BMO's organizational structure with its strategic priorities. Items indicated n.a. were not applicable. In addition, revenue, provision for credit losses and expense allocations, as well as balances, are updated
to better align with current experience. Results for prior periods are reclassified to conform to the presentation.Accounting FrameworkWe report our financial results under International Financial Reporting Standards (IFRS) as adopted by the International Effective the first quarter of 2018 the allocation of certain revenue items from Corporate Services to the Accounting Standards Board (IASB). We use the terms IFRS and Generally Accepted Accounting Principles (GAAP) Operating Groups was updated to align with the underlying business activity. Results for prior periods andinterchangeably. related ratios have been reclassified to conform with the current presentation.
Results and measures in both the Management's Discussion and Analysis (MD&A) and this document are presented on Also effective the first quarter of 2018, loan losses related to certain fraud costs have been reclassifiedan IFRS basis. They are also presented on an adjusted basis that excludes the impact of certain items. Management from provision for credit losses to other non-interest expenses in the Canadian P&C and U.S. P&Cassesses performance on both a GAAP basis and an adjusted basis and considers both bases to be useful in assessing businesses. Certain fees have been reclassified from deposit and payment service charges to card fees underlying, ongoing business performance. Some metrics such as revenue, revenue growth, operating leverage and within non-interest revenue in Canadian P&C. Cash collateral balances were also reclassified from loansefficiency ratio have been presented based on revenue net of insurance claims, commissions and changes in policy and deposits to other assets and other liabilities in BMO Capital Markets. Results for prior periods andbenefit liabilities (CCPB). Users may find this presentation to be more useful as it reduces the variability in results related ratios have been reclassified to conform with the current period's presentation.associated with insurance. Insurance revenue can experience variability arising from fluctuations in fair value of insuranceassets which are largely offset by the fair value changes of policy benefit liabilities reflected in CCPB. For additional The Bank adopted IFRS 9, Financial Instruments , which replaces the guidance in IAS 39, Financialdiscussion of CCPB, see the 2018 Annual MD&A. Adjusted results and measures are non-GAAP and are detailed in the Instruments: Recognition and Measurement , for the annual period beginning on November 1, 2017. IFRS 9 Non-GAAP Measures section in the MD&A of the Bank's Fourth Quarter 2018 Earnings Release and 2018 Annual MD&A. does not require restatement of comparative period financial statements. The Bank has made the decision For additional information about non-GAAP adjusted results and measures from prior periods included in this not to restate comparative period financial information and has recognized any measurement differences document, please refer to the applicable period's Report to Shareholders. between the previous carrying amount and the new carrying amount of financial instruments on
November 1, 2017, through an adjustment to opening retained earnings. On transition to IFRS 9, the Bank Securities regulators require that companies caution readers that earnings and other measures adjusted to a will prospectively record the provisions for credit losses on impaired (Stage 3) and performing (Stages 1basis other than GAAP do not have standardized meanings under GAAP and are unlikely to be comparable to and 2) loans and related allowance within the respective business segment in which the underlying financial similar measures used by other companies. asset is held for segment reporting purposes.
Adjusted Results For institutions using advanced approaches for credit risk or operational risk, there is a Capital Floor as Adjusted results exclude the following items: prescribed in OSFI’s CAR Guideline. OSFI revised its approach for calculating the Capital Floor effective
Q2 2018. Changes include a shift to the Basel II standardized approach, as well as a reduction of the floor factor to 70% in Q2 2018, 72.5% in Q3 2018 and 75% in Q4 2018 onward.
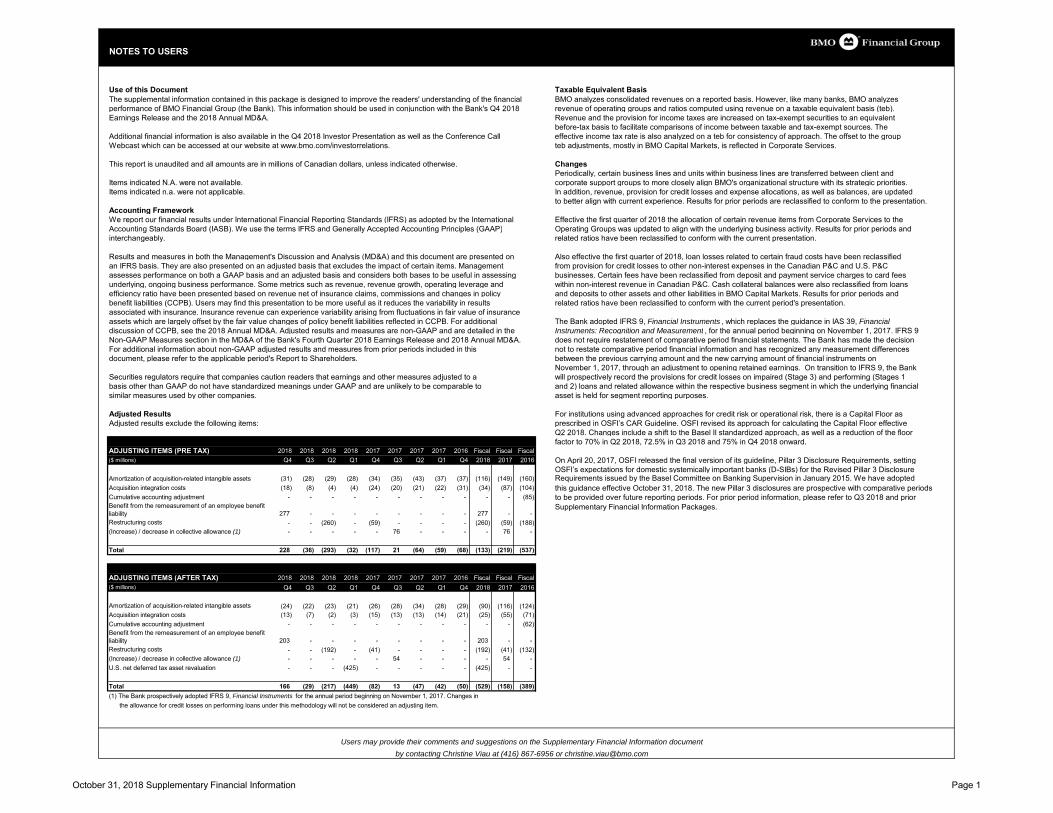
ADJUSTING ITEMS (PRE TAX) 2018 2018 2018 2018 2017 2017 2017 2017 2016 Fiscal Fiscal Fiscal($ millions) Q4 Q3 Q2 Q1 Q4 Q3 Q2 Q1 Q4 2018 2017 2016 On April 20, 2017, OSFI released the final version of its guideline, Pillar 3 Disclosure Requirements, setting
OSFI’s expectations for domestic systemically important banks (D-SIBs) for the Revised Pillar 3 Disclosure Amortization of acquisition-related intangible assets (31) (28) (29) (28) (34) (35) (43) (37) (37) (116) (149) (160) Requirements issued by the Basel Committee on Banking Supervision in January 2015. We have adopted Acquisition integration costs (18) (8) (4) (4) (24) (20) (21) (22) (31) (34) (87) (104) this guidance effective October 31, 2018. The new Pillar 3 disclosures are prospective with comparative periodsCumulative accounting adjustment - - - - - - - - - - - (85) to be provided over future reporting periods. For prior period information, please refer to Q3 2018 and priorBenefit from the remeasurement of an employee benefit liability 277 - - - - - - - - 277 - -
Supplementary Financial Information Packages.
Restructuring costs - - (260) - (59) - - - - (260) (59) (188)(Increase) / decrease in collective allowance (1) - - - - - 76 - - - - 76 -
Total 228 (36) (293) (32) (117) 21 (64) (59) (68) (133) (219) (537)
ADJUSTING ITEMS (AFTER TAX) 2018 2018 2018 2018 2017 2017 2017 2017 2016 Fiscal Fiscal Fiscal($ millions) Q4 Q3 Q2 Q1 Q4 Q3 Q2 Q1 Q4 2018 2017 2016
Amortization of acquisition-related intangible assets (24) (22) (23) (21) (26) (28) (34) (28) (29) (90) (116) (124)Acquisition integration costs (13) (7) (2) (3) (15) (13) (13) (14) (21) (25) (55) (71)Cumulative accounting adjustment - - - - - - - - - - - (62)Benefit from the remeasurement of an employee benefit liability 203 - - - - - - - - 203 - -Restructuring costs - - (192) - (41) - - - - (192) (41) (132)(Increase) / decrease in collective allowance (1) - - - - - 54 - - - - 54 -U.S. net deferred tax asset revaluation - - - (425) - - - - - (425) - -
Total 166 (29) (217) (449) (82) 13 (47) (42) (50) (529) (158) (389)(1) The Bank prospectively adopted IFRS 9, Financial Instruments for the annual period beginning on November 1, 2017. Changes in
the allowance for credit losses on performing loans under this methodology will not be considered an adjusting item.
Users may provide their comments and suggestions on the Supplementary Financial Information document by contacting Christine Viau at (416) 867-6956 or [email protected]
October 31, 2018 Supplementary Financial Information Page 1
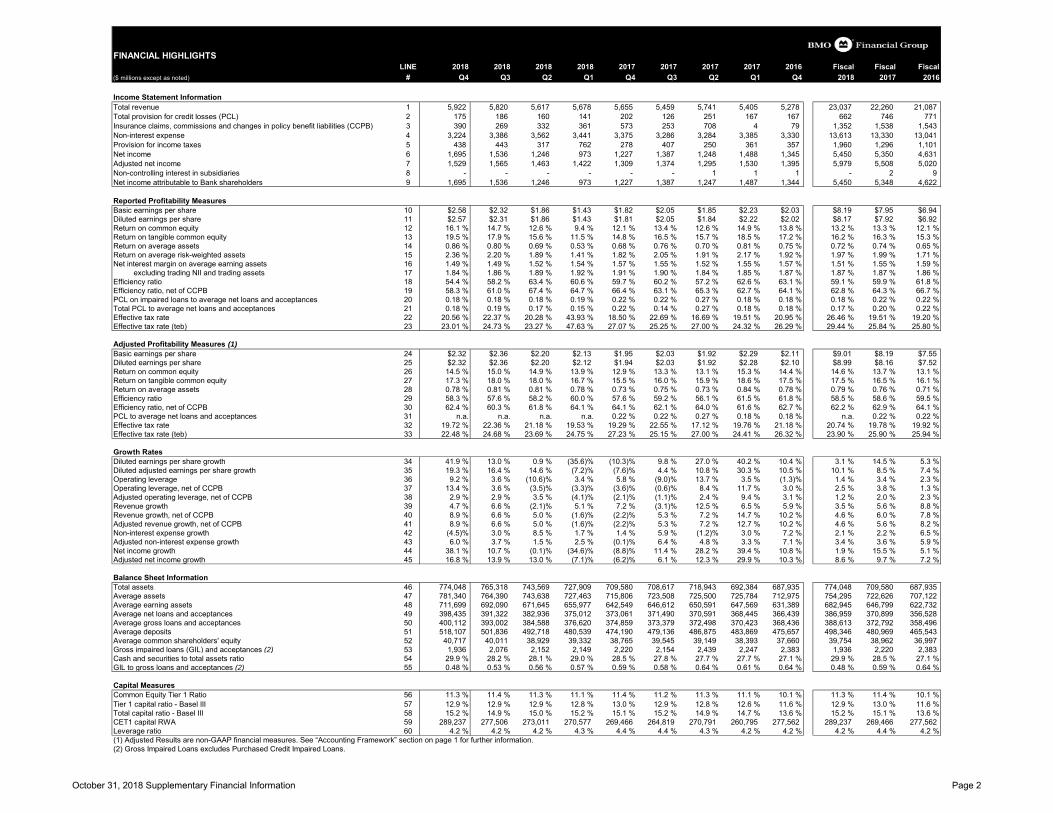
FINANCIAL HIGHLIGHTS LINE 2018 2018 2018 2018 2017 2017 2017 2017 2016 Fiscal Fiscal Fiscal($ millions except as noted) # Q4 Q3 Q2 Q1 Q4 Q3 Q2 Q1 Q4 2018 2017 2016
Income Statement Information Total revenue 1 5,922 5,820 5,617 5,678 5,655 5,459 5,741 5,405 5,278 23,037 22,260 21,087 Total provision for credit losses (PCL) 2 175 186 160 141 202 126 251 167 167 662 746 771 Insurance claims, commissions and changes in policy benefit liabilities (CCPB) 3 390 269 332 361 573 253 708 4 79 1,352 1,538 1,543 Non-interest expense 4 3,224 3,386 3,562 3,441 3,375 3,286 3,284 3,385 3,330 13,613 13,330 13,041 Provision for income taxes 5 438 443 317 762 278 407 250 361 357 1,960 1,296 1,101 Net income 6 1,695 1,536 1,246 973 1,227 1,387 1,248 1,488 1,345 5,450 5,350 4,631 Adjusted net income 7 1,529 1,565 1,463 1,422 1,309 1,374 1,295 1,530 1,395 5,979 5,508 5,020 Non-controlling interest in subsidiaries 8 - - - - - - 1 1 1 - 2 9 Net income attributable to Bank shareholders 9 1,695 1,536 1,246 973 1,227 1,387 1,247 1,487 1,344 5,450 5,348 4,622
Reported Profitability MeasuresBasic earnings per share 10 $2.58 $2.32 $1.86 $1.43 $1.82 $2.05 $1.85 $2.23 $2.03 $8.19 $7.95 $6.94Diluted earnings per share 11 $2.57 $2.31 $1.86 $1.43 $1.81 $2.05 $1.84 $2.22 $2.02 $8.17 $7.92 $6.92Return on common equity 12 16.1 % 14.7 % 12.6 % 9.4 % 12.1 % 13.4 % 12.6 % 14.9 % 13.8 % 13.2 % 13.3 % 12.1 %Return on tangible common equity 13 19.5 % 17.9 % 15.6 % 11.5 % 14.8 % 16.5 % 15.7 % 18.5 % 17.2 % 16.2 % 16.3 % 15.3 %Return on average assets 14 0.86 % 0.80 % 0.69 % 0.53 % 0.68 % 0.76 % 0.70 % 0.81 % 0.75 % 0.72 % 0.74 % 0.65 %Return on average risk-weighted assets 15 2.36 % 2.20 % 1.89 % 1.41 % 1.82 % 2.05 % 1.91 % 2.17 % 1.92 % 1.97 % 1.99 % 1.71 %Net interest margin on average earning assets 16 1.49 % 1.49 % 1.52 % 1.54 % 1.57 % 1.55 % 1.52 % 1.55 % 1.57 % 1.51 % 1.55 % 1.59 %
excluding trading NII and trading assets 17 1.84 % 1.86 % 1.89 % 1.92 % 1.91 % 1.90 % 1.84 % 1.85 % 1.87 % 1.87 % 1.87 % 1.86 %Efficiency ratio 18 54.4 % 58.2 % 63.4 % 60.6 % 59.7 % 60.2 % 57.2 % 62.6 % 63.1 % 59.1 % 59.9 % 61.8 %Efficiency ratio, net of CCPB 19 58.3 % 61.0 % 67.4 % 64.7 % 66.4 % 63.1 % 65.3 % 62.7 % 64.1 % 62.8 % 64.3 % 66.7 %PCL on impaired loans to average net loans and acceptances 20 0.18 % 0.18 % 0.18 % 0.19 % 0.22 % 0.22 % 0.27 % 0.18 % 0.18 % 0.18 % 0.22 % 0.22 %Total PCL to average net loans and acceptances 21 0.18 % 0.19 % 0.17 % 0.15 % 0.22 % 0.14 % 0.27 % 0.18 % 0.18 % 0.17 % 0.20 % 0.22 %Effective tax rate 22 20.56 % 22.37 % 20.28 % 43.93 % 18.50 % 22.69 % 16.69 % 19.51 % 20.95 % 26.46 % 19.51 % 19.20 %Effective tax rate (teb) 23 23.01 % 24.73 % 23.27 % 47.63 % 27.07 % 25.25 % 27.00 % 24.32 % 26.29 % 29.44 % 25.84 % 25.80 %
Adjusted Profitability Measures (1)Basic earnings per share 24 $2.32 $2.36 $2.20 $2.13 $1.95 $2.03 $1.92 $2.29 $2.11 $9.01 $8.19 $7.55Diluted earnings per share 25 $2.32 $2.36 $2.20 $2.12 $1.94 $2.03 $1.92 $2.28 $2.10 $8.99 $8.16 $7.52Return on common equity 26 14.5 % 15.0 % 14.9 % 13.9 % 12.9 % 13.3 % 13.1 % 15.3 % 14.4 % 14.6 % 13.7 % 13.1 %Return on tangible common equity 27 17.3 % 18.0 % 18.0 % 16.7 % 15.5 % 16.0 % 15.9 % 18.6 % 17.5 % 17.5 % 16.5 % 16.1 %Return on average assets 28 0.78 % 0.81 % 0.81 % 0.78 % 0.73 % 0.75 % 0.73 % 0.84 % 0.78 % 0.79 % 0.76 % 0.71 %Efficiency ratio 29 58.3 % 57.6 % 58.2 % 60.0 % 57.6 % 59.2 % 56.1 % 61.5 % 61.8 % 58.5 % 58.6 % 59.5 %Efficiency ratio, net of CCPB 30 62.4 % 60.3 % 61.8 % 64.1 % 64.1 % 62.1 % 64.0 % 61.6 % 62.7 % 62.2 % 62.9 % 64.1 %PCL to average net loans and acceptances 31 n.a. n.a. n.a. n.a. 0.22 % 0.22 % 0.27 % 0.18 % 0.18 % n.a. 0.22 % 0.22 %Effective tax rate 32 19.72 % 22.36 % 21.18 % 19.53 % 19.29 % 22.55 % 17.12 % 19.76 % 21.18 % 20.74 % 19.78 % 19.92 %Effective tax rate (teb) 33 22.48 % 24.68 % 23.69 % 24.75 % 27.23 % 25.15 % 27.00 % 24.41 % 26.32 % 23.90 % 25.90 % 25.94 %
Growth RatesDiluted earnings per share growth 34 41.9 % 13.0 % 0.9 % (35.6)% (10.3)% 9.8 % 27.0 % 40.2 % 10.4 % 3.1 % 14.5 % 5.3 %Diluted adjusted earnings per share growth 35 19.3 % 16.4 % 14.6 % (7.2)% (7.6)% 4.4 % 10.8 % 30.3 % 10.5 % 10.1 % 8.5 % 7.4 %Operating leverage 36 9.2 % 3.6 % (10.6)% 3.4 % 5.8 % (9.0)% 13.7 % 3.5 % (1.3)% 1.4 % 3.4 % 2.3 %Operating leverage, net of CCPB 37 13.4 % 3.6 % (3.5)% (3.3)% (3.6)% (0.6)% 8.4 % 11.7 % 3.0 % 2.5 % 3.8 % 1.3 %Adjusted operating leverage, net of CCPB 38 2.9 % 2.9 % 3.5 % (4.1)% (2.1)% (1.1)% 2.4 % 9.4 % 3.1 % 1.2 % 2.0 % 2.3 %Revenue growth 39 4.7 % 6.6 % (2.1)% 5.1 % 7.2 % (3.1)% 12.5 % 6.5 % 5.9 % 3.5 % 5.6 % 8.8 %Revenue growth, net of CCPB 40 8.9 % 6.6 % 5.0 % (1.6)% (2.2)% 5.3 % 7.2 % 14.7 % 10.2 % 4.6 % 6.0 % 7.8 %Adjusted revenue growth, net of CCPB 41 8.9 % 6.6 % 5.0 % (1.6)% (2.2)% 5.3 % 7.2 % 12.7 % 10.2 % 4.6 % 5.6 % 8.2 %Non-interest expense growth 42 (4.5)% 3.0 % 8.5 % 1.7 % 1.4 % 5.9 % (1.2)% 3.0 % 7.2 % 2.1 % 2.2 % 6.5 %Adjusted non-interest expense growth 43 6.0 % 3.7 % 1.5 % 2.5 % (0.1)% 6.4 % 4.8 % 3.3 % 7.1 % 3.4 % 3.6 % 5.9 %Net income growth 44 38.1 % 10.7 % (0.1)% (34.6)% (8.8)% 11.4 % 28.2 % 39.4 % 10.8 % 1.9 % 15.5 % 5.1 %Adjusted net income growth 45 16.8 % 13.9 % 13.0 % (7.1)% (6.2)% 6.1 % 12.3 % 29.9 % 10.3 % 8.6 % 9.7 % 7.2 %
Balance Sheet InformationTotal assets 46 774,048 765,318 743,569 727,909 709,580 708,617 718,943 692,384 687,935 774,048 709,580 687,935 Average assets 47 781,340 764,390 743,638 727,463 715,806 723,508 725,500 725,784 712,975 754,295 722,626 707,122 Average earning assets 48 711,699 692,090 671,645 655,977 642,549 646,612 650,591 647,569 631,389 682,945 646,799 622,732 Average net loans and acceptances 49 398,435 391,322 382,936 375,012 373,061 371,490 370,591 368,445 366,439 386,959 370,899 356,528 Average gross loans and acceptances 50 400,112 393,002 384,588 376,620 374,859 373,379 372,498 370,423 368,436 388,613 372,792 358,496 Average deposits 51 518,107 501,836 492,718 480,539 474,190 479,136 486,875 483,869 475,657 498,346 480,969 465,543 Average common shareholders' equity 52 40,717 40,011 38,929 39,332 38,765 39,545 39,149 38,393 37,660 39,754 38,962 36,997 Gross impaired loans (GIL) and acceptances (2) 53 1,936 2,076 2,152 2,149 2,220 2,154 2,439 2,247 2,383 1,936 2,220 2,383 Cash and securities to total assets ratio 54 29.9 % 28.2 % 28.1 % 29.0 % 28.5 % 27.8 % 27.7 % 27.7 % 27.1 % 29.9 % 28.5 % 27.1 %GIL to gross loans and acceptances (2) 55 0.48 % 0.53 % 0.56 % 0.57 % 0.59 % 0.58 % 0.64 % 0.61 % 0.64 % 0.48 % 0.59 % 0.64 %
Capital MeasuresCommon Equity Tier 1 Ratio 56 11.3 % 11.4 % 11.3 % 11.1 % 11.4 % 11.2 % 11.3 % 11.1 % 10.1 % 11.3 % 11.4 % 10.1 %Tier 1 capital ratio - Basel III 57 12.9 % 12.9 % 12.9 % 12.8 % 13.0 % 12.9 % 12.8 % 12.6 % 11.6 % 12.9 % 13.0 % 11.6 %Total capital ratio - Basel III 58 15.2 % 14.9 % 15.0 % 15.2 % 15.1 % 15.2 % 14.9 % 14.7 % 13.6 % 15.2 % 15.1 % 13.6 %CET1 capital RWA 59 289,237 277,506 273,011 270,577 269,466 264,819 270,791 260,795 277,562 289,237 269,466 277,562 Leverage ratio 60 4.2 % 4.2 % 4.2 % 4.3 % 4.4 % 4.4 % 4.3 % 4.2 % 4.2 % 4.2 % 4.4 % 4.2 %(1) Adjusted Results are non-GAAP financial measures. See “Accounting Framework” section on page 1 for further information.(2) Gross Impaired Loans excludes Purchased Credit Impaired Loans.
October 31, 2018 Supplementary Financial Information Page 2
FINANCIAL HIGHLIGHTS CONTINUED LINE 2018 2018 2018 2018 2017 2017 2017 2017 2016 Fiscal Fiscal Fiscal($ millions except as noted) # Q4 Q3 Q2 Q1 Q4 Q3 Q2 Q1 Q4 2018 2017 2016
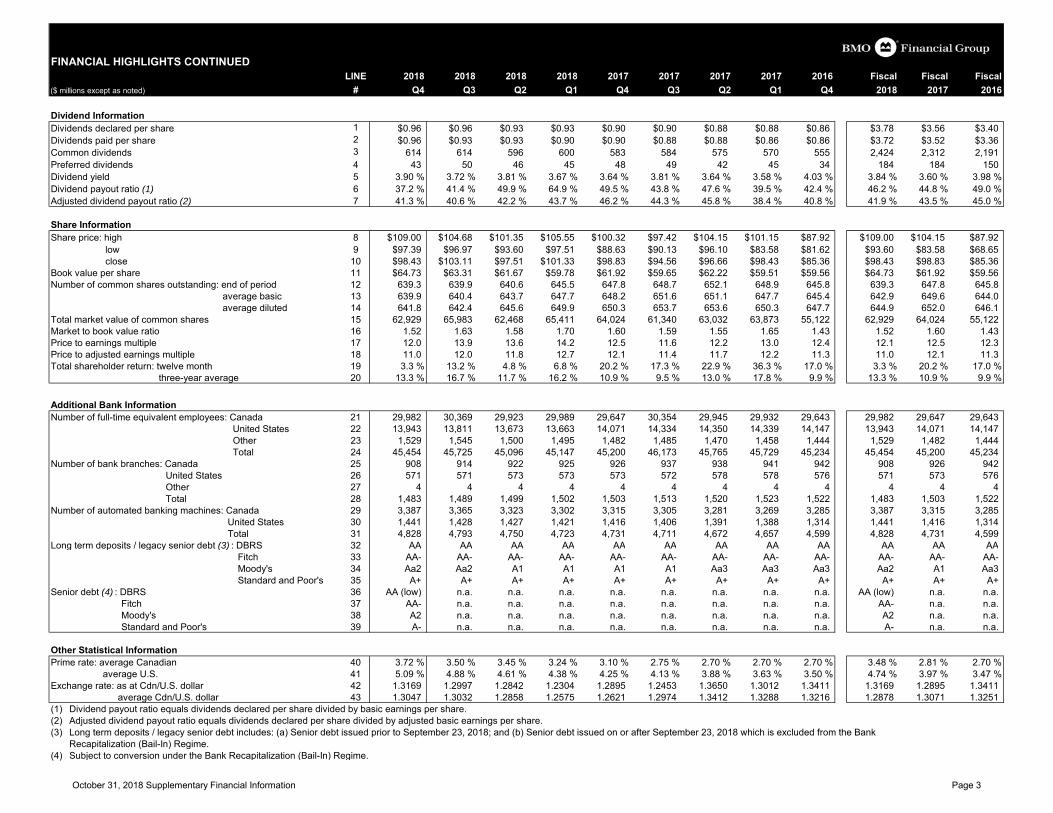
Dividend InformationDividends declared per share 1 $0.96 $0.96 $0.93 $0.93 $0.90 $0.90 $0.88 $0.88 $0.86 $3.78 $3.56 $3.40Dividends paid per share 2 $0.96 $0.93 $0.93 $0.90 $0.90 $0.88 $0.88 $0.86 $0.86 $3.72 $3.52 $3.36Common dividends 3 614 614 596 600 583 584 575 570 555 2,424 2,312 2,191 Preferred dividends 4 43 50 46 45 48 49 42 45 34 184 184 150 Dividend yield 5 3.90 % 3.72 % 3.81 % 3.67 % 3.64 % 3.81 % 3.64 % 3.58 % 4.03 % 3.84 % 3.60 % 3.98 %Dividend payout ratio (1) 6 37.2 % 41.4 % 49.9 % 64.9 % 49.5 % 43.8 % 47.6 % 39.5 % 42.4 % 46.2 % 44.8 % 49.0 %Adjusted dividend payout ratio (2) 7 41.3 % 40.6 % 42.2 % 43.7 % 46.2 % 44.3 % 45.8 % 38.4 % 40.8 % 41.9 % 43.5 % 45.0 %
Share InformationShare price: high 8 $109.00 $104.68 $101.35 $105.55 $100.32 $97.42 $104.15 $101.15 $87.92 $109.00 $104.15 $87.92
low 9 $97.39 $96.97 $93.60 $97.51 $88.63 $90.13 $96.10 $83.58 $81.62 $93.60 $83.58 $68.65 close 10 $98.43 $103.11 $97.51 $101.33 $98.83 $94.56 $96.66 $98.43 $85.36 $98.43 $98.83 $85.36
Book value per share 11 $64.73 $63.31 $61.67 $59.78 $61.92 $59.65 $62.22 $59.51 $59.56 $64.73 $61.92 $59.56Number of common shares outstanding: end of period 12 639.3 639.9 640.6 645.5 647.8 648.7 652.1 648.9 645.8 639.3 647.8 645.8
average basic 13 639.9 640.4 643.7 647.7 648.2 651.6 651.1 647.7 645.4 642.9 649.6 644.0 average diluted 14 641.8 642.4 645.6 649.9 650.3 653.7 653.6 650.3 647.7 644.9 652.0 646.1
Total market value of common shares 15 62,929 65,983 62,468 65,411 64,024 61,340 63,032 63,873 55,122 62,929 64,024 55,122 Market to book value ratio 16 1.52 1.63 1.58 1.70 1.60 1.59 1.55 1.65 1.43 1.52 1.60 1.43 Price to earnings multiple 17 12.0 13.9 13.6 14.2 12.5 11.6 12.2 13.0 12.4 12.1 12.5 12.3 Price to adjusted earnings multiple 18 11.0 12.0 11.8 12.7 12.1 11.4 11.7 12.2 11.3 11.0 12.1 11.3 Total shareholder return: twelve month 19 3.3 % 13.2 % 4.8 % 6.8 % 20.2 % 17.3 % 22.9 % 36.3 % 17.0 % 3.3 % 20.2 % 17.0 %
three-year average 20 13.3 % 16.7 % 11.7 % 16.2 % 10.9 % 9.5 % 13.0 % 17.8 % 9.9 % 13.3 % 10.9 % 9.9 %
Additional Bank InformationNumber of full-time equivalent employees: Canada 21 29,982 30,369 29,923 29,989 29,647 30,354 29,945 29,932 29,643 29,982 29,647 29,643
United States 22 13,943 13,811 13,673 13,663 14,071 14,334 14,350 14,339 14,147 13,943 14,071 14,147 Other 23 1,529 1,545 1,500 1,495 1,482 1,485 1,470 1,458 1,444 1,529 1,482 1,444 Total 24 45,454 45,725 45,096 45,147 45,200 46,173 45,765 45,729 45,234 45,454 45,200 45,234
Number of bank branches: Canada 25 908 914 922 925 926 937 938 941 942 908 926 942 United States 26 571 571 573 573 573 572 578 578 576 571 573 576 Other 27 4 4 4 4 4 4 4 4 4 4 4 4 Total 28 1,483 1,489 1,499 1,502 1,503 1,513 1,520 1,523 1,522 1,483 1,503 1,522
Number of automated banking machines: Canada 29 3,387 3,365 3,323 3,302 3,315 3,305 3,281 3,269 3,285 3,387 3,315 3,285 United States 30 1,441 1,428 1,427 1,421 1,416 1,406 1,391 1,388 1,314 1,441 1,416 1,314 Total 31 4,828 4,793 4,750 4,723 4,731 4,711 4,672 4,657 4,599 4,828 4,731 4,599
Long term deposits / legacy senior debt (3) : DBRS 32 AA AA AA AA AA AA AA AA AA AA AA AA Fitch 33 AA- AA- AA- AA- AA- AA- AA- AA- AA- AA- AA- AA- Moody's 34 Aa2 Aa2 A1 A1 A1 A1 Aa3 Aa3 Aa3 Aa2 A1 Aa3 Standard and Poor's 35 A+ A+ A+ A+ A+ A+ A+ A+ A+ A+ A+ A+
Senior debt (4) : DBRS 36 AA (low) n.a. n.a. n.a. n.a. n.a. n.a. n.a. n.a. AA (low) n.a. n.a. Fitch 37 AA- n.a. n.a. n.a. n.a. n.a. n.a. n.a. n.a. AA- n.a. n.a. Moody's 38 A2 n.a. n.a. n.a. n.a. n.a. n.a. n.a. n.a. A2 n.a. n.a. Standard and Poor's 39 A- n.a. n.a. n.a. n.a. n.a. n.a. n.a. n.a. A- n.a. n.a.
Other Statistical InformationPrime rate: average Canadian 40 3.72 % 3.50 % 3.45 % 3.24 % 3.10 % 2.75 % 2.70 % 2.70 % 2.70 % 3.48 % 2.81 % 2.70 %
average U.S. 41 5.09 % 4.88 % 4.61 % 4.38 % 4.25 % 4.13 % 3.88 % 3.63 % 3.50 % 4.74 % 3.97 % 3.47 %Exchange rate: as at Cdn/U.S. dollar 42 1.3169 1.2997 1.2842 1.2304 1.2895 1.2453 1.3650 1.3012 1.3411 1.3169 1.2895 1.3411
average Cdn/U.S. dollar 43 1.3047 1.3032 1.2858 1.2575 1.2621 1.2974 1.3412 1.3288 1.3216 1.2878 1.3071 1.3251 (1) Dividend payout ratio equals dividends declared per share divided by basic earnings per share.(2) Adjusted dividend payout ratio equals dividends declared per share divided by adjusted basic earnings per share.(3) Long term deposits / legacy senior debt includes: (a) Senior debt issued prior to September 23, 2018; and (b) Senior debt issued on or after September 23, 2018 which is excluded from the Bank
Recapitalization (Bail-In) Regime.(4) Subject to conversion under the Bank Recapitalization (Bail-In) Regime.
October 31, 2018 Supplementary Financial Information Page 3
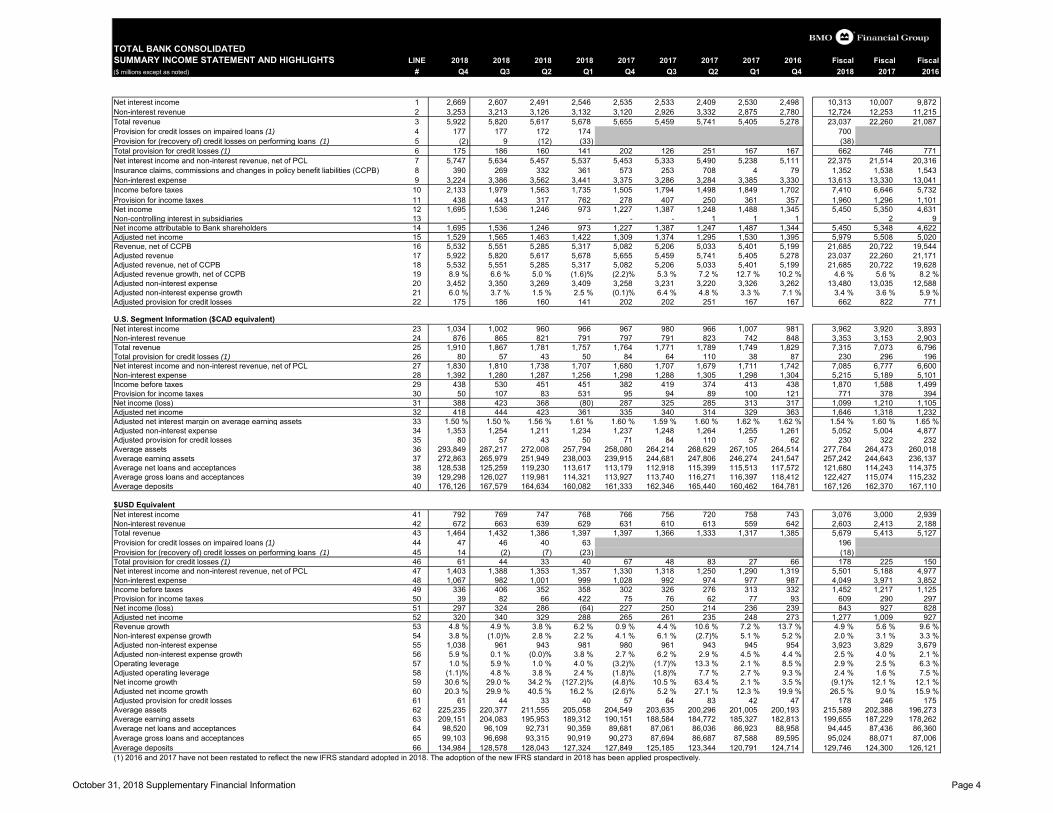
TOTAL BANK CONSOLIDATEDSUMMARY INCOME STATEMENT AND HIGHLIGHTS LINE 2018 2018 2018 2018 2017 2017 2017 2017 2016 Fiscal Fiscal Fiscal($ millions except as noted) # Q4 Q3 Q2 Q1 Q4 Q3 Q2 Q1 Q4 2018 2017 2016
Net interest income 1 2,669 2,607 2,491 2,546 2,535 2,533 2,409 2,530 2,498 10,313 10,007 9,872 Non-interest revenue 2 3,253 3,213 3,126 3,132 3,120 2,926 3,332 2,875 2,780 12,724 12,253 11,215 Total revenue 3 5,922 5,820 5,617 5,678 5,655 5,459 5,741 5,405 5,278 23,037 22,260 21,087 Provision for credit losses on impaired loans (1) 4 177 177 172 174 700 Provision for (recovery of) credit losses on performing loans (1) 5 (2) 9 (12) (33) (38) Total provision for credit losses (1) 6 175 186 160 141 202 126 251 167 167 662 746 771 Net interest income and non-interest revenue, net of PCL 7 5,747 5,634 5,457 5,537 5,453 5,333 5,490 5,238 5,111 22,375 21,514 20,316 Insurance claims, commissions and changes in policy benefit liabilities (CCPB) 8 390 269 332 361 573 253 708 4 79 1,352 1,538 1,543 Non-interest expense 9 3,224 3,386 3,562 3,441 3,375 3,286 3,284 3,385 3,330 13,613 13,330 13,041 Income before taxes 10 2,133 1,979 1,563 1,735 1,505 1,794 1,498 1,849 1,702 7,410 6,646 5,732 Provision for income taxes 11 438 443 317 762 278 407 250 361 357 1,960 1,296 1,101 Net income 12 1,695 1,536 1,246 973 1,227 1,387 1,248 1,488 1,345 5,450 5,350 4,631 Non-controlling interest in subsidiaries 13 - - - - - - 1 1 1 - 2 9 Net income attributable to Bank shareholders 14 1,695 1,536 1,246 973 1,227 1,387 1,247 1,487 1,344 5,450 5,348 4,622 Adjusted net income 15 1,529 1,565 1,463 1,422 1,309 1,374 1,295 1,530 1,395 5,979 5,508 5,020 Revenue, net of CCPB 16 5,532 5,551 5,285 5,317 5,082 5,206 5,033 5,401 5,199 21,685 20,722 19,544 Adjusted revenue 17 5,922 5,820 5,617 5,678 5,655 5,459 5,741 5,405 5,278 23,037 22,260 21,171 Adjusted revenue, net of CCPB 18 5,532 5,551 5,285 5,317 5,082 5,206 5,033 5,401 5,199 21,685 20,722 19,628 Adjusted revenue growth, net of CCPB 19 8.9 % 6.6 % 5.0 % (1.6)% (2.2)% 5.3 % 7.2 % 12.7 % 10.2 % 4.6 % 5.6 % 8.2 %Adjusted non-interest expense 20 3,452 3,350 3,269 3,409 3,258 3,231 3,220 3,326 3,262 13,480 13,035 12,588 Adjusted non-interest expense growth 21 6.0 % 3.7 % 1.5 % 2.5 % (0.1)% 6.4 % 4.8 % 3.3 % 7.1 % 3.4 % 3.6 % 5.9 %Adjusted provision for credit losses 22 175 186 160 141 202 202 251 167 167 662 822 771
U.S. Segment Information ($CAD equivalent)Net interest income 23 1,034 1,002 960 966 967 980 966 1,007 981 3,962 3,920 3,893 Non-interest revenue 24 876 865 821 791 797 791 823 742 848 3,353 3,153 2,903 Total revenue 25 1,910 1,867 1,781 1,757 1,764 1,771 1,789 1,749 1,829 7,315 7,073 6,796 Total provision for credit losses (1) 26 80 57 43 50 84 64 110 38 87 230 296 196 Net interest income and non-interest revenue, net of PCL 27 1,830 1,810 1,738 1,707 1,680 1,707 1,679 1,711 1,742 7,085 6,777 6,600 Non-interest expense 28 1,392 1,280 1,287 1,256 1,298 1,288 1,305 1,298 1,304 5,215 5,189 5,101 Income before taxes 29 438 530 451 451 382 419 374 413 438 1,870 1,588 1,499 Provision for income taxes 30 50 107 83 531 95 94 89 100 121 771 378 394 Net income (loss) 31 388 423 368 (80) 287 325 285 313 317 1,099 1,210 1,105 Adjusted net income 32 418 444 423 361 335 340 314 329 363 1,646 1,318 1,232 Adjusted net interest margin on average earning assets 33 1.50 % 1.50 % 1.56 % 1.61 % 1.60 % 1.59 % 1.60 % 1.62 % 1.62 % 1.54 % 1.60 % 1.65 %Adjusted non-interest expense 34 1,353 1,254 1,211 1,234 1,237 1,248 1,264 1,255 1,261 5,052 5,004 4,877 Adjusted provision for credit losses 35 80 57 43 50 71 84 110 57 62 230 322 232 Average assets 36 293,849 287,217 272,008 257,794 258,080 264,214 268,629 267,105 264,514 277,764 264,473 260,018 Average earning assets 37 272,863 265,979 251,949 238,003 239,915 244,681 247,806 246,274 241,547 257,242 244,643 236,137 Average net loans and acceptances 38 128,538 125,259 119,230 113,617 113,179 112,918 115,399 115,513 117,572 121,680 114,243 114,375 Average gross loans and acceptances 39 129,298 126,027 119,981 114,321 113,927 113,740 116,271 116,397 118,412 122,427 115,074 115,232 Average deposits 40 176,126 167,579 164,634 160,082 161,333 162,346 165,440 160,462 164,781 167,126 162,370 167,110
$USD EquivalentNet interest income 41 792 769 747 768 766 756 720 758 743 3,076 3,000 2,939 Non-interest revenue 42 672 663 639 629 631 610 613 559 642 2,603 2,413 2,188 Total revenue 43 1,464 1,432 1,386 1,397 1,397 1,366 1,333 1,317 1,385 5,679 5,413 5,127 Provision for credit losses on impaired loans (1) 44 47 46 40 63 196 Provision for (recovery of) credit losses on performing loans (1) 45 14 (2) (7) (23) (18) Total provision for credit losses (1) 46 61 44 33 40 67 48 83 27 66 178 225 150 Net interest income and non-interest revenue, net of PCL 47 1,403 1,388 1,353 1,357 1,330 1,318 1,250 1,290 1,319 5,501 5,188 4,977 Non-interest expense 48 1,067 982 1,001 999 1,028 992 974 977 987 4,049 3,971 3,852 Income before taxes 49 336 406 352 358 302 326 276 313 332 1,452 1,217 1,125 Provision for income taxes 50 39 82 66 422 75 76 62 77 93 609 290 297 Net income (loss) 51 297 324 286 (64) 227 250 214 236 239 843 927 828 Adjusted net income 52 320 340 329 288 265 261 235 248 273 1,277 1,009 927 Revenue growth 53 4.8 % 4.9 % 3.8 % 6.2 % 0.9 % 4.4 % 10.6 % 7.2 % 13.7 % 4.9 % 5.6 % 9.6 %Non-interest expense growth 54 3.8 % (1.0)% 2.8 % 2.2 % 4.1 % 6.1 % (2.7)% 5.1 % 5.2 % 2.0 % 3.1 % 3.3 %Adjusted non-interest expense 55 1,038 961 943 981 980 961 943 945 954 3,923 3,829 3,679 Adjusted non-interest expense growth 56 5.9 % 0.1 % (0.0)% 3.8 % 2.7 % 6.2 % 2.9 % 4.5 % 4.4 % 2.5 % 4.0 % 2.1 %Operating leverage 57 1.0 % 5.9 % 1.0 % 4.0 % (3.2)% (1.7)% 13.3 % 2.1 % 8.5 % 2.9 % 2.5 % 6.3 %Adjusted operating leverage 58 (1.1)% 4.8 % 3.8 % 2.4 % (1.8)% (1.8)% 7.7 % 2.7 % 9.3 % 2.4 % 1.6 % 7.5 %Net income growth 59 30.6 % 29.0 % 34.2 % (127.2)% (4.8)% 10.5 % 63.4 % 2.1 % 3.5 % (9.1)% 12.1 % 12.1 %Adjusted net income growth 60 20.3 % 29.9 % 40.5 % 16.2 % (2.6)% 5.2 % 27.1 % 12.3 % 19.9 % 26.5 % 9.0 % 15.9 %Adjusted provision for credit losses 61 61 44 33 40 57 64 83 42 47 178 246 175 Average assets 62 225,235 220,377 211,555 205,058 204,549 203,635 200,296 201,005 200,193 215,589 202,388 196,273 Average earning assets 63 209,151 204,083 195,953 189,312 190,151 188,584 184,772 185,327 182,813 199,655 187,229 178,262 Average net loans and acceptances 64 98,520 96,109 92,731 90,359 89,681 87,061 86,036 86,923 88,958 94,445 87,436 86,360 Average gross loans and acceptances 65 99,103 96,698 93,315 90,919 90,273 87,694 86,687 87,588 89,595 95,024 88,071 87,006 Average deposits 66 134,984 128,578 128,043 127,324 127,849 125,185 123,344 120,791 124,714 129,746 124,300 126,121 (1) 2016 and 2017 have not been restated to reflect the new IFRS standard adopted in 2018. The adoption of the new IFRS standard in 2018 has been applied prospectively.
October 31, 2018 Supplementary Financial Information Page 4
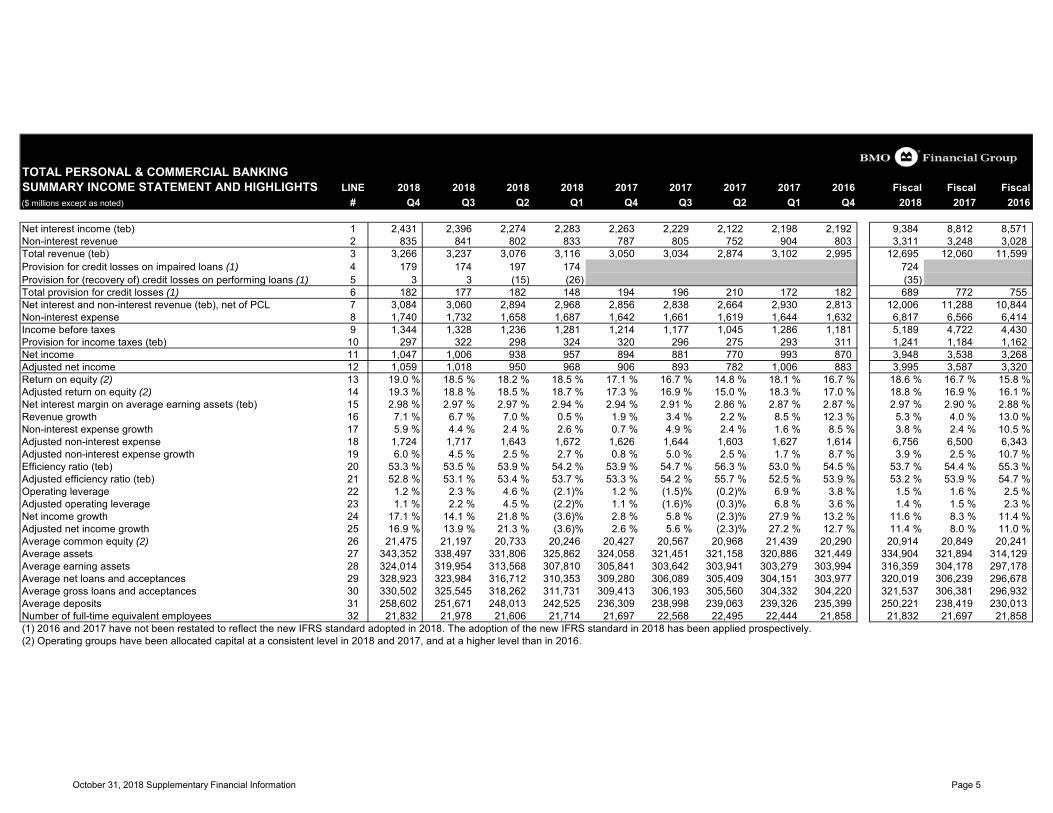
TOTAL PERSONAL & COMMERCIAL BANKINGSUMMARY INCOME STATEMENT AND HIGHLIGHTS LINE 2018 2018 2018 2018 2017 2017 2017 2017 2016 Fiscal Fiscal Fiscal($ millions except as noted) # Q4 Q3 Q2 Q1 Q4 Q3 Q2 Q1 Q4 2018 2017 2016
Net interest income (teb) 1 2,431 2,396 2,274 2,283 2,263 2,229 2,122 2,198 2,192 9,384 8,812 8,571 Non-interest revenue 2 835 841 802 833 787 805 752 904 803 3,311 3,248 3,028 Total revenue (teb) 3 3,266 3,237 3,076 3,116 3,050 3,034 2,874 3,102 2,995 12,695 12,060 11,599 Provision for credit losses on impaired loans (1) 4 179 174 197 174 724 Provision for (recovery of) credit losses on performing loans (1) 5 3 3 (15) (26) (35) Total provision for credit losses (1) 6 182 177 182 148 194 196 210 172 182 689 772 755 Net interest and non-interest revenue (teb), net of PCL 7 3,084 3,060 2,894 2,968 2,856 2,838 2,664 2,930 2,813 12,006 11,288 10,844 Non-interest expense 8 1,740 1,732 1,658 1,687 1,642 1,661 1,619 1,644 1,632 6,817 6,566 6,414 Income before taxes 9 1,344 1,328 1,236 1,281 1,214 1,177 1,045 1,286 1,181 5,189 4,722 4,430 Provision for income taxes (teb) 10 297 322 298 324 320 296 275 293 311 1,241 1,184 1,162 Net income 11 1,047 1,006 938 957 894 881 770 993 870 3,948 3,538 3,268 Adjusted net income 12 1,059 1,018 950 968 906 893 782 1,006 883 3,995 3,587 3,320 Return on equity (2) 13 19.0 % 18.5 % 18.2 % 18.5 % 17.1 % 16.7 % 14.8 % 18.1 % 16.7 % 18.6 % 16.7 % 15.8 %Adjusted return on equity (2) 14 19.3 % 18.8 % 18.5 % 18.7 % 17.3 % 16.9 % 15.0 % 18.3 % 17.0 % 18.8 % 16.9 % 16.1 %Net interest margin on average earning assets (teb) 15 2.98 % 2.97 % 2.97 % 2.94 % 2.94 % 2.91 % 2.86 % 2.87 % 2.87 % 2.97 % 2.90 % 2.88 %Revenue growth 16 7.1 % 6.7 % 7.0 % 0.5 % 1.9 % 3.4 % 2.2 % 8.5 % 12.3 % 5.3 % 4.0 % 13.0 %Non-interest expense growth 17 5.9 % 4.4 % 2.4 % 2.6 % 0.7 % 4.9 % 2.4 % 1.6 % 8.5 % 3.8 % 2.4 % 10.5 %Adjusted non-interest expense 18 1,724 1,717 1,643 1,672 1,626 1,644 1,603 1,627 1,614 6,756 6,500 6,343 Adjusted non-interest expense growth 19 6.0 % 4.5 % 2.5 % 2.7 % 0.8 % 5.0 % 2.5 % 1.7 % 8.7 % 3.9 % 2.5 % 10.7 %Efficiency ratio (teb) 20 53.3 % 53.5 % 53.9 % 54.2 % 53.9 % 54.7 % 56.3 % 53.0 % 54.5 % 53.7 % 54.4 % 55.3 %Adjusted efficiency ratio (teb) 21 52.8 % 53.1 % 53.4 % 53.7 % 53.3 % 54.2 % 55.7 % 52.5 % 53.9 % 53.2 % 53.9 % 54.7 %Operating leverage 22 1.2 % 2.3 % 4.6 % (2.1)% 1.2 % (1.5)% (0.2)% 6.9 % 3.8 % 1.5 % 1.6 % 2.5 %Adjusted operating leverage 23 1.1 % 2.2 % 4.5 % (2.2)% 1.1 % (1.6)% (0.3)% 6.8 % 3.6 % 1.4 % 1.5 % 2.3 %Net income growth 24 17.1 % 14.1 % 21.8 % (3.6)% 2.8 % 5.8 % (2.3)% 27.9 % 13.2 % 11.6 % 8.3 % 11.4 %Adjusted net income growth 25 16.9 % 13.9 % 21.3 % (3.6)% 2.6 % 5.6 % (2.3)% 27.2 % 12.7 % 11.4 % 8.0 % 11.0 %Average common equity (2) 26 21,475 21,197 20,733 20,246 20,427 20,567 20,968 21,439 20,290 20,914 20,849 20,241 Average assets 27 343,352 338,497 331,806 325,862 324,058 321,451 321,158 320,886 321,449 334,904 321,894 314,129 Average earning assets 28 324,014 319,954 313,568 307,810 305,841 303,642 303,941 303,279 303,994 316,359 304,178 297,178 Average net loans and acceptances 29 328,923 323,984 316,712 310,353 309,280 306,089 305,409 304,151 303,977 320,019 306,239 296,678 Average gross loans and acceptances 30 330,502 325,545 318,262 311,731 309,413 306,193 305,560 304,332 304,220 321,537 306,381 296,932 Average deposits 31 258,602 251,671 248,013 242,525 236,309 238,998 239,063 239,326 235,399 250,221 238,419 230,013 Number of full-time equivalent employees 32 21,832 21,978 21,606 21,714 21,697 22,568 22,495 22,444 21,858 21,832 21,697 21,858 (1) 2016 and 2017 have not been restated to reflect the new IFRS standard adopted in 2018. The adoption of the new IFRS standard in 2018 has been applied prospectively.(2) Operating groups have been allocated capital at a consistent level in 2018 and 2017, and at a higher level than in 2016.
October 31, 2018 Supplementary Financial Information Page 5
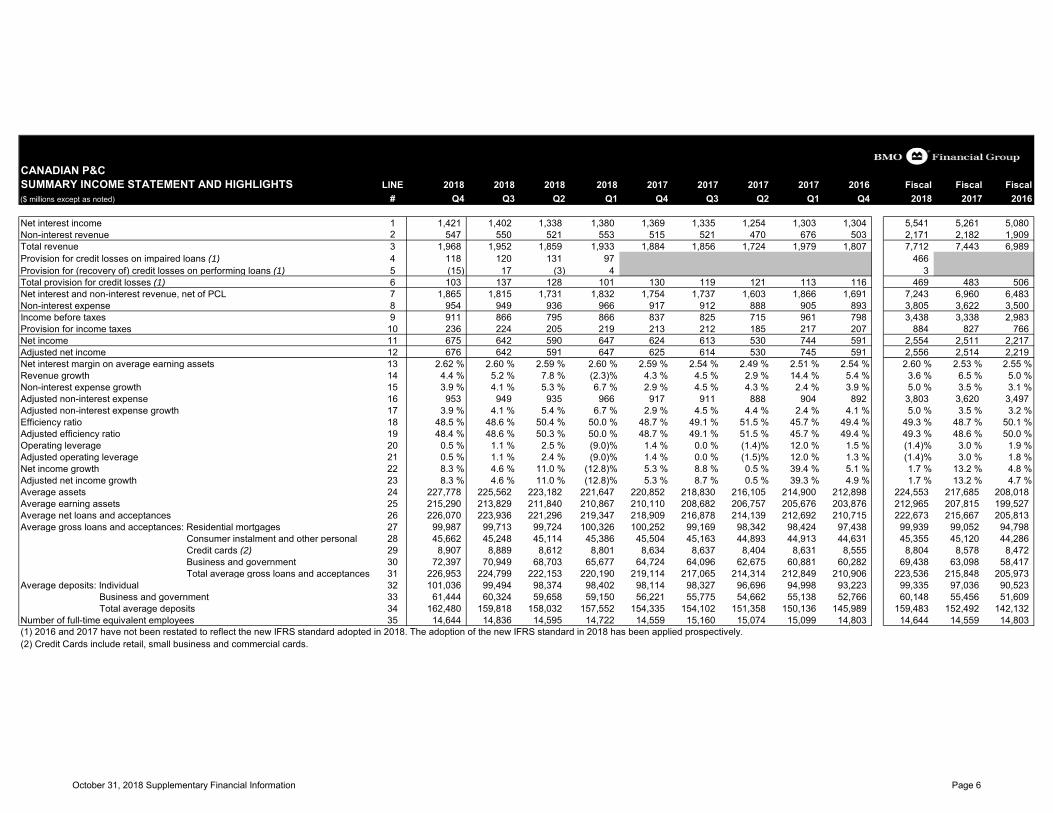
CANADIAN P&CSUMMARY INCOME STATEMENT AND HIGHLIGHTS LINE 2018 2018 2018 2018 2017 2017 2017 2017 2016 Fiscal Fiscal Fiscal($ millions except as noted) # Q4 Q3 Q2 Q1 Q4 Q3 Q2 Q1 Q4 2018 2017 2016
Net interest income 1 1,421 1,402 1,338 1,380 1,369 1,335 1,254 1,303 1,304 5,541 5,261 5,080 Non-interest revenue 2 547 550 521 553 515 521 470 676 503 2,171 2,182 1,909 Total revenue 3 1,968 1,952 1,859 1,933 1,884 1,856 1,724 1,979 1,807 7,712 7,443 6,989 Provision for credit losses on impaired loans (1) 4 118 120 131 97 466 Provision for (recovery of) credit losses on performing loans (1) 5 (15) 17 (3) 4 3 Total provision for credit losses (1) 6 103 137 128 101 130 119 121 113 116 469 483 506 Net interest and non-interest revenue, net of PCL 7 1,865 1,815 1,731 1,832 1,754 1,737 1,603 1,866 1,691 7,243 6,960 6,483 Non-interest expense 8 954 949 936 966 917 912 888 905 893 3,805 3,622 3,500 Income before taxes 9 911 866 795 866 837 825 715 961 798 3,438 3,338 2,983 Provision for income taxes 10 236 224 205 219 213 212 185 217 207 884 827 766 Net income 11 675 642 590 647 624 613 530 744 591 2,554 2,511 2,217 Adjusted net income 12 676 642 591 647 625 614 530 745 591 2,556 2,514 2,219 Net interest margin on average earning assets 13 2.62 % 2.60 % 2.59 % 2.60 % 2.59 % 2.54 % 2.49 % 2.51 % 2.54 % 2.60 % 2.53 % 2.55 %Revenue growth 14 4.4 % 5.2 % 7.8 % (2.3)% 4.3 % 4.5 % 2.9 % 14.4 % 5.4 % 3.6 % 6.5 % 5.0 %Non-interest expense growth 15 3.9 % 4.1 % 5.3 % 6.7 % 2.9 % 4.5 % 4.3 % 2.4 % 3.9 % 5.0 % 3.5 % 3.1 %Adjusted non-interest expense 16 953 949 935 966 917 911 888 904 892 3,803 3,620 3,497 Adjusted non-interest expense growth 17 3.9 % 4.1 % 5.4 % 6.7 % 2.9 % 4.5 % 4.4 % 2.4 % 4.1 % 5.0 % 3.5 % 3.2 %Efficiency ratio 18 48.5 % 48.6 % 50.4 % 50.0 % 48.7 % 49.1 % 51.5 % 45.7 % 49.4 % 49.3 % 48.7 % 50.1 %Adjusted efficiency ratio 19 48.4 % 48.6 % 50.3 % 50.0 % 48.7 % 49.1 % 51.5 % 45.7 % 49.4 % 49.3 % 48.6 % 50.0 %Operating leverage 20 0.5 % 1.1 % 2.5 % (9.0)% 1.4 % 0.0 % (1.4)% 12.0 % 1.5 % (1.4)% 3.0 % 1.9 %Adjusted operating leverage 21 0.5 % 1.1 % 2.4 % (9.0)% 1.4 % 0.0 % (1.5)% 12.0 % 1.3 % (1.4)% 3.0 % 1.8 %Net income growth 22 8.3 % 4.6 % 11.0 % (12.8)% 5.3 % 8.8 % 0.5 % 39.4 % 5.1 % 1.7 % 13.2 % 4.8 %Adjusted net income growth 23 8.3 % 4.6 % 11.0 % (12.8)% 5.3 % 8.7 % 0.5 % 39.3 % 4.9 % 1.7 % 13.2 % 4.7 %Average assets 24 227,778 225,562 223,182 221,647 220,852 218,830 216,105 214,900 212,898 224,553 217,685 208,018 Average earning assets 25 215,290 213,829 211,840 210,867 210,110 208,682 206,757 205,676 203,876 212,965 207,815 199,527 Average net loans and acceptances 26 226,070 223,936 221,296 219,347 218,909 216,878 214,139 212,692 210,715 222,673 215,667 205,813 Average gross loans and acceptances: Residential mortgages 27 99,987 99,713 99,724 100,326 100,252 99,169 98,342 98,424 97,438 99,939 99,052 94,798
Consumer instalment and other personal 28 45,662 45,248 45,114 45,386 45,504 45,163 44,893 44,913 44,631 45,355 45,120 44,286 Credit cards (2) 29 8,907 8,889 8,612 8,801 8,634 8,637 8,404 8,631 8,555 8,804 8,578 8,472 Business and government 30 72,397 70,949 68,703 65,677 64,724 64,096 62,675 60,881 60,282 69,438 63,098 58,417 Total average gross loans and acceptances 31 226,953 224,799 222,153 220,190 219,114 217,065 214,314 212,849 210,906 223,536 215,848 205,973
Average deposits: Individual 32 101,036 99,494 98,374 98,402 98,114 98,327 96,696 94,998 93,223 99,335 97,036 90,523 Business and government 33 61,444 60,324 59,658 59,150 56,221 55,775 54,662 55,138 52,766 60,148 55,456 51,609 Total average deposits 34 162,480 159,818 158,032 157,552 154,335 154,102 151,358 150,136 145,989 159,483 152,492 142,132
Number of full-time equivalent employees 35 14,644 14,836 14,595 14,722 14,559 15,160 15,074 15,099 14,803 14,644 14,559 14,803 (1) 2016 and 2017 have not been restated to reflect the new IFRS standard adopted in 2018. The adoption of the new IFRS standard in 2018 has been applied prospectively.(2) Credit Cards include retail, small business and commercial cards.
October 31, 2018 Supplementary Financial Information Page 6
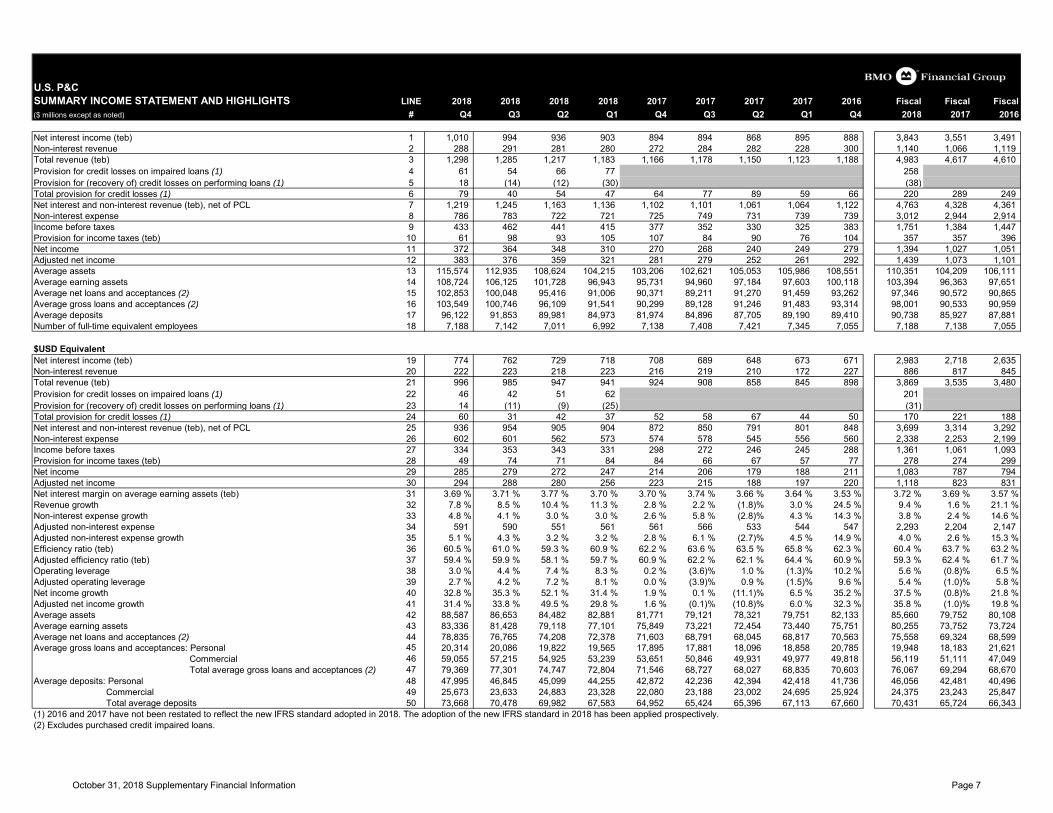
U.S. P&CSUMMARY INCOME STATEMENT AND HIGHLIGHTS LINE 2018 2018 2018 2018 2017 2017 2017 2017 2016 Fiscal Fiscal Fiscal($ millions except as noted) # Q4 Q3 Q2 Q1 Q4 Q3 Q2 Q1 Q4 2018 2017 2016
Net interest income (teb) 1 1,010 994 936 903 894 894 868 895 888 3,843 3,551 3,491 Non-interest revenue 2 288 291 281 280 272 284 282 228 300 1,140 1,066 1,119 Total revenue (teb) 3 1,298 1,285 1,217 1,183 1,166 1,178 1,150 1,123 1,188 4,983 4,617 4,610 Provision for credit losses on impaired loans (1) 4 61 54 66 77 258 Provision for (recovery of) credit losses on performing loans (1) 5 18 (14) (12) (30) (38) Total provision for credit losses (1) 6 79 40 54 47 64 77 89 59 66 220 289 249 Net interest and non-interest revenue (teb), net of PCL 7 1,219 1,245 1,163 1,136 1,102 1,101 1,061 1,064 1,122 4,763 4,328 4,361 Non-interest expense 8 786 783 722 721 725 749 731 739 739 3,012 2,944 2,914 Income before taxes 9 433 462 441 415 377 352 330 325 383 1,751 1,384 1,447 Provision for income taxes (teb) 10 61 98 93 105 107 84 90 76 104 357 357 396 Net income 11 372 364 348 310 270 268 240 249 279 1,394 1,027 1,051 Adjusted net income 12 383 376 359 321 281 279 252 261 292 1,439 1,073 1,101 Average assets 13 115,574 112,935 108,624 104,215 103,206 102,621 105,053 105,986 108,551 110,351 104,209 106,111 Average earning assets 14 108,724 106,125 101,728 96,943 95,731 94,960 97,184 97,603 100,118 103,394 96,363 97,651 Average net loans and acceptances (2) 15 102,853 100,048 95,416 91,006 90,371 89,211 91,270 91,459 93,262 97,346 90,572 90,865 Average gross loans and acceptances (2) 16 103,549 100,746 96,109 91,541 90,299 89,128 91,246 91,483 93,314 98,001 90,533 90,959 Average deposits 17 96,122 91,853 89,981 84,973 81,974 84,896 87,705 89,190 89,410 90,738 85,927 87,881 Number of full-time equivalent employees 18 7,188 7,142 7,011 6,992 7,138 7,408 7,421 7,345 7,055 7,188 7,138 7,055
$USD EquivalentNet interest income (teb) 19 774 762 729 718 708 689 648 673 671 2,983 2,718 2,635 Non-interest revenue 20 222 223 218 223 216 219 210 172 227 886 817 845 Total revenue (teb) 21 996 985 947 941 924 908 858 845 898 3,869 3,535 3,480 Provision for credit losses on impaired loans (1) 22 46 42 51 62 201 Provision for (recovery of) credit losses on performing loans (1) 23 14 (11) (9) (25) (31) Total provision for credit losses (1) 24 60 31 42 37 52 58 67 44 50 170 221 188 Net interest and non-interest revenue (teb), net of PCL 25 936 954 905 904 872 850 791 801 848 3,699 3,314 3,292 Non-interest expense 26 602 601 562 573 574 578 545 556 560 2,338 2,253 2,199 Income before taxes 27 334 353 343 331 298 272 246 245 288 1,361 1,061 1,093 Provision for income taxes (teb) 28 49 74 71 84 84 66 67 57 77 278 274 299 Net income 29 285 279 272 247 214 206 179 188 211 1,083 787 794 Adjusted net income 30 294 288 280 256 223 215 188 197 220 1,118 823 831 Net interest margin on average earning assets (teb) 31 3.69 % 3.71 % 3.77 % 3.70 % 3.70 % 3.74 % 3.66 % 3.64 % 3.53 % 3.72 % 3.69 % 3.57 %Revenue growth 32 7.8 % 8.5 % 10.4 % 11.3 % 2.8 % 2.2 % (1.8)% 3.0 % 24.5 % 9.4 % 1.6 % 21.1 %Non-interest expense growth 33 4.8 % 4.1 % 3.0 % 3.0 % 2.6 % 5.8 % (2.8)% 4.3 % 14.3 % 3.8 % 2.4 % 14.6 %Adjusted non-interest expense 34 591 590 551 561 561 566 533 544 547 2,293 2,204 2,147 Adjusted non-interest expense growth 35 5.1 % 4.3 % 3.2 % 3.2 % 2.8 % 6.1 % (2.7)% 4.5 % 14.9 % 4.0 % 2.6 % 15.3 %Efficiency ratio (teb) 36 60.5 % 61.0 % 59.3 % 60.9 % 62.2 % 63.6 % 63.5 % 65.8 % 62.3 % 60.4 % 63.7 % 63.2 %Adjusted efficiency ratio (teb) 37 59.4 % 59.9 % 58.1 % 59.7 % 60.9 % 62.2 % 62.1 % 64.4 % 60.9 % 59.3 % 62.4 % 61.7 %Operating leverage 38 3.0 % 4.4 % 7.4 % 8.3 % 0.2 % (3.6)% 1.0 % (1.3)% 10.2 % 5.6 % (0.8)% 6.5 %Adjusted operating leverage 39 2.7 % 4.2 % 7.2 % 8.1 % 0.0 % (3.9)% 0.9 % (1.5)% 9.6 % 5.4 % (1.0)% 5.8 %Net income growth 40 32.8 % 35.3 % 52.1 % 31.4 % 1.9 % 0.1 % (11.1)% 6.5 % 35.2 % 37.5 % (0.8)% 21.8 %Adjusted net income growth 41 31.4 % 33.8 % 49.5 % 29.8 % 1.6 % (0.1)% (10.8)% 6.0 % 32.3 % 35.8 % (1.0)% 19.8 %Average assets 42 88,587 86,653 84,482 82,881 81,771 79,121 78,321 79,751 82,133 85,660 79,752 80,108 Average earning assets 43 83,336 81,428 79,118 77,101 75,849 73,221 72,454 73,440 75,751 80,255 73,752 73,724 Average net loans and acceptances (2) 44 78,835 76,765 74,208 72,378 71,603 68,791 68,045 68,817 70,563 75,558 69,324 68,599 Average gross loans and acceptances: Personal 45 20,314 20,086 19,822 19,565 17,895 17,881 18,096 18,858 20,785 19,948 18,183 21,621
Commercial 46 59,055 57,215 54,925 53,239 53,651 50,846 49,931 49,977 49,818 56,119 51,111 47,049 Total average gross loans and acceptances (2) 47 79,369 77,301 74,747 72,804 71,546 68,727 68,027 68,835 70,603 76,067 69,294 68,670
Average deposits: Personal 48 47,995 46,845 45,099 44,255 42,872 42,236 42,394 42,418 41,736 46,056 42,481 40,496 Commercial 49 25,673 23,633 24,883 23,328 22,080 23,188 23,002 24,695 25,924 24,375 23,243 25,847 Total average deposits 50 73,668 70,478 69,982 67,583 64,952 65,424 65,396 67,113 67,660 70,431 65,724 66,343
(1) 2016 and 2017 have not been restated to reflect the new IFRS standard adopted in 2018. The adoption of the new IFRS standard in 2018 has been applied prospectively.(2) Excludes purchased credit impaired loans.
October 31, 2018 Supplementary Financial Information Page 7
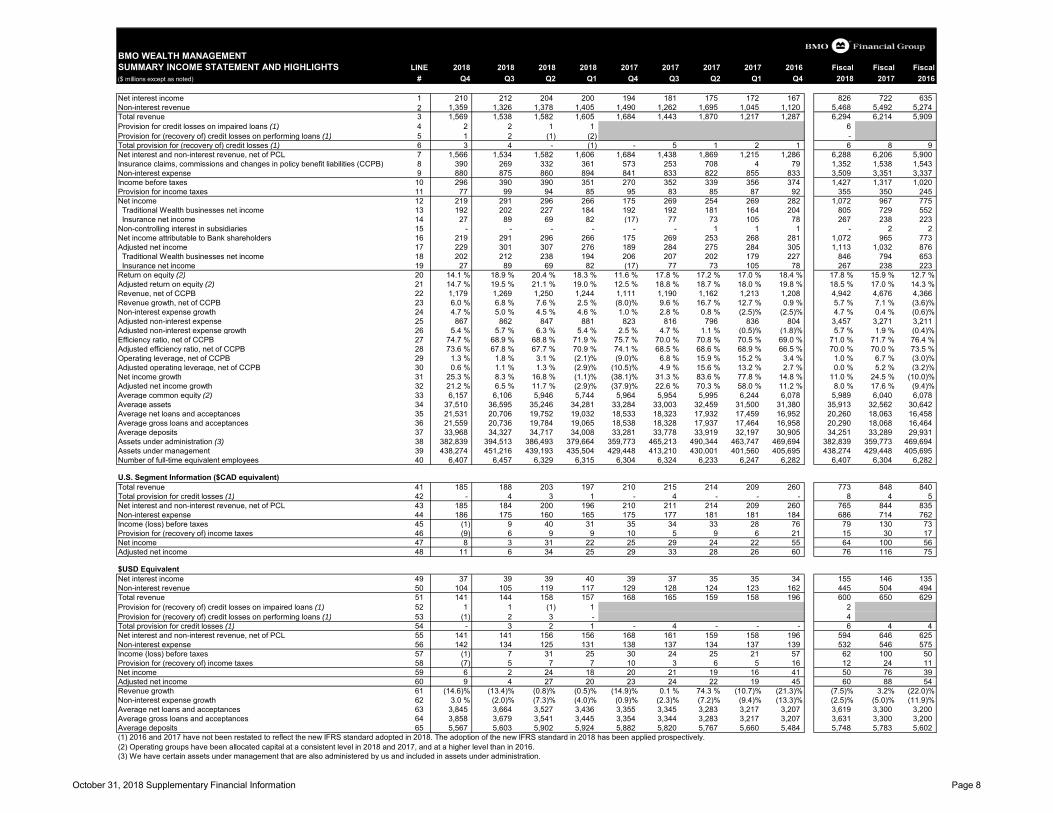
BMO WEALTH MANAGEMENTSUMMARY INCOME STATEMENT AND HIGHLIGHTS LINE 2018 2018 2018 2018 2017 2017 2017 2017 2016 Fiscal Fiscal Fiscal($ millions except as noted) # Q4 Q3 Q2 Q1 Q4 Q3 Q2 Q1 Q4 2018 2017 2016
Net interest income 1 210 212 204 200 194 181 175 172 167 826 722 635 Non-interest revenue 2 1,359 1,326 1,378 1,405 1,490 1,262 1,695 1,045 1,120 5,468 5,492 5,274 Total revenue 3 1,569 1,538 1,582 1,605 1,684 1,443 1,870 1,217 1,287 6,294 6,214 5,909 Provision for credit losses on impaired loans (1) 4 2 2 1 1 6 Provision for (recovery of) credit losses on performing loans (1) 5 1 2 (1) (2) - Total provision for (recovery of) credit losses (1) 6 3 4 - (1) - 5 1 2 1 6 8 9 Net interest and non-interest revenue, net of PCL 7 1,566 1,534 1,582 1,606 1,684 1,438 1,869 1,215 1,286 6,288 6,206 5,900 Insurance claims, commissions and changes in policy benefit liabilities (CCPB) 8 390 269 332 361 573 253 708 4 79 1,352 1,538 1,543 Non-interest expense 9 880 875 860 894 841 833 822 855 833 3,509 3,351 3,337 Income before taxes 10 296 390 390 351 270 352 339 356 374 1,427 1,317 1,020 Provision for income taxes 11 77 99 94 85 95 83 85 87 92 355 350 245 Net income 12 219 291 296 266 175 269 254 269 282 1,072 967 775 Traditional Wealth businesses net income 13 192 202 227 184 192 192 181 164 204 805 729 552 Insurance net income 14 27 89 69 82 (17) 77 73 105 78 267 238 223 Non-controlling interest in subsidiaries 15 - - - - - - 1 1 1 - 2 2 Net income attributable to Bank shareholders 16 219 291 296 266 175 269 253 268 281 1,072 965 773 Adjusted net income 17 229 301 307 276 189 284 275 284 305 1,113 1,032 876 Traditional Wealth businesses net income 18 202 212 238 194 206 207 202 179 227 846 794 653 Insurance net income 19 27 89 69 82 (17) 77 73 105 78 267 238 223 Return on equity (2) 20 14.1 % 18.9 % 20.4 % 18.3 % 11.6 % 17.8 % 17.2 % 17.0 % 18.4 % 17.8 % 15.9 % 12.7 %Adjusted return on equity (2) 21 14.7 % 19.5 % 21.1 % 19.0 % 12.5 % 18.8 % 18.7 % 18.0 % 19.8 % 18.5 % 17.0 % 14.3 %Revenue, net of CCPB 22 1,179 1,269 1,250 1,244 1,111 1,190 1,162 1,213 1,208 4,942 4,676 4,366 Revenue growth, net of CCPB 23 6.0 % 6.8 % 7.6 % 2.5 % (8.0)% 9.6 % 16.7 % 12.7 % 0.9 % 5.7 % 7.1 % (3.6)%Non-interest expense growth 24 4.7 % 5.0 % 4.5 % 4.6 % 1.0 % 2.8 % 0.8 % (2.5)% (2.5)% 4.7 % 0.4 % (0.6)%Adjusted non-interest expense 25 867 862 847 881 823 816 796 836 804 3,457 3,271 3,211 Adjusted non-interest expense growth 26 5.4 % 5.7 % 6.3 % 5.4 % 2.5 % 4.7 % 1.1 % (0.5)% (1.8)% 5.7 % 1.9 % (0.4)%Efficiency ratio, net of CCPB 27 74.7 % 68.9 % 68.8 % 71.9 % 75.7 % 70.0 % 70.8 % 70.5 % 69.0 % 71.0 % 71.7 % 76.4 %Adjusted efficiency ratio, net of CCPB 28 73.6 % 67.8 % 67.7 % 70.9 % 74.1 % 68.5 % 68.6 % 68.9 % 66.5 % 70.0 % 70.0 % 73.5 %Operating leverage, net of CCPB 29 1.3 % 1.8 % 3.1 % (2.1)% (9.0)% 6.8 % 15.9 % 15.2 % 3.4 % 1.0 % 6.7 % (3.0)%Adjusted operating leverage, net of CCPB 30 0.6 % 1.1 % 1.3 % (2.9)% (10.5)% 4.9 % 15.6 % 13.2 % 2.7 % 0.0 % 5.2 % (3.2)%Net income growth 31 25.3 % 8.3 % 16.8 % (1.1)% (38.1)% 31.3 % 83.6 % 77.8 % 14.8 % 11.0 % 24.5 % (10.0)%Adjusted net income growth 32 21.2 % 6.5 % 11.7 % (2.9)% (37.9)% 22.6 % 70.3 % 58.0 % 11.2 % 8.0 % 17.6 % (9.4)%Average common equity (2) 33 6,157 6,106 5,946 5,744 5,964 5,954 5,995 6,244 6,078 5,989 6,040 6,078 Average assets 34 37,510 36,595 35,246 34,281 33,284 33,003 32,459 31,500 31,380 35,913 32,562 30,642 Average net loans and acceptances 35 21,531 20,706 19,752 19,032 18,533 18,323 17,932 17,459 16,952 20,260 18,063 16,458 Average gross loans and acceptances 36 21,559 20,736 19,784 19,065 18,538 18,328 17,937 17,464 16,958 20,290 18,068 16,464 Average deposits 37 33,968 34,327 34,717 34,008 33,281 33,778 33,919 32,197 30,905 34,251 33,289 29,931 Assets under administration (3) 38 382,839 394,513 386,493 379,664 359,773 465,213 490,344 463,747 469,694 382,839 359,773 469,694 Assets under management 39 438,274 451,216 439,193 435,504 429,448 413,210 430,001 401,560 405,695 438,274 429,448 405,695 Number of full-time equivalent employees 40 6,407 6,457 6,329 6,315 6,304 6,324 6,233 6,247 6,282 6,407 6,304 6,282
U.S. Segment Information ($CAD equivalent)Total revenue 41 185 188 203 197 210 215 214 209 260 773 848 840 Total provision for credit losses (1) 42 - 4 3 1 - 4 - - - 8 4 5 Net interest and non-interest revenue, net of PCL 43 185 184 200 196 210 211 214 209 260 765 844 835 Non-interest expense 44 186 175 160 165 175 177 181 181 184 686 714 762 Income (loss) before taxes 45 (1) 9 40 31 35 34 33 28 76 79 130 73 Provision for (recovery of) income taxes 46 (9) 6 9 9 10 5 9 6 21 15 30 17 Net income 47 8 3 31 22 25 29 24 22 55 64 100 56 Adjusted net income 48 11 6 34 25 29 33 28 26 60 76 116 75
$USD EquivalentNet interest income 49 37 39 39 40 39 37 35 35 34 155 146 135 Non-interest revenue 50 104 105 119 117 129 128 124 123 162 445 504 494 Total revenue 51 141 144 158 157 168 165 159 158 196 600 650 629 Provision for (recovery of) credit losses on impaired loans (1) 52 1 1 (1) 1 2 Provision for (recovery of) credit losses on performing loans (1) 53 (1) 2 3 - 4 Total provision for credit losses (1) 54 - 3 2 1 - 4 - - - 6 4 4 Net interest and non-interest revenue, net of PCL 55 141 141 156 156 168 161 159 158 196 594 646 625 Non-interest expense 56 142 134 125 131 138 137 134 137 139 532 546 575 Income (loss) before taxes 57 (1) 7 31 25 30 24 25 21 57 62 100 50 Provision for (recovery of) income taxes 58 (7) 5 7 7 10 3 6 5 16 12 24 11 Net income 59 6 2 24 18 20 21 19 16 41 50 76 39 Adjusted net income 60 9 4 27 20 23 24 22 19 45 60 88 54 Revenue growth 61 (14.6)% (13.4)% (0.8)% (0.5)% (14.9)% 0.1 % 74.3 % (10.7)% (21.3)% (7.5)% 3.2% (22.0)%Non-interest expense growth 62 3.0 % (2.0)% (7.3)% (4.0)% (0.9)% (2.3)% (7.2)% (9.4)% (13.3)% (2.5)% (5.0)% (11.9)%Average net loans and acceptances 63 3,845 3,664 3,527 3,436 3,355 3,345 3,283 3,217 3,207 3,619 3,300 3,200 Average gross loans and acceptances 64 3,858 3,679 3,541 3,445 3,354 3,344 3,283 3,217 3,207 3,631 3,300 3,200 Average deposits 65 5,567 5,603 5,902 5,924 5,882 5,820 5,767 5,660 5,484 5,748 5,783 5,602 (1) 2016 and 2017 have not been restated to reflect the new IFRS standard adopted in 2018. The adoption of the new IFRS standard in 2018 has been applied prospectively.(2) Operating groups have been allocated capital at a consistent level in 2018 and 2017, and at a higher level than in 2016.(3) We have certain assets under management that are also administered by us and included in assets under administration.
October 31, 2018 Supplementary Financial Information Page 8
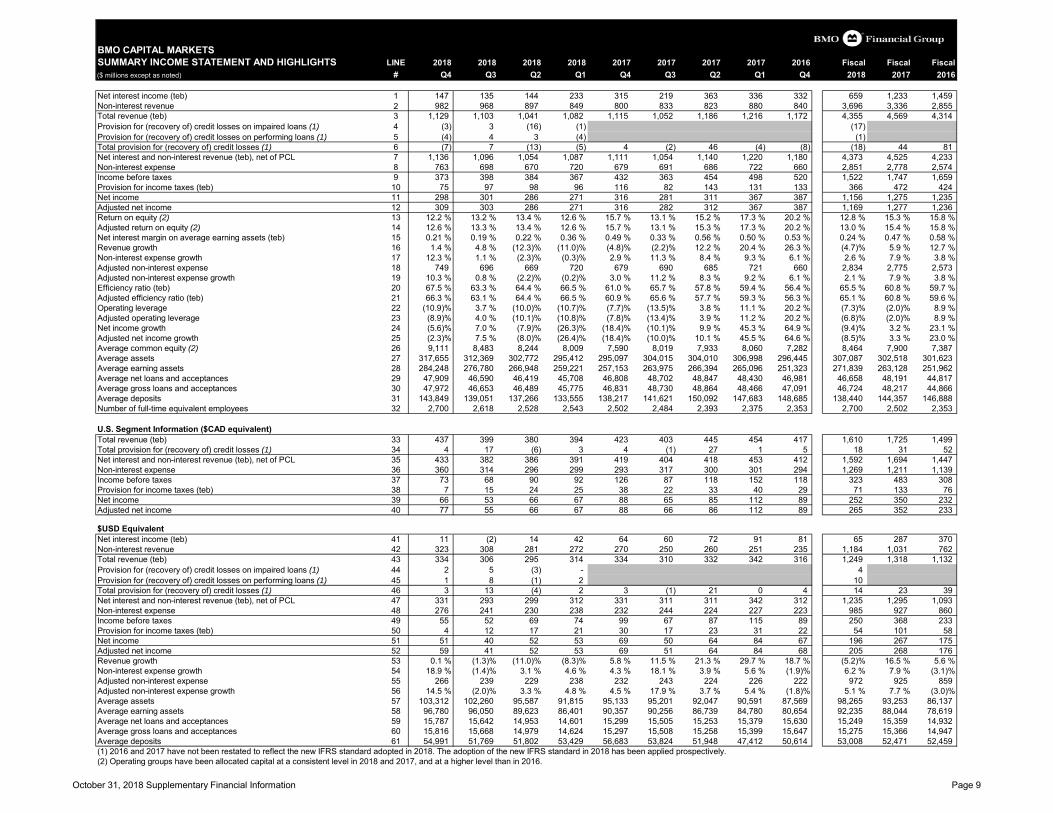
BMO CAPITAL MARKETSSUMMARY INCOME STATEMENT AND HIGHLIGHTS LINE 2018 2018 2018 2018 2017 2017 2017 2017 2016 Fiscal Fiscal Fiscal($ millions except as noted) # Q4 Q3 Q2 Q1 Q4 Q3 Q2 Q1 Q4 2018 2017 2016
Net interest income (teb) 1 147 135 144 233 315 219 363 336 332 659 1,233 1,459 Non-interest revenue 2 982 968 897 849 800 833 823 880 840 3,696 3,336 2,855 Total revenue (teb) 3 1,129 1,103 1,041 1,082 1,115 1,052 1,186 1,216 1,172 4,355 4,569 4,314 Provision for (recovery of) credit losses on impaired loans (1) 4 (3) 3 (16) (1) (17) Provision for (recovery of) credit losses on performing loans (1) 5 (4) 4 3 (4) (1) Total provision for (recovery of) credit losses (1) 6 (7) 7 (13) (5) 4 (2) 46 (4) (8) (18) 44 81 Net interest and non-interest revenue (teb), net of PCL 7 1,136 1,096 1,054 1,087 1,111 1,054 1,140 1,220 1,180 4,373 4,525 4,233 Non-interest expense 8 763 698 670 720 679 691 686 722 660 2,851 2,778 2,574 Income before taxes 9 373 398 384 367 432 363 454 498 520 1,522 1,747 1,659 Provision for income taxes (teb) 10 75 97 98 96 116 82 143 131 133 366 472 424 Net income 11 298 301 286 271 316 281 311 367 387 1,156 1,275 1,235 Adjusted net income 12 309 303 286 271 316 282 312 367 387 1,169 1,277 1,236 Return on equity (2) 13 12.2 % 13.2 % 13.4 % 12.6 % 15.7 % 13.1 % 15.2 % 17.3 % 20.2 % 12.8 % 15.3 % 15.8 %Adjusted return on equity (2) 14 12.6 % 13.3 % 13.4 % 12.6 % 15.7 % 13.1 % 15.3 % 17.3 % 20.2 % 13.0 % 15.4 % 15.8 %Net interest margin on average earning assets (teb) 15 0.21 % 0.19 % 0.22 % 0.36 % 0.49 % 0.33 % 0.56 % 0.50 % 0.53 % 0.24 % 0.47 % 0.58 %Revenue growth 16 1.4 % 4.8 % (12.3)% (11.0)% (4.8)% (2.2)% 12.2 % 20.4 % 26.3 % (4.7)% 5.9 % 12.7 %Non-interest expense growth 17 12.3 % 1.1 % (2.3)% (0.3)% 2.9 % 11.3 % 8.4 % 9.3 % 6.1 % 2.6 % 7.9 % 3.8 %Adjusted non-interest expense 18 749 696 669 720 679 690 685 721 660 2,834 2,775 2,573 Adjusted non-interest expense growth 19 10.3 % 0.8 % (2.2)% (0.2)% 3.0 % 11.2 % 8.3 % 9.2 % 6.1 % 2.1 % 7.9 % 3.8 %Efficiency ratio (teb) 20 67.5 % 63.3 % 64.4 % 66.5 % 61.0 % 65.7 % 57.8 % 59.4 % 56.4 % 65.5 % 60.8 % 59.7 %Adjusted efficiency ratio (teb) 21 66.3 % 63.1 % 64.4 % 66.5 % 60.9 % 65.6 % 57.7 % 59.3 % 56.3 % 65.1 % 60.8 % 59.6 %Operating leverage 22 (10.9)% 3.7 % (10.0)% (10.7)% (7.7)% (13.5)% 3.8 % 11.1 % 20.2 % (7.3)% (2.0)% 8.9 %Adjusted operating leverage 23 (8.9)% 4.0 % (10.1)% (10.8)% (7.8)% (13.4)% 3.9 % 11.2 % 20.2 % (6.8)% (2.0)% 8.9 %Net income growth 24 (5.6)% 7.0 % (7.9)% (26.3)% (18.4)% (10.1)% 9.9 % 45.3 % 64.9 % (9.4)% 3.2 % 23.1 %Adjusted net income growth 25 (2.3)% 7.5 % (8.0)% (26.4)% (18.4)% (10.0)% 10.1 % 45.5 % 64.6 % (8.5)% 3.3 % 23.0 %Average common equity (2) 26 9,111 8,483 8,244 8,009 7,590 8,019 7,933 8,060 7,282 8,464 7,900 7,387 Average assets 27 317,655 312,369 302,772 295,412 295,097 304,015 304,010 306,998 296,445 307,087 302,518 301,623 Average earning assets 28 284,248 276,780 266,948 259,221 257,153 263,975 266,394 265,096 251,323 271,839 263,128 251,962 Average net loans and acceptances 29 47,909 46,590 46,419 45,708 46,808 48,702 48,847 48,430 46,981 46,658 48,191 44,817 Average gross loans and acceptances 30 47,972 46,653 46,489 45,775 46,831 48,730 48,864 48,466 47,091 46,724 48,217 44,866 Average deposits 31 143,849 139,051 137,266 133,555 138,217 141,621 150,092 147,683 148,685 138,440 144,357 146,888 Number of full-time equivalent employees 32 2,700 2,618 2,528 2,543 2,502 2,484 2,393 2,375 2,353 2,700 2,502 2,353
U.S. Segment Information ($CAD equivalent)Total revenue (teb) 33 437 399 380 394 423 403 445 454 417 1,610 1,725 1,499 Total provision for (recovery of) credit losses (1) 34 4 17 (6) 3 4 (1) 27 1 5 18 31 52 Net interest and non-interest revenue (teb), net of PCL 35 433 382 386 391 419 404 418 453 412 1,592 1,694 1,447 Non-interest expense 36 360 314 296 299 293 317 300 301 294 1,269 1,211 1,139 Income before taxes 37 73 68 90 92 126 87 118 152 118 323 483 308 Provision for income taxes (teb) 38 7 15 24 25 38 22 33 40 29 71 133 76 Net income 39 66 53 66 67 88 65 85 112 89 252 350 232 Adjusted net income 40 77 55 66 67 88 66 86 112 89 265 352 233
$USD EquivalentNet interest income (teb) 41 11 (2) 14 42 64 60 72 91 81 65 287 370 Non-interest revenue 42 323 308 281 272 270 250 260 251 235 1,184 1,031 762 Total revenue (teb) 43 334 306 295 314 334 310 332 342 316 1,249 1,318 1,132 Provision for (recovery of) credit losses on impaired loans (1) 44 2 5 (3) - 4 Provision for (recovery of) credit losses on performing loans (1) 45 1 8 (1) 2 10 Total provision for (recovery of) credit losses (1) 46 3 13 (4) 2 3 (1) 21 0 4 14 23 39 Net interest and non-interest revenue (teb), net of PCL 47 331 293 299 312 331 311 311 342 312 1,235 1,295 1,093 Non-interest expense 48 276 241 230 238 232 244 224 227 223 985 927 860 Income before taxes 49 55 52 69 74 99 67 87 115 89 250 368 233 Provision for income taxes (teb) 50 4 12 17 21 30 17 23 31 22 54 101 58 Net income 51 51 40 52 53 69 50 64 84 67 196 267 175 Adjusted net income 52 59 41 52 53 69 51 64 84 68 205 268 176 Revenue growth 53 0.1 % (1.3)% (11.0)% (8.3)% 5.8 % 11.5 % 21.3 % 29.7 % 18.7 % (5.2)% 16.5 % 5.6 %Non-interest expense growth 54 18.9 % (1.4)% 3.1 % 4.6 % 4.3 % 18.1 % 3.9 % 5.6 % (1.9)% 6.2 % 7.9 % (3.1)%Adjusted non-interest expense 55 266 239 229 238 232 243 224 226 222 972 925 859 Adjusted non-interest expense growth 56 14.5 % (2.0)% 3.3 % 4.8 % 4.5 % 17.9 % 3.7 % 5.4 % (1.8)% 5.1 % 7.7 % (3.0)%Average assets 57 103,312 102,260 95,587 91,815 95,133 95,201 92,047 90,591 87,569 98,265 93,253 86,137 Average earning assets 58 96,780 96,050 89,623 86,401 90,357 90,256 86,739 84,780 80,654 92,235 88,044 78,619 Average net loans and acceptances 59 15,787 15,642 14,953 14,601 15,299 15,505 15,253 15,379 15,630 15,249 15,359 14,932 Average gross loans and acceptances 60 15,816 15,668 14,979 14,624 15,297 15,508 15,258 15,399 15,647 15,275 15,366 14,947 Average deposits 61 54,991 51,769 51,802 53,429 56,683 53,824 51,948 47,412 50,614 53,008 52,471 52,459 (1) 2016 and 2017 have not been restated to reflect the new IFRS standard adopted in 2018. The adoption of the new IFRS standard in 2018 has been applied prospectively.(2) Operating groups have been allocated capital at a consistent level in 2018 and 2017, and at a higher level than in 2016.
October 31, 2018 Supplementary Financial Information Page 9
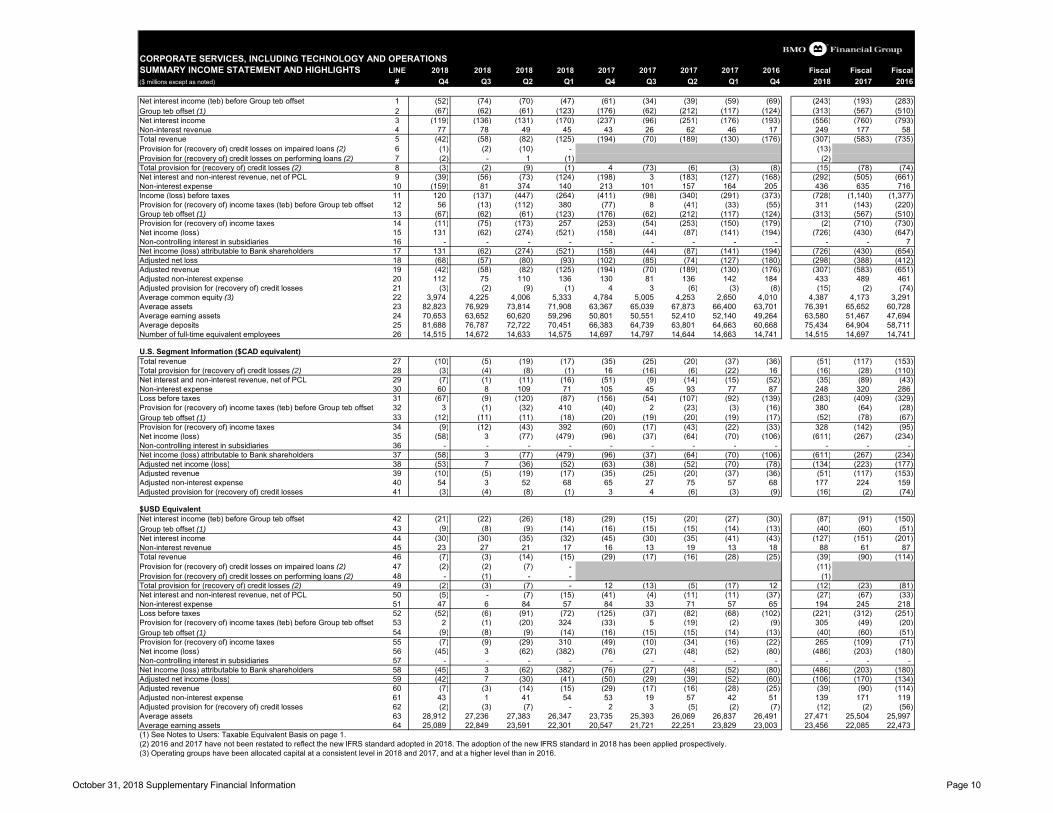
CORPORATE SERVICES, INCLUDING TECHNOLOGY AND OPERATIONSSUMMARY INCOME STATEMENT AND HIGHLIGHTS LINE 2018 2018 2018 2018 2017 2017 2017 2017 2016 Fiscal Fiscal Fiscal($ millions except as noted) # Q4 Q3 Q2 Q1 Q4 Q3 Q2 Q1 Q4 2018 2017 2016
Net interest income (teb) before Group teb offset 1 (52) (74) (70) (47) (61) (34) (39) (59) (69) (243) (193) (283) Group teb offset (1) 2 (67) (62) (61) (123) (176) (62) (212) (117) (124) (313) (567) (510) Net interest income 3 (119) (136) (131) (170) (237) (96) (251) (176) (193) (556) (760) (793) Non-interest revenue 4 77 78 49 45 43 26 62 46 17 249 177 58 Total revenue 5 (42) (58) (82) (125) (194) (70) (189) (130) (176) (307) (583) (735) Provision for (recovery of) credit losses on impaired loans (2) 6 (1) (2) (10) - (13) Provision for (recovery of) credit losses on performing loans (2) 7 (2) - 1 (1) (2) Total provision for (recovery of) credit losses (2) 8 (3) (2) (9) (1) 4 (73) (6) (3) (8) (15) (78) (74) Net interest and non-interest revenue, net of PCL 9 (39) (56) (73) (124) (198) 3 (183) (127) (168) (292) (505) (661) Non-interest expense 10 (159) 81 374 140 213 101 157 164 205 436 635 716 Income (loss) before taxes 11 120 (137) (447) (264) (411) (98) (340) (291) (373) (728) (1,140) (1,377) Provision for (recovery of) income taxes (teb) before Group teb offset 12 56 (13) (112) 380 (77) 8 (41) (33) (55) 311 (143) (220) Group teb offset (1) 13 (67) (62) (61) (123) (176) (62) (212) (117) (124) (313) (567) (510) Provision for (recovery of) income taxes 14 (11) (75) (173) 257 (253) (54) (253) (150) (179) (2) (710) (730) Net income (loss) 15 131 (62) (274) (521) (158) (44) (87) (141) (194) (726) (430) (647) Non-controlling interest in subsidiaries 16 - - - - - - - - - - - 7 Net income (loss) attributable to Bank shareholders 17 131 (62) (274) (521) (158) (44) (87) (141) (194) (726) (430) (654) Adjusted net loss 18 (68) (57) (80) (93) (102) (85) (74) (127) (180) (298) (388) (412) Adjusted revenue 19 (42) (58) (82) (125) (194) (70) (189) (130) (176) (307) (583) (651) Adjusted non-interest expense 20 112 75 110 136 130 81 136 142 184 433 489 461 Adjusted provision for (recovery of) credit losses 21 (3) (2) (9) (1) 4 3 (6) (3) (8) (15) (2) (74) Average common equity (3) 22 3,974 4,225 4,006 5,333 4,784 5,005 4,253 2,650 4,010 4,387 4,173 3,291 Average assets 23 82,823 76,929 73,814 71,908 63,367 65,039 67,873 66,400 63,701 76,391 65,652 60,728 Average earning assets 24 70,653 63,652 60,620 59,296 50,801 50,551 52,410 52,140 49,264 63,580 51,467 47,694 Average deposits 25 81,688 76,787 72,722 70,451 66,383 64,739 63,801 64,663 60,668 75,434 64,904 58,711 Number of full-time equivalent employees 26 14,515 14,672 14,633 14,575 14,697 14,797 14,644 14,663 14,741 14,515 14,697 14,741
U.S. Segment Information ($CAD equivalent)Total revenue 27 (10) (5) (19) (17) (35) (25) (20) (37) (36) (51) (117) (153) Total provision for (recovery of) credit losses (2) 28 (3) (4) (8) (1) 16 (16) (6) (22) 16 (16) (28) (110) Net interest and non-interest revenue, net of PCL 29 (7) (1) (11) (16) (51) (9) (14) (15) (52) (35) (89) (43) Non-interest expense 30 60 8 109 71 105 45 93 77 87 248 320 286 Loss before taxes 31 (67) (9) (120) (87) (156) (54) (107) (92) (139) (283) (409) (329) Provision for (recovery of) income taxes (teb) before Group teb offset 32 3 (1) (32) 410 (40) 2 (23) (3) (16) 380 (64) (28) Group teb offset (1) 33 (12) (11) (11) (18) (20) (19) (20) (19) (17) (52) (78) (67) Provision for (recovery of) income taxes 34 (9) (12) (43) 392 (60) (17) (43) (22) (33) 328 (142) (95) Net income (loss) 35 (58) 3 (77) (479) (96) (37) (64) (70) (106) (611) (267) (234) Non-controlling interest in subsidiaries 36 - - - - - - - - - - - - Net income (loss) attributable to Bank shareholders 37 (58) 3 (77) (479) (96) (37) (64) (70) (106) (611) (267) (234) Adjusted net income (loss) 38 (53) 7 (36) (52) (63) (38) (52) (70) (78) (134) (223) (177) Adjusted revenue 39 (10) (5) (19) (17) (35) (25) (20) (37) (36) (51) (117) (153) Adjusted non-interest expense 40 54 3 52 68 65 27 75 57 68 177 224 159 Adjusted provision for (recovery of) credit losses 41 (3) (4) (8) (1) 3 4 (6) (3) (9) (16) (2) (74)
$USD EquivalentNet interest income (teb) before Group teb offset 42 (21) (22) (26) (18) (29) (15) (20) (27) (30) (87) (91) (150) Group teb offset (1) 43 (9) (8) (9) (14) (16) (15) (15) (14) (13) (40) (60) (51) Net interest income 44 (30) (30) (35) (32) (45) (30) (35) (41) (43) (127) (151) (201) Non-interest revenue 45 23 27 21 17 16 13 19 13 18 88 61 87 Total revenue 46 (7) (3) (14) (15) (29) (17) (16) (28) (25) (39) (90) (114) Provision for (recovery of) credit losses on impaired loans (2) 47 (2) (2) (7) - (11) Provision for (recovery of) credit losses on performing loans (2) 48 - (1) - - (1) Total provision for (recovery of) credit losses (2) 49 (2) (3) (7) - 12 (13) (5) (17) 12 (12) (23) (81) Net interest and non-interest revenue, net of PCL 50 (5) - (7) (15) (41) (4) (11) (11) (37) (27) (67) (33) Non-interest expense 51 47 6 84 57 84 33 71 57 65 194 245 218 Loss before taxes 52 (52) (6) (91) (72) (125) (37) (82) (68) (102) (221) (312) (251) Provision for (recovery of) income taxes (teb) before Group teb offset 53 2 (1) (20) 324 (33) 5 (19) (2) (9) 305 (49) (20) Group teb offset (1) 54 (9) (8) (9) (14) (16) (15) (15) (14) (13) (40) (60) (51) Provision for (recovery of) income taxes 55 (7) (9) (29) 310 (49) (10) (34) (16) (22) 265 (109) (71) Net income (loss) 56 (45) 3 (62) (382) (76) (27) (48) (52) (80) (486) (203) (180) Non-controlling interest in subsidiaries 57 - - - - - - - - - - - - Net income (loss) attributable to Bank shareholders 58 (45) 3 (62) (382) (76) (27) (48) (52) (80) (486) (203) (180) Adjusted net income (loss) 59 (42) 7 (30) (41) (50) (29) (39) (52) (60) (106) (170) (134) Adjusted revenue 60 (7) (3) (14) (15) (29) (17) (16) (28) (25) (39) (90) (114) Adjusted non-interest expense 61 43 1 41 54 53 19 57 42 51 139 171 119 Adjusted provision for (recovery of) credit losses 62 (2) (3) (7) - 2 3 (5) (2) (7) (12) (2) (56) Average assets 63 28,912 27,236 27,383 26,347 23,735 25,393 26,069 26,837 26,491 27,471 25,504 25,997 Average earning assets 64 25,089 22,849 23,591 22,301 20,547 21,721 22,251 23,829 23,003 23,456 22,085 22,473 (1) See Notes to Users: Taxable Equivalent Basis on page 1.(2) 2016 and 2017 have not been restated to reflect the new IFRS standard adopted in 2018. The adoption of the new IFRS standard in 2018 has been applied prospectively.(3) Operating groups have been allocated capital at a consistent level in 2018 and 2017, and at a higher level than in 2016.
October 31, 2018 Supplementary Financial Information Page 10
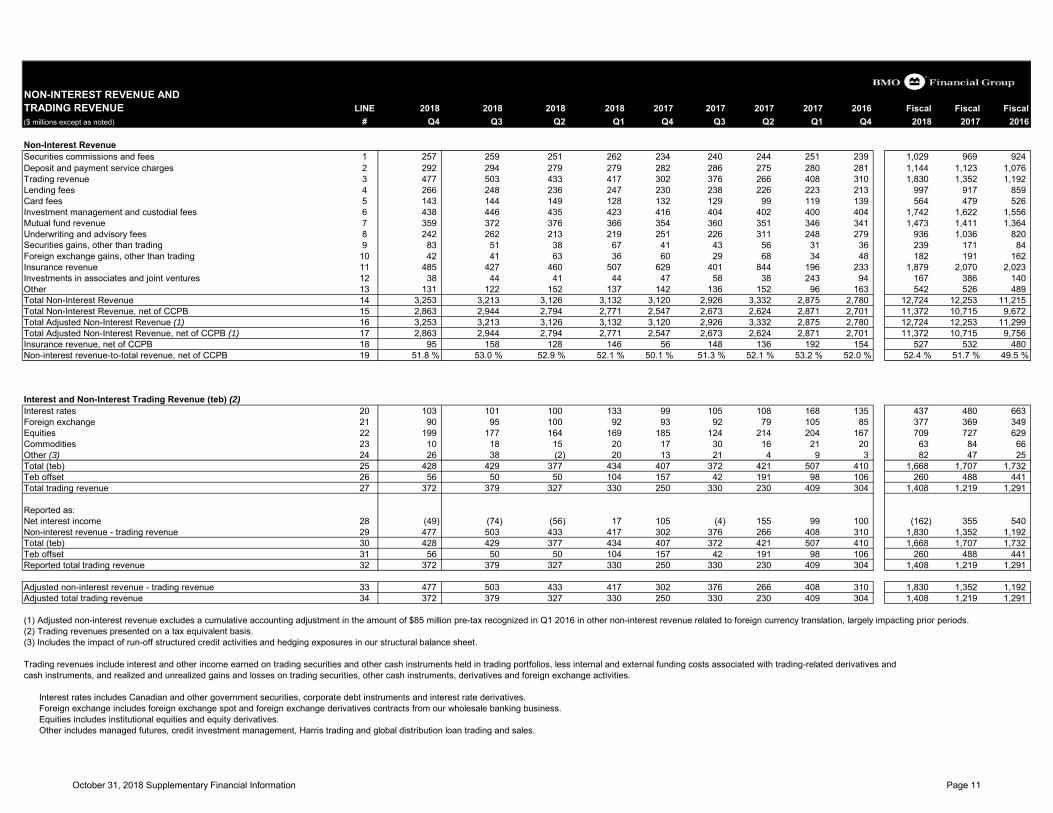
NON-INTEREST REVENUE ANDTRADING REVENUE LINE 2018 2018 2018 2018 2017 2017 2017 2017 2016 Fiscal Fiscal Fiscal($ millions except as noted) # Q4 Q3 Q2 Q1 Q4 Q3 Q2 Q1 Q4 2018 2017 2016
Non-Interest RevenueSecurities commissions and fees 1 257 259 251 262 234 240 244 251 239 1,029 969 924 Deposit and payment service charges 2 292 294 279 279 282 286 275 280 281 1,144 1,123 1,076 Trading revenue 3 477 503 433 417 302 376 266 408 310 1,830 1,352 1,192 Lending fees 4 266 248 236 247 230 238 226 223 213 997 917 859 Card fees 5 143 144 149 128 132 129 99 119 139 564 479 526 Investment management and custodial fees 6 438 446 435 423 416 404 402 400 404 1,742 1,622 1,556 Mutual fund revenue 7 359 372 376 366 354 360 351 346 341 1,473 1,411 1,364 Underwriting and advisory fees 8 242 262 213 219 251 226 311 248 279 936 1,036 820 Securities gains, other than trading 9 83 51 38 67 41 43 56 31 36 239 171 84 Foreign exchange gains, other than trading 10 42 41 63 36 60 29 68 34 48 182 191 162 Insurance revenue 11 485 427 460 507 629 401 844 196 233 1,879 2,070 2,023 Investments in associates and joint ventures 12 38 44 41 44 47 58 38 243 94 167 386 140 Other 13 131 122 152 137 142 136 152 96 163 542 526 489 Total Non-Interest Revenue 14 3,253 3,213 3,126 3,132 3,120 2,926 3,332 2,875 2,780 12,724 12,253 11,215 Total Non-Interest Revenue, net of CCPB 15 2,863 2,944 2,794 2,771 2,547 2,673 2,624 2,871 2,701 11,372 10,715 9,672 Total Adjusted Non-Interest Revenue (1) 16 3,253 3,213 3,126 3,132 3,120 2,926 3,332 2,875 2,780 12,724 12,253 11,299 Total Adjusted Non-Interest Revenue, net of CCPB (1) 17 2,863 2,944 2,794 2,771 2,547 2,673 2,624 2,871 2,701 11,372 10,715 9,756 Insurance revenue, net of CCPB 18 95 158 128 146 56 148 136 192 154 527 532 480 Non-interest revenue-to-total revenue, net of CCPB 19 51.8 % 53.0 % 52.9 % 52.1 % 50.1 % 51.3 % 52.1 % 53.2 % 52.0 % 52.4 % 51.7 % 49.5 %
Interest and Non-Interest Trading Revenue (teb) (2)Interest rates 20 103 101 100 133 99 105 108 168 135 437 480 663 Foreign exchange 21 90 95 100 92 93 92 79 105 85 377 369 349 Equities 22 199 177 164 169 185 124 214 204 167 709 727 629 Commodities 23 10 18 15 20 17 30 16 21 20 63 84 66 Other (3) 24 26 38 (2) 20 13 21 4 9 3 82 47 25 Total (teb) 25 428 429 377 434 407 372 421 507 410 1,668 1,707 1,732 Teb offset 26 56 50 50 104 157 42 191 98 106 260 488 441 Total trading revenue 27 372 379 327 330 250 330 230 409 304 1,408 1,219 1,291
Reported as:Net interest income 28 (49) (74) (56) 17 105 (4) 155 99 100 (162) 355 540 Non-interest revenue - trading revenue 29 477 503 433 417 302 376 266 408 310 1,830 1,352 1,192 Total (teb) 30 428 429 377 434 407 372 421 507 410 1,668 1,707 1,732 Teb offset 31 56 50 50 104 157 42 191 98 106 260 488 441 Reported total trading revenue 32 372 379 327 330 250 330 230 409 304 1,408 1,219 1,291
Adjusted non-interest revenue - trading revenue 33 477 503 433 417 302 376 266 408 310 1,830 1,352 1,192 Adjusted total trading revenue 34 372 379 327 330 250 330 230 409 304 1,408 1,219 1,291
(1) Adjusted non-interest revenue excludes a cumulative accounting adjustment in the amount of $85 million pre-tax recognized in Q1 2016 in other non-interest revenue related to foreign currency translation, largely impacting prior periods.(2) Trading revenues presented on a tax equivalent basis.(3) Includes the impact of run-off structured credit activities and hedging exposures in our structural balance sheet.
Trading revenues include interest and other income earned on trading securities and other cash instruments held in trading portfolios, less internal and external funding costs associated with trading-related derivatives and cash instruments, and realized and unrealized gains and losses on trading securities, other cash instruments, derivatives and foreign exchange activities.
Interest rates includes Canadian and other government securities, corporate debt instruments and interest rate derivatives. Foreign exchange includes foreign exchange spot and foreign exchange derivatives contracts from our wholesale banking business. Equities includes institutional equities and equity derivatives. Other includes managed futures, credit investment management, Harris trading and global distribution loan trading and sales.
October 31, 2018 Supplementary Financial Information Page 11
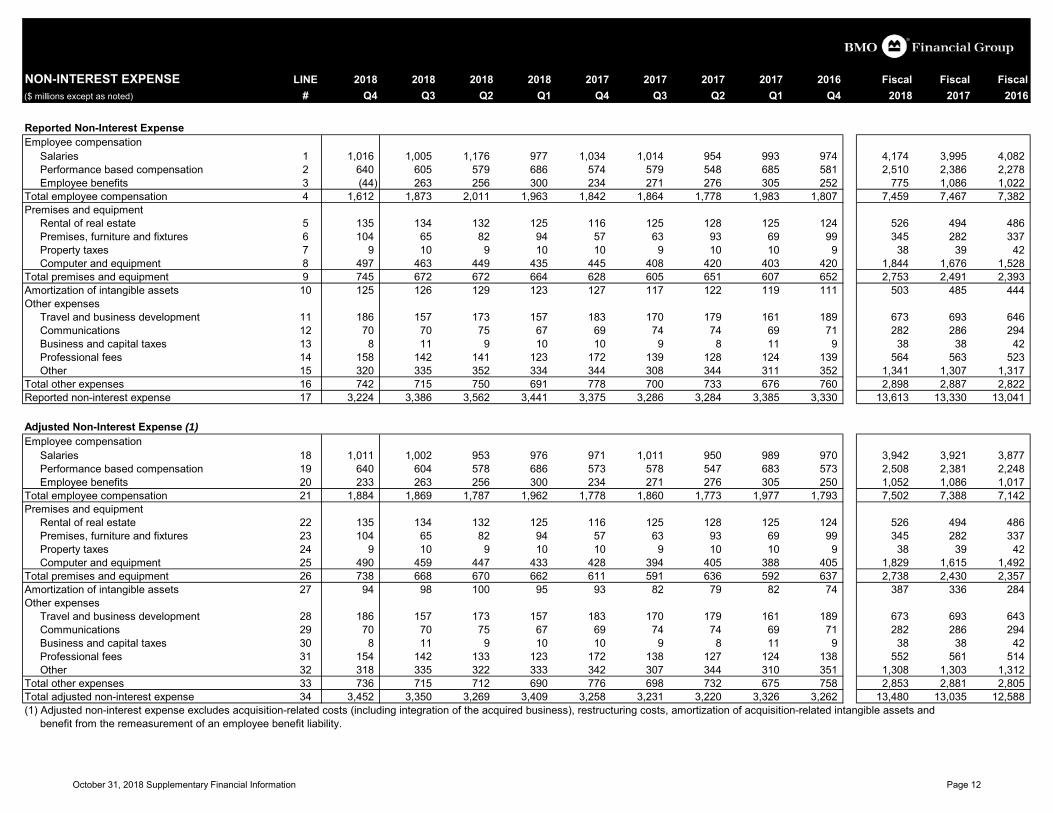
NON-INTEREST EXPENSE LINE 2018 2018 2018 2018 2017 2017 2017 2017 2016 Fiscal Fiscal Fiscal($ millions except as noted) # Q4 Q3 Q2 Q1 Q4 Q3 Q2 Q1 Q4 2018 2017 2016
Reported Non-Interest ExpenseEmployee compensation
Salaries 1 1,016 1,005 1,176 977 1,034 1,014 954 993 974 4,174 3,995 4,082 Performance based compensation 2 640 605 579 686 574 579 548 685 581 2,510 2,386 2,278 Employee benefits 3 (44) 263 256 300 234 271 276 305 252 775 1,086 1,022
Total employee compensation 4 1,612 1,873 2,011 1,963 1,842 1,864 1,778 1,983 1,807 7,459 7,467 7,382 Premises and equipment
Rental of real estate 5 135 134 132 125 116 125 128 125 124 526 494 486 Premises, furniture and fixtures 6 104 65 82 94 57 63 93 69 99 345 282 337 Property taxes 7 9 10 9 10 10 9 10 10 9 38 39 42 Computer and equipment 8 497 463 449 435 445 408 420 403 420 1,844 1,676 1,528
Total premises and equipment 9 745 672 672 664 628 605 651 607 652 2,753 2,491 2,393 Amortization of intangible assets 10 125 126 129 123 127 117 122 119 111 503 485 444 Other expenses
Travel and business development 11 186 157 173 157 183 170 179 161 189 673 693 646 Communications 12 70 70 75 67 69 74 74 69 71 282 286 294 Business and capital taxes 13 8 11 9 10 10 9 8 11 9 38 38 42 Professional fees 14 158 142 141 123 172 139 128 124 139 564 563 523 Other 15 320 335 352 334 344 308 344 311 352 1,341 1,307 1,317
Total other expenses 16 742 715 750 691 778 700 733 676 760 2,898 2,887 2,822 Reported non-interest expense 17 3,224 3,386 3,562 3,441 3,375 3,286 3,284 3,385 3,330 13,613 13,330 13,041
Adjusted Non-Interest Expense (1)Employee compensation
Salaries 18 1,011 1,002 953 976 971 1,011 950 989 970 3,942 3,921 3,877 Performance based compensation 19 640 604 578 686 573 578 547 683 573 2,508 2,381 2,248 Employee benefits 20 233 263 256 300 234 271 276 305 250 1,052 1,086 1,017
Total employee compensation 21 1,884 1,869 1,787 1,962 1,778 1,860 1,773 1,977 1,793 7,502 7,388 7,142 Premises and equipment
Rental of real estate 22 135 134 132 125 116 125 128 125 124 526 494 486 Premises, furniture and fixtures 23 104 65 82 94 57 63 93 69 99 345 282 337 Property taxes 24 9 10 9 10 10 9 10 10 9 38 39 42 Computer and equipment 25 490 459 447 433 428 394 405 388 405 1,829 1,615 1,492
Total premises and equipment 26 738 668 670 662 611 591 636 592 637 2,738 2,430 2,357 Amortization of intangible assets 27 94 98 100 95 93 82 79 82 74 387 336 284 Other expenses
Travel and business development 28 186 157 173 157 183 170 179 161 189 673 693 643 Communications 29 70 70 75 67 69 74 74 69 71 282 286 294 Business and capital taxes 30 8 11 9 10 10 9 8 11 9 38 38 42 Professional fees 31 154 142 133 123 172 138 127 124 138 552 561 514 Other 32 318 335 322 333 342 307 344 310 351 1,308 1,303 1,312
Total other expenses 33 736 715 712 690 776 698 732 675 758 2,853 2,881 2,805 Total adjusted non-interest expense 34 3,452 3,350 3,269 3,409 3,258 3,231 3,220 3,326 3,262 13,480 13,035 12,588 (1) Adjusted non-interest expense excludes acquisition-related costs (including integration of the acquired business), restructuring costs, amortization of acquisition-related intangible assets and benefit from the remeasurement of an employee benefit liability.
October 31, 2018 Supplementary Financial Information Page 12
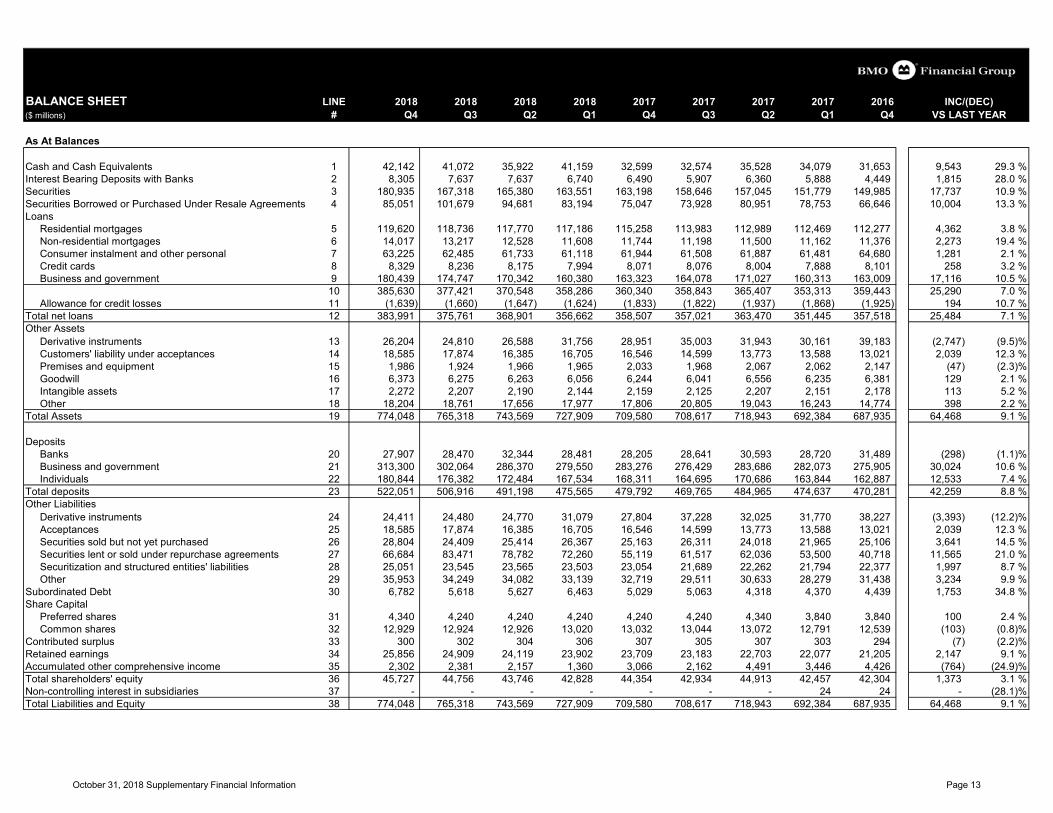
BALANCE SHEET LINE 2018 2018 2018 2018 2017 2017 2017 2017 2016($ millions) # Q4 Q3 Q2 Q1 Q4 Q3 Q2 Q1 Q4 VS LAST YEAR
As At Balances
Cash and Cash Equivalents 1 42,142 41,072 35,922 41,159 32,599 32,574 35,528 34,079 31,653 9,543 29.3 %Interest Bearing Deposits with Banks 2 8,305 7,637 7,637 6,740 6,490 5,907 6,360 5,888 4,449 1,815 28.0 %Securities 3 180,935 167,318 165,380 163,551 163,198 158,646 157,045 151,779 149,985 17,737 10.9 %Securities Borrowed or Purchased Under Resale Agreements 4 85,051 101,679 94,681 83,194 75,047 73,928 80,951 78,753 66,646 10,004 13.3 %Loans
Residential mortgages 5 119,620 118,736 117,770 117,186 115,258 113,983 112,989 112,469 112,277 4,362 3.8 %Non-residential mortgages 6 14,017 13,217 12,528 11,608 11,744 11,198 11,500 11,162 11,376 2,273 19.4 %Consumer instalment and other personal 7 63,225 62,485 61,733 61,118 61,944 61,508 61,887 61,481 64,680 1,281 2.1 %Credit cards 8 8,329 8,236 8,175 7,994 8,071 8,076 8,004 7,888 8,101 258 3.2 %Business and government 9 180,439 174,747 170,342 160,380 163,323 164,078 171,027 160,313 163,009 17,116 10.5 %
10 385,630 377,421 370,548 358,286 360,340 358,843 365,407 353,313 359,443 25,290 7.0 %Allowance for credit losses 11 (1,639) (1,660) (1,647) (1,624) (1,833) (1,822) (1,937) (1,868) (1,925) 194 10.7 %
Total net loans 12 383,991 375,761 368,901 356,662 358,507 357,021 363,470 351,445 357,518 25,484 7.1 %Other Assets
Derivative instruments 13 26,204 24,810 26,588 31,756 28,951 35,003 31,943 30,161 39,183 (2,747) (9.5)%Customers' liability under acceptances 14 18,585 17,874 16,385 16,705 16,546 14,599 13,773 13,588 13,021 2,039 12.3 %Premises and equipment 15 1,986 1,924 1,966 1,965 2,033 1,968 2,067 2,062 2,147 (47) (2.3)%Goodwill 16 6,373 6,275 6,263 6,056 6,244 6,041 6,556 6,235 6,381 129 2.1 %Intangible assets 17 2,272 2,207 2,190 2,144 2,159 2,125 2,207 2,151 2,178 113 5.2 %Other 18 18,204 18,761 17,656 17,977 17,806 20,805 19,043 16,243 14,774 398 2.2 %
Total Assets 19 774,048 765,318 743,569 727,909 709,580 708,617 718,943 692,384 687,935 64,468 9.1 %
Deposits Banks 20 27,907 28,470 32,344 28,481 28,205 28,641 30,593 28,720 31,489 (298) (1.1)%Business and government 21 313,300 302,064 286,370 279,550 283,276 276,429 283,686 282,073 275,905 30,024 10.6 %Individuals 22 180,844 176,382 172,484 167,534 168,311 164,695 170,686 163,844 162,887 12,533 7.4 %
Total deposits 23 522,051 506,916 491,198 475,565 479,792 469,765 484,965 474,637 470,281 42,259 8.8 %Other Liabilities
Derivative instruments 24 24,411 24,480 24,770 31,079 27,804 37,228 32,025 31,770 38,227 (3,393) (12.2)%Acceptances 25 18,585 17,874 16,385 16,705 16,546 14,599 13,773 13,588 13,021 2,039 12.3 %Securities sold but not yet purchased 26 28,804 24,409 25,414 26,367 25,163 26,311 24,018 21,965 25,106 3,641 14.5 %Securities lent or sold under repurchase agreements 27 66,684 83,471 78,782 72,260 55,119 61,517 62,036 53,500 40,718 11,565 21.0 %Securitization and structured entities' liabilities 28 25,051 23,545 23,565 23,503 23,054 21,689 22,262 21,794 22,377 1,997 8.7 %Other 29 35,953 34,249 34,082 33,139 32,719 29,511 30,633 28,279 31,438 3,234 9.9 %
Subordinated Debt 30 6,782 5,618 5,627 6,463 5,029 5,063 4,318 4,370 4,439 1,753 34.8 %Share Capital
Preferred shares 31 4,340 4,240 4,240 4,240 4,240 4,240 4,340 3,840 3,840 100 2.4 %Common shares 32 12,929 12,924 12,926 13,020 13,032 13,044 13,072 12,791 12,539 (103) (0.8)%
Contributed surplus 33 300 302 304 306 307 305 307 303 294 (7) (2.2)%Retained earnings 34 25,856 24,909 24,119 23,902 23,709 23,183 22,703 22,077 21,205 2,147 9.1 %Accumulated other comprehensive income 35 2,302 2,381 2,157 1,360 3,066 2,162 4,491 3,446 4,426 (764) (24.9)%Total shareholders' equity 36 45,727 44,756 43,746 42,828 44,354 42,934 44,913 42,457 42,304 1,373 3.1 %Non-controlling interest in subsidiaries 37 - - - - - - - 24 24 - (28.1)%Total Liabilities and Equity 38 774,048 765,318 743,569 727,909 709,580 708,617 718,943 692,384 687,935 64,468 9.1 %
INC/(DEC)
October 31, 2018 Supplementary Financial Information Page 13
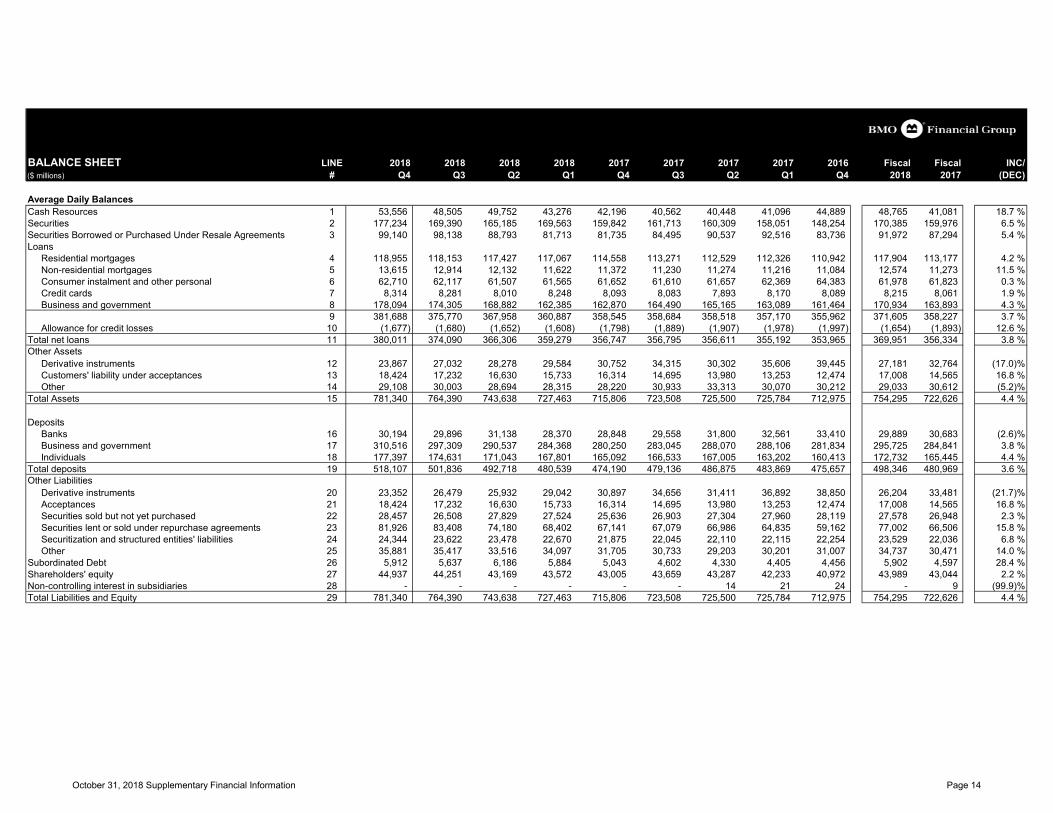
BALANCE SHEET LINE 2018 2018 2018 2018 2017 2017 2017 2017 2016 Fiscal Fiscal INC/($ millions) # Q4 Q3 Q2 Q1 Q4 Q3 Q2 Q1 Q4 2018 2017 (DEC)
Average Daily BalancesCash Resources 1 53,556 48,505 49,752 43,276 42,196 40,562 40,448 41,096 44,889 48,765 41,081 18.7 %Securities 2 177,234 169,390 165,185 169,563 159,842 161,713 160,309 158,051 148,254 170,385 159,976 6.5 %Securities Borrowed or Purchased Under Resale Agreements 3 99,140 98,138 88,793 81,713 81,735 84,495 90,537 92,516 83,736 91,972 87,294 5.4 %Loans
Residential mortgages 4 118,955 118,153 117,427 117,067 114,558 113,271 112,529 112,326 110,942 117,904 113,177 4.2 %Non-residential mortgages 5 13,615 12,914 12,132 11,622 11,372 11,230 11,274 11,216 11,084 12,574 11,273 11.5 %Consumer instalment and other personal 6 62,710 62,117 61,507 61,565 61,652 61,610 61,657 62,369 64,383 61,978 61,823 0.3 %Credit cards 7 8,314 8,281 8,010 8,248 8,093 8,083 7,893 8,170 8,089 8,215 8,061 1.9 %Business and government 8 178,094 174,305 168,882 162,385 162,870 164,490 165,165 163,089 161,464 170,934 163,893 4.3 %
9 381,688 375,770 367,958 360,887 358,545 358,684 358,518 357,170 355,962 371,605 358,227 3.7 %Allowance for credit losses 10 (1,677) (1,680) (1,652) (1,608) (1,798) (1,889) (1,907) (1,978) (1,997) (1,654) (1,893) 12.6 %
Total net loans 11 380,011 374,090 366,306 359,279 356,747 356,795 356,611 355,192 353,965 369,951 356,334 3.8 %Other Assets
Derivative instruments 12 23,867 27,032 28,278 29,584 30,752 34,315 30,302 35,606 39,445 27,181 32,764 (17.0)%Customers' liability under acceptances 13 18,424 17,232 16,630 15,733 16,314 14,695 13,980 13,253 12,474 17,008 14,565 16.8 %Other 14 29,108 30,003 28,694 28,315 28,220 30,933 33,313 30,070 30,212 29,033 30,612 (5.2)%
Total Assets 15 781,340 764,390 743,638 727,463 715,806 723,508 725,500 725,784 712,975 754,295 722,626 4.4 %
Deposits Banks 16 30,194 29,896 31,138 28,370 28,848 29,558 31,800 32,561 33,410 29,889 30,683 (2.6)%Business and government 17 310,516 297,309 290,537 284,368 280,250 283,045 288,070 288,106 281,834 295,725 284,841 3.8 %Individuals 18 177,397 174,631 171,043 167,801 165,092 166,533 167,005 163,202 160,413 172,732 165,445 4.4 %
Total deposits 19 518,107 501,836 492,718 480,539 474,190 479,136 486,875 483,869 475,657 498,346 480,969 3.6 %Other Liabilities
Derivative instruments 20 23,352 26,479 25,932 29,042 30,897 34,656 31,411 36,892 38,850 26,204 33,481 (21.7)%Acceptances 21 18,424 17,232 16,630 15,733 16,314 14,695 13,980 13,253 12,474 17,008 14,565 16.8 %Securities sold but not yet purchased 22 28,457 26,508 27,829 27,524 25,636 26,903 27,304 27,960 28,119 27,578 26,948 2.3 %Securities lent or sold under repurchase agreements 23 81,926 83,408 74,180 68,402 67,141 67,079 66,986 64,835 59,162 77,002 66,506 15.8 %Securitization and structured entities' liabilities 24 24,344 23,622 23,478 22,670 21,875 22,045 22,110 22,115 22,254 23,529 22,036 6.8 %Other 25 35,881 35,417 33,516 34,097 31,705 30,733 29,203 30,201 31,007 34,737 30,471 14.0 %
Subordinated Debt 26 5,912 5,637 6,186 5,884 5,043 4,602 4,330 4,405 4,456 5,902 4,597 28.4 %Shareholders' equity 27 44,937 44,251 43,169 43,572 43,005 43,659 43,287 42,233 40,972 43,989 43,044 2.2 %Non-controlling interest in subsidiaries 28 - - - - - - 14 21 24 - 9 (99.9)%Total Liabilities and Equity 29 781,340 764,390 743,638 727,463 715,806 723,508 725,500 725,784 712,975 754,295 722,626 4.4 %
October 31, 2018 Supplementary Financial Information Page 14
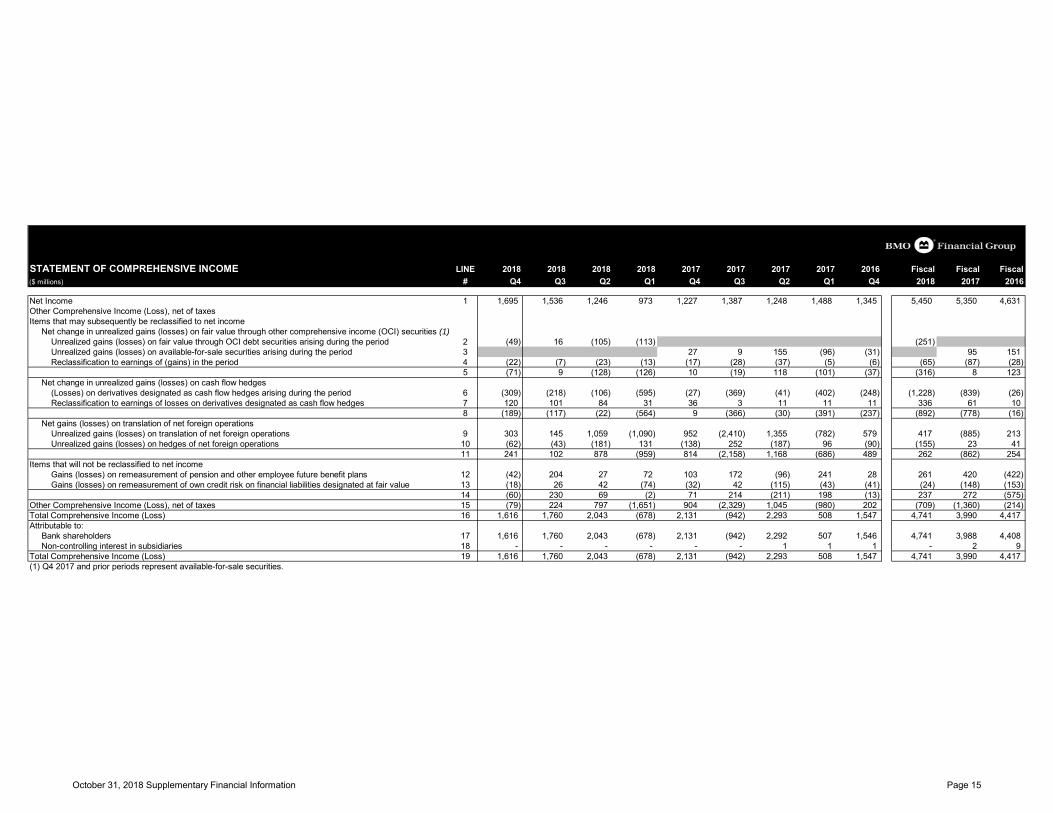
STATEMENT OF COMPREHENSIVE INCOME LINE 2018 2018 2018 2018 2017 2017 2017 2017 2016 Fiscal Fiscal Fiscal($ millions) # Q4 Q3 Q2 Q1 Q4 Q3 Q2 Q1 Q4 2018 2017 2016
Net Income 1 1,695 1,536 1,246 973 1,227 1,387 1,248 1,488 1,345 5,450 5,350 4,631 Other Comprehensive Income (Loss), net of taxesItems that may subsequently be reclassified to net income
Net change in unrealized gains (losses) on fair value through other comprehensive income (OCI) securities (1) Unrealized gains (losses) on fair value through OCI debt securities arising during the period 2 (49) 16 (105) (113) (251) Unrealized gains (losses) on available-for-sale securities arising during the period 3 27 9 155 (96) (31) 95 151 Reclassification to earnings of (gains) in the period 4 (22) (7) (23) (13) (17) (28) (37) (5) (6) (65) (87) (28)
5 (71) 9 (128) (126) 10 (19) 118 (101) (37) (316) 8 123 Net change in unrealized gains (losses) on cash flow hedges (Losses) on derivatives designated as cash flow hedges arising during the period 6 (309) (218) (106) (595) (27) (369) (41) (402) (248) (1,228) (839) (26) Reclassification to earnings of losses on derivatives designated as cash flow hedges 7 120 101 84 31 36 3 11 11 11 336 61 10
8 (189) (117) (22) (564) 9 (366) (30) (391) (237) (892) (778) (16) Net gains (losses) on translation of net foreign operations Unrealized gains (losses) on translation of net foreign operations 9 303 145 1,059 (1,090) 952 (2,410) 1,355 (782) 579 417 (885) 213 Unrealized gains (losses) on hedges of net foreign operations 10 (62) (43) (181) 131 (138) 252 (187) 96 (90) (155) 23 41
11 241 102 878 (959) 814 (2,158) 1,168 (686) 489 262 (862) 254 Items that will not be reclassified to net income
Gains (losses) on remeasurement of pension and other employee future benefit plans 12 (42) 204 27 72 103 172 (96) 241 28 261 420 (422) Gains (losses) on remeasurement of own credit risk on financial liabilities designated at fair value 13 (18) 26 42 (74) (32) 42 (115) (43) (41) (24) (148) (153)
14 (60) 230 69 (2) 71 214 (211) 198 (13) 237 272 (575) Other Comprehensive Income (Loss), net of taxes 15 (79) 224 797 (1,651) 904 (2,329) 1,045 (980) 202 (709) (1,360) (214) Total Comprehensive Income (Loss) 16 1,616 1,760 2,043 (678) 2,131 (942) 2,293 508 1,547 4,741 3,990 4,417 Attributable to:
Bank shareholders 17 1,616 1,760 2,043 (678) 2,131 (942) 2,292 507 1,546 4,741 3,988 4,408 Non-controlling interest in subsidiaries 18 - - - - - - 1 1 1 - 2 9
Total Comprehensive Income (Loss) 19 1,616 1,760 2,043 (678) 2,131 (942) 2,293 508 1,547 4,741 3,990 4,417 (1) Q4 2017 and prior periods represent available-for-sale securities.
October 31, 2018 Supplementary Financial Information Page 15
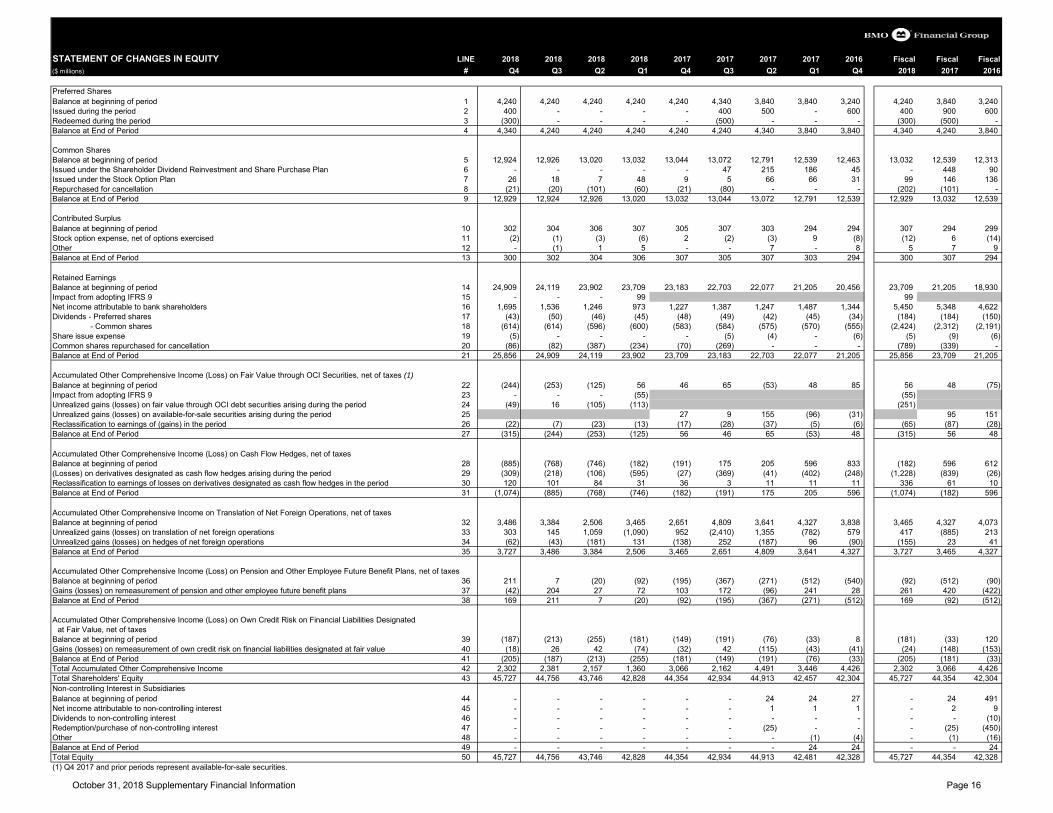
STATEMENT OF CHANGES IN EQUITY LINE 2018 2018 2018 2018 2017 2017 2017 2017 2016 Fiscal Fiscal Fiscal($ millions) # Q4 Q3 Q2 Q1 Q4 Q3 Q2 Q1 Q4 2018 2017 2016
Preferred SharesBalance at beginning of period 1 4,240 4,240 4,240 4,240 4,240 4,340 3,840 3,840 3,240 4,240 3,840 3,240 Issued during the period 2 400 - - - - 400 500 - 600 400 900 600 Redeemed during the period 3 (300) - - - - (500) - - - (300) (500) - Balance at End of Period 4 4,340 4,240 4,240 4,240 4,240 4,240 4,340 3,840 3,840 4,340 4,240 3,840
Common SharesBalance at beginning of period 5 12,924 12,926 13,020 13,032 13,044 13,072 12,791 12,539 12,463 13,032 12,539 12,313 Issued under the Shareholder Dividend Reinvestment and Share Purchase Plan 6 - - - - - 47 215 186 45 - 448 90 Issued under the Stock Option Plan 7 26 18 7 48 9 5 66 66 31 99 146 136 Repurchased for cancellation 8 (21) (20) (101) (60) (21) (80) - - - (202) (101) - Balance at End of Period 9 12,929 12,924 12,926 13,020 13,032 13,044 13,072 12,791 12,539 12,929 13,032 12,539
Contributed SurplusBalance at beginning of period 10 302 304 306 307 305 307 303 294 294 307 294 299 Stock option expense, net of options exercised 11 (2) (1) (3) (6) 2 (2) (3) 9 (8) (12) 6 (14) Other 12 - (1) 1 5 - - 7 - 8 5 7 9 Balance at End of Period 13 300 302 304 306 307 305 307 303 294 300 307 294
Retained EarningsBalance at beginning of period 14 24,909 24,119 23,902 23,709 23,183 22,703 22,077 21,205 20,456 23,709 21,205 18,930 Impact from adopting IFRS 9 15 - - - 99 99 Net income attributable to bank shareholders 16 1,695 1,536 1,246 973 1,227 1,387 1,247 1,487 1,344 5,450 5,348 4,622 Dividends - Preferred shares 17 (43) (50) (46) (45) (48) (49) (42) (45) (34) (184) (184) (150) - Common shares 18 (614) (614) (596) (600) (583) (584) (575) (570) (555) (2,424) (2,312) (2,191) Share issue expense 19 (5) - - - - (5) (4) - (6) (5) (9) (6) Common shares repurchased for cancellation 20 (86) (82) (387) (234) (70) (269) - - - (789) (339) - Balance at End of Period 21 25,856 24,909 24,119 23,902 23,709 23,183 22,703 22,077 21,205 25,856 23,709 21,205
Accumulated Other Comprehensive Income (Loss) on Fair Value through OCI Securities, net of taxes (1)Balance at beginning of period 22 (244) (253) (125) 56 46 65 (53) 48 85 56 48 (75) Impact from adopting IFRS 9 23 - - - (55) (55) Unrealized gains (losses) on fair value through OCI debt securities arising during the period 24 (49) 16 (105) (113) (251) Unrealized gains (losses) on available-for-sale securities arising during the period 25 27 9 155 (96) (31) 95 151 Reclassification to earnings of (gains) in the period 26 (22) (7) (23) (13) (17) (28) (37) (5) (6) (65) (87) (28) Balance at End of Period 27 (315) (244) (253) (125) 56 46 65 (53) 48 (315) 56 48
Accumulated Other Comprehensive Income (Loss) on Cash Flow Hedges, net of taxesBalance at beginning of period 28 (885) (768) (746) (182) (191) 175 205 596 833 (182) 596 612 (Losses) on derivatives designated as cash flow hedges arising during the period 29 (309) (218) (106) (595) (27) (369) (41) (402) (248) (1,228) (839) (26) Reclassification to earnings of losses on derivatives designated as cash flow hedges in the period 30 120 101 84 31 36 3 11 11 11 336 61 10 Balance at End of Period 31 (1,074) (885) (768) (746) (182) (191) 175 205 596 (1,074) (182) 596
Accumulated Other Comprehensive Income on Translation of Net Foreign Operations, net of taxesBalance at beginning of period 32 3,486 3,384 2,506 3,465 2,651 4,809 3,641 4,327 3,838 3,465 4,327 4,073 Unrealized gains (losses) on translation of net foreign operations 33 303 145 1,059 (1,090) 952 (2,410) 1,355 (782) 579 417 (885) 213 Unrealized gains (losses) on hedges of net foreign operations 34 (62) (43) (181) 131 (138) 252 (187) 96 (90) (155) 23 41 Balance at End of Period 35 3,727 3,486 3,384 2,506 3,465 2,651 4,809 3,641 4,327 3,727 3,465 4,327
Accumulated Other Comprehensive Income (Loss) on Pension and Other Employee Future Benefit Plans, net of taxesBalance at beginning of period 36 211 7 (20) (92) (195) (367) (271) (512) (540) (92) (512) (90) Gains (losses) on remeasurement of pension and other employee future benefit plans 37 (42) 204 27 72 103 172 (96) 241 28 261 420 (422) Balance at End of Period 38 169 211 7 (20) (92) (195) (367) (271) (512) 169 (92) (512)
Accumulated Other Comprehensive Income (Loss) on Own Credit Risk on Financial Liabilities Designatedat Fair Value, net of taxes
Balance at beginning of period 39 (187) (213) (255) (181) (149) (191) (76) (33) 8 (181) (33) 120 Gains (losses) on remeasurement of own credit risk on financial liabilities designated at fair value 40 (18) 26 42 (74) (32) 42 (115) (43) (41) (24) (148) (153) Balance at End of Period 41 (205) (187) (213) (255) (181) (149) (191) (76) (33) (205) (181) (33) Total Accumulated Other Comprehensive Income 42 2,302 2,381 2,157 1,360 3,066 2,162 4,491 3,446 4,426 2,302 3,066 4,426 Total Shareholders' Equity 43 45,727 44,756 43,746 42,828 44,354 42,934 44,913 42,457 42,304 45,727 44,354 42,304 Non-controlling Interest in SubsidiariesBalance at beginning of period 44 - - - - - - 24 24 27 - 24 491 Net income attributable to non-controlling interest 45 - - - - - - 1 1 1 - 2 9 Dividends to non-controlling interest 46 - - - - - - - - - - - (10) Redemption/purchase of non-controlling interest 47 - - - - - - (25) - - - (25) (450) Other 48 - - - - - - - (1) (4) - (1) (16) Balance at End of Period 49 - - - - - - - 24 24 - - 24 Total Equity 50 45,727 44,756 43,746 42,828 44,354 42,934 44,913 42,481 42,328 45,727 44,354 42,328 (1) Q4 2017 and prior periods represent available-for-sale securities.
October 31, 2018 Supplementary Financial Information Page 16
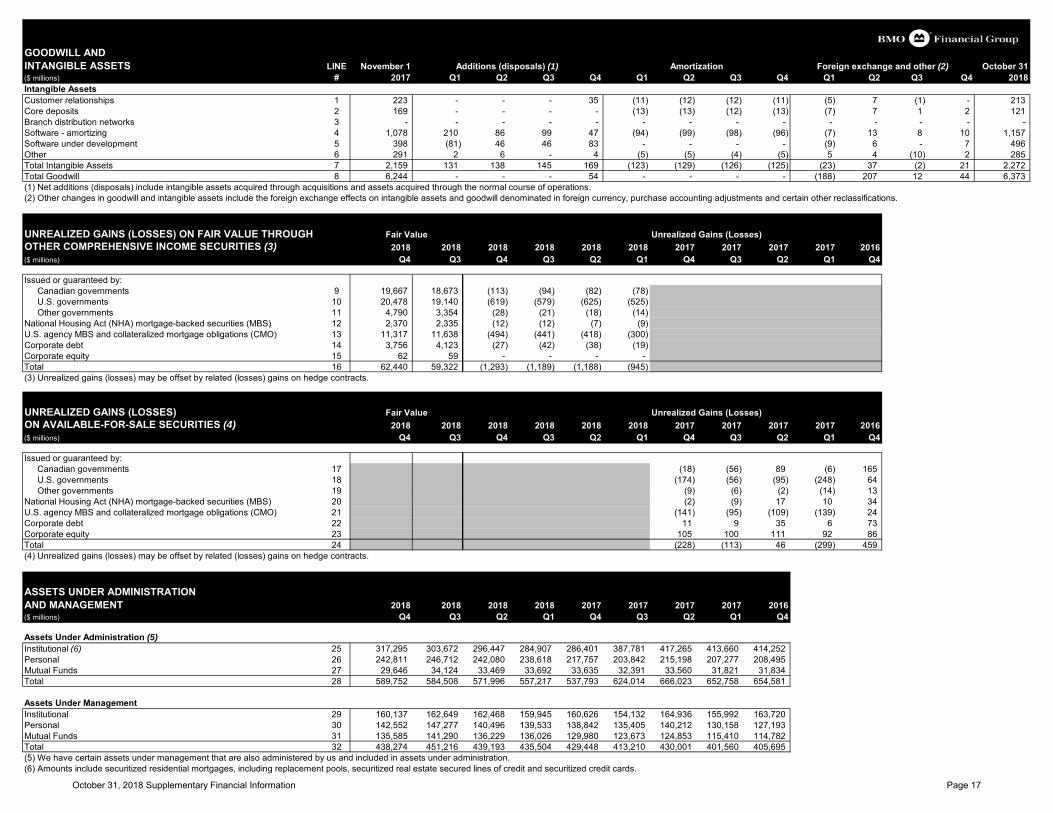
GOODWILL AND INTANGIBLE ASSETS LINE November 1 October 31($ millions) # 2017 Q1 Q2 Q3 Q4 Q1 Q2 Q3 Q4 Q1 Q2 Q3 Q4 2018Intangible Assets Customer relationships 1 223 - - - 35 (11) (12) (12) (11) (5) 7 (1) - 213 Core deposits 2 169 - - - - (13) (13) (12) (13) (7) 7 1 2 121 Branch distribution networks 3 - - - - - - - - - - - - - - Software - amortizing 4 1,078 210 86 99 47 (94) (99) (98) (96) (7) 13 8 10 1,157 Software under development 5 398 (81) 46 46 83 - - - - (9) 6 - 7 496 Other 6 291 2 6 - 4 (5) (5) (4) (5) 5 4 (10) 2 285 Total Intangible Assets 7 2,159 131 138 145 169 (123) (129) (126) (125) (23) 37 (2) 21 2,272 Total Goodwill 8 6,244 - - - 54 - - - - (188) 207 12 44 6,373 (1) Net additions (disposals) include intangible assets acquired through acquisitions and assets acquired through the normal course of operations.(2) Other changes in goodwill and intangible assets include the foreign exchange effects on intangible assets and goodwill denominated in foreign currency, purchase accounting adjustments and certain other reclassifications.
UNREALIZED GAINS (LOSSES) ON FAIR VALUE THROUGH Unrealized Gains (Losses)OTHER COMPREHENSIVE INCOME SECURITIES (3) 2018 2018 2018 2018 2018 2018 2017 2017 2017 2017 2016($ millions) Q4 Q3 Q4 Q3 Q2 Q1 Q4 Q3 Q2 Q1 Q4
Issued or guaranteed by:Canadian governments 9 19,667 18,673 (113) (94) (82) (78) U.S. governments 10 20,478 19,140 (619) (579) (625) (525) Other governments 11 4,790 3,354 (28) (21) (18) (14)
National Housing Act (NHA) mortgage-backed securities (MBS) 12 2,370 2,335 (12) (12) (7) (9) U.S. agency MBS and collateralized mortgage obligations (CMO) 13 11,317 11,638 (494) (441) (418) (300) Corporate debt 14 3,756 4,123 (27) (42) (38) (19) Corporate equity 15 62 59 - - - - Total 16 62,440 59,322 (1,293) (1,189) (1,188) (945) (3) Unrealized gains (losses) may be offset by related (losses) gains on hedge contracts.
UNREALIZED GAINS (LOSSES) Unrealized Gains (Losses)ON AVAILABLE-FOR-SALE SECURITIES (4) 2018 2018 2018 2018 2018 2018 2017 2017 2017 2017 2016($ millions) Q4 Q3 Q4 Q3 Q2 Q1 Q4 Q3 Q2 Q1 Q4
Issued or guaranteed by:Canadian governments 17 (18) (56) 89 (6) 165 U.S. governments 18 (174) (56) (95) (248) 64 Other governments 19 (9) (6) (2) (14) 13
National Housing Act (NHA) mortgage-backed securities (MBS) 20 (2) (9) 17 10 34 U.S. agency MBS and collateralized mortgage obligations (CMO) 21 (141) (95) (109) (139) 24 Corporate debt 22 11 9 35 6 73 Corporate equity 23 105 100 111 92 86 Total 24 (228) (113) 46 (299) 459 (4) Unrealized gains (losses) may be offset by related (losses) gains on hedge contracts.
ASSETS UNDER ADMINISTRATIONAND MANAGEMENT 2018 2018 2018 2018 2017 2017 2017 2017 2016($ millions) Q4 Q3 Q2 Q1 Q4 Q3 Q2 Q1 Q4
Assets Under Administration (5)Institutional (6) 25 317,295 303,672 296,447 284,907 286,401 387,781 417,265 413,660 414,252 Personal 26 242,811 246,712 242,080 238,618 217,757 203,842 215,198 207,277 208,495 Mutual Funds 27 29,646 34,124 33,469 33,692 33,635 32,391 33,560 31,821 31,834 Total 28 589,752 584,508 571,996 557,217 537,793 624,014 666,023 652,758 654,581
Assets Under ManagementInstitutional 29 160,137 162,649 162,468 159,945 160,626 154,132 164,936 155,992 163,720 Personal 30 142,552 147,277 140,496 139,533 138,842 135,405 140,212 130,158 127,193 Mutual Funds 31 135,585 141,290 136,229 136,026 129,980 123,673 124,853 115,410 114,782 Total 32 438,274 451,216 439,193 435,504 429,448 413,210 430,001 401,560 405,695 (5) We have certain assets under management that are also administered by us and included in assets under administration.(6) Amounts include securitized residential mortgages, including replacement pools, securitized real estate secured lines of credit and securitized credit cards.
Fair Value
Additions (disposals) (1) Amortization Foreign exchange and other (2)
Fair Value
October 31, 2018 Supplementary Financial Information Page 17
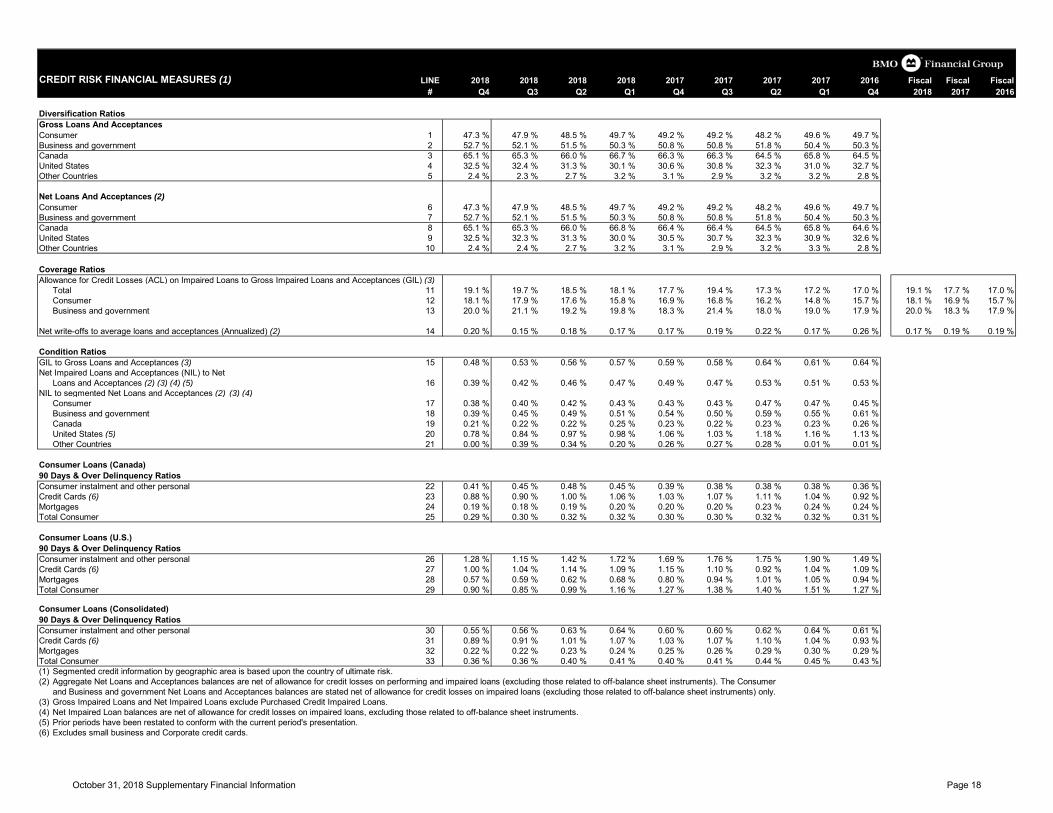
CREDIT RISK FINANCIAL MEASURES (1) LINE 2018 2018 2018 2018 2017 2017 2017 2017 2016 Fiscal Fiscal Fiscal
# Q4 Q3 Q2 Q1 Q4 Q3 Q2 Q1 Q4 2018 2017 2016
Diversification RatiosGross Loans And AcceptancesConsumer 1 47.3 % 47.9 % 48.5 % 49.7 % 49.2 % 49.2 % 48.2 % 49.6 % 49.7 %Business and government 2 52.7 % 52.1 % 51.5 % 50.3 % 50.8 % 50.8 % 51.8 % 50.4 % 50.3 %Canada 3 65.1 % 65.3 % 66.0 % 66.7 % 66.3 % 66.3 % 64.5 % 65.8 % 64.5 %United States 4 32.5 % 32.4 % 31.3 % 30.1 % 30.6 % 30.8 % 32.3 % 31.0 % 32.7 %Other Countries 5 2.4 % 2.3 % 2.7 % 3.2 % 3.1 % 2.9 % 3.2 % 3.2 % 2.8 %
Net Loans And Acceptances (2)Consumer 6 47.3 % 47.9 % 48.5 % 49.7 % 49.2 % 49.2 % 48.2 % 49.6 % 49.7 %Business and government 7 52.7 % 52.1 % 51.5 % 50.3 % 50.8 % 50.8 % 51.8 % 50.4 % 50.3 %Canada 8 65.1 % 65.3 % 66.0 % 66.8 % 66.4 % 66.4 % 64.5 % 65.8 % 64.6 %United States 9 32.5 % 32.3 % 31.3 % 30.0 % 30.5 % 30.7 % 32.3 % 30.9 % 32.6 %Other Countries 10 2.4 % 2.4 % 2.7 % 3.2 % 3.1 % 2.9 % 3.2 % 3.3 % 2.8 %
Coverage Ratios (2) Allowance for Credit Losses (ACL) on Impaired Loans to Gross Impaired Loans and Acceptances (GIL) (3)
Total 11 19.1 % 19.7 % 18.5 % 18.1 % 17.7 % 19.4 % 17.3 % 17.2 % 17.0 % 19.1 % 17.7 % 17.0 %Consumer 12 18.1 % 17.9 % 17.6 % 15.8 % 16.9 % 16.8 % 16.2 % 14.8 % 15.7 % 18.1 % 16.9 % 15.7 %Business and government 13 20.0 % 21.1 % 19.2 % 19.8 % 18.3 % 21.4 % 18.0 % 19.0 % 17.9 % 20.0 % 18.3 % 17.9 %
Net write-offs to average loans and acceptances (Annualized) (2) 14 0.20 % 0.15 % 0.18 % 0.17 % 0.17 % 0.19 % 0.22 % 0.17 % 0.26 % 0.17 % 0.19 % 0.19 %
Condition RatiosGIL to Gross Loans and Acceptances (3) 15 0.48 % 0.53 % 0.56 % 0.57 % 0.59 % 0.58 % 0.64 % 0.61 % 0.64 %Net Impaired Loans and Acceptances (NIL) to Net
Loans and Acceptances (2) (3) (4) (5) 16 0.39 % 0.42 % 0.46 % 0.47 % 0.49 % 0.47 % 0.53 % 0.51 % 0.53 %NIL to segmented Net Loans and Acceptances (2) (3) (4)
Consumer 17 0.38 % 0.40 % 0.42 % 0.43 % 0.43 % 0.43 % 0.47 % 0.47 % 0.45 %Business and government 18 0.39 % 0.45 % 0.49 % 0.51 % 0.54 % 0.50 % 0.59 % 0.55 % 0.61 %Canada 19 0.21 % 0.22 % 0.22 % 0.25 % 0.23 % 0.22 % 0.23 % 0.23 % 0.26 %United States (5) 20 0.78 % 0.84 % 0.97 % 0.98 % 1.06 % 1.03 % 1.18 % 1.16 % 1.13 %Other Countries 21 0.00 % 0.39 % 0.34 % 0.20 % 0.26 % 0.27 % 0.28 % 0.01 % 0.01 %
Consumer Loans (Canada)90 Days & Over Delinquency RatiosConsumer instalment and other personal 22 0.41 % 0.45 % 0.48 % 0.45 % 0.39 % 0.38 % 0.38 % 0.38 % 0.36 %Credit Cards (6) 23 0.88 % 0.90 % 1.00 % 1.06 % 1.03 % 1.07 % 1.11 % 1.04 % 0.92 %Mortgages 24 0.19 % 0.18 % 0.19 % 0.20 % 0.20 % 0.20 % 0.23 % 0.24 % 0.24 %Total Consumer 25 0.29 % 0.30 % 0.32 % 0.32 % 0.30 % 0.30 % 0.32 % 0.32 % 0.31 %
Consumer Loans (U.S.)90 Days & Over Delinquency Ratios Consumer instalment and other personal 26 1.28 % 1.15 % 1.42 % 1.72 % 1.69 % 1.76 % 1.75 % 1.90 % 1.49 %Credit Cards (6) 27 1.00 % 1.04 % 1.14 % 1.09 % 1.15 % 1.10 % 0.92 % 1.04 % 1.09 %Mortgages 28 0.57 % 0.59 % 0.62 % 0.68 % 0.80 % 0.94 % 1.01 % 1.05 % 0.94 %Total Consumer 29 0.90 % 0.85 % 0.99 % 1.16 % 1.27 % 1.38 % 1.40 % 1.51 % 1.27 %
Consumer Loans (Consolidated)90 Days & Over Delinquency Ratios Consumer instalment and other personal 30 0.55 % 0.56 % 0.63 % 0.64 % 0.60 % 0.60 % 0.62 % 0.64 % 0.61 %Credit Cards (6) 31 0.89 % 0.91 % 1.01 % 1.07 % 1.03 % 1.07 % 1.10 % 1.04 % 0.93 %Mortgages 32 0.22 % 0.22 % 0.23 % 0.24 % 0.25 % 0.26 % 0.29 % 0.30 % 0.29 %Total Consumer 33 0.36 % 0.36 % 0.40 % 0.41 % 0.40 % 0.41 % 0.44 % 0.45 % 0.43 %(1) Segmented credit information by geographic area is based upon the country of ultimate risk.(2) Aggregate Net Loans and Acceptances balances are net of allowance for credit losses on performing and impaired loans (excluding those related to off-balance sheet instruments). The Consumer
and Business and government Net Loans and Acceptances balances are stated net of allowance for credit losses on impaired loans (excluding those related to off-balance sheet instruments) only.(3) Gross Impaired Loans and Net Impaired Loans exclude Purchased Credit Impaired Loans.(4) Net Impaired Loan balances are net of allowance for credit losses on impaired loans, excluding those related to off-balance sheet instruments.(5) Prior periods have been restated to conform with the current period's presentation.(6) Excludes small business and Corporate credit cards.
October 31, 2018 Supplementary Financial Information Page 18
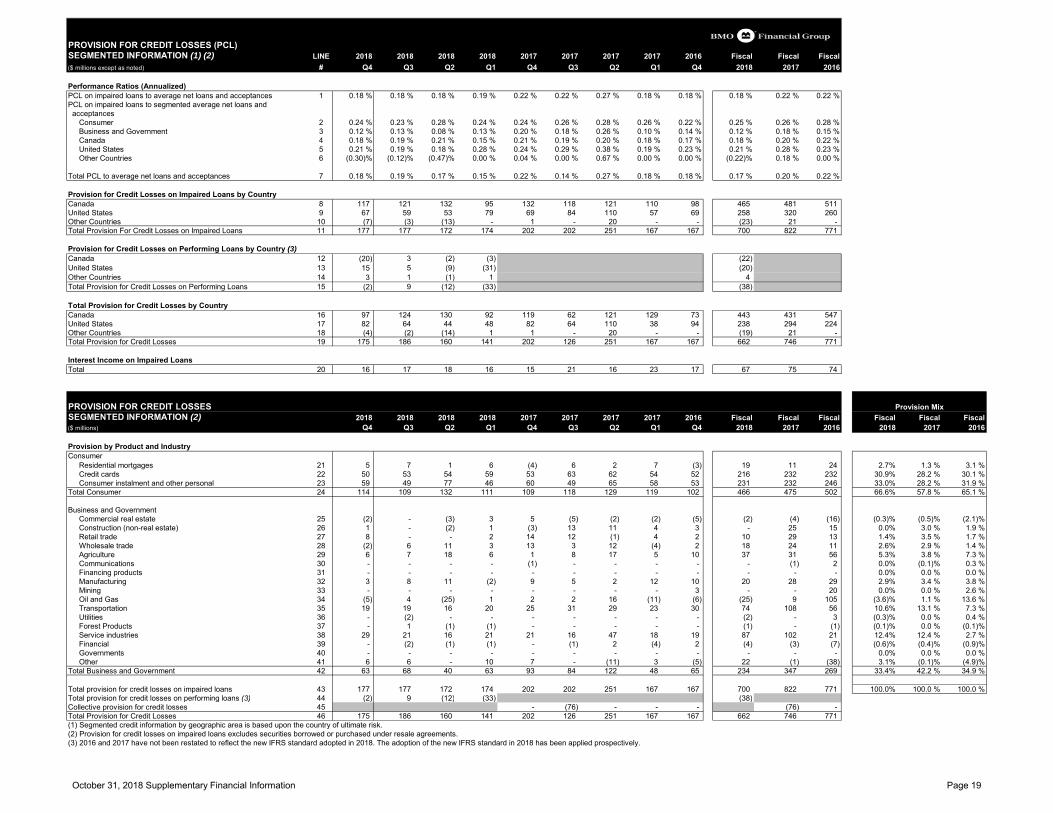
PROVISION FOR CREDIT LOSSES (PCL)SEGMENTED INFORMATION (1) (2) LINE 2018 2018 2018 2018 2017 2017 2017 2017 2016 Fiscal Fiscal Fiscal($ millions except as noted) # Q4 Q3 Q2 Q1 Q4 Q3 Q2 Q1 Q4 2018 2017 2016
Performance Ratios (Annualized) (2) 1 PCL on impaired loans to average net loans and acceptances 1 0.18 % 0.18 % 0.18 % 0.19 % 0.22 % 0.22 % 0.27 % 0.18 % 0.18 % 0.18 % 0.22 % 0.22 %PCL on impaired loans to segmented average net loans and acceptances
Consumer 2 0.24 % 0.23 % 0.28 % 0.24 % 0.24 % 0.26 % 0.28 % 0.26 % 0.22 % 0.25 % 0.26 % 0.28 %Business and Government 3 0.12 % 0.13 % 0.08 % 0.13 % 0.20 % 0.18 % 0.26 % 0.10 % 0.14 % 0.12 % 0.18 % 0.15 %Canada 4 0.18 % 0.19 % 0.21 % 0.15 % 0.21 % 0.19 % 0.20 % 0.18 % 0.17 % 0.18 % 0.20 % 0.22 %United States 5 0.21 % 0.19 % 0.18 % 0.28 % 0.24 % 0.29 % 0.38 % 0.19 % 0.23 % 0.21 % 0.28 % 0.23 %Other Countries 6 (0.30)% (0.12)% (0.47)% 0.00 % 0.04 % 0.00 % 0.67 % 0.00 % 0.00 % (0.22)% 0.18 % 0.00 %
Total PCL to average net loans and acceptances 7 0.18 % 0.19 % 0.17 % 0.15 % 0.22 % 0.14 % 0.27 % 0.18 % 0.18 % 0.17 % 0.20 % 0.22 %
Provision for Credit Losses on Impaired Loans by CountryCanada 8 117 121 132 95 132 118 121 110 98 465 481 511 United States 9 67 59 53 79 69 84 110 57 69 258 320 260 Other Countries 10 (7) (3) (13) - 1 - 20 - - (23) 21 - Total Provision For Credit Losses on Impaired Loans 11 177 177 172 174 202 202 251 167 167 700 822 771
Provision for Credit Losses on Performing Loans by Country (3)Canada 12 (20) 3 (2) (3) (22) United States 13 15 5 (9) (31) (20) Other Countries 14 3 1 (1) 1 4 Total Provision for Credit Losses on Performing Loans 15 (2) 9 (12) (33) (38)
Total Provision for Credit Losses by CountryCanada 16 97 124 130 92 119 62 121 129 73 443 431 547 United States 17 82 64 44 48 82 64 110 38 94 238 294 224 Other Countries 18 (4) (2) (14) 1 1 - 20 - - (19) 21 - Total Provision for Credit Losses 19 175 186 160 141 202 126 251 167 167 662 746 771
Interest Income on Impaired Loans Total 20 16 17 18 16 15 21 16 23 17 67 75 74
PROVISION FOR CREDIT LOSSESSEGMENTED INFORMATION (2) 2018 2018 2018 2018 2017 2017 2017 2017 2016 Fiscal Fiscal Fiscal Fiscal Fiscal Fiscal($ millions) Q4 Q3 Q2 Q1 Q4 Q3 Q2 Q1 Q4 2018 2017 2016 2018 2017 2016
Provision by Product and Industry Consumer
Residential mortgages 21 5 7 1 6 (4) 6 2 7 (3) 19 11 24 2.7% 1.3 % 3.1 %Credit cards 22 50 53 54 59 53 63 62 54 52 216 232 232 30.9% 28.2 % 30.1 %Consumer instalment and other personal 23 59 49 77 46 60 49 65 58 53 231 232 246 33.0% 28.2 % 31.9 %
Total Consumer 24 114 109 132 111 109 118 129 119 102 466 475 502 66.6% 57.8 % 65.1 %
Business and GovernmentCommercial real estate 25 (2) - (3) 3 5 (5) (2) (2) (5) (2) (4) (16) (0.3)% (0.5)% (2.1)%Construction (non-real estate) 26 1 - (2) 1 (3) 13 11 4 3 - 25 15 0.0% 3.0 % 1.9 %Retail trade 27 8 - - 2 14 12 (1) 4 2 10 29 13 1.4% 3.5 % 1.7 %Wholesale trade 28 (2) 6 11 3 13 3 12 (4) 2 18 24 11 2.6% 2.9 % 1.4 %Agriculture 29 6 7 18 6 1 8 17 5 10 37 31 56 5.3% 3.8 % 7.3 %Communications 30 - - - - (1) - - - - - (1) 2 0.0% (0.1)% 0.3 %Financing products 31 - - - - - - - - - - - - 0.0% 0.0 % 0.0 %Manufacturing 32 3 8 11 (2) 9 5 2 12 10 20 28 29 2.9% 3.4 % 3.8 %Mining 33 - - - - - - - - 3 - - 20 0.0% 0.0 % 2.6 %Oil and Gas 34 (5) 4 (25) 1 2 2 16 (11) (6) (25) 9 105 (3.6)% 1.1 % 13.6 %Transportation 35 19 19 16 20 25 31 29 23 30 74 108 56 10.6% 13.1 % 7.3 %Utilities 36 - (2) - - - - - - - (2) - 3 (0.3)% 0.0 % 0.4 %Forest Products 37 - 1 (1) (1) - - - - - (1) - (1) (0.1)% 0.0 % (0.1)%Service industries 38 29 21 16 21 21 16 47 18 19 87 102 21 12.4% 12.4 % 2.7 %Financial 39 - (2) (1) (1) - (1) 2 (4) 2 (4) (3) (7) (0.6)% (0.4)% (0.9)%Governments 40 - - - - - - - - - - - - 0.0% 0.0 % 0.0 %Other 41 6 6 - 10 7 - (11) 3 (5) 22 (1) (38) 3.1% (0.1)% (4.9)%
Total Business and Government 42 63 68 40 63 93 84 122 48 65 234 347 269 33.4% 42.2 % 34.9 %
Total provision for credit losses on impaired loans 43 177 177 172 174 202 202 251 167 167 700 822 771 100.0% 100.0 % 100.0 %Total provision for credit losses on performing loans (3) 44 (2) 9 (12) (33) (38) Collective provision for credit losses 45 - (76) - - - (76) - Total Provision for Credit Losses 46 175 186 160 141 202 126 251 167 167 662 746 771 (1) Segmented credit information by geographic area is based upon the country of ultimate risk.(2) Provision for credit losses on impaired loans excludes securities borrowed or purchased under resale agreements.(3) 2016 and 2017 have not been restated to reflect the new IFRS standard adopted in 2018. The adoption of the new IFRS standard in 2018 has been applied prospectively.
Provision Mix
October 31, 2018 Supplementary Financial Information Page 19
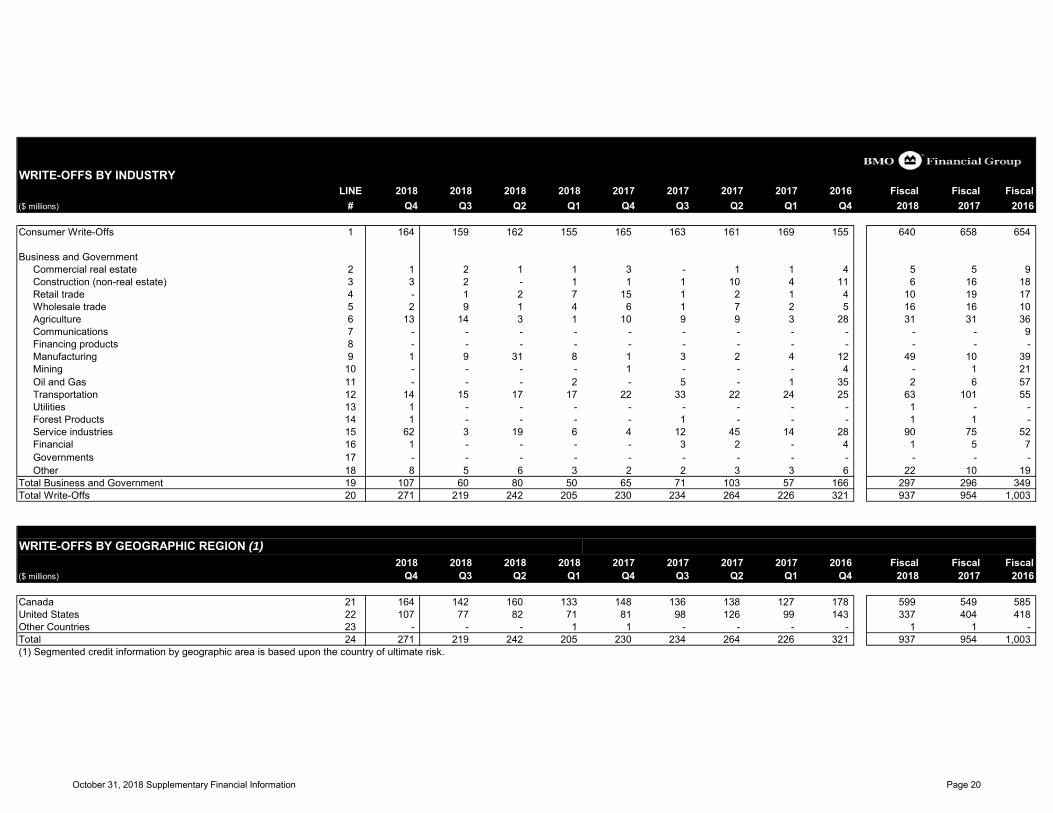
WRITE-OFFS BY INDUSTRY
LINE 2018 2018 2018 2018 2017 2017 2017 2017 2016 Fiscal Fiscal Fiscal($ millions) # Q4 Q3 Q2 Q1 Q4 Q3 Q2 Q1 Q4 2018 2017 2016
Consumer Write-Offs 1 164 159 162 155 165 163 161 169 155 640 658 654
Business and Government Commercial real estate 2 1 2 1 1 3 - 1 1 4 5 5 9 Construction (non-real estate) 3 3 2 - 1 1 1 10 4 11 6 16 18 Retail trade 4 - 1 2 7 15 1 2 1 4 10 19 17 Wholesale trade 5 2 9 1 4 6 1 7 2 5 16 16 10 Agriculture 6 13 14 3 1 10 9 9 3 28 31 31 36 Communications 7 - - - - - - - - - - - 9 Financing products 8 - - - - - - - - - - - - Manufacturing 9 1 9 31 8 1 3 2 4 12 49 10 39 Mining 10 - - - - 1 - - - 4 - 1 21 Oil and Gas 11 - - - 2 - 5 - 1 35 2 6 57 Transportation 12 14 15 17 17 22 33 22 24 25 63 101 55 Utilities 13 1 - - - - - - - - 1 - - Forest Products 14 1 - - - - 1 - - - 1 1 - Service industries 15 62 3 19 6 4 12 45 14 28 90 75 52 Financial 16 1 - - - - 3 2 - 4 1 5 7 Governments 17 - - - - - - - - - - - - Other 18 8 5 6 3 2 2 3 3 6 22 10 19 Total Business and Government 19 107 60 80 50 65 71 103 57 166 297 296 349 Total Write-Offs 20 271 219 242 205 230 234 264 226 321 937 954 1,003
WRITE-OFFS BY GEOGRAPHIC REGION (1)2018 2018 2018 2018 2017 2017 2017 2017 2016 Fiscal Fiscal Fiscal
($ millions) Q4 Q3 Q2 Q1 Q4 Q3 Q2 Q1 Q4 2018 2017 2016
Canada 21 164 142 160 133 148 136 138 127 178 599 549 585 United States 22 107 77 82 71 81 98 126 99 143 337 404 418 Other Countries 23 - - - 1 1 - - - - 1 1 - Total 24 271 219 242 205 230 234 264 226 321 937 954 1,003 (1) Segmented credit information by geographic area is based upon the country of ultimate risk.
October 31, 2018 Supplementary Financial Information Page 20
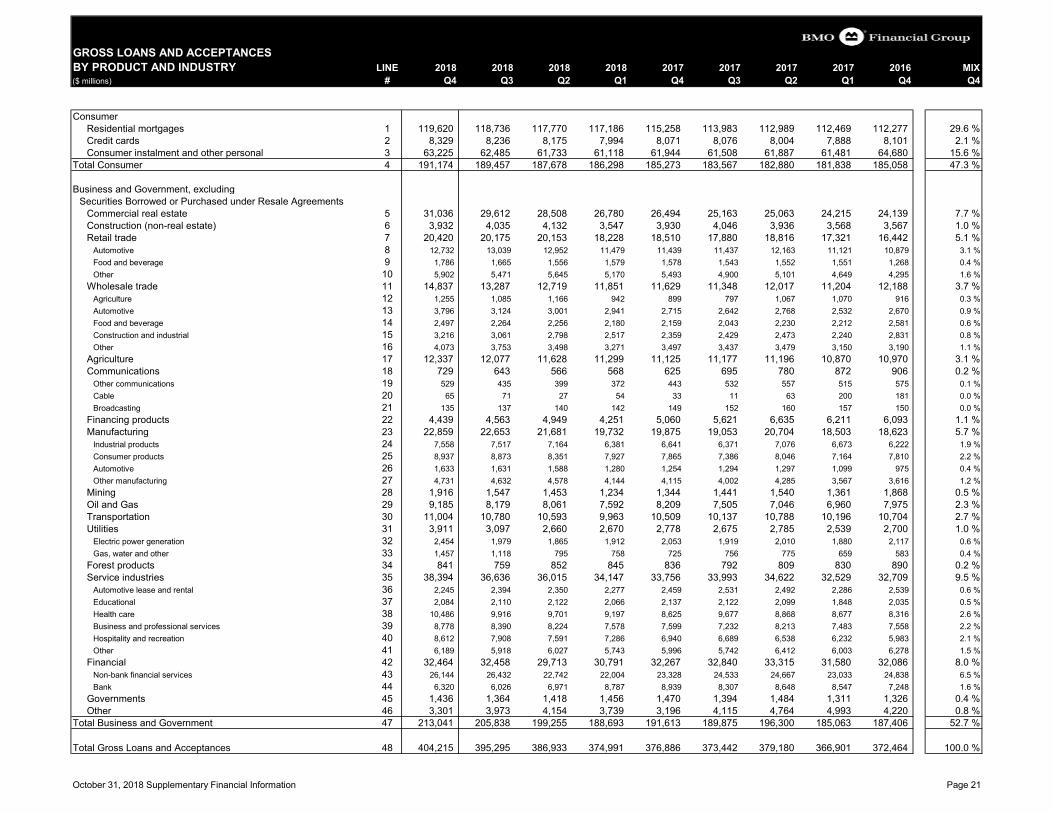
GROSS LOANS AND ACCEPTANCESBY PRODUCT AND INDUSTRY LINE 2018 2018 2018 2018 2017 2017 2017 2017 2016 MIX($ millions) # Q4 Q3 Q2 Q1 Q4 Q3 Q2 Q1 Q4 Q4
ConsumerResidential mortgages 1 119,620 118,736 117,770 117,186 115,258 113,983 112,989 112,469 112,277 29.6 %Credit cards 2 8,329 8,236 8,175 7,994 8,071 8,076 8,004 7,888 8,101 2.1 %Consumer instalment and other personal 3 63,225 62,485 61,733 61,118 61,944 61,508 61,887 61,481 64,680 15.6 %
Total Consumer 4 191,174 189,457 187,678 186,298 185,273 183,567 182,880 181,838 185,058 47.3 %
Business and Government, excluding Securities Borrowed or Purchased under Resale Agreements
Commercial real estate 5 31,036 29,612 28,508 26,780 26,494 25,163 25,063 24,215 24,139 7.7 %Construction (non-real estate) 6 3,932 4,035 4,132 3,547 3,930 4,046 3,936 3,568 3,567 1.0 %Retail trade 7 20,420 20,175 20,153 18,228 18,510 17,880 18,816 17,321 16,442 5.1 %
Automotive 8 12,732 13,039 12,952 11,479 11,439 11,437 12,163 11,121 10,879 3.1 %Food and beverage 9 1,786 1,665 1,556 1,579 1,578 1,543 1,552 1,551 1,268 0.4 %Other 10 5,902 5,471 5,645 5,170 5,493 4,900 5,101 4,649 4,295 1.6 %
Wholesale trade 11 14,837 13,287 12,719 11,851 11,629 11,348 12,017 11,204 12,188 3.7 %Agriculture 12 1,255 1,085 1,166 942 899 797 1,067 1,070 916 0.3 %Automotive 13 3,796 3,124 3,001 2,941 2,715 2,642 2,768 2,532 2,670 0.9 %Food and beverage 14 2,497 2,264 2,256 2,180 2,159 2,043 2,230 2,212 2,581 0.6 %Construction and industrial 15 3,216 3,061 2,798 2,517 2,359 2,429 2,473 2,240 2,831 0.8 %Other 16 4,073 3,753 3,498 3,271 3,497 3,437 3,479 3,150 3,190 1.1 %
Agriculture 17 12,337 12,077 11,628 11,299 11,125 11,177 11,196 10,870 10,970 3.1 %Communications 18 729 643 566 568 625 695 780 872 906 0.2 %
Other communications 19 529 435 399 372 443 532 557 515 575 0.1 %Cable 20 65 71 27 54 33 11 63 200 181 0.0 %Broadcasting 21 135 137 140 142 149 152 160 157 150 0.0 %
Financing products 22 4,439 4,563 4,949 4,251 5,060 5,621 6,635 6,211 6,093 1.1 %Manufacturing 23 22,859 22,653 21,681 19,732 19,875 19,053 20,704 18,503 18,623 5.7 %
Industrial products 24 7,558 7,517 7,164 6,381 6,641 6,371 7,076 6,673 6,222 1.9 %Consumer products 25 8,937 8,873 8,351 7,927 7,865 7,386 8,046 7,164 7,810 2.2 %Automotive 26 1,633 1,631 1,588 1,280 1,254 1,294 1,297 1,099 975 0.4 %Other manufacturing 27 4,731 4,632 4,578 4,144 4,115 4,002 4,285 3,567 3,616 1.2 %
Mining 28 1,916 1,547 1,453 1,234 1,344 1,441 1,540 1,361 1,868 0.5 %Oil and Gas 29 9,185 8,179 8,061 7,592 8,209 7,505 7,046 6,960 7,975 2.3 %Transportation 30 11,004 10,780 10,593 9,963 10,509 10,137 10,788 10,196 10,704 2.7 %Utilities 31 3,911 3,097 2,660 2,670 2,778 2,675 2,785 2,539 2,700 1.0 %
Electric power generation 32 2,454 1,979 1,865 1,912 2,053 1,919 2,010 1,880 2,117 0.6 %Gas, water and other 33 1,457 1,118 795 758 725 756 775 659 583 0.4 %
Forest products 34 841 759 852 845 836 792 809 830 890 0.2 %Service industries 35 38,394 36,636 36,015 34,147 33,756 33,993 34,622 32,529 32,709 9.5 %
Automotive lease and rental 36 2,245 2,394 2,350 2,277 2,459 2,531 2,492 2,286 2,539 0.6 %Educational 37 2,084 2,110 2,122 2,066 2,137 2,122 2,099 1,848 2,035 0.5 %Health care 38 10,486 9,916 9,701 9,197 8,625 9,677 8,868 8,677 8,316 2.6 %Business and professional services 39 8,778 8,390 8,224 7,578 7,599 7,232 8,213 7,483 7,558 2.2 %Hospitality and recreation 40 8,612 7,908 7,591 7,286 6,940 6,689 6,538 6,232 5,983 2.1 %Other 41 6,189 5,918 6,027 5,743 5,996 5,742 6,412 6,003 6,278 1.5 %
Financial 42 32,464 32,458 29,713 30,791 32,267 32,840 33,315 31,580 32,086 8.0 %Non-bank financial services 43 26,144 26,432 22,742 22,004 23,328 24,533 24,667 23,033 24,838 6.5 %Bank 44 6,320 6,026 6,971 8,787 8,939 8,307 8,648 8,547 7,248 1.6 %
Governments 45 1,436 1,364 1,418 1,456 1,470 1,394 1,484 1,311 1,326 0.4 %Other 46 3,301 3,973 4,154 3,739 3,196 4,115 4,764 4,993 4,220 0.8 %
Total Business and Government 47 213,041 205,838 199,255 188,693 191,613 189,875 196,300 185,063 187,406 52.7 %
Total Gross Loans and Acceptances 48 404,215 395,295 386,933 374,991 376,886 373,442 379,180 366,901 372,464 100.0 %
October 31, 2018 Supplementary Financial Information Page 21
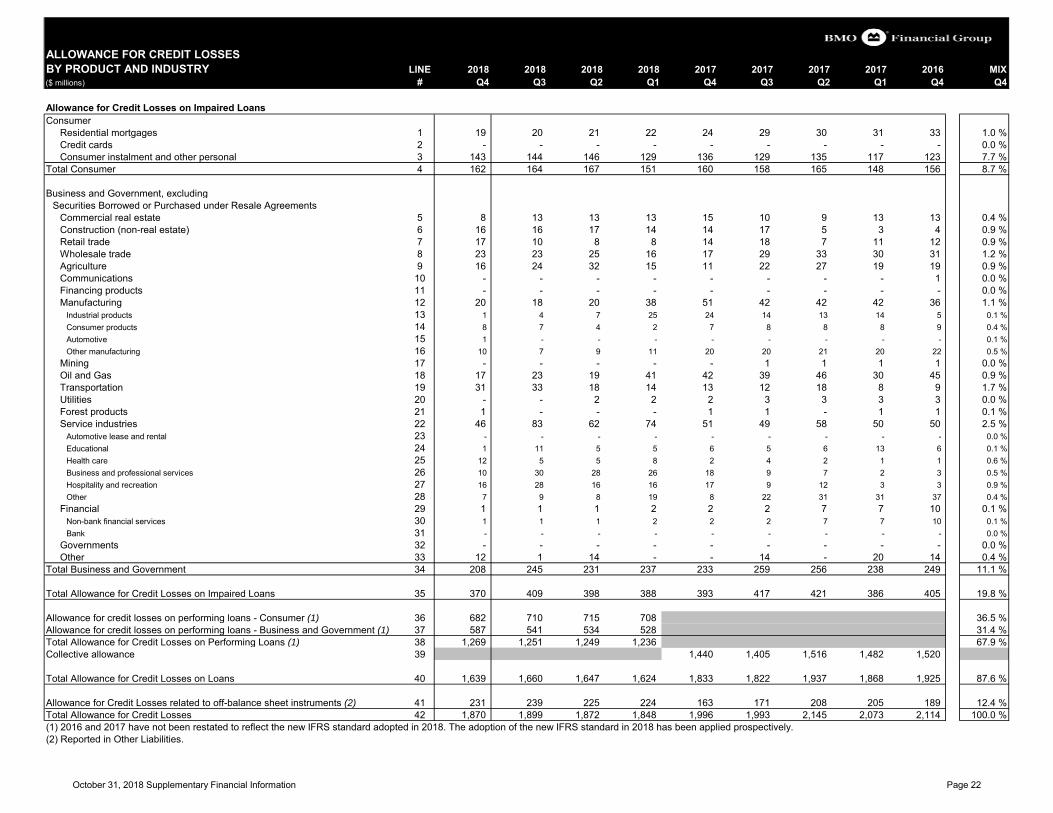
ALLOWANCE FOR CREDIT LOSSESBY PRODUCT AND INDUSTRY LINE 2018 2018 2018 2018 2017 2017 2017 2017 2016 MIX($ millions) # Q4 Q3 Q2 Q1 Q4 Q3 Q2 Q1 Q4 Q4
Allowance for Credit Losses on Impaired LoansConsumer
Residential mortgages 1 19 20 21 22 24 29 30 31 33 1.0 %Credit cards 2 - - - - - - - - - 0.0 %Consumer instalment and other personal 3 143 144 146 129 136 129 135 117 123 7.7 %
Total Consumer 4 162 164 167 151 160 158 165 148 156 8.7 %
Business and Government, excluding Securities Borrowed or Purchased under Resale Agreements
Commercial real estate 5 8 13 13 13 15 10 9 13 13 0.4 %Construction (non-real estate) 6 16 16 17 14 14 17 5 3 4 0.9 %Retail trade 7 17 10 8 8 14 18 7 11 12 0.9 %Wholesale trade 8 23 23 25 16 17 29 33 30 31 1.2 %Agriculture 9 16 24 32 15 11 22 27 19 19 0.9 %Communications 10 - - - - - - - - 1 0.0 %Financing products 11 - - - - - - - - - 0.0 %Manufacturing 12 20 18 20 38 51 42 42 42 36 1.1 %
Industrial products 13 1 4 7 25 24 14 13 14 5 0.1 %Consumer products 14 8 7 4 2 7 8 8 8 9 0.4 %Automotive 15 1 - - - - - - - - 0.1 %Other manufacturing 16 10 7 9 11 20 20 21 20 22 0.5 %
Mining 17 - - - - - 1 1 1 1 0.0 %Oil and Gas 18 17 23 19 41 42 39 46 30 45 0.9 %Transportation 19 31 33 18 14 13 12 18 8 9 1.7 %Utilities 20 - - 2 2 2 3 3 3 3 0.0 %Forest products 21 1 - - - 1 1 - 1 1 0.1 %Service industries 22 46 83 62 74 51 49 58 50 50 2.5 %
Automotive lease and rental 23 - - - - - - - - - 0.0 %Educational 24 1 11 5 5 6 5 6 13 6 0.1 %Health care 25 12 5 5 8 2 4 2 1 1 0.6 %Business and professional services 26 10 30 28 26 18 9 7 2 3 0.5 %Hospitality and recreation 27 16 28 16 16 17 9 12 3 3 0.9 %Other 28 7 9 8 19 8 22 31 31 37 0.4 %
Financial 29 1 1 1 2 2 2 7 7 10 0.1 %Non-bank financial services 30 1 1 1 2 2 2 7 7 10 0.1 %Bank 31 - - - - - - - - - 0.0 %
Governments 32 - - - - - - - - - 0.0 %Other 33 12 1 14 - - 14 - 20 14 0.4 %
Total Business and Government 34 208 245 231 237 233 259 256 238 249 11.1 %
Total Allowance for Credit Losses on Impaired Loans 35 370 409 398 388 393 417 421 386 405 19.8 %
Allowance for credit losses on performing loans - Consumer (1) 36 682 710 715 708 36.5 %Allowance for credit losses on performing loans - Business and Government (1) 37 587 541 534 528 31.4 %Total Allowance for Credit Losses on Performing Loans (1) 38 1,269 1,251 1,249 1,236 67.9 %Collective allowance 39 1,440 1,405 1,516 1,482 1,520
Total Allowance for Credit Losses on Loans 40 1,639 1,660 1,647 1,624 1,833 1,822 1,937 1,868 1,925 87.6 %
Allowance for Credit Losses related to off-balance sheet instruments (2) 41 231 239 225 224 163 171 208 205 189 12.4 %Total Allowance for Credit Losses 42 1,870 1,899 1,872 1,848 1,996 1,993 2,145 2,073 2,114 100.0 %(1) 2016 and 2017 have not been restated to reflect the new IFRS standard adopted in 2018. The adoption of the new IFRS standard in 2018 has been applied prospectively.(2) Reported in Other Liabilities.
October 31, 2018 Supplementary Financial Information Page 22
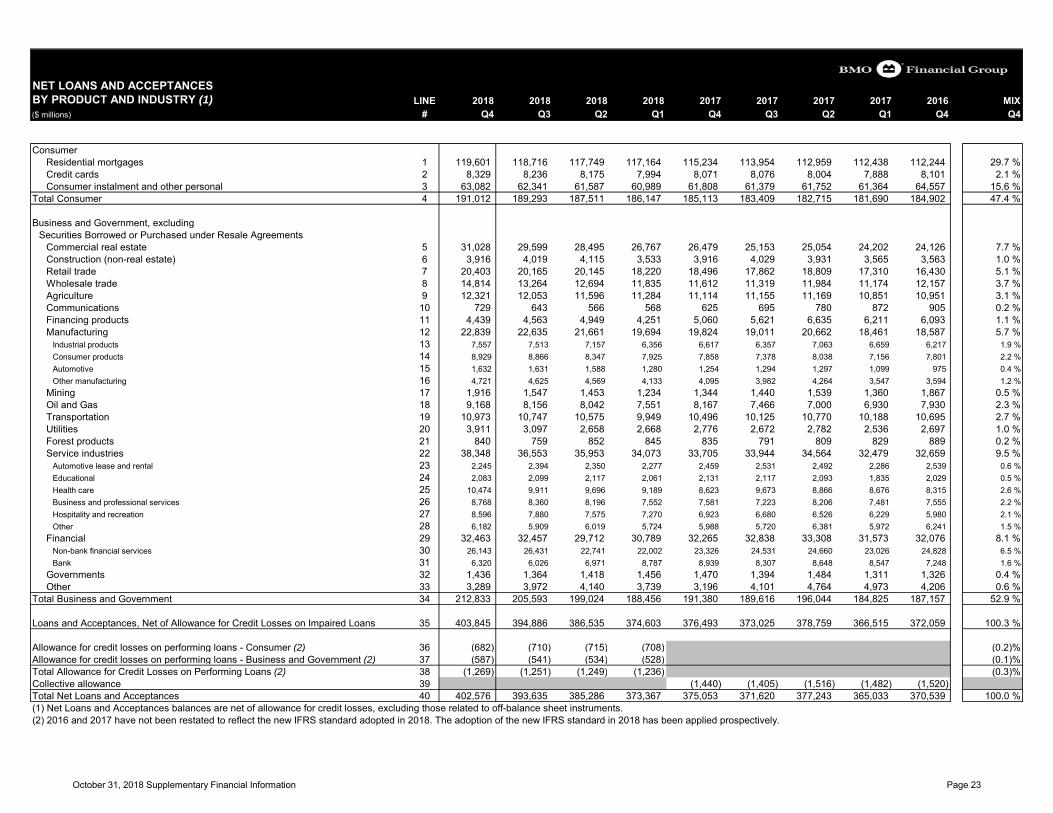
NET LOANS AND ACCEPTANCESBY PRODUCT AND INDUSTRY (1) LINE 2018 2018 2018 2018 2017 2017 2017 2017 2016 MIX($ millions) # Q4 Q3 Q2 Q1 Q4 Q3 Q2 Q1 Q4 Q4
ConsumerResidential mortgages 1 119,601 118,716 117,749 117,164 115,234 113,954 112,959 112,438 112,244 29.7 %Credit cards 2 8,329 8,236 8,175 7,994 8,071 8,076 8,004 7,888 8,101 2.1 %Consumer instalment and other personal 3 63,082 62,341 61,587 60,989 61,808 61,379 61,752 61,364 64,557 15.6 %
Total Consumer 4 191,012 189,293 187,511 186,147 185,113 183,409 182,715 181,690 184,902 47.4 %
Business and Government, excluding Securities Borrowed or Purchased under Resale Agreements
Commercial real estate 5 31,028 29,599 28,495 26,767 26,479 25,153 25,054 24,202 24,126 7.7 %Construction (non-real estate) 6 3,916 4,019 4,115 3,533 3,916 4,029 3,931 3,565 3,563 1.0 %Retail trade 7 20,403 20,165 20,145 18,220 18,496 17,862 18,809 17,310 16,430 5.1 %Wholesale trade 8 14,814 13,264 12,694 11,835 11,612 11,319 11,984 11,174 12,157 3.7 %Agriculture 9 12,321 12,053 11,596 11,284 11,114 11,155 11,169 10,851 10,951 3.1 %Communications 10 729 643 566 568 625 695 780 872 905 0.2 %Financing products 11 4,439 4,563 4,949 4,251 5,060 5,621 6,635 6,211 6,093 1.1 %Manufacturing 12 22,839 22,635 21,661 19,694 19,824 19,011 20,662 18,461 18,587 5.7 %
Industrial products 13 7,557 7,513 7,157 6,356 6,617 6,357 7,063 6,659 6,217 1.9 %Consumer products 14 8,929 8,866 8,347 7,925 7,858 7,378 8,038 7,156 7,801 2.2 %Automotive 15 1,632 1,631 1,588 1,280 1,254 1,294 1,297 1,099 975 0.4 %Other manufacturing 16 4,721 4,625 4,569 4,133 4,095 3,982 4,264 3,547 3,594 1.2 %
Mining 17 1,916 1,547 1,453 1,234 1,344 1,440 1,539 1,360 1,867 0.5 %Oil and Gas 18 9,168 8,156 8,042 7,551 8,167 7,466 7,000 6,930 7,930 2.3 %Transportation 19 10,973 10,747 10,575 9,949 10,496 10,125 10,770 10,188 10,695 2.7 %Utilities 20 3,911 3,097 2,658 2,668 2,776 2,672 2,782 2,536 2,697 1.0 %Forest products 21 840 759 852 845 835 791 809 829 889 0.2 %Service industries 22 38,348 36,553 35,953 34,073 33,705 33,944 34,564 32,479 32,659 9.5 %
Automotive lease and rental 23 2,245 2,394 2,350 2,277 2,459 2,531 2,492 2,286 2,539 0.6 %Educational 24 2,083 2,099 2,117 2,061 2,131 2,117 2,093 1,835 2,029 0.5 %Health care 25 10,474 9,911 9,696 9,189 8,623 9,673 8,866 8,676 8,315 2.6 %Business and professional services 26 8,768 8,360 8,196 7,552 7,581 7,223 8,206 7,481 7,555 2.2 %Hospitality and recreation 27 8,596 7,880 7,575 7,270 6,923 6,680 6,526 6,229 5,980 2.1 %Other 28 6,182 5,909 6,019 5,724 5,988 5,720 6,381 5,972 6,241 1.5 %
Financial 29 32,463 32,457 29,712 30,789 32,265 32,838 33,308 31,573 32,076 8.1 %Non-bank financial services 30 26,143 26,431 22,741 22,002 23,326 24,531 24,660 23,026 24,828 6.5 %Bank 31 6,320 6,026 6,971 8,787 8,939 8,307 8,648 8,547 7,248 1.6 %
Governments 32 1,436 1,364 1,418 1,456 1,470 1,394 1,484 1,311 1,326 0.4 %Other 33 3,289 3,972 4,140 3,739 3,196 4,101 4,764 4,973 4,206 0.6 %
Total Business and Government 34 212,833 205,593 199,024 188,456 191,380 189,616 196,044 184,825 187,157 52.9 %
Loans and Acceptances, Net of Allowance for Credit Losses on Impaired Loans 35 403,845 394,886 386,535 374,603 376,493 373,025 378,759 366,515 372,059 100.3 %
Allowance for credit losses on performing loans - Consumer (2) 36 (682) (710) (715) (708) (0.2)%Allowance for credit losses on performing loans - Business and Government (2) 37 (587) (541) (534) (528) (0.1)%Total Allowance for Credit Losses on Performing Loans (2) 38 (1,269) (1,251) (1,249) (1,236) (0.3)%Collective allowance 39 (1,440) (1,405) (1,516) (1,482) (1,520) Total Net Loans and Acceptances 40 402,576 393,635 385,286 373,367 375,053 371,620 377,243 365,033 370,539 100.0 %(1) Net Loans and Acceptances balances are net of allowance for credit losses, excluding those related to off-balance sheet instruments.(2) 2016 and 2017 have not been restated to reflect the new IFRS standard adopted in 2018. The adoption of the new IFRS standard in 2018 has been applied prospectively.
October 31, 2018 Supplementary Financial Information Page 23
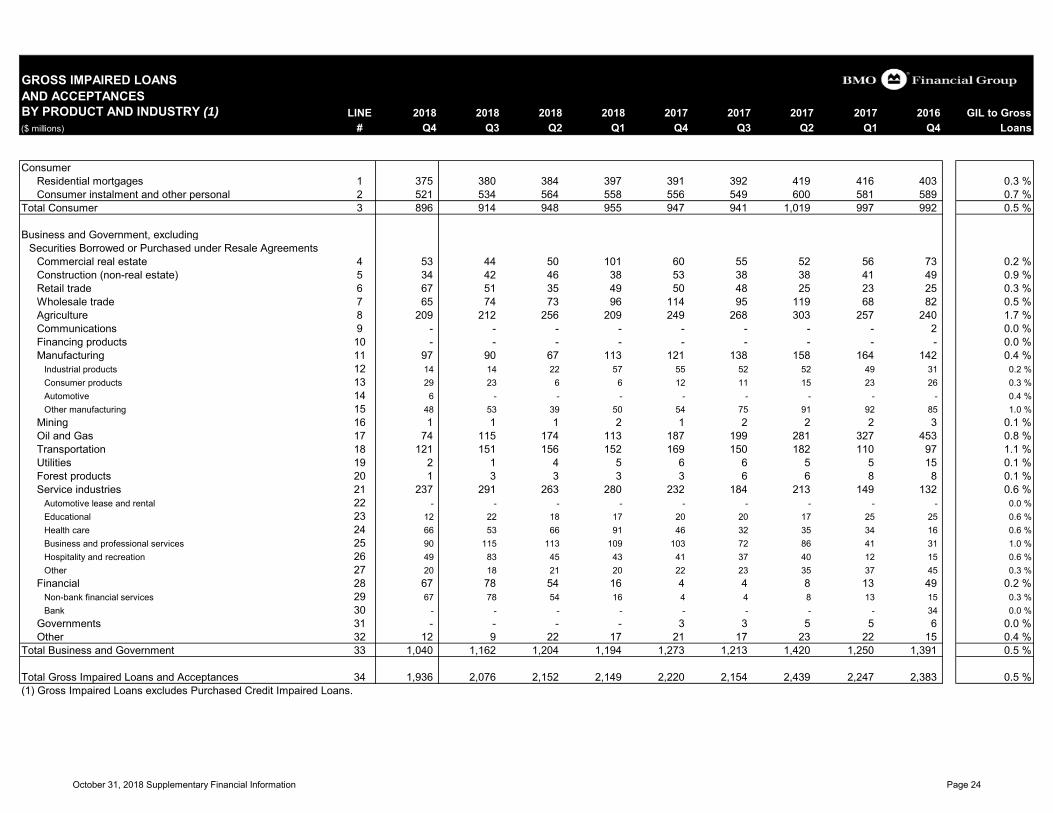
GROSS IMPAIRED LOANSAND ACCEPTANCES BY PRODUCT AND INDUSTRY (1) LINE 2018 2018 2018 2018 2017 2017 2017 2017 2016 GIL to Gross($ millions) # Q4 Q3 Q2 Q1 Q4 Q3 Q2 Q1 Q4 Loans
ConsumerResidential mortgages 1 375 380 384 397 391 392 419 416 403 0.3 %Consumer instalment and other personal 2 521 534 564 558 556 549 600 581 589 0.7 %
Total Consumer 3 896 914 948 955 947 941 1,019 997 992 0.5 %
Business and Government, excluding Securities Borrowed or Purchased under Resale Agreements
Commercial real estate 4 53 44 50 101 60 55 52 56 73 0.2 %Construction (non-real estate) 5 34 42 46 38 53 38 38 41 49 0.9 %Retail trade 6 67 51 35 49 50 48 25 23 25 0.3 %Wholesale trade 7 65 74 73 96 114 95 119 68 82 0.5 %Agriculture 8 209 212 256 209 249 268 303 257 240 1.7 %Communications 9 - - - - - - - - 2 0.0 %Financing products 10 - - - - - - - - - 0.0 %Manufacturing 11 97 90 67 113 121 138 158 164 142 0.4 %
Industrial products 12 14 14 22 57 55 52 52 49 31 0.2 %Consumer products 13 29 23 6 6 12 11 15 23 26 0.3 %Automotive 14 6 - - - - - - - - 0.4 %Other manufacturing 15 48 53 39 50 54 75 91 92 85 1.0 %
Mining 16 1 1 1 2 1 2 2 2 3 0.1 %Oil and Gas 17 74 115 174 113 187 199 281 327 453 0.8 %Transportation 18 121 151 156 152 169 150 182 110 97 1.1 %Utilities 19 2 1 4 5 6 6 5 5 15 0.1 %Forest products 20 1 3 3 3 3 6 6 8 8 0.1 %Service industries 21 237 291 263 280 232 184 213 149 132 0.6 %
Automotive lease and rental 22 - - - - - - - - - 0.0 %Educational 23 12 22 18 17 20 20 17 25 25 0.6 %Health care 24 66 53 66 91 46 32 35 34 16 0.6 %Business and professional services 25 90 115 113 109 103 72 86 41 31 1.0 %Hospitality and recreation 26 49 83 45 43 41 37 40 12 15 0.6 %Other 27 20 18 21 20 22 23 35 37 45 0.3 %
Financial 28 67 78 54 16 4 4 8 13 49 0.2 %Non-bank financial services 29 67 78 54 16 4 4 8 13 15 0.3 %Bank 30 - - - - - - - - 34 0.0 %
Governments 31 - - - - 3 3 5 5 6 0.0 %Other 32 12 9 22 17 21 17 23 22 15 0.4 %
Total Business and Government 33 1,040 1,162 1,204 1,194 1,273 1,213 1,420 1,250 1,391 0.5 %
Total Gross Impaired Loans and Acceptances 34 1,936 2,076 2,152 2,149 2,220 2,154 2,439 2,247 2,383 0.5 %(1) Gross Impaired Loans excludes Purchased Credit Impaired Loans.
October 31, 2018 Supplementary Financial Information Page 24
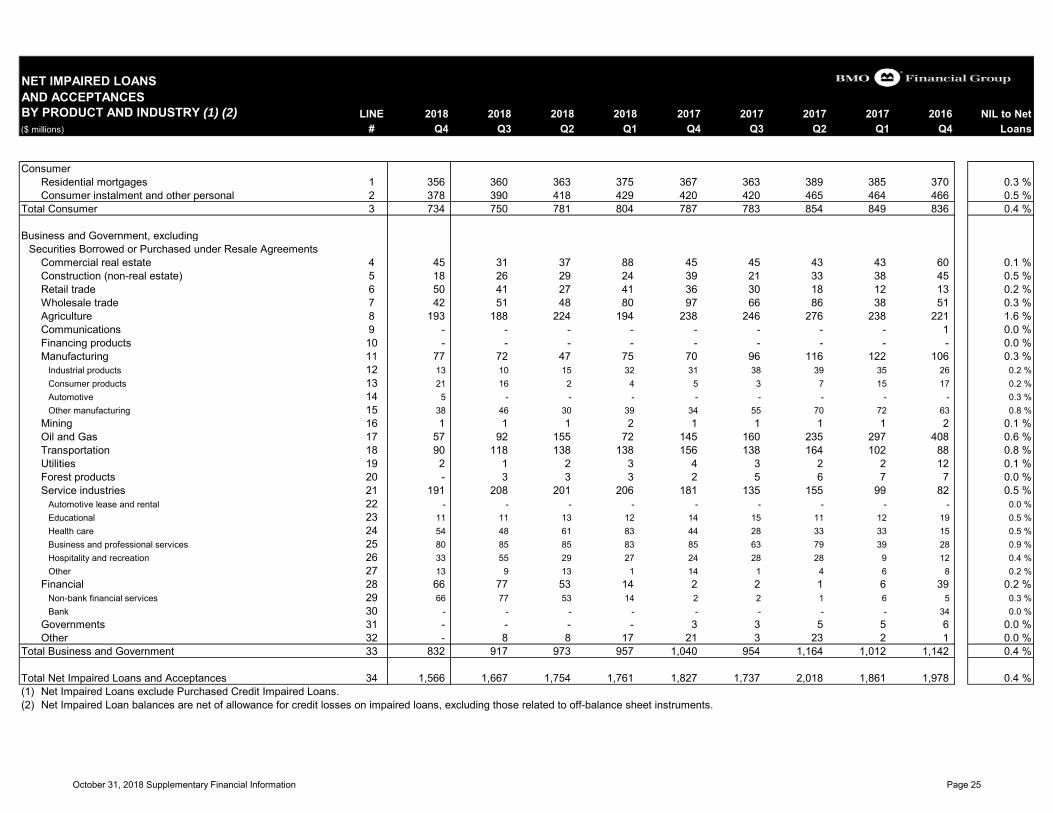
NET IMPAIRED LOANSAND ACCEPTANCES BY PRODUCT AND INDUSTRY (1) (2) LINE 2018 2018 2018 2018 2017 2017 2017 2017 2016 NIL to Net($ millions) # Q4 Q3 Q2 Q1 Q4 Q3 Q2 Q1 Q4 Loans
ConsumerResidential mortgages 1 356 360 363 375 367 363 389 385 370 0.3 %Consumer instalment and other personal 2 378 390 418 429 420 420 465 464 466 0.5 %
Total Consumer 3 734 750 781 804 787 783 854 849 836 0.4 %
Business and Government, excluding Securities Borrowed or Purchased under Resale Agreements
Commercial real estate 4 45 31 37 88 45 45 43 43 60 0.1 %Construction (non-real estate) 5 18 26 29 24 39 21 33 38 45 0.5 %Retail trade 6 50 41 27 41 36 30 18 12 13 0.2 %Wholesale trade 7 42 51 48 80 97 66 86 38 51 0.3 %Agriculture 8 193 188 224 194 238 246 276 238 221 1.6 %Communications 9 - - - - - - - - 1 0.0 %Financing products 10 - - - - - - - - - 0.0 %Manufacturing 11 77 72 47 75 70 96 116 122 106 0.3 %
Industrial products 12 13 10 15 32 31 38 39 35 26 0.2 %Consumer products 13 21 16 2 4 5 3 7 15 17 0.2 %Automotive 14 5 - - - - - - - - 0.3 %Other manufacturing 15 38 46 30 39 34 55 70 72 63 0.8 %
Mining 16 1 1 1 2 1 1 1 1 2 0.1 %Oil and Gas 17 57 92 155 72 145 160 235 297 408 0.6 %Transportation 18 90 118 138 138 156 138 164 102 88 0.8 %Utilities 19 2 1 2 3 4 3 2 2 12 0.1 %Forest products 20 - 3 3 3 2 5 6 7 7 0.0 %Service industries 21 191 208 201 206 181 135 155 99 82 0.5 %
Automotive lease and rental 22 - - - - - - - - - 0.0 %Educational 23 11 11 13 12 14 15 11 12 19 0.5 %Health care 24 54 48 61 83 44 28 33 33 15 0.5 %Business and professional services 25 80 85 85 83 85 63 79 39 28 0.9 %Hospitality and recreation 26 33 55 29 27 24 28 28 9 12 0.4 %Other 27 13 9 13 1 14 1 4 6 8 0.2 %
Financial 28 66 77 53 14 2 2 1 6 39 0.2 %Non-bank financial services 29 66 77 53 14 2 2 1 6 5 0.3 %Bank 30 - - - - - - - - 34 0.0 %
Governments 31 - - - - 3 3 5 5 6 0.0 %Other 32 - 8 8 17 21 3 23 2 1 0.0 %
Total Business and Government 33 832 917 973 957 1,040 954 1,164 1,012 1,142 0.4 %
Total Net Impaired Loans and Acceptances 34 1,566 1,667 1,754 1,761 1,827 1,737 2,018 1,861 1,978 0.4 %(1) Net Impaired Loans exclude Purchased Credit Impaired Loans.(2) Net Impaired Loan balances are net of allowance for credit losses on impaired loans, excluding those related to off-balance sheet instruments.
October 31, 2018 Supplementary Financial Information Page 25
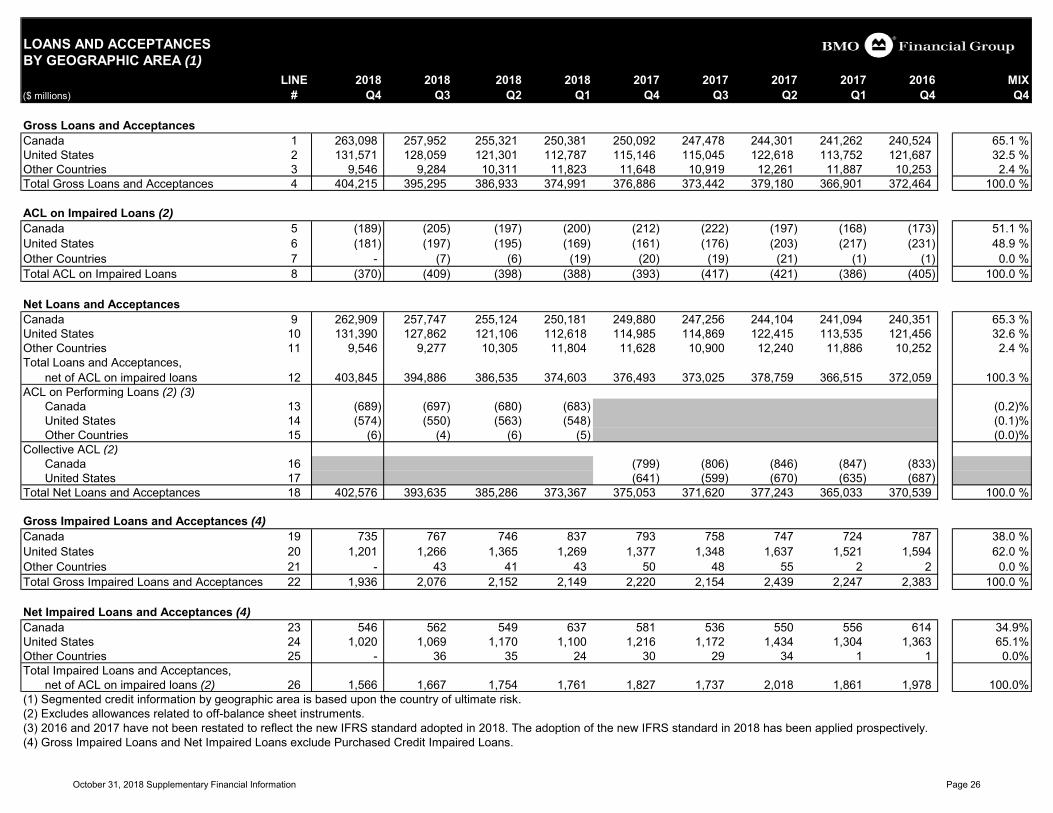
LOANS AND ACCEPTANCESBY GEOGRAPHIC AREA (1)
LINE 2018 2018 2018 2018 2017 2017 2017 2017 2016 MIX($ millions) # Q4 Q3 Q2 Q1 Q4 Q3 Q2 Q1 Q4 Q4
Gross Loans and Acceptances Canada 1 263,098 257,952 255,321 250,381 250,092 247,478 244,301 241,262 240,524 65.1 %United States 2 131,571 128,059 121,301 112,787 115,146 115,045 122,618 113,752 121,687 32.5 %Other Countries 3 9,546 9,284 10,311 11,823 11,648 10,919 12,261 11,887 10,253 2.4 %Total Gross Loans and Acceptances 4 404,215 395,295 386,933 374,991 376,886 373,442 379,180 366,901 372,464 100.0 %
ACL on Impaired Loans (2)Canada 5 (189) (205) (197) (200) (212) (222) (197) (168) (173) 51.1 %United States 6 (181) (197) (195) (169) (161) (176) (203) (217) (231) 48.9 %Other Countries 7 - (7) (6) (19) (20) (19) (21) (1) (1) 0.0 %Total ACL on Impaired Loans 8 (370) (409) (398) (388) (393) (417) (421) (386) (405) 100.0 %
Net Loans and Acceptances Canada 9 262,909 257,747 255,124 250,181 249,880 247,256 244,104 241,094 240,351 65.3 %United States 10 131,390 127,862 121,106 112,618 114,985 114,869 122,415 113,535 121,456 32.6 %Other Countries 11 9,546 9,277 10,305 11,804 11,628 10,900 12,240 11,886 10,252 2.4 %Total Loans and Acceptances,
net of ACL on impaired loans 12 403,845 394,886 386,535 374,603 376,493 373,025 378,759 366,515 372,059 100.3 %ACL on Performing Loans (2) (3)
Canada 13 (689) (697) (680) (683) (0.2)%United States 14 (574) (550) (563) (548) (0.1)%Other Countries 15 (6) (4) (6) (5) (0.0)%
Collective ACL (2)Canada 16 (799) (806) (846) (847) (833) United States 17 (641) (599) (670) (635) (687)
Total Net Loans and Acceptances 18 402,576 393,635 385,286 373,367 375,053 371,620 377,243 365,033 370,539 100.0 %
Gross Impaired Loans and Acceptances (4)Canada 19 735 767 746 837 793 758 747 724 787 38.0 %United States 20 1,201 1,266 1,365 1,269 1,377 1,348 1,637 1,521 1,594 62.0 %Other Countries 21 - 43 41 43 50 48 55 2 2 0.0 %Total Gross Impaired Loans and Acceptances 22 1,936 2,076 2,152 2,149 2,220 2,154 2,439 2,247 2,383 100.0 %
Net Impaired Loans and Acceptances (4)Canada 23 546 562 549 637 581 536 550 556 614 34.9%United States 24 1,020 1,069 1,170 1,100 1,216 1,172 1,434 1,304 1,363 65.1%Other Countries 25 - 36 35 24 30 29 34 1 1 0.0%Total Impaired Loans and Acceptances,
net of ACL on impaired loans (2) 26 1,566 1,667 1,754 1,761 1,827 1,737 2,018 1,861 1,978 100.0%(1) Segmented credit information by geographic area is based upon the country of ultimate risk. (2) Excludes allowances related to off-balance sheet instruments.(3) 2016 and 2017 have not been restated to reflect the new IFRS standard adopted in 2018. The adoption of the new IFRS standard in 2018 has been applied prospectively.(4) Gross Impaired Loans and Net Impaired Loans exclude Purchased Credit Impaired Loans.
October 31, 2018 Supplementary Financial Information Page 26
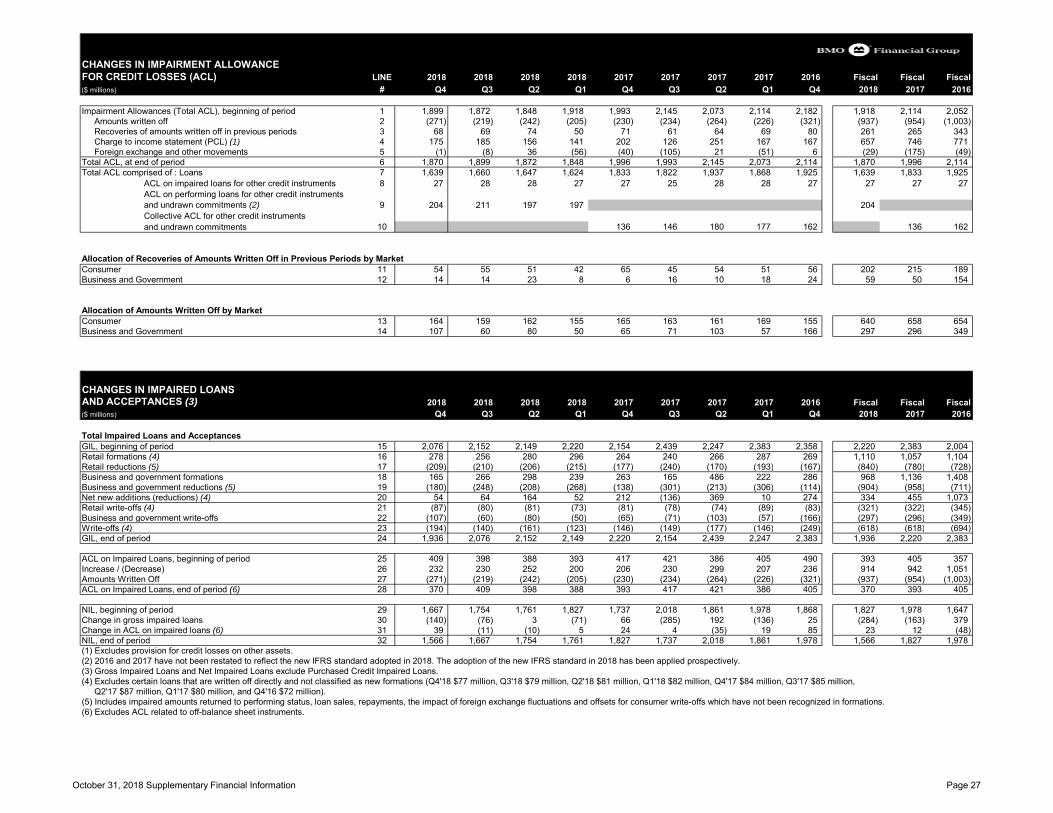
CHANGES IN IMPAIRMENT ALLOWANCEFOR CREDIT LOSSES (ACL) LINE 2018 2018 2018 2018 2017 2017 2017 2017 2016 Fiscal Fiscal Fiscal($ millions) # Q4 Q3 Q2 Q1 Q4 Q3 Q2 Q1 Q4 2018 2017 2016
Impairment Allowances (Total ACL), beginning of period 1 1,899 1,872 1,848 1,918 1,993 2,145 2,073 2,114 2,182 1,918 2,114 2,052 Amounts written off 2 (271) (219) (242) (205) (230) (234) (264) (226) (321) (937) (954) (1,003) Recoveries of amounts written off in previous periods 3 68 69 74 50 71 61 64 69 80 261 265 343 Charge to income statement (PCL) (1) 4 175 185 156 141 202 126 251 167 167 657 746 771 Foreign exchange and other movements 5 (1) (8) 36 (56) (40) (105) 21 (51) 6 (29) (175) (49)
Total ACL, at end of period 6 1,870 1,899 1,872 1,848 1,996 1,993 2,145 2,073 2,114 1,870 1,996 2,114 Total ACL comprised of : Loans 7 1,639 1,660 1,647 1,624 1,833 1,822 1,937 1,868 1,925 1,639 1,833 1,925
ACL on impaired loans for other credit instruments 8 27 28 28 27 27 25 28 28 27 27 27 27 ACL on performing loans for other credit instruments and undrawn commitments (2) 9 204 211 197 197 204 Collective ACL for other credit instruments and undrawn commitments 10 136 146 180 177 162 136 162
Allocation of Recoveries of Amounts Written Off in Previous Periods by Market Consumer 11 54 55 51 42 65 45 54 51 56 202 215 189 Business and Government 12 14 14 23 8 6 16 10 18 24 59 50 154
Allocation of Amounts Written Off by Market Consumer 13 164 159 162 155 165 163 161 169 155 640 658 654 Business and Government 14 107 60 80 50 65 71 103 57 166 297 296 349
CHANGES IN IMPAIRED LOANS AND ACCEPTANCES (3) 2018 2018 2018 2018 2017 2017 2017 2017 2016 Fiscal Fiscal Fiscal($ millions) Q4 Q3 Q2 Q1 Q4 Q3 Q2 Q1 Q4 2018 2017 2016
Total Impaired Loans and AcceptancesGIL, beginning of period 15 2,076 2,152 2,149 2,220 2,154 2,439 2,247 2,383 2,358 2,220 2,383 2,004 Retail formations (4) 16 278 256 280 296 264 240 266 287 269 1,110 1,057 1,104 Retail reductions (5) 17 (209) (210) (206) (215) (177) (240) (170) (193) (167) (840) (780) (728) Business and government formations 18 165 266 298 239 263 165 486 222 286 968 1,136 1,408 Business and government reductions (5) 19 (180) (248) (208) (268) (138) (301) (213) (306) (114) (904) (958) (711) Net new additions (reductions) (4) 20 54 64 164 52 212 (136) 369 10 274 334 455 1,073 Retail write-offs (4) 21 (87) (80) (81) (73) (81) (78) (74) (89) (83) (321) (322) (345) Business and government write-offs 22 (107) (60) (80) (50) (65) (71) (103) (57) (166) (297) (296) (349) Write-offs (4) 23 (194) (140) (161) (123) (146) (149) (177) (146) (249) (618) (618) (694) GIL, end of period 24 1,936 2,076 2,152 2,149 2,220 2,154 2,439 2,247 2,383 1,936 2,220 2,383
ACL on Impaired Loans, beginning of period 25 409 398 388 393 417 421 386 405 490 393 405 357 Increase / (Decrease) 26 232 230 252 200 206 230 299 207 236 914 942 1,051 Amounts Written Off 27 (271) (219) (242) (205) (230) (234) (264) (226) (321) (937) (954) (1,003) ACL on Impaired Loans, end of period (6) 28 370 409 398 388 393 417 421 386 405 370 393 405
NIL, beginning of period 29 1,667 1,754 1,761 1,827 1,737 2,018 1,861 1,978 1,868 1,827 1,978 1,647 Change in gross impaired loans 30 (140) (76) 3 (71) 66 (285) 192 (136) 25 (284) (163) 379 Change in ACL on impaired loans (6) 31 39 (11) (10) 5 24 4 (35) 19 85 23 12 (48) NIL, end of period 32 1,566 1,667 1,754 1,761 1,827 1,737 2,018 1,861 1,978 1,566 1,827 1,978 (1) Excludes provision for credit losses on other assets.(2) 2016 and 2017 have not been restated to reflect the new IFRS standard adopted in 2018. The adoption of the new IFRS standard in 2018 has been applied prospectively.(3) Gross Impaired Loans and Net Impaired Loans exclude Purchased Credit Impaired Loans.(4) Excludes certain loans that are written off directly and not classified as new formations (Q4'18 $77 million, Q3'18 $79 million, Q2'18 $81 million, Q1'18 $82 million, Q4'17 $84 million, Q3'17 $85 million,
Q2'17 $87 million, Q1'17 $80 million, and Q4'16 $72 million).(5) Includes impaired amounts returned to performing status, loan sales, repayments, the impact of foreign exchange fluctuations and offsets for consumer write-offs which have not been recognized in formations.(6) Excludes ACL related to off-balance sheet instruments.
October 31, 2018 Supplementary Financial Information Page 27
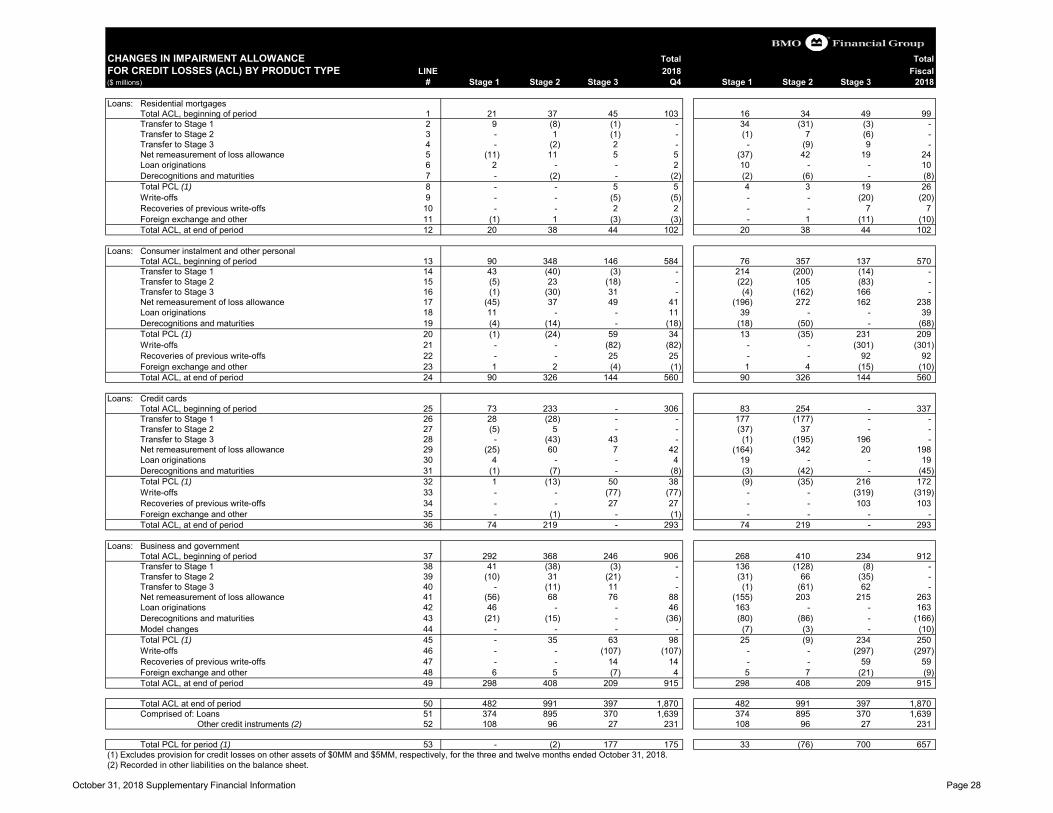
CHANGES IN IMPAIRMENT ALLOWANCE Total TotalFOR CREDIT LOSSES (ACL) BY PRODUCT TYPE LINE 2018 Fiscal($ millions) # Stage 1 Stage 2 Stage 3 Q4 Stage 1 Stage 2 Stage 3 2018
Loans: Residential mortgagesTotal ACL, beginning of period 1 21 37 45 103 16 34 49 99 Transfer to Stage 1 2 9 (8) (1) - 34 (31) (3) - Transfer to Stage 2 3 - 1 (1) - (1) 7 (6) - Transfer to Stage 3 4 - (2) 2 - - (9) 9 - Net remeasurement of loss allowance 5 (11) 11 5 5 (37) 42 19 24 Loan originations 6 2 - - 2 10 - - 10 Derecognitions and maturities 7 - (2) - (2) (2) (6) - (8) Total PCL (1) 8 - - 5 5 4 3 19 26 Write-offs 9 - - (5) (5) - - (20) (20) Recoveries of previous write-offs 10 - - 2 2 - - 7 7 Foreign exchange and other 11 (1) 1 (3) (3) - 1 (11) (10) Total ACL, at end of period 12 20 38 44 102 20 38 44 102
Loans: Consumer instalment and other personalTotal ACL, beginning of period 13 90 348 146 584 76 357 137 570 Transfer to Stage 1 14 43 (40) (3) - 214 (200) (14) - Transfer to Stage 2 15 (5) 23 (18) - (22) 105 (83) - Transfer to Stage 3 16 (1) (30) 31 - (4) (162) 166 - Net remeasurement of loss allowance 17 (45) 37 49 41 (196) 272 162 238 Loan originations 18 11 - - 11 39 - - 39 Derecognitions and maturities 19 (4) (14) - (18) (18) (50) - (68) Total PCL (1) 20 (1) (24) 59 34 13 (35) 231 209 Write-offs 21 - - (82) (82) - - (301) (301) Recoveries of previous write-offs 22 - - 25 25 - - 92 92 Foreign exchange and other 23 1 2 (4) (1) 1 4 (15) (10) Total ACL, at end of period 24 90 326 144 560 90 326 144 560
Loans: Credit cardsTotal ACL, beginning of period 25 73 233 - 306 83 254 - 337 Transfer to Stage 1 26 28 (28) - - 177 (177) - - Transfer to Stage 2 27 (5) 5 - - (37) 37 - - Transfer to Stage 3 28 - (43) 43 - (1) (195) 196 - Net remeasurement of loss allowance 29 (25) 60 7 42 (164) 342 20 198 Loan originations 30 4 - - 4 19 - - 19 Derecognitions and maturities 31 (1) (7) - (8) (3) (42) - (45) Total PCL (1) 32 1 (13) 50 38 (9) (35) 216 172 Write-offs 33 - - (77) (77) - - (319) (319) Recoveries of previous write-offs 34 - - 27 27 - - 103 103 Foreign exchange and other 35 - (1) - (1) - - - - Total ACL, at end of period 36 74 219 - 293 74 219 - 293
Loans: Business and governmentTotal ACL, beginning of period 37 292 368 246 906 268 410 234 912 Transfer to Stage 1 38 41 (38) (3) - 136 (128) (8) - Transfer to Stage 2 39 (10) 31 (21) - (31) 66 (35) - Transfer to Stage 3 40 - (11) 11 - (1) (61) 62 - Net remeasurement of loss allowance 41 (56) 68 76 88 (155) 203 215 263 Loan originations 42 46 - - 46 163 - - 163 Derecognitions and maturities 43 (21) (15) - (36) (80) (86) - (166) Model changes 44 - - - - (7) (3) - (10) Total PCL (1) 45 - 35 63 98 25 (9) 234 250 Write-offs 46 - - (107) (107) - - (297) (297) Recoveries of previous write-offs 47 - - 14 14 - - 59 59 Foreign exchange and other 48 6 5 (7) 4 5 7 (21) (9) Total ACL, at end of period 49 298 408 209 915 298 408 209 915
Total ACL at end of period 50 482 991 397 1,870 482 991 397 1,870 Comprised of: Loans 51 374 895 370 1,639 374 895 370 1,639
Other credit instruments (2) 52 108 96 27 231 108 96 27 231
Total PCL for period (1) 53 - (2) 177 175 33 (76) 700 657 (1) Excludes provision for credit losses on other assets of $0MM and $5MM, respectively, for the three and twelve months ended October 31, 2018.(2) Recorded in other liabilities on the balance sheet.
October 31, 2018 Supplementary Financial Information Page 28
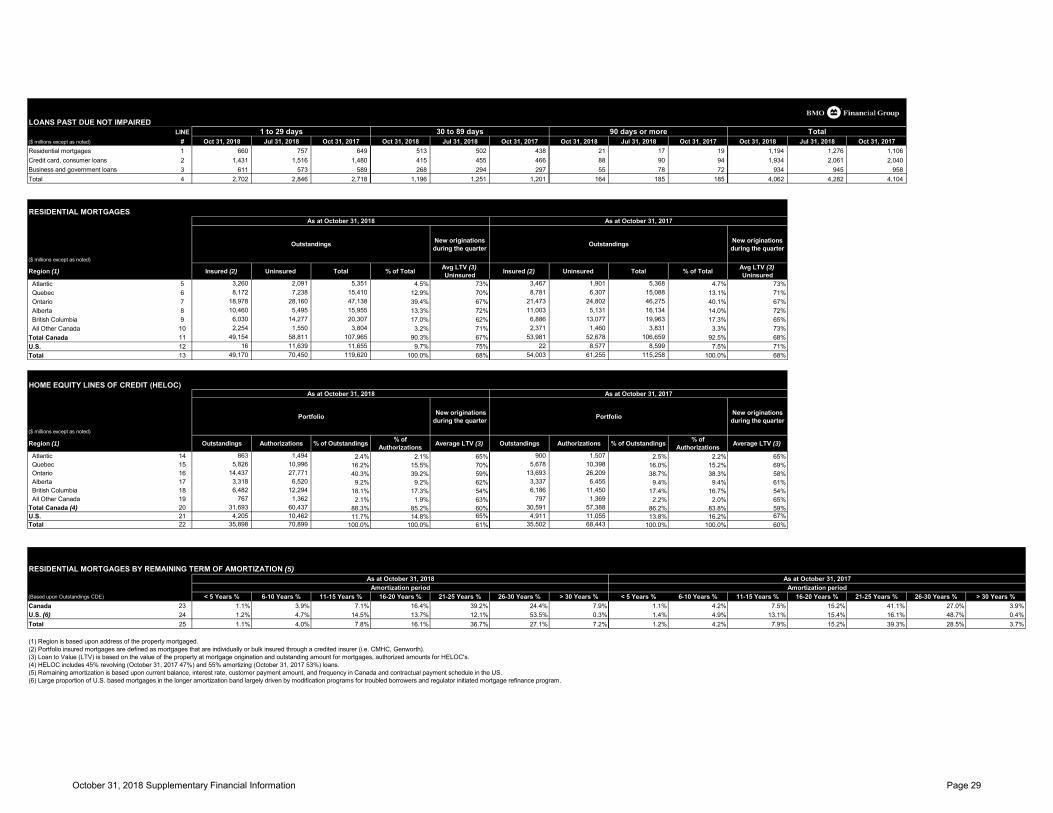
LOANS PAST DUE NOT IMPAIREDLINE
($ millions except as noted) # Oct 31, 2018 Jul 31, 2018 Oct 31, 2017 Oct 31, 2018 Jul 31, 2018 Oct 31, 2017 Oct 31, 2018 Jul 31, 2018 Oct 31, 2017 Oct 31, 2018 Jul 31, 2018 Oct 31, 2017Residential mortgages 1 660 757 649 513 502 438 21 17 19 1,194 1,276 1,106 Credit card, consumer loans 2 1,431 1,516 1,480 415 455 466 88 90 94 1,934 2,061 2,040 Business and government loans 3 611 573 589 268 294 297 55 78 72 934 945 958 Total 4 2,702 2,846 2,718 1,196 1,251 1,201 164 185 185 4,062 4,282 4,104
RESIDENTIAL MORTGAGESAs at October 31, 2018 As at October 31, 2017
($ millions except as noted)
New originations during the quarter
New originations during the quarter
Region (1) Insured (2) Uninsured Total % of Total Avg LTV (3) Uninsured Insured (2) Uninsured Total % of Total Avg LTV (3)
Uninsured Atlantic 5 3,260 2,091 5,351 4.5% 73% 3,467 1,901 5,368 4.7% 73% Quebec 6 8,172 7,238 15,410 12.9% 70% 8,781 6,307 15,088 13.1% 71% Ontario 7 18,978 28,160 47,138 39.4% 67% 21,473 24,802 46,275 40.1% 67% Alberta 8 10,460 5,495 15,955 13.3% 72% 11,003 5,131 16,134 14.0% 72% British Columbia 9 6,030 14,277 20,307 17.0% 62% 6,886 13,077 19,963 17.3% 65% All Other Canada 10 2,254 1,550 3,804 3.2% 71% 2,371 1,460 3,831 3.3% 73%Total Canada 11 49,154 58,811 107,965 90.3% 67% 53,981 52,678 106,659 92.5% 68%U.S. 12 16 11,639 11,655 9.7% 75% 22 8,577 8,599 7.5% 71%Total 13 49,170 70,450 119,620 100.0% 68% 54,003 61,255 115,258 100.0% 68%
HOME EQUITY LINES OF CREDIT (HELOC)As at October 31, 2018 As at October 31, 2017
($ millions except as noted)
Portfolio New originations during the quarter Portfolio New originations
during the quarter
Region (1) Outstandings Authorizations % of Outstandings % of Authorizations Average LTV (3) Outstandings Authorizations % of Outstandings % of
Authorizations Average LTV (3)
Atlantic 14 863 1,494 2.4% 2.1% 65% 900 1,507 2.5% 2.2% 65% Quebec 15 5,826 10,996 16.2% 15.5% 70% 5,678 10,398 16.0% 15.2% 69% Ontario 16 14,437 27,771 40.3% 39.2% 59% 13,693 26,209 38.7% 38.3% 58% Alberta 17 3,318 6,520 9.2% 9.2% 62% 3,337 6,455 9.4% 9.4% 61% British Columbia 18 6,482 12,294 18.1% 17.3% 54% 6,186 11,450 17.4% 16.7% 54% All Other Canada 19 767 1,362 2.1% 1.9% 63% 797 1,369 2.2% 2.0% 65%Total Canada (4) 20 31,693 60,437 88.3% 85.2% 60% 30,591 57,388 86.2% 83.8% 59%U.S. 21 4,205 10,462 11.7% 14.8% 65% 4,911 11,055 13.8% 16.2% 67%Total 22 35,898 70,899 100.0% 100.0% 61% 35,502 68,443 100.0% 100.0% 60%
RESIDENTIAL MORTGAGES BY REMAINING TERM OF AMORTIZATION (5)As at October 31, 2018 As at October 31, 2017
Amortization period Amortization period(Based upon Outstandings CDE) < 5 Years % 6-10 Years % 11-15 Years % 16-20 Years % 21-25 Years % 26-30 Years % > 30 Years % < 5 Years % 6-10 Years % 11-15 Years % 16-20 Years % 21-25 Years % 26-30 Years % > 30 Years %Canada 23 1.1% 3.9% 7.1% 16.4% 39.2% 24.4% 7.9% 1.1% 4.2% 7.5% 15.2% 41.1% 27.0% 3.9%U.S. (6) 24 1.2% 4.7% 14.5% 13.7% 12.1% 53.5% 0.3% 1.4% 4.9% 13.1% 15.4% 16.1% 48.7% 0.4%Total 25 1.1% 4.0% 7.8% 16.1% 36.7% 27.1% 7.2% 1.2% 4.2% 7.9% 15.2% 39.3% 28.5% 3.7%
(1) Region is based upon address of the property mortgaged.(2) Portfolio insured mortgages are defined as mortgages that are individually or bulk insured through a credited insurer (i.e. CMHC, Genworth).(3) Loan to Value (LTV) is based on the value of the property at mortgage origination and outstanding amount for mortgages, authorized amounts for HELOC's.(4) HELOC includes 45% revolving (October 31, 2017 47%) and 55% amortizing (October 31, 2017 53%) loans.(5) Remaining amortization is based upon current balance, interest rate, customer payment amount, and frequency in Canada and contractual payment schedule in the US.(6) Large proportion of U.S. based mortgages in the longer amortization band largely driven by modification programs for troubled borrowers and regulator initiated mortgage refinance program.
Outstandings Outstandings
1 to 29 days 30 to 89 days 90 days or more Total
October 31, 2018 Supplementary Financial Information Page 29
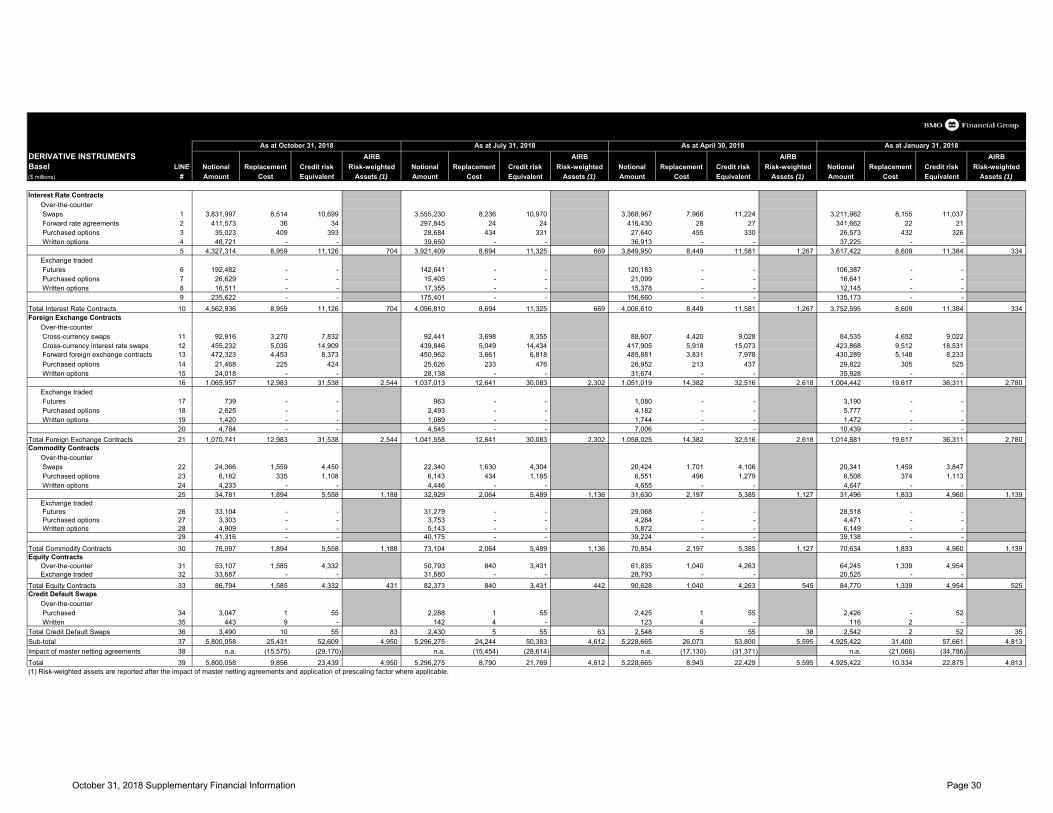
DERIVATIVE INSTRUMENTS AIRB AIRB AIRB AIRBBasel LINE Notional Replacement Credit risk Risk-weighted Notional Replacement Credit risk Risk-weighted Notional Replacement Credit risk Risk-weighted Notional Replacement Credit risk Risk-weighted($ millions) # Amount Cost Equivalent Assets (1) Amount Cost Equivalent Assets (1) Amount Cost Equivalent Assets (1) Amount Cost Equivalent Assets (1)
Interest Rate ContractsOver-the-counter Swaps 1 3,831,997 8,514 10,699 3,555,230 8,236 10,970 3,368,967 7,966 11,224 3,211,962 8,155 11,037 Forward rate agreements 2 411,573 36 34 297,845 24 24 416,430 28 27 341,662 22 21 Purchased options 3 35,023 409 393 28,684 434 331 27,640 455 330 26,573 432 326 Written options 4 48,721 - - 39,650 - - 36,913 - - 37,225 - -
5 4,327,314 8,959 11,126 704 3,921,409 8,694 11,325 669 3,849,950 8,449 11,581 1,267 3,617,422 8,609 11,384 334 Exchange traded Futures 6 192,482 - - 142,641 - - 120,183 - - 106,387 - - Purchased options 7 26,629 - - 15,405 - - 21,099 - - 16,641 - - Written options 8 16,511 - - 17,355 - - 15,378 - - 12,145 - -
9 235,622 - - 175,401 - - 156,660 - - 135,173 - - Total Interest Rate Contracts 10 4,562,936 8,959 11,126 704 4,096,810 8,694 11,325 669 4,006,610 8,449 11,581 1,267 3,752,595 8,609 11,384 334 Foreign Exchange Contracts
Over-the-counter Cross-currency swaps 11 92,916 3,270 7,832 92,441 3,698 8,355 88,607 4,420 9,028 84,535 4,652 9,022
Cross-currency interest rate swaps 12 455,232 5,035 14,909 439,846 5,049 14,434 417,905 5,918 15,073 423,868 9,512 18,531 Forward foreign exchange contracts 13 472,323 4,453 8,373 450,962 3,661 6,818 485,881 3,831 7,978 430,289 5,148 8,233 Purchased options 14 21,468 225 424 25,626 233 476 26,952 213 437 29,822 305 525 Written options 15 24,018 - - 28,138 - - 31,674 - - 35,928 - -
16 1,065,957 12,983 31,538 2,544 1,037,013 12,641 30,083 2,302 1,051,019 14,382 32,516 2,618 1,004,442 19,617 36,311 2,780 Exchange traded Futures 17 739 - - 963 - - 1,080 - - 3,190 - - Purchased options 18 2,625 - - 2,493 - - 4,182 - - 5,777 - - Written options 19 1,420 - - 1,089 - - 1,744 - - 1,472 - -
20 4,784 - - 4,545 - - 7,006 - - 10,439 - - Total Foreign Exchange Contracts 21 1,070,741 12,983 31,538 2,544 1,041,558 12,641 30,083 2,302 1,058,025 14,382 32,516 2,618 1,014,881 19,617 36,311 2,780 Commodity Contracts
Over-the-counter Swaps 22 24,366 1,559 4,450 22,340 1,630 4,304 20,424 1,701 4,106 20,341 1,459 3,847 Purchased options 23 6,182 335 1,108 6,143 434 1,185 6,551 496 1,279 6,508 374 1,113 Written options 24 4,233 - - 4,446 - - 4,655 - - 4,647 - -
25 34,781 1,894 5,558 1,188 32,929 2,064 5,489 1,136 31,630 2,197 5,385 1,127 31,496 1,833 4,960 1,139 Exchange traded Futures 26 33,104 - - 31,279 - - 29,068 - - 28,518 - - Purchased options 27 3,303 - - 3,753 - - 4,284 - - 4,471 - - Written options 28 4,909 - - 5,143 - - 5,872 - - 6,149 - -
29 41,316 - - 40,175 - - 39,224 - - 39,138 - -
Total Commodity Contracts 30 76,097 1,894 5,558 1,188 73,104 2,064 5,489 1,136 70,854 2,197 5,385 1,127 70,634 1,833 4,960 1,139 Equity Contracts
Over-the-counter 31 53,107 1,585 4,332 50,793 840 3,431 61,835 1,040 4,263 64,245 1,339 4,954 Exchange traded 32 33,687 - - 31,580 - - 28,793 - - 20,525 - -
Total Equity Contracts 33 86,794 1,585 4,332 431 82,373 840 3,431 442 90,628 1,040 4,263 545 84,770 1,339 4,954 525 Credit Default Swaps
Over-the-counter Purchased 34 3,047 1 55 2,288 1 55 2,425 1 55 2,426 - 52 Written 35 443 9 - 142 4 - 123 4 - 116 2 -
Total Credit Default Swaps 36 3,490 10 55 83 2,430 5 55 63 2,548 5 55 38 2,542 2 52 35 Sub-total 37 5,800,058 25,431 52,609 4,950 5,296,275 24,244 50,383 4,612 5,228,665 26,073 53,800 5,595 4,925,422 31,400 57,661 4,813 Impact of master netting agreements 38 n.a. (15,575) (29,170) n.a. (15,454) (28,614) n.a. (17,130) (31,371) n.a. (21,066) (34,786) Total 39 5,800,058 9,856 23,439 4,950 5,296,275 8,790 21,769 4,612 5,228,665 8,943 22,429 5,595 4,925,422 10,334 22,875 4,813 (1) Risk-weighted assets are reported after the impact of master netting agreements and application of prescaling factor where applicable.
As at October 31, 2018 As at July 31, 2018 As at April 30, 2018 As at January 31, 2018
October 31, 2018 Supplementary Financial Information Page 30
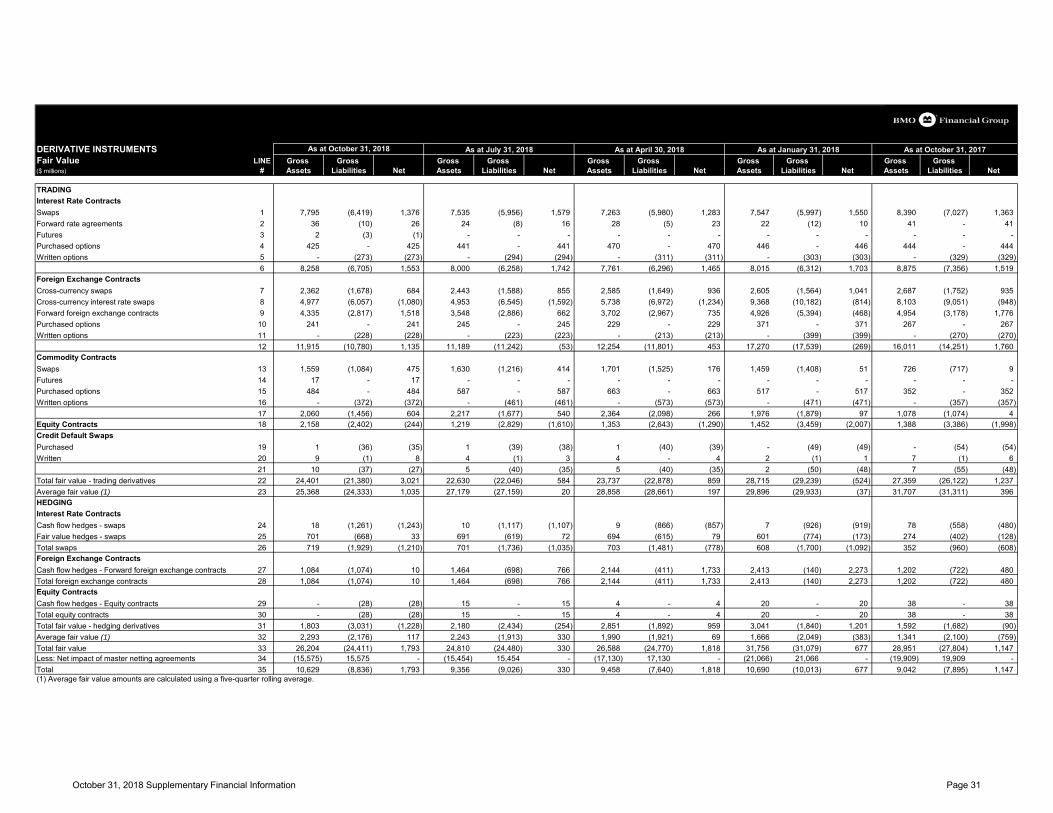
DERIVATIVE INSTRUMENTSFair Value LINE Gross Gross Gross Gross Gross Gross Gross Gross Gross Gross ($ millions) # Assets Liabilities Net Assets Liabilities Net Assets Liabilities Net Assets Liabilities Net Assets Liabilities Net
TRADINGInterest Rate ContractsSwaps 1 7,795 (6,419) 1,376 7,535 (5,956) 1,579 7,263 (5,980) 1,283 7,547 (5,997) 1,550 8,390 (7,027) 1,363 Forward rate agreements 2 36 (10) 26 24 (8) 16 28 (5) 23 22 (12) 10 41 - 41 Futures 3 2 (3) (1) - - - - - - - - - - - - Purchased options 4 425 - 425 441 - 441 470 - 470 446 - 446 444 - 444 Written options 5 - (273) (273) - (294) (294) - (311) (311) - (303) (303) - (329) (329)
6 8,258 (6,705) 1,553 8,000 (6,258) 1,742 7,761 (6,296) 1,465 8,015 (6,312) 1,703 8,875 (7,356) 1,519 Foreign Exchange ContractsCross-currency swaps 7 2,362 (1,678) 684 2,443 (1,588) 855 2,585 (1,649) 936 2,605 (1,564) 1,041 2,687 (1,752) 935 Cross-currency interest rate swaps 8 4,977 (6,057) (1,080) 4,953 (6,545) (1,592) 5,738 (6,972) (1,234) 9,368 (10,182) (814) 8,103 (9,051) (948) Forward foreign exchange contracts 9 4,335 (2,817) 1,518 3,548 (2,886) 662 3,702 (2,967) 735 4,926 (5,394) (468) 4,954 (3,178) 1,776 Purchased options 10 241 - 241 245 - 245 229 - 229 371 - 371 267 - 267 Written options 11 - (228) (228) - (223) (223) - (213) (213) - (399) (399) - (270) (270)
12 11,915 (10,780) 1,135 11,189 (11,242) (53) 12,254 (11,801) 453 17,270 (17,539) (269) 16,011 (14,251) 1,760 Commodity ContractsSwaps 13 1,559 (1,084) 475 1,630 (1,216) 414 1,701 (1,525) 176 1,459 (1,408) 51 726 (717) 9 Futures 14 17 - 17 - - - - - - - - - - - - Purchased options 15 484 - 484 587 - 587 663 - 663 517 - 517 352 - 352 Written options 16 - (372) (372) - (461) (461) - (573) (573) - (471) (471) - (357) (357)
17 2,060 (1,456) 604 2,217 (1,677) 540 2,364 (2,098) 266 1,976 (1,879) 97 1,078 (1,074) 4 Equity Contracts 18 2,158 (2,402) (244) 1,219 (2,829) (1,610) 1,353 (2,643) (1,290) 1,452 (3,459) (2,007) 1,388 (3,386) (1,998) Credit Default Swaps Purchased 19 1 (36) (35) 1 (39) (38) 1 (40) (39) - (49) (49) - (54) (54) Written 20 9 (1) 8 4 (1) 3 4 - 4 2 (1) 1 7 (1) 6
21 10 (37) (27) 5 (40) (35) 5 (40) (35) 2 (50) (48) 7 (55) (48) Total fair value - trading derivatives 22 24,401 (21,380) 3,021 22,630 (22,046) 584 23,737 (22,878) 859 28,715 (29,239) (524) 27,359 (26,122) 1,237 Average fair value (1) 23 25,368 (24,333) 1,035 27,179 (27,159) 20 28,858 (28,661) 197 29,896 (29,933) (37) 31,707 (31,311) 396 HEDGINGInterest Rate ContractsCash flow hedges - swaps 24 18 (1,261) (1,243) 10 (1,117) (1,107) 9 (866) (857) 7 (926) (919) 78 (558) (480) Fair value hedges - swaps 25 701 (668) 33 691 (619) 72 694 (615) 79 601 (774) (173) 274 (402) (128) Total swaps 26 719 (1,929) (1,210) 701 (1,736) (1,035) 703 (1,481) (778) 608 (1,700) (1,092) 352 (960) (608) Foreign Exchange ContractsCash flow hedges - Forward foreign exchange contracts 27 1,084 (1,074) 10 1,464 (698) 766 2,144 (411) 1,733 2,413 (140) 2,273 1,202 (722) 480 Total foreign exchange contracts 28 1,084 (1,074) 10 1,464 (698) 766 2,144 (411) 1,733 2,413 (140) 2,273 1,202 (722) 480 Equity ContractsCash flow hedges - Equity contracts 29 - (28) (28) 15 - 15 4 - 4 20 - 20 38 - 38 Total equity contracts 30 - (28) (28) 15 - 15 4 - 4 20 - 20 38 - 38 Total fair value - hedging derivatives 31 1,803 (3,031) (1,228) 2,180 (2,434) (254) 2,851 (1,892) 959 3,041 (1,840) 1,201 1,592 (1,682) (90) Average fair value (1) 32 2,293 (2,176) 117 2,243 (1,913) 330 1,990 (1,921) 69 1,666 (2,049) (383) 1,341 (2,100) (759) Total fair value 33 26,204 (24,411) 1,793 24,810 (24,480) 330 26,588 (24,770) 1,818 31,756 (31,079) 677 28,951 (27,804) 1,147 Less: Net impact of master netting agreements 34 (15,575) 15,575 - (15,454) 15,454 - (17,130) 17,130 - (21,066) 21,066 - (19,909) 19,909 - Total 35 10,629 (8,836) 1,793 9,356 (9,026) 330 9,458 (7,640) 1,818 10,690 (10,013) 677 9,042 (7,895) 1,147 (1) Average fair value amounts are calculated using a five-quarter rolling average.
As at October 31, 2018 As at July 31, 2018 As at April 30, 2018 As at January 31, 2018 As at October 31, 2017
October 31, 2018 Supplementary Financial Information Page 31
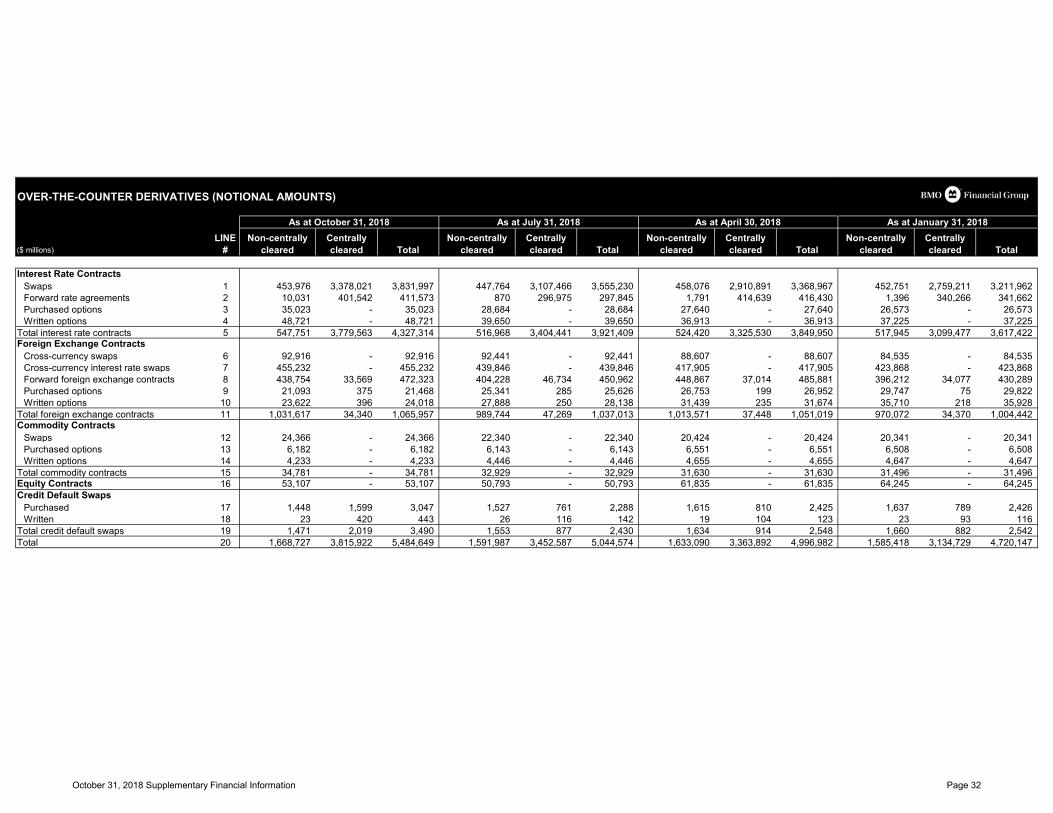
OVER-THE-COUNTER DERIVATIVES (NOTIONAL AMOUNTS)
($ millions)LINE
#Non-centrally
clearedCentrally cleared Total
Non-centrally cleared
Centrally cleared Total
Non-centrally cleared
Centrally cleared Total
Non-centrally cleared
Centrally cleared Total
Interest Rate ContractsSwaps 1 453,976 3,378,021 3,831,997 447,764 3,107,466 3,555,230 458,076 2,910,891 3,368,967 452,751 2,759,211 3,211,962 Forward rate agreements 2 10,031 401,542 411,573 870 296,975 297,845 1,791 414,639 416,430 1,396 340,266 341,662 Purchased options 3 35,023 - 35,023 28,684 - 28,684 27,640 - 27,640 26,573 - 26,573 Written options 4 48,721 - 48,721 39,650 - 39,650 36,913 - 36,913 37,225 - 37,225
Total interest rate contracts 5 547,751 3,779,563 4,327,314 516,968 3,404,441 3,921,409 524,420 3,325,530 3,849,950 517,945 3,099,477 3,617,422 Foreign Exchange Contracts
Cross-currency swaps 6 92,916 - 92,916 92,441 - 92,441 88,607 - 88,607 84,535 - 84,535 Cross-currency interest rate swaps 7 455,232 - 455,232 439,846 - 439,846 417,905 - 417,905 423,868 - 423,868 Forward foreign exchange contracts 8 438,754 33,569 472,323 404,228 46,734 450,962 448,867 37,014 485,881 396,212 34,077 430,289 Purchased options 9 21,093 375 21,468 25,341 285 25,626 26,753 199 26,952 29,747 75 29,822 Written options 10 23,622 396 24,018 27,888 250 28,138 31,439 235 31,674 35,710 218 35,928
Total foreign exchange contracts 11 1,031,617 34,340 1,065,957 989,744 47,269 1,037,013 1,013,571 37,448 1,051,019 970,072 34,370 1,004,442 Commodity Contracts
Swaps 12 24,366 - 24,366 22,340 - 22,340 20,424 - 20,424 20,341 - 20,341 Purchased options 13 6,182 - 6,182 6,143 - 6,143 6,551 - 6,551 6,508 - 6,508 Written options 14 4,233 - 4,233 4,446 - 4,446 4,655 - 4,655 4,647 - 4,647
Total commodity contracts 15 34,781 - 34,781 32,929 - 32,929 31,630 - 31,630 31,496 - 31,496 Equity Contracts 16 53,107 - 53,107 50,793 - 50,793 61,835 - 61,835 64,245 - 64,245 Credit Default Swaps
Purchased 17 1,448 1,599 3,047 1,527 761 2,288 1,615 810 2,425 1,637 789 2,426 Written 18 23 420 443 26 116 142 19 104 123 23 93 116
Total credit default swaps 19 1,471 2,019 3,490 1,553 877 2,430 1,634 914 2,548 1,660 882 2,542 Total 20 1,668,727 3,815,922 5,484,649 1,591,987 3,452,587 5,044,574 1,633,090 3,363,892 4,996,982 1,585,418 3,134,729 4,720,147
As at October 31, 2018 As at July 31, 2018 As at April 30, 2018 As at January 31, 2018
October 31, 2018 Supplementary Financial Information Page 32
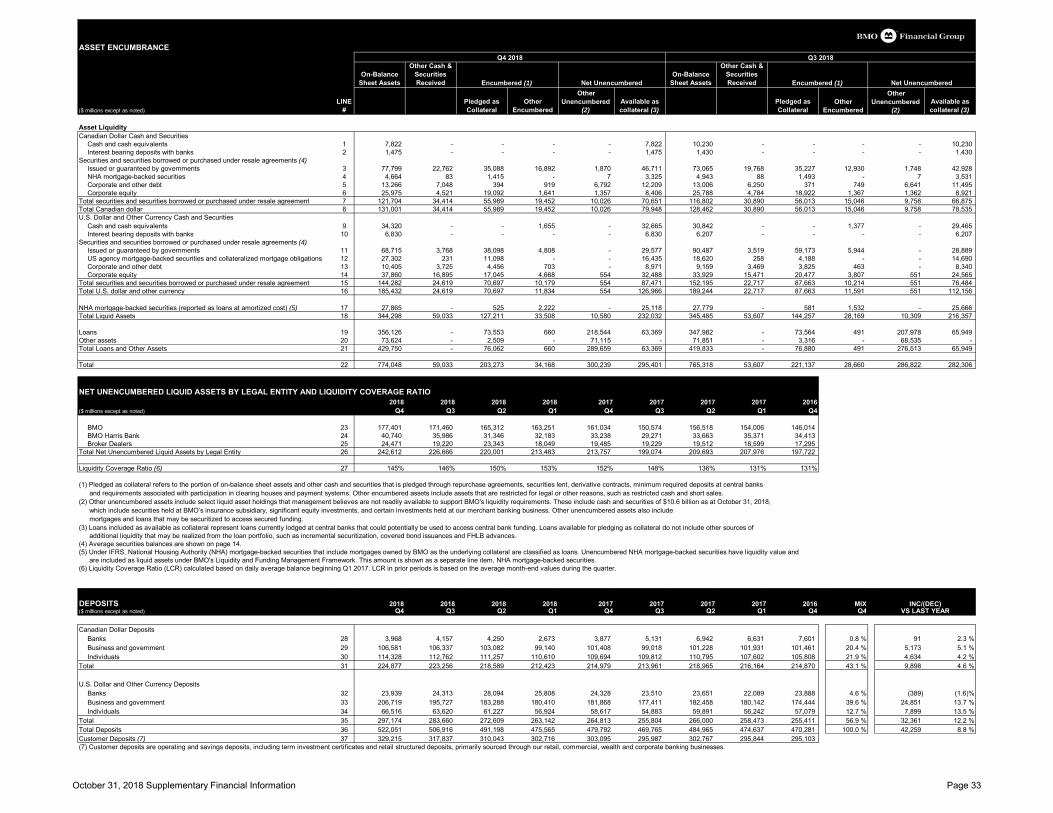
ASSET ENCUMBRANCEQ4 2018 Q3 2018
On-Balance Sheet Assets
Other Cash & Securities Received
On-Balance Sheet Assets
Other Cash & Securities Received
($ millions except as noted)LINE
#Pledged as Collateral
Other Encumbered
Other Unencumbered
(2)Available as collateral (3)
Pledged as Collateral
Available as collateral (3)
Asset LiquidityCanadian Dollar Cash and Securities
Cash and cash equivalents 1 7,822 - - - - 7,822 10,230 - - - - 10,230 Interest bearing deposits with banks 2 1,475 - - - - 1,475 1,430 - - - - 1,430
Securities and securities borrowed or purchased under resale agreements (4)Issued or guaranteed by governments 3 77,799 22,762 35,088 16,892 1,870 46,711 73,065 19,768 35,227 12,930 1,748 42,928 NHA mortgage-backed securities 4 4,664 83 1,415 - 7 3,325 4,943 88 1,493 - 7 3,531 Corporate and other debt 5 13,266 7,048 394 919 6,792 12,209 13,006 6,250 371 749 6,641 11,495 Corporate equity 6 25,975 4,521 19,092 1,641 1,357 8,406 25,788 4,784 18,922 1,367 1,362 8,921
Total securities and securities borrowed or purchased under resale agreement 7 121,704 34,414 55,989 19,452 10,026 70,651 116,802 30,890 56,013 15,046 9,758 66,875 Total Canadian dollar 8 131,001 34,414 55,989 19,452 10,026 79,948 128,462 30,890 56,013 15,046 9,758 78,535 U.S. Dollar and Other Currency Cash and Securities
Cash and cash equivalents 9 34,320 - - 1,655 - 32,665 30,842 - - 1,377 - 29,465 Interest bearing deposits with banks 10 6,830 - - - - 6,830 6,207 - - - - 6,207
Securities and securities borrowed or purchased under resale agreements (4)Issued or guaranteed by governments 11 68,715 3,768 38,098 4,808 - 29,577 90,487 3,519 59,173 5,944 - 28,889 US agency mortgage-backed securities and collateralized mortgage obligations 12 27,302 231 11,098 - - 16,435 18,620 258 4,188 - - 14,690 Corporate and other debt 13 10,405 3,725 4,456 703 - 8,971 9,159 3,469 3,825 463 - 8,340 Corporate equity 14 37,860 16,895 17,045 4,668 554 32,488 33,929 15,471 20,477 3,807 551 24,565
Total securities and securities borrowed or purchased under resale agreement 15 144,282 24,619 70,697 10,179 554 87,471 152,195 22,717 87,663 10,214 551 76,484 Total U.S. dollar and other currency 16 185,432 24,619 70,697 11,834 554 126,966 189,244 22,717 87,663 11,591 551 112,156
NHA mortgage-backed securities (reported as loans at amortized cost) (5) 17 27,865 - 525 2,222 - 25,118 27,779 - 581 1,532 - 25,666 Total Liquid Assets 18 344,298 59,033 127,211 33,508 10,580 232,032 345,485 53,607 144,257 28,169 10,309 216,357
Loans 19 356,126 - 73,553 660 218,544 63,369 347,982 - 73,564 491 207,978 65,949 Other assets 20 73,624 - 2,509 - 71,115 - 71,851 - 3,316 - 68,535 - Total Loans and Other Assets 21 429,750 - 76,062 660 289,659 63,369 419,833 - 76,880 491 276,513 65,949
Total 22 774,048 59,033 203,273 34,168 300,239 295,401 765,318 53,607 221,137 28,660 286,822 282,306
NET UNENCUMBERED LIQUID ASSETS BY LEGAL ENTITY AND LIQUIDITY COVERAGE RATIO2018 2018 2018 2018 2017 2017 2017 2017 2016
($ millions except as noted) Q4 Q3 Q2 Q1 Q4 Q3 Q2 Q1 Q4
BMO 23 177,401 171,460 165,312 163,251 161,034 150,574 156,518 154,006 146,014 BMO Harris Bank 24 40,740 35,986 31,346 32,183 33,238 29,271 33,663 35,371 34,413 Broker Dealers 25 24,471 19,220 23,343 18,049 19,485 19,229 19,512 18,599 17,295
Total Net Unencumbered Liquid Assets by Legal Entity 26 242,612 226,666 220,001 213,483 213,757 199,074 209,693 207,976 197,722
Liquidity Coverage Ratio (6) 27 145% 146% 150% 153% 152% 148% 136% 131% 131%
(1) Pledged as collateral refers to the portion of on-balance sheet assets and other cash and securities that is pledged through repurchase agreements, securities lent, derivative contracts, minimum required deposits at central banks and requirements associated with participation in clearing houses and payment systems. Other encumbered assets include assets that are restricted for legal or other reasons, such as restricted cash and short sales.
(2) Other unencumbered assets include select liquid asset holdings that management believes are not readily available to support BMO's liquidity requirements. These include cash and securities of $10.6 billion as at October 31, 2018, which include securities held at BMO’s insurance subsidiary, significant equity investments, and certain investments held at our merchant banking business. Other unencumbered assets also include mortgages and loans that may be securitized to access secured funding.
(3) Loans included as available as collateral represent loans currently lodged at central banks that could potentially be used to access central bank funding. Loans available for pledging as collateral do not include other sources of additional liquidity that may be realized from the loan portfolio, such as incremental securitization, covered bond issuances and FHLB advances.
(4) Average securities balances are shown on page 14.(5) Under IFRS, National Housing Authority (NHA) mortgage-backed securities that include mortgages owned by BMO as the underlying collateral are classified as loans. Unencumbered NHA mortgage-backed securities have liquidity value and
are included as liquid assets under BMO's Liquidity and Funding Management Framework. This amount is shown as a separate line item, NHA mortgage-backed securities. (6) Liquidity Coverage Ratio (LCR) calculated based on daily average balance beginning Q1 2017. LCR in prior periods is based on the average month-end values during the quarter.
DEPOSITS 2018 2018 2018 2018 2017 2017 2017 2017 2016 MIX INC/(DEC)($ millions except as noted) Q4 Q3 Q2 Q1 Q4 Q3 Q2 Q1 Q4 Q4 VS LAST YEAR
Canadian Dollar DepositsBanks 28 3,968 4,157 4,250 2,673 3,877 5,131 6,942 6,631 7,601 0.8 % 91 2.3 %Business and government 29 106,581 106,337 103,082 99,140 101,408 99,018 101,228 101,931 101,461 20.4 % 5,173 5.1 %Individuals 30 114,328 112,762 111,257 110,610 109,694 109,812 110,795 107,602 105,808 21.9 % 4,634 4.2 %
Total 31 224,877 223,256 218,589 212,423 214,979 213,961 218,965 216,164 214,870 43.1 % 9,898 4.6 %
U.S. Dollar and Other Currency Deposits 24 23 22 21 20 19 18 17 16 Banks 32 23,939 24,313 28,094 25,808 24,328 23,510 23,651 22,089 23,888 4.6 % (389) (1.6)%Business and government 33 206,719 195,727 183,288 180,410 181,868 177,411 182,458 180,142 174,444 39.6 % 24,851 13.7 %Individuals 34 66,516 63,620 61,227 56,924 58,617 54,883 59,891 56,242 57,079 12.7 % 7,899 13.5 %
Total 35 297,174 283,660 272,609 263,142 264,813 255,804 266,000 258,473 255,411 56.9 % 32,361 12.2 %Total Deposits 36 522,051 506,916 491,198 475,565 479,792 469,765 484,965 474,637 470,281 100.0 % 42,259 8.8 %Customer Deposits (7) 37 329,215 317,837 310,043 302,716 303,095 295,987 302,767 295,844 295,103 (7) Customer deposits are operating and savings deposits, including term investment certificates and retail structured deposits, primarily sourced through our retail, commercial, wealth and corporate banking businesses.
Encumbered (1) Net Unencumbered Encumbered (1) Net Unencumbered
Other Encumbered
Other Unencumbered
(2)
October 31, 2018 Supplementary Financial Information Page 33
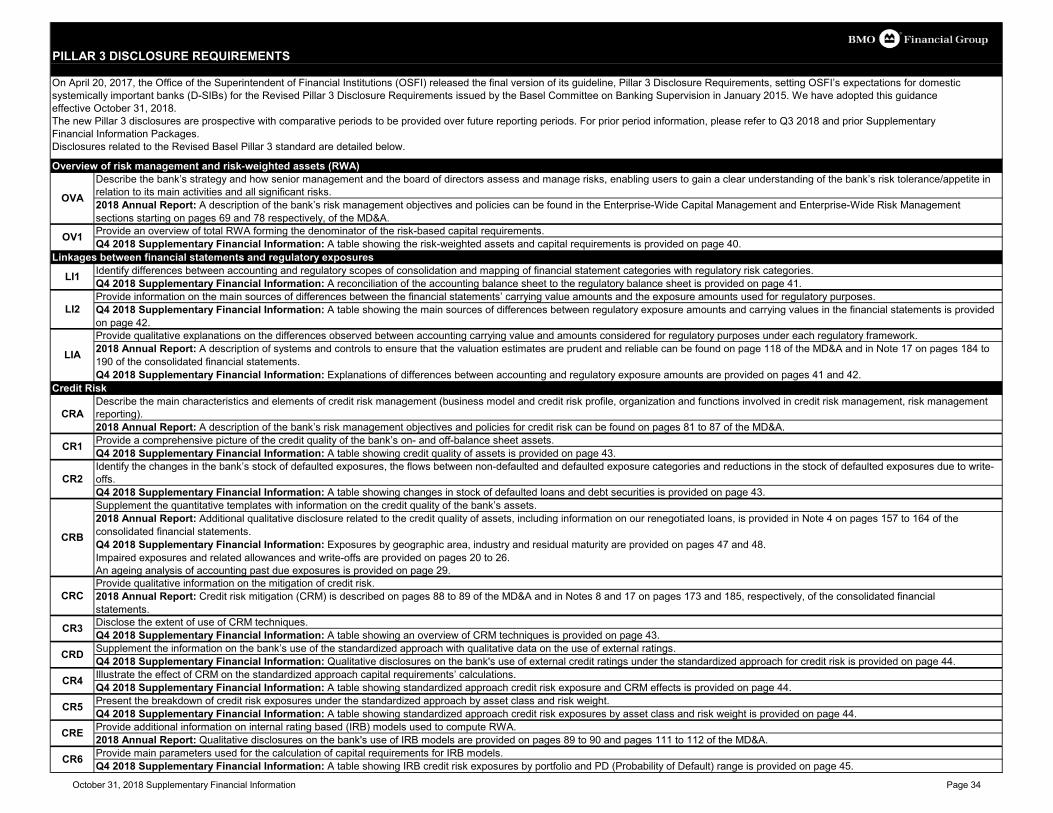
PILLAR 3 DISCLOSURE REQUIREMENTS
On April 20, 2017, the Office of the Superintendent of Financial Institutions (OSFI) released the final version of its guideline, Pillar 3 Disclosure Requirements, setting OSFI’s expectations for domestic systemically important banks (D-SIBs) for the Revised Pillar 3 Disclosure Requirements issued by the Basel Committee on Banking Supervision in January 2015. We have adopted this guidanceeffective October 31, 2018.The new Pillar 3 disclosures are prospective with comparative periods to be provided over future reporting periods. For prior period information, please refer to Q3 2018 and prior Supplementary Financial Information Packages.Disclosures related to the Revised Basel Pillar 3 standard are detailed below.
Overview of risk management and risk-weighted assets (RWA)Describe the bank’s strategy and how senior management and the board of directors assess and manage risks, enabling users to gain a clear understanding of the bank’s risk tolerance/appetite in relation to its main activities and all significant risks. 2018 Annual Report: A description of the bank’s risk management objectives and policies can be found in the Enterprise-Wide Capital Management and Enterprise-Wide Risk Management sections starting on pages 69 and 78 respectively, of the MD&A.Provide an overview of total RWA forming the denominator of the risk-based capital requirements. Q4 2018 Supplementary Financial Information: A table showing the risk-weighted assets and capital requirements is provided on page 40.
Linkages between financial statements and regulatory exposuresIdentify differences between accounting and regulatory scopes of consolidation and mapping of financial statement categories with regulatory risk categories.Q4 2018 Supplementary Financial Information: A reconciliation of the accounting balance sheet to the regulatory balance sheet is provided on page 41.Provide information on the main sources of differences between the financial statements’ carrying value amounts and the exposure amounts used for regulatory purposes.Q4 2018 Supplementary Financial Information: A table showing the main sources of differences between regulatory exposure amounts and carrying values in the financial statements is provided on page 42.Provide qualitative explanations on the differences observed between accounting carrying value and amounts considered for regulatory purposes under each regulatory framework.2018 Annual Report: A description of systems and controls to ensure that the valuation estimates are prudent and reliable can be found on page 118 of the MD&A and in Note 17 on pages 184 to 190 of the consolidated financial statements.Q4 2018 Supplementary Financial Information: Explanations of differences between accounting and regulatory exposure amounts are provided on pages 41 and 42.
Credit RiskDescribe the main characteristics and elements of credit risk management (business model and credit risk profile, organization and functions involved in credit risk management, risk management reporting).2018 Annual Report: A description of the bank’s risk management objectives and policies for credit risk can be found on pages 81 to 87 of the MD&A.Provide a comprehensive picture of the credit quality of the bank’s on- and off-balance sheet assets.Q4 2018 Supplementary Financial Information: A table showing credit quality of assets is provided on page 43.Identify the changes in the bank’s stock of defaulted exposures, the flows between non-defaulted and defaulted exposure categories and reductions in the stock of defaulted exposures due to write-offs.Q4 2018 Supplementary Financial Information: A table showing changes in stock of defaulted loans and debt securities is provided on page 43. Supplement the quantitative templates with information on the credit quality of the bank’s assets.2018 Annual Report: Additional qualitative disclosure related to the credit quality of assets, including information on our renegotiated loans, is provided in Note 4 on pages 157 to 164 of the consolidated financial statements.Q4 2018 Supplementary Financial Information: Exposures by geographic area, industry and residual maturity are provided on pages 47 and 48.Impaired exposures and related allowances and write-offs are provided on pages 20 to 26. An ageing analysis of accounting past due exposures is provided on page 29.Provide qualitative information on the mitigation of credit risk.2018 Annual Report: Credit risk mitigation (CRM) is described on pages 88 to 89 of the MD&A and in Notes 8 and 17 on pages 173 and 185, respectively, of the consolidated financialstatements.Disclose the extent of use of CRM techniques.Q4 2018 Supplementary Financial Information: A table showing an overview of CRM techniques is provided on page 43.Supplement the information on the bank’s use of the standardized approach with qualitative data on the use of external ratings.Q4 2018 Supplementary Financial Information: Qualitative disclosures on the bank's use of external credit ratings under the standardized approach for credit risk is provided on page 44.Illustrate the effect of CRM on the standardized approach capital requirements’ calculations.Q4 2018 Supplementary Financial Information: A table showing standardized approach credit risk exposure and CRM effects is provided on page 44.Present the breakdown of credit risk exposures under the standardized approach by asset class and risk weight.Q4 2018 Supplementary Financial Information: A table showing standardized approach credit risk exposures by asset class and risk weight is provided on page 44.Provide additional information on internal rating based (IRB) models used to compute RWA.2018 Annual Report: Qualitative disclosures on the bank's use of IRB models are provided on pages 89 to 90 and pages 111 to 112 of the MD&A.Provide main parameters used for the calculation of capital requirements for IRB models. Q4 2018 Supplementary Financial Information: A table showing IRB credit risk exposures by portfolio and PD (Probability of Default) range is provided on page 45.CR6
CR4
CR5
CRE
CR1
CR2
CRB
CRC
CR3
CRD
CRA
OVA
OV1
LI1
LI2
LIA
October 31, 2018 Supplementary Financial Information Page 34
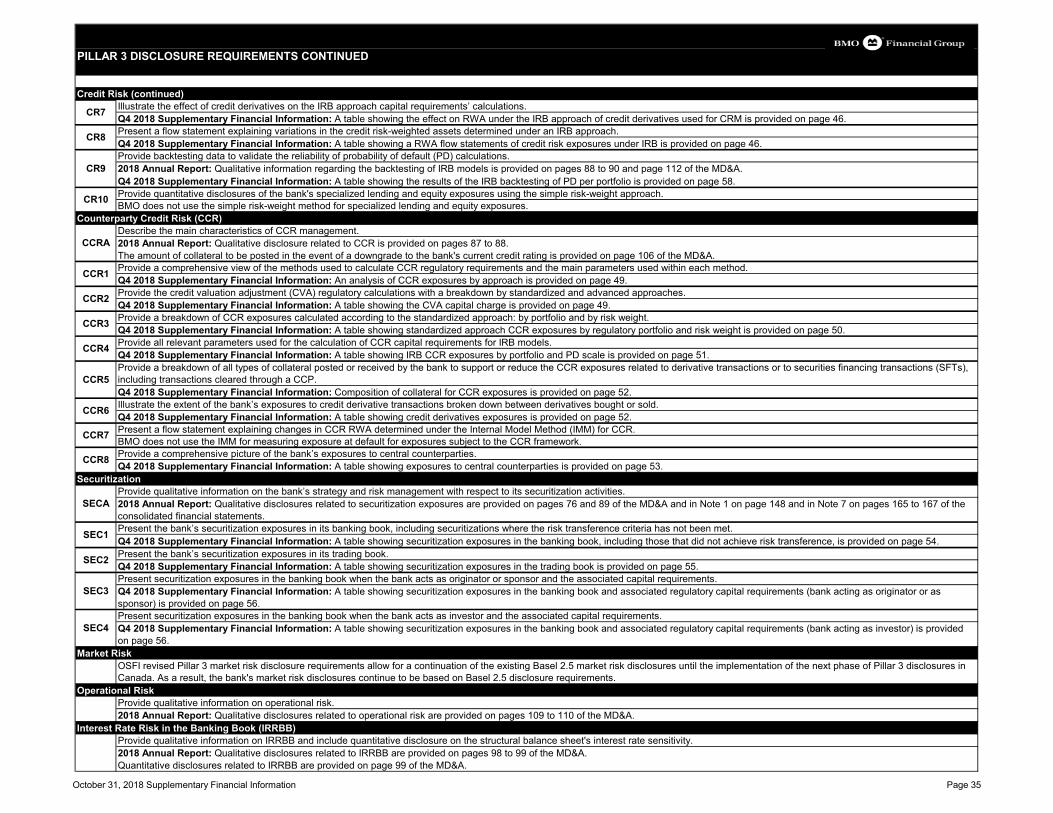
PILLAR 3 DISCLOSURE REQUIREMENTS CONTINUED
Credit Risk (continued)Illustrate the effect of credit derivatives on the IRB approach capital requirements’ calculations. Q4 2018 Supplementary Financial Information: A table showing the effect on RWA under the IRB approach of credit derivatives used for CRM is provided on page 46.Present a flow statement explaining variations in the credit risk-weighted assets determined under an IRB approach.Q4 2018 Supplementary Financial Information: A table showing a RWA flow statements of credit risk exposures under IRB is provided on page 46.Provide backtesting data to validate the reliability of probability of default (PD) calculations. 2018 Annual Report: Qualitative information regarding the backtesting of IRB models is provided on pages 88 to 90 and page 112 of the MD&A.Q4 2018 Supplementary Financial Information: A table showing the results of the IRB backtesting of PD per portfolio is provided on page 58.Provide quantitative disclosures of the bank's specialized lending and equity exposures using the simple risk-weight approach.BMO does not use the simple risk-weight method for specialized lending and equity exposures.
Counterparty Credit Risk (CCR)Describe the main characteristics of CCR management.2018 Annual Report: Qualitative disclosure related to CCR is provided on pages 87 to 88.The amount of collateral to be posted in the event of a downgrade to the bank's current credit rating is provided on page 106 of the MD&A.Provide a comprehensive view of the methods used to calculate CCR regulatory requirements and the main parameters used within each method.Q4 2018 Supplementary Financial Information: An analysis of CCR exposures by approach is provided on page 49.Provide the credit valuation adjustment (CVA) regulatory calculations with a breakdown by standardized and advanced approaches.Q4 2018 Supplementary Financial Information: A table showing the CVA capital charge is provided on page 49.Provide a breakdown of CCR exposures calculated according to the standardized approach: by portfolio and by risk weight.Q4 2018 Supplementary Financial Information: A table showing standardized approach CCR exposures by regulatory portfolio and risk weight is provided on page 50.Provide all relevant parameters used for the calculation of CCR capital requirements for IRB models.Q4 2018 Supplementary Financial Information: A table showing IRB CCR exposures by portfolio and PD scale is provided on page 51.Provide a breakdown of all types of collateral posted or received by the bank to support or reduce the CCR exposures related to derivative transactions or to securities financing transactions (SFTs), including transactions cleared through a CCP.Q4 2018 Supplementary Financial Information: Composition of collateral for CCR exposures is provided on page 52.Illustrate the extent of the bank’s exposures to credit derivative transactions broken down between derivatives bought or sold.Q4 2018 Supplementary Financial Information: A table showing credit derivatives exposures is provided on page 52.Present a flow statement explaining changes in CCR RWA determined under the Internal Model Method (IMM) for CCR.BMO does not use the IMM for measuring exposure at default for exposures subject to the CCR framework. Provide a comprehensive picture of the bank’s exposures to central counterparties. Q4 2018 Supplementary Financial Information: A table showing exposures to central counterparties is provided on page 53.
SecuritizationProvide qualitative information on the bank’s strategy and risk management with respect to its securitization activities.2018 Annual Report: Qualitative disclosures related to securitization exposures are provided on pages 76 and 89 of the MD&A and in Note 1 on page 148 and in Note 7 on pages 165 to 167 of the consolidated financial statements.Present the bank’s securitization exposures in its banking book, including securitizations where the risk transference criteria has not been met.Q4 2018 Supplementary Financial Information: A table showing securitization exposures in the banking book, including those that did not achieve risk transference, is provided on page 54.Present the bank’s securitization exposures in its trading book.Q4 2018 Supplementary Financial Information: A table showing securitization exposures in the trading book is provided on page 55.Present securitization exposures in the banking book when the bank acts as originator or sponsor and the associated capital requirements.Q4 2018 Supplementary Financial Information: A table showing securitization exposures in the banking book and associated regulatory capital requirements (bank acting as originator or as sponsor) is provided on page 56.Present securitization exposures in the banking book when the bank acts as investor and the associated capital requirements.Q4 2018 Supplementary Financial Information: A table showing securitization exposures in the banking book and associated regulatory capital requirements (bank acting as investor) is provided on page 56.
Market RiskOSFI revised Pillar 3 market risk disclosure requirements allow for a continuation of the existing Basel 2.5 market risk disclosures until the implementation of the next phase of Pillar 3 disclosures in Canada. As a result, the bank's market risk disclosures continue to be based on Basel 2.5 disclosure requirements.
Operational RiskProvide qualitative information on operational risk.2018 Annual Report: Qualitative disclosures related to operational risk are provided on pages 109 to 110 of the MD&A.
Interest Rate Risk in the Banking Book (IRRBB)Provide qualitative information on IRRBB and include quantitative disclosure on the structural balance sheet's interest rate sensitivity.2018 Annual Report: Qualitative disclosures related to IRRBB are provided on pages 98 to 99 of the MD&A.Quantitative disclosures related to IRRBB are provided on page 99 of the MD&A.
SEC4
CCR7
CCR8
SECA
SEC1
SEC2
SEC3
CCR6
CR7
CR8
CR9
CR10
CCR1
CCR2
CCR3
CCR4
CCR5
CCRA
October 31, 2018 Supplementary Financial Information Page 35
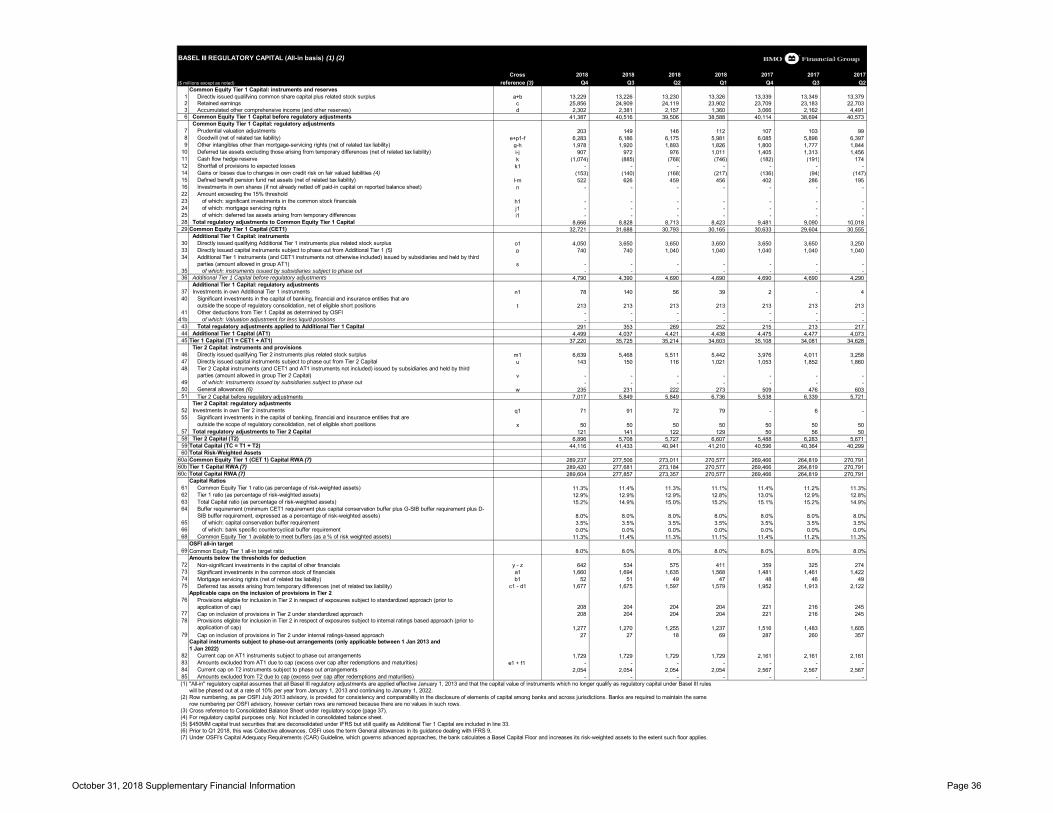
BASEL III REGULATORY CAPITAL (All-in basis) (1) (2)
Cross 2018 2018 2018 2018 2017 2017 2017($ millions except as noted) reference (3) Q4 Q3 Q2 Q1 Q4 Q3 Q2
Common Equity Tier 1 Capital: instruments and reserves1 Directly issued qualifying common share capital plus related stock surplus a+b 13,229 13,226 13,230 13,326 13,339 13,349 13,379 2 Retained earnings c 25,856 24,909 24,119 23,902 23,709 23,183 22,703 3 Accumulated other comprehensive income (and other reserves) d 2,302 2,381 2,157 1,360 3,066 2,162 4,491 6 Common Equity Tier 1 Capital before regulatory adjustments 41,387 40,516 39,506 38,588 40,114 38,694 40,573
Common Equity Tier 1 Capital: regulatory adjustments7 Prudential valuation adjustments 203 149 146 112 107 103 99 8 Goodwill (net of related tax liability) e+p1-f 6,283 6,186 6,175 5,981 6,085 5,896 6,397 9 Other intangibles other than mortgage-servicing rights (net of related tax liability) g-h 1,978 1,920 1,893 1,826 1,800 1,777 1,844
10 Deferred tax assets excluding those arising from temporary differences (net of related tax liability) i-j 907 972 976 1,011 1,405 1,313 1,456 11 Cash flow hedge reserve k (1,074) (885) (768) (746) (182) (191) 174 12 Shortfall of provisions to expected losses k1 - - - - - - - 14 Gains or losses due to changes in own credit risk on fair valued liabilities (4) (153) (140) (168) (217) (136) (94) (147) 15 Defined benefit pension fund net assets (net of related tax liability) l-m 522 626 459 456 402 286 195 16 Investments in own shares (if not already netted off paid-in capital on reported balance sheet) n - - - - - - - 22 Amount exceeding the 15% threshold23 of which: significant investments in the common stock financials h1 - - - - - - - 24 of which: mortgage servicing rights j1 - - - - - - - 25 of which: deferred tax assets arising from temporary differences i1 - - - - - - - 28 Total regulatory adjustments to Common Equity Tier 1 Capital 8,666 8,828 8,713 8,423 9,481 9,090 10,018 29 Common Equity Tier 1 Capital (CET1) 32,721 31,688 30,793 30,165 30,633 29,604 30,555
Additional Tier 1 Capital: instruments30 Directly issued qualifying Additional Tier 1 instruments plus related stock surplus o1 4,050 3,650 3,650 3,650 3,650 3,650 3,250 33 Directly issued capital instruments subject to phase out from Additional Tier 1 (5) p 740 740 1,040 1,040 1,040 1,040 1,040 34 Additional Tier 1 instruments (and CET1 instruments not otherwise included) issued by subsidiaries and held by third
parties (amount allowed in group AT1) s - - - - - - - 35 of which: instruments issued by subsidiaries subject to phase out - - - - - - - 36 Additional Tier 1 Capital before regulatory adjustments 4,790 4,390 4,690 4,690 4,690 4,690 4,290
Additional Tier 1 Capital: regulatory adjustments37 Investments in own Additional Tier 1 instruments n1 78 140 56 39 2 - 4 40 Significant investments in the capital of banking, financial and insurance entities that are
outside the scope of regulatory consolidation, net of eligible short positions t 213 213 213 213 213 213 213 41 Other deductions from Tier 1 Capital as determined by OSFI - - - - - - -
41b of which: Valuation adjustment for less liquid positions - - - - - - - 43 Total regulatory adjustments applied to Additional Tier 1 Capital 291 353 269 252 215 213 217 44 Additional Tier 1 Capital (AT1) 4,499 4,037 4,421 4,438 4,475 4,477 4,073 45 Tier 1 Capital (T1 = CET1 + AT1) 37,220 35,725 35,214 34,603 35,108 34,081 34,628
Tier 2 Capital: instruments and provisions46 Directly issued qualifying Tier 2 instruments plus related stock surplus m1 6,639 5,468 5,511 5,442 3,976 4,011 3,258 47 Directly issued capital instruments subject to phase out from Tier 2 Capital u 143 150 116 1,021 1,053 1,852 1,860 48 Tier 2 Capital instruments (and CET1 and AT1 instruments not included) issued by subsidiaries and held by third
parties (amount allowed in group Tier 2 Capital) v - - - - - - - 49 of which: instruments issued by subsidiaries subject to phase out - - - - - - - 50 General allowances (6) w 235 231 222 273 509 476 603 51 Tier 2 Capital before regulatory adjustments 7,017 5,849 5,849 6,736 5,538 6,339 5,721
Tier 2 Capital: regulatory adjustments52 Investments in own Tier 2 instruments q1 71 91 72 79 - 6 - 55 Significant investments in the capital of banking, financial and insurance entities that are
outside the scope of regulatory consolidation, net of eligible short positions x 50 50 50 50 50 50 50 57 Total regulatory adjustments to Tier 2 Capital 121 141 122 129 50 56 50 58 Tier 2 Capital (T2) 6,896 5,708 5,727 6,607 5,488 6,283 5,671 59 Total Capital (TC = T1 + T2) 44,116 41,433 40,941 41,210 40,596 40,364 40,299 60 Total Risk-Weighted Assets
60a Common Equity Tier 1 (CET 1) Capital RWA (7) 289,237 277,506 273,011 270,577 269,466 264,819 270,791 60b Tier 1 Capital RWA (7) 289,420 277,681 273,184 270,577 269,466 264,819 270,791 60c Total Capital RWA (7) 289,604 277,857 273,357 270,577 269,466 264,819 270,791
Capital Ratios61 Common Equity Tier 1 ratio (as percentage of risk-weighted assets) 11.3% 11.4% 11.3% 11.1% 11.4% 11.2% 11.3%62 Tier 1 ratio (as percentage of risk-weighted assets) 12.9% 12.9% 12.9% 12.8% 13.0% 12.9% 12.8%63 Total Capital ratio (as percentage of risk-weighted assets) 15.2% 14.9% 15.0% 15.2% 15.1% 15.2% 14.9%64 Buffer requirement (minimum CET1 requirement plus capital conservation buffer plus G-SIB buffer requirement plus D-
SIB buffer requirement, expressed as a percentage of risk-weighted assets) 8.0% 8.0% 8.0% 8.0% 8.0% 8.0% 8.0%65 of which: capital conservation buffer requirement 3.5% 3.5% 3.5% 3.5% 3.5% 3.5% 3.5%66 of which: bank specific countercyclical buffer requirement 0.0% 0.0% 0.0% 0.0% 0.0% 0.0% 0.0%68 Common Equity Tier 1 available to meet buffers (as a % of risk weighted assets) 11.3% 11.4% 11.3% 11.1% 11.4% 11.2% 11.3%
OSFI all-in target69 Common Equity Tier 1 all-in target ratio 8.0% 8.0% 8.0% 8.0% 8.0% 8.0% 8.0%
Amounts below the thresholds for deduction72 Non-significant investments in the capital of other financials y - z 642 534 575 411 359 325 274 73 Significant investments in the common stock of financials a1 1,660 1,694 1,635 1,568 1,481 1,461 1,422 74 Mortgage servicing rights (net of related tax liability) b1 52 51 49 47 48 46 49 75 Deferred tax assets arising from temporary differences (net of related tax liability) c1 - d1 1,677 1,675 1,597 1,579 1,952 1,913 2,122
Applicable caps on the inclusion of provisions in Tier 276 Provisions eligible for inclusion in Tier 2 in respect of exposures subject to standardized approach (prior to
application of cap) 208 204 204 204 221 216 245 77 Cap on inclusion of provisions in Tier 2 under standardized approach 208 204 204 204 221 216 245 78 Provisions eligible for inclusion in Tier 2 in respect of exposures subject to internal ratings based approach (prior to
application of cap) 1,277 1,270 1,255 1,237 1,516 1,483 1,605 79 Cap on inclusion of provisions in Tier 2 under internal ratings-based approach 27 27 18 69 287 260 357
Capital instruments subject to phase-out arrangements (only applicable between 1 Jan 2013 and 1 Jan 2022)
82 Current cap on AT1 instruments subject to phase out arrangements 1,729 1,729 1,729 1,729 2,161 2,161 2,161 83 Amounts excluded from AT1 due to cap (excess over cap after redemptions and maturities) e1 + f1 - - - - - - - 84 Current cap on T2 instruments subject to phase out arrangements 2,054 2,054 2,054 2,054 2,567 2,567 2,567 85 Amounts excluded from T2 due to cap (excess over cap after redemptions and maturities) - - - - - - - (1) "All-in" regulatory capital assumes that all Basel III regulatory adjustments are applied effective January 1, 2013 and that the capital value of instruments which no longer qualify as regulatory capital under Basel III rules
will be phased out at a rate of 10% per year from January 1, 2013 and continuing to January 1, 2022.(2) Row numbering, as per OSFI July 2013 advisory, is provided for consistency and comparability in the disclosure of elements of capital among banks and across jurisdictions. Banks are required to maintain the same
row numbering per OSFI advisory, however certain rows are removed because there are no values in such rows.(3) Cross reference to Consolidated Balance Sheet under regulatory scope (page 37).(4) For regulatory capital purposes only. Not included in consolidated balance sheet.(5) $450MM capital trust securities that are deconsolidated under IFRS but still qualify as Additional Tier 1 Capital are included in line 33.(6) Prior to Q1 2018, this was Collective allowances. OSFI uses the term General allowances in its guidance dealing with IFRS 9.(7) Under OSFI's Capital Adequacy Requirements (CAR) Guideline, which governs advanced approaches, the bank calculates a Basel Capital Floor and increases its risk-weighted assets to the extent such floor applies.
October 31, 2018 Supplementary Financial Information Page 36
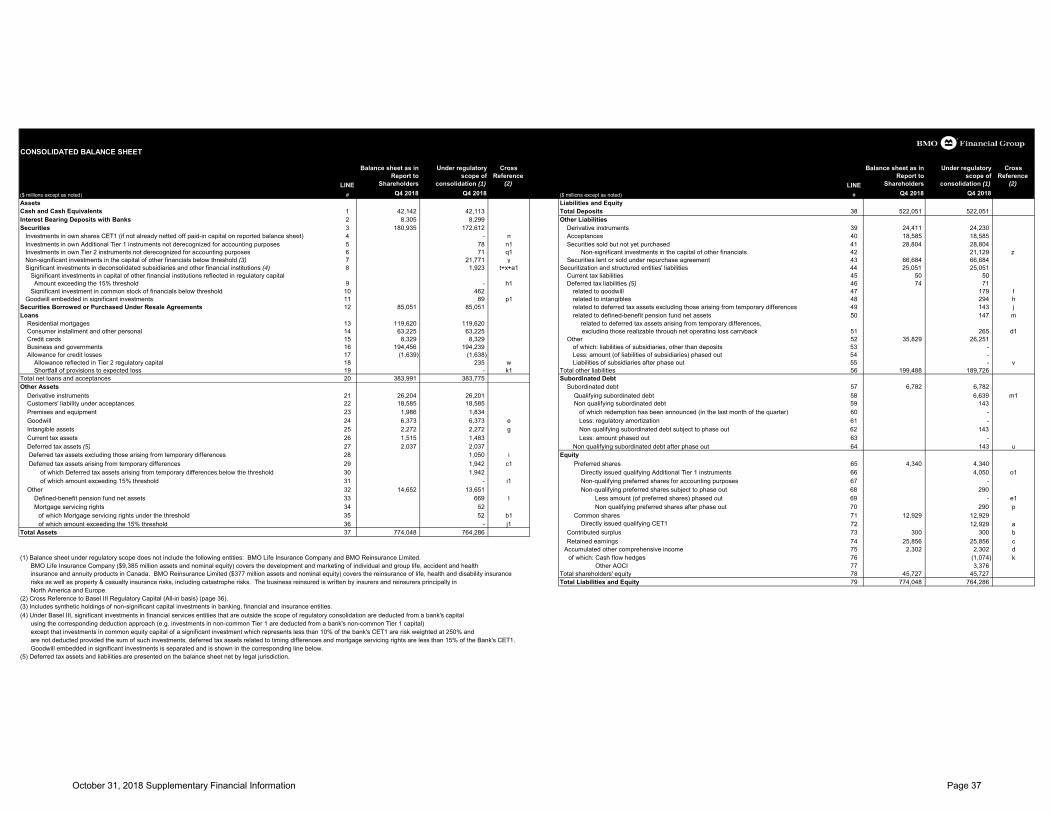
CONSOLIDATED BALANCE SHEET
LINE
Balance sheet as in Report to
Shareholders
Under regulatory scope of
consolidation (1)
Cross Reference
(2) LINE
Balance sheet as in Report to
Shareholders
Under regulatory scope of
consolidation (1)
Cross Reference
(2)
($ millions except as noted) # Q4 2018 Q4 2018 ($ millions except as noted) # Q4 2018 Q4 2018Assets Liabilities and EquityCash and Cash Equivalents 1 42,142 42,113 Total Deposits 38 522,051 522,051 Interest Bearing Deposits with Banks 2 8,305 8,299 Other LiabilitiesSecurities 3 180,935 172,612 Derivative instruments 39 24,411 24,230 Investments in own shares CET1 (if not already netted off paid-in capital on reported balance sheet) 4 - n Acceptances 40 18,585 18,585 Investments in own Additional Tier 1 instruments not derecognized for accounting purposes 5 78 n1 Securities sold but not yet purchased 41 28,804 28,804 Investments in own Tier 2 instruments not derecognized for accounting purposes 6 71 q1 Non-significant investments in the capital of other financials 42 21,129 z Non-significant investments in the capital of other financials below threshold (3) 7 21,771 y Securities lent or sold under repurchase agreement 43 66,684 66,684 Significant investments in deconsolidated subsidiaries and other financial institutions (4) 8 1,923 t+x+a1 Securitization and structured entities' liabilities 44 25,051 25,051 Significant investments in capital of other financial institutions reflected in regulatory capital Current tax liabilities 45 50 50 Amount exceeding the 15% threshold 9 - h1 Deferred tax liabilities (5) 46 74 71 Significant investment in common stock of financials below threshold 10 462 related to goodwill 47 179 f Goodwill embedded in significant investments 11 89 p1 related to intangibles 48 294 hSecurities Borrowed or Purchased Under Resale Agreements 12 85,051 85,051 related to deferred tax assets excluding those arising from temporary differences 49 143 jLoans related to defined-benefit pension fund net assets 50 147 m Residential mortgages 13 119,620 119,620 related to deferred tax assets arising from temporary differences, Consumer installment and other personal 14 63,225 63,225 excluding those realizable through net operating loss carryback 51 265 d1 Credit cards 15 8,329 8,329 Other 52 35,829 26,251 Business and governments 16 194,456 194,239 of which: liabilities of subsidiaries, other than deposits 53 - Allowance for credit losses 17 (1,639) (1,638) Less: amount (of liabilities of subsidiaries) phased out 54 - Allowance reflected in Tier 2 regulatory capital 18 235 w Liabilities of subsidiaries after phase out 55 - v Shortfall of provisions to expected loss 19 - k1 Total other liabilities 56 199,488 189,726 Total net loans and acceptances 20 383,991 383,775 Subordinated DebtOther Assets Subordinated debt 57 6,782 6,782 Derivative instruments 21 26,204 26,201 Qualifying subordinated debt 58 6,639 m1 Customers' liability under acceptances 22 18,585 18,585 Non qualifying subordinated debt 59 143 Premises and equipment 23 1,986 1,834 of which redemption has been announced (in the last month of the quarter) 60 - Goodwill 24 6,373 6,373 e Less: regulatory amortization 61 - Intangible assets 25 2,272 2,272 g Non qualifying subordinated debt subject to phase out 62 143 Current tax assets 26 1,515 1,483 Less: amount phased out 63 - Deferred tax assets (5) 27 2,037 2,037 Non qualifying subordinated debt after phase out 64 143 u
Deferred tax assets excluding those arising from temporary differences 28 1,050 i EquityDeferred tax assets arising from temporary differences 29 1,942 c1 Preferred shares 65 4,340 4,340
of which Deferred tax assets arising from temporary differences below the threshold 30 1,942 Directly issued qualifying Additional Tier 1 instruments 66 4,050 o1 of which amount exceeding 15% threshold 31 - i1 Non-qualifying preferred shares for accounting purposes 67 -
Other 32 14,652 13,651 Non-qualifying preferred shares subject to phase out 68 290 Defined-benefit pension fund net assets 33 669 l Less amount (of preferred shares) phased out 69 - e1 Mortgage servicing rights 34 52 Non qualifying preferred shares after phase out 70 290 p
of which Mortgage servicing rights under the threshold 35 52 b1 Common shares 71 12,929 12,929 of which amount exceeding the 15% threshold 36 - j1 Directly issued qualifying CET1 72 12,929 a
Total Assets 37 774,048 764,286 Contributed surplus 73 300 300 b Retained earnings 74 25,856 25,856 c
Accumulated other comprehensive income 75 2,302 2,302 d(1) Balance sheet under regulatory scope does not include the following entities: BMO Life Insurance Company and BMO Reinsurance Limited. of which: Cash flow hedges 76 (1,074) k BMO Life Insurance Company ($9,385 million assets and nominal equity) covers the development and marketing of individual and group life, accident and health Other AOCI 77 3,376 insurance and annuity products in Canada. BMO Reinsurance Limited ($377 million assets and nominal equity) covers the reinsurance of life, health and disability insurance Total shareholders' equity 78 45,727 45,727 risks as well as property & casualty insurance risks, including catastrophe risks. The business reinsured is written by insurers and reinsurers principally in Total Liabilities and Equity 79 774,048 764,286 North America and Europe. (2) Cross Reference to Basel III Regulatory Capital (All-in basis) (page 36).(3) Includes synthetic holdings of non-significant capital investments in banking, financial and insurance entities.(4) Under Basel III, significant investments in financial services entities that are outside the scope of regulatory consolidation are deducted from a bank's capital using the corresponding deduction approach (e.g. investments in non-common Tier 1 are deducted from a bank's non-common Tier 1 capital) except that investments in common equity capital of a significant investment which represents less than 10% of the bank's CET1 are risk weighted at 250% and are not deducted provided the sum of such investments, deferred tax assets related to timing differences and mortgage servicing rights are less than 15% of the Bank's CET1. Goodwill embedded in significant investments is separated and is shown in the corresponding line below.(5) Deferred tax assets and liabilities are presented on the balance sheet net by legal jurisdiction.
October 31, 2018 Supplementary Financial Information Page 37
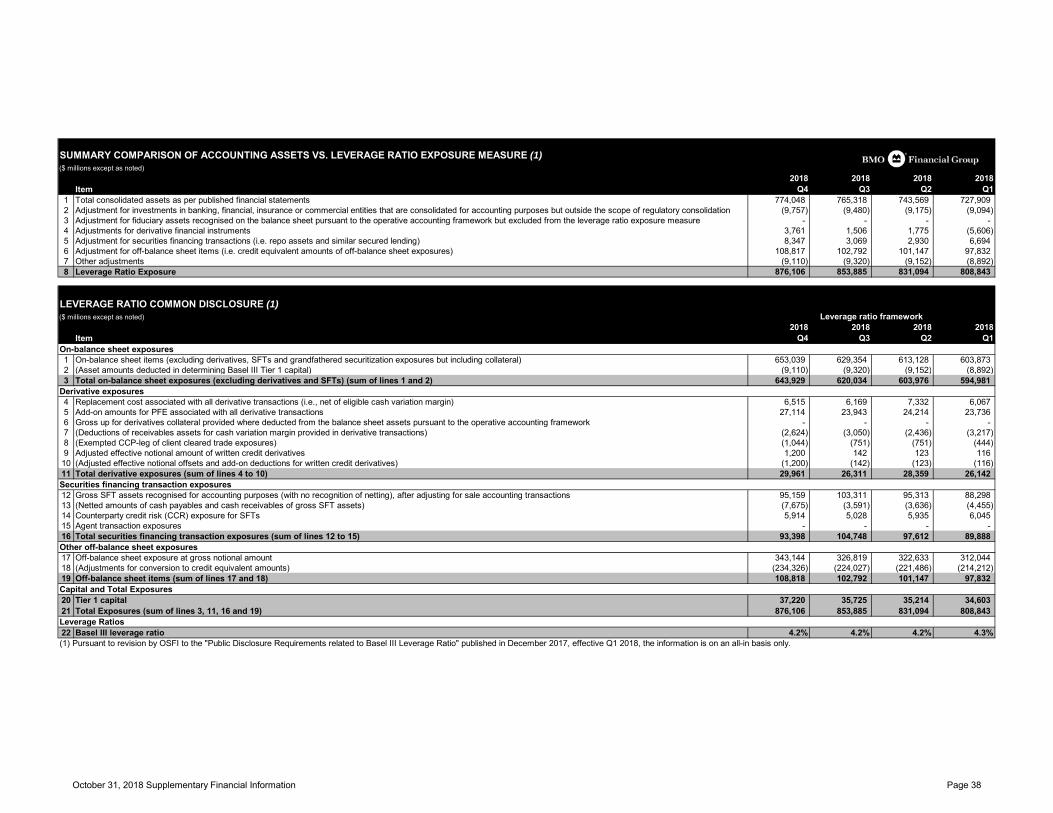
SUMMARY COMPARISON OF ACCOUNTING ASSETS VS. LEVERAGE RATIO EXPOSURE MEASURE (1)($ millions except as noted)
2018 2018 2018 2018Item Q4 Q3 Q2 Q1
1 Total consolidated assets as per published financial statements 774,048 765,318 743,569 727,909 2 Adjustment for investments in banking, financial, insurance or commercial entities that are consolidated for accounting purposes but outside the scope of regulatory consolidation (9,757) (9,480) (9,175) (9,094) 3 Adjustment for fiduciary assets recognised on the balance sheet pursuant to the operative accounting framework but excluded from the leverage ratio exposure measure - - - - 4 Adjustments for derivative financial instruments 3,761 1,506 1,775 (5,606) 5 Adjustment for securities financing transactions (i.e. repo assets and similar secured lending) 8,347 3,069 2,930 6,694 6 Adjustment for off-balance sheet items (i.e. credit equivalent amounts of off-balance sheet exposures) 108,817 102,792 101,147 97,832 7 Other adjustments (9,110) (9,320) (9,152) (8,892) 8 Leverage Ratio Exposure 876,106 853,885 831,094 808,843
LEVERAGE RATIO COMMON DISCLOSURE (1)($ millions except as noted)
2018 2018 2018 2018Item Q4 Q3 Q2 Q1
On-balance sheet exposures1 On-balance sheet items (excluding derivatives, SFTs and grandfathered securitization exposures but including collateral) 653,039 629,354 613,128 603,873 2 (Asset amounts deducted in determining Basel III Tier 1 capital) (9,110) (9,320) (9,152) (8,892) 3 Total on-balance sheet exposures (excluding derivatives and SFTs) (sum of lines 1 and 2) 643,929 620,034 603,976 594,981
Derivative exposures4 Replacement cost associated with all derivative transactions (i.e., net of eligible cash variation margin) 6,515 6,169 7,332 6,067 5 Add-on amounts for PFE associated with all derivative transactions 27,114 23,943 24,214 23,736 6 Gross up for derivatives collateral provided where deducted from the balance sheet assets pursuant to the operative accounting framework - - - - 7 (Deductions of receivables assets for cash variation margin provided in derivative transactions) (2,624) (3,050) (2,436) (3,217) 8 (Exempted CCP-leg of client cleared trade exposures) (1,044) (751) (751) (444) 9 Adjusted effective notional amount of written credit derivatives 1,200 142 123 116
10 (Adjusted effective notional offsets and add-on deductions for written credit derivatives) (1,200) (142) (123) (116) 11 Total derivative exposures (sum of lines 4 to 10) 29,961 26,311 28,359 26,142 Securities financing transaction exposures12 Gross SFT assets recognised for accounting purposes (with no recognition of netting), after adjusting for sale accounting transactions 95,159 103,311 95,313 88,298 13 (Netted amounts of cash payables and cash receivables of gross SFT assets) (7,675) (3,591) (3,636) (4,455) 14 Counterparty credit risk (CCR) exposure for SFTs 5,914 5,028 5,935 6,045 15 Agent transaction exposures - - - - 16 Total securities financing transaction exposures (sum of lines 12 to 15) 93,398 104,748 97,612 89,888 Other off-balance sheet exposures17 Off-balance sheet exposure at gross notional amount 343,144 326,819 322,633 312,044 18 (Adjustments for conversion to credit equivalent amounts) (234,326) (224,027) (221,486) (214,212) 19 Off-balance sheet items (sum of lines 17 and 18) 108,818 102,792 101,147 97,832 Capital and Total Exposures20 Tier 1 capital 37,220 35,725 35,214 34,603 21 Total Exposures (sum of lines 3, 11, 16 and 19) 876,106 853,885 831,094 808,843 Leverage Ratios22 Basel III leverage ratio 4.2% 4.2% 4.2% 4.3%(1) Pursuant to revision by OSFI to the "Public Disclosure Requirements related to Basel III Leverage Ratio" published in December 2017, effective Q1 2018, the information is on an all-in basis only.
Leverage ratio framework
October 31, 2018 Supplementary Financial Information Page 38
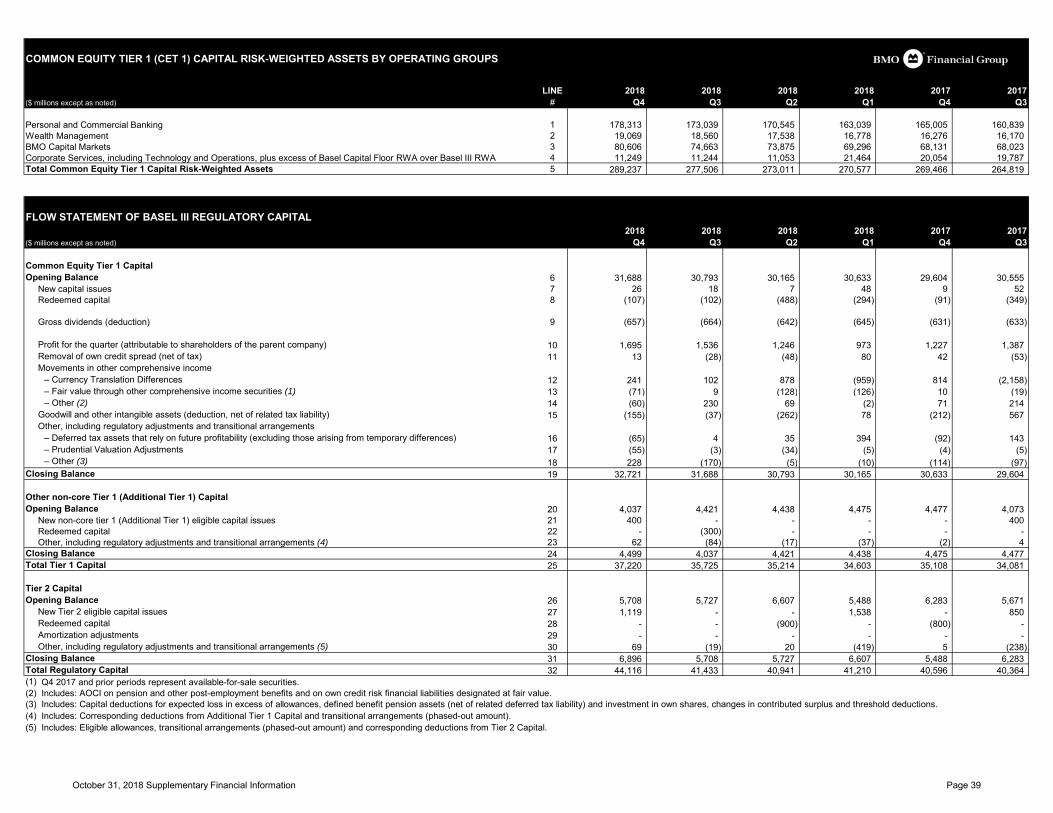
COMMON EQUITY TIER 1 (CET 1) CAPITAL RISK-WEIGHTED ASSETS BY OPERATING GROUPS
LINE 2018 2018 2018 2018 2017 2017($ millions except as noted) # Q4 Q3 Q2 Q1 Q4 Q3
Personal and Commercial Banking 1 178,313 173,039 170,545 163,039 165,005 160,839 Wealth Management 2 19,069 18,560 17,538 16,778 16,276 16,170 BMO Capital Markets 3 80,606 74,663 73,875 69,296 68,131 68,023 Corporate Services, including Technology and Operations, plus excess of Basel Capital Floor RWA over Basel III RWA 4 11,249 11,244 11,053 21,464 20,054 19,787 Total Common Equity Tier 1 Capital Risk-Weighted Assets 5 289,237 277,506 273,011 270,577 269,466 264,819
FLOW STATEMENT OF BASEL III REGULATORY CAPITAL 2018 2018 2018 2018 2017 2017
($ millions except as noted) Q4 Q3 Q2 Q1 Q4 Q3
Common Equity Tier 1 CapitalOpening Balance 6 31,688 30,793 30,165 30,633 29,604 30,555
New capital issues 7 26 18 7 48 9 52 Redeemed capital 8 (107) (102) (488) (294) (91) (349)
Gross dividends (deduction) 9 (657) (664) (642) (645) (631) (633)
Profit for the quarter (attributable to shareholders of the parent company) 10 1,695 1,536 1,246 973 1,227 1,387 Removal of own credit spread (net of tax) 11 13 (28) (48) 80 42 (53) Movements in other comprehensive income
– Currency Translation Differences 12 241 102 878 (959) 814 (2,158) – Fair value through other comprehensive income securities (1) 13 (71) 9 (128) (126) 10 (19) – Other (2) 14 (60) 230 69 (2) 71 214
Goodwill and other intangible assets (deduction, net of related tax liability) 15 (155) (37) (262) 78 (212) 567 Other, including regulatory adjustments and transitional arrangements
– Deferred tax assets that rely on future profitability (excluding those arising from temporary differences) 16 (65) 4 35 394 (92) 143 – Prudential Valuation Adjustments 17 (55) (3) (34) (5) (4) (5) – Other (3) 18 228 (170) (5) (10) (114) (97)
Closing Balance 19 32,721 31,688 30,793 30,165 30,633 29,604
Other non-core Tier 1 (Additional Tier 1) Capital Opening Balance 20 4,037 4,421 4,438 4,475 4,477 4,073
New non-core tier 1 (Additional Tier 1) eligible capital issues 21 400 - - - - 400 Redeemed capital 22 - (300) - - - - Other, including regulatory adjustments and transitional arrangements (4) 23 62 (84) (17) (37) (2) 4
Closing Balance 24 4,499 4,037 4,421 4,438 4,475 4,477 Total Tier 1 Capital 25 37,220 35,725 35,214 34,603 35,108 34,081
Tier 2 CapitalOpening Balance 26 5,708 5,727 6,607 5,488 6,283 5,671
New Tier 2 eligible capital issues 27 1,119 - - 1,538 - 850 Redeemed capital 28 - - (900) - (800) - Amortization adjustments 29 - - - - - - Other, including regulatory adjustments and transitional arrangements (5) 30 69 (19) 20 (419) 5 (238)
Closing Balance 31 6,896 5,708 5,727 6,607 5,488 6,283 Total Regulatory Capital 32 44,116 41,433 40,941 41,210 40,596 40,364 (1) Q4 2017 and prior periods represent available-for-sale securities.(2) Includes: AOCI on pension and other post-employment benefits and on own credit risk financial liabilities designated at fair value.(3) Includes: Capital deductions for expected loss in excess of allowances, defined benefit pension assets (net of related deferred tax liability) and investment in own shares, changes in contributed surplus and threshold deductions.(4) Includes: Corresponding deductions from Additional Tier 1 Capital and transitional arrangements (phased-out amount).(5) Includes: Eligible allowances, transitional arrangements (phased-out amount) and corresponding deductions from Tier 2 Capital.
October 31, 2018 Supplementary Financial Information Page 39
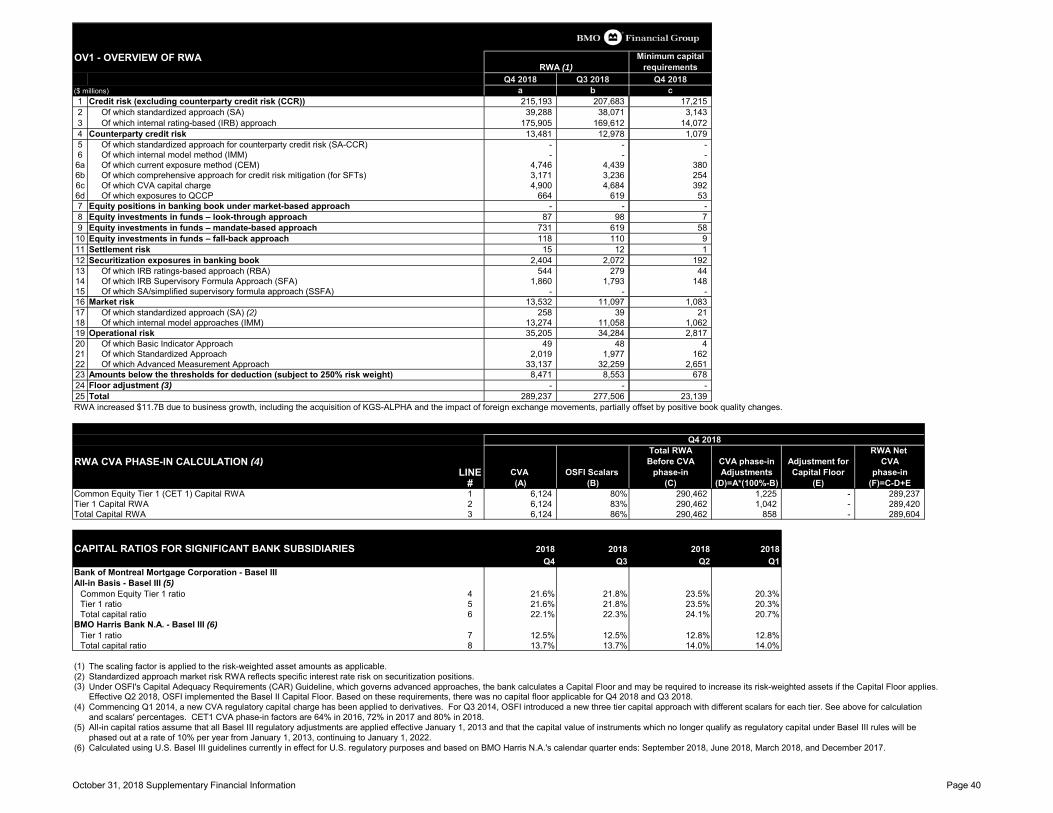
OV1 - OVERVIEW OF RWA Minimum capital requirements
Q4 2018 Q3 2018 Q4 2018($ millions) a b c1 Credit risk (excluding counterparty credit risk (CCR)) 215,193 207,683 17,2152 Of which standardized approach (SA) 39,288 38,071 3,1433 Of which internal rating-based (IRB) approach 175,905 169,612 14,0724 Counterparty credit risk 13,481 12,978 1,0795 Of which standardized approach for counterparty credit risk (SA-CCR) - - -6 Of which internal model method (IMM) - - -6a Of which current exposure method (CEM) 4,746 4,439 3806b Of which comprehensive approach for credit risk mitigation (for SFTs) 3,171 3,236 2546c Of which CVA capital charge 4,900 4,684 3926d Of which exposures to QCCP 664 619 537 Equity positions in banking book under market-based approach - - -8 Equity investments in funds – look-through approach 87 98 79 Equity investments in funds – mandate-based approach 731 619 5810 Equity investments in funds – fall-back approach 118 110 911 Settlement risk 15 12 112 Securitization exposures in banking book 2,404 2,072 19213 Of which IRB ratings-based approach (RBA) 544 279 4414 Of which IRB Supervisory Formula Approach (SFA) 1,860 1,793 14815 Of which SA/simplified supervisory formula approach (SSFA) - - -16 Market risk 13,532 11,097 1,08317 Of which standardized approach (SA) (2) 258 39 2118 Of which internal model approaches (IMM) 13,274 11,058 1,06219 Operational risk 35,205 34,284 2,81720 Of which Basic Indicator Approach 49 48 421 Of which Standardized Approach 2,019 1,977 16222 Of which Advanced Measurement Approach 33,137 32,259 2,65123 Amounts below the thresholds for deduction (subject to 250% risk weight) 8,471 8,553 67824 Floor adjustment (3) - - -25 Total 289,237 277,506 23,139RWA increased $11.7B due to business growth, including the acquisition of KGS-ALPHA and the impact of foreign exchange movements, partially offset by positive book quality changes.
Total RWA RWA Net RWA CVA PHASE-IN CALCULATION (4) Before CVA CVA phase-in Adjustment for CVA
LINE CVA OSFI Scalars phase-in Adjustments Capital Floor phase-in# (A) (B) (C) (D)=A*(100%-B) (E) (F)=C-D+E
Common Equity Tier 1 (CET 1) Capital RWA 1 6,124 80% 290,462 1,225 - 289,237 Tier 1 Capital RWA 2 6,124 83% 290,462 1,042 - 289,420 Total Capital RWA 3 6,124 86% 290,462 858 - 289,604
CAPITAL RATIOS FOR SIGNIFICANT BANK SUBSIDIARIES 2018 2018 2018 2018 Q4 Q3 Q2 Q1
Bank of Montreal Mortgage Corporation - Basel IIIAll-in Basis - Basel III (5)
Common Equity Tier 1 ratio 4 21.6% 21.8% 23.5% 20.3%Tier 1 ratio 5 21.6% 21.8% 23.5% 20.3%Total capital ratio 6 22.1% 22.3% 24.1% 20.7%
BMO Harris Bank N.A. - Basel III (6)Tier 1 ratio 7 12.5% 12.5% 12.8% 12.8%Total capital ratio 8 13.7% 13.7% 14.0% 14.0%
(1) The scaling factor is applied to the risk-weighted asset amounts as applicable.(2) Standardized approach market risk RWA reflects specific interest rate risk on securitization positions.(3) Under OSFI's Capital Adequacy Requirements (CAR) Guideline, which governs advanced approaches, the bank calculates a Capital Floor and may be required to increase its risk-weighted assets if the Capital Floor applies.
Effective Q2 2018, OSFI implemented the Basel II Capital Floor. Based on these requirements, there was no capital floor applicable for Q4 2018 and Q3 2018. (4) Commencing Q1 2014, a new CVA regulatory capital charge has been applied to derivatives. For Q3 2014, OSFI introduced a new three tier capital approach with different scalars for each tier. See above for calculation
and scalars' percentages. CET1 CVA phase-in factors are 64% in 2016, 72% in 2017 and 80% in 2018.(5) All-in capital ratios assume that all Basel III regulatory adjustments are applied effective January 1, 2013 and that the capital value of instruments which no longer qualify as regulatory capital under Basel III rules will be
phased out at a rate of 10% per year from January 1, 2013, continuing to January 1, 2022.(6) Calculated using U.S. Basel III guidelines currently in effect for U.S. regulatory purposes and based on BMO Harris N.A.'s calendar quarter ends: September 2018, June 2018, March 2018, and December 2017.
Q4 2018
RWA (1)
October 31, 2018 Supplementary Financial Information Page 40
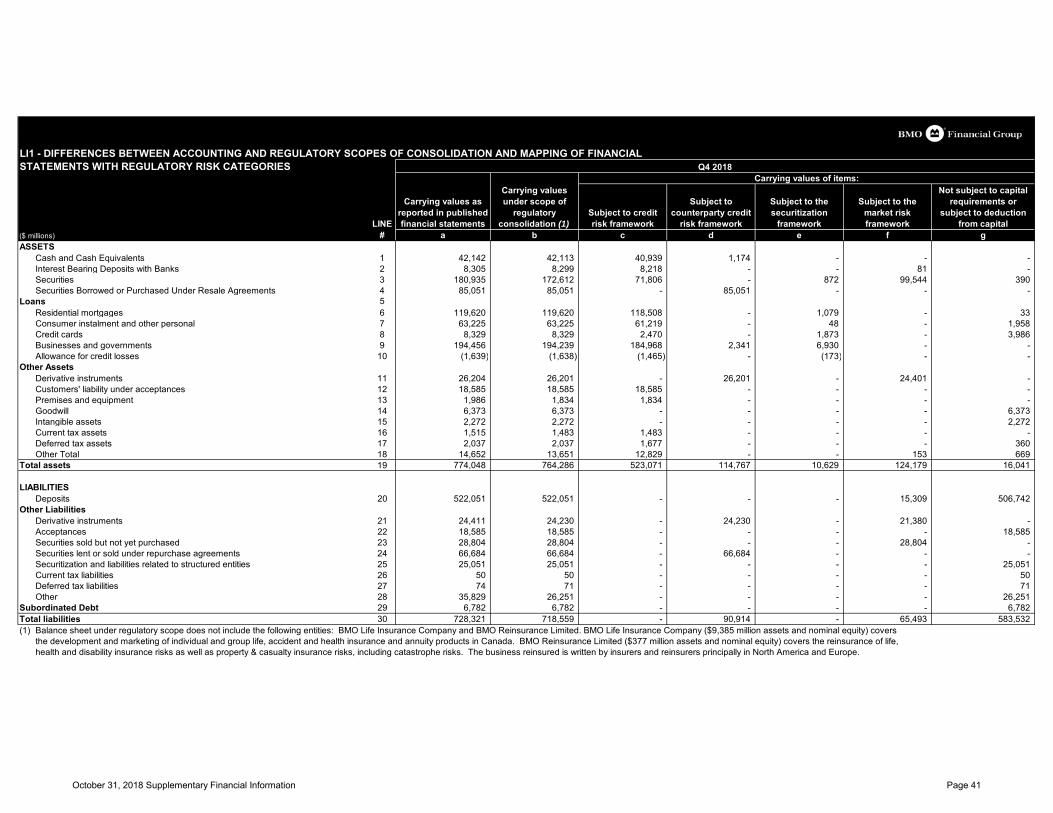
LI1 - DIFFERENCES BETWEEN ACCOUNTING AND REGULATORY SCOPES OF CONSOLIDATION AND MAPPING OF FINANCIALSTATEMENTS WITH REGULATORY RISK CATEGORIES
LINE
Carrying values as reported in published financial statements
Carrying values under scope of
regulatory consolidation (1)
Subject to credit risk framework
Subject to counterparty credit
risk framework
Subject to the securitization
framework
Subject to the market risk framework
Not subject to capital requirements or
subject to deduction from capital
($ millions) # a b c d e f gASSETS
Cash and Cash Equivalents 1 42,142 42,113 40,939 1,174 - - -Interest Bearing Deposits with Banks 2 8,305 8,299 8,218 - - 81 -Securities 3 180,935 172,612 71,806 - 872 99,544 390Securities Borrowed or Purchased Under Resale Agreements 4 85,051 85,051 - 85,051 - - -
Loans 5Residential mortgages 6 119,620 119,620 118,508 - 1,079 - 33Consumer instalment and other personal 7 63,225 63,225 61,219 - 48 - 1,958Credit cards 8 8,329 8,329 2,470 - 1,873 - 3,986Businesses and governments 9 194,456 194,239 184,968 2,341 6,930 - -Allowance for credit losses 10 (1,639) (1,638) (1,465) - (173) - -
Other AssetsDerivative instruments 11 26,204 26,201 - 26,201 - 24,401 -Customers' liability under acceptances 12 18,585 18,585 18,585 - - - -Premises and equipment 13 1,986 1,834 1,834 - - - -Goodwill 14 6,373 6,373 - - - - 6,373Intangible assets 15 2,272 2,272 - - - - 2,272Current tax assets 16 1,515 1,483 1,483 - - - -Deferred tax assets 17 2,037 2,037 1,677 - - - 360Other Total 18 14,652 13,651 12,829 - - 153 669
Total assets 19 774,048 764,286 523,071 114,767 10,629 124,179 16,041
LIABILITIESDeposits 20 522,051 522,051 - - - 15,309 506,742
Other LiabilitiesDerivative instruments 21 24,411 24,230 - 24,230 - 21,380 -Acceptances 22 18,585 18,585 - - - - 18,585Securities sold but not yet purchased 23 28,804 28,804 - - - 28,804 -Securities lent or sold under repurchase agreements 24 66,684 66,684 - 66,684 - - -Securitization and liabilities related to structured entities 25 25,051 25,051 - - - - 25,051Current tax liabilities 26 50 50 - - - - 50Deferred tax liabilities 27 74 71 - - - - 71Other 28 35,829 26,251 - - - - 26,251
Subordinated Debt 29 6,782 6,782 - - - - 6,782Total liabilities 30 728,321 718,559 - 90,914 - 65,493 583,532(1) Balance sheet under regulatory scope does not include the following entities: BMO Life Insurance Company and BMO Reinsurance Limited. BMO Life Insurance Company ($9,385 million assets and nominal equity) covers
the development and marketing of individual and group life, accident and health insurance and annuity products in Canada. BMO Reinsurance Limited ($377 million assets and nominal equity) covers the reinsurance of life, health and disability insurance risks as well as property & casualty insurance risks, including catastrophe risks. The business reinsured is written by insurers and reinsurers principally in North America and Europe.
Q4 2018Carrying values of items:
October 31, 2018 Supplementary Financial Information Page 41
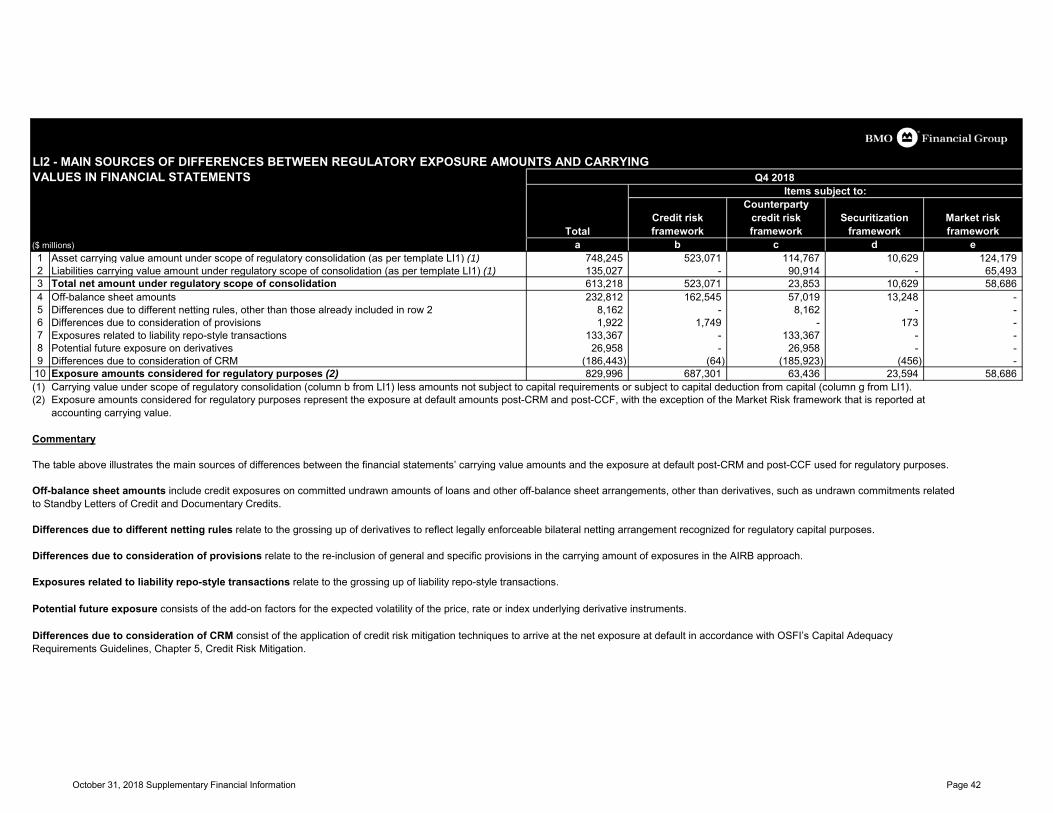
LI2 - MAIN SOURCES OF DIFFERENCES BETWEEN REGULATORY EXPOSURE AMOUNTS AND CARRYING VALUES IN FINANCIAL STATEMENTS
TotalCredit risk framework
Counterparty credit risk framework
Securitization framework
Market risk framework
($ millions) a b c d e1 Asset carrying value amount under scope of regulatory consolidation (as per template LI1) (1) 748,245 523,071 114,767 10,629 124,1792 Liabilities carrying value amount under regulatory scope of consolidation (as per template LI1) (1) 135,027 - 90,914 - 65,4933 Total net amount under regulatory scope of consolidation 613,218 523,071 23,853 10,629 58,6864 Off-balance sheet amounts 232,812 162,545 57,019 13,248 -5 Differences due to different netting rules, other than those already included in row 2 8,162 - 8,162 - -6 Differences due to consideration of provisions 1,922 1,749 - 173 -7 Exposures related to liability repo-style transactions 133,367 - 133,367 - -8 Potential future exposure on derivatives 26,958 - 26,958 - -9 Differences due to consideration of CRM (186,443) (64) (185,923) (456) -10 Exposure amounts considered for regulatory purposes (2) 829,996 687,301 63,436 23,594 58,686(1) Carrying value under scope of regulatory consolidation (column b from LI1) less amounts not subject to capital requirements or subject to capital deduction from capital (column g from LI1).(2) Exposure amounts considered for regulatory purposes represent the exposure at default amounts post-CRM and post-CCF, with the exception of the Market Risk framework that is reported at
accounting carrying value.
Commentary
The table above illustrates the main sources of differences between the financial statements’ carrying value amounts and the exposure at default post-CRM and post-CCF used for regulatory purposes.
Off-balance sheet amounts include credit exposures on committed undrawn amounts of loans and other off-balance sheet arrangements, other than derivatives, such as undrawn commitments related to Standby Letters of Credit and Documentary Credits.
Differences due to different netting rules relate to the grossing up of derivatives to reflect legally enforceable bilateral netting arrangement recognized for regulatory capital purposes.
Differences due to consideration of provisions relate to the re-inclusion of general and specific provisions in the carrying amount of exposures in the AIRB approach.
Exposures related to liability repo-style transactions relate to the grossing up of liability repo-style transactions.
Potential future exposure consists of the add-on factors for the expected volatility of the price, rate or index underlying derivative instruments. Differences due to consideration of CRM consist of the application of credit risk mitigation techniques to arrive at the net exposure at default in accordance with OSFI’s Capital Adequacy Requirements Guidelines, Chapter 5, Credit Risk Mitigation.
Q4 2018Items subject to:
October 31, 2018 Supplementary Financial Information Page 42
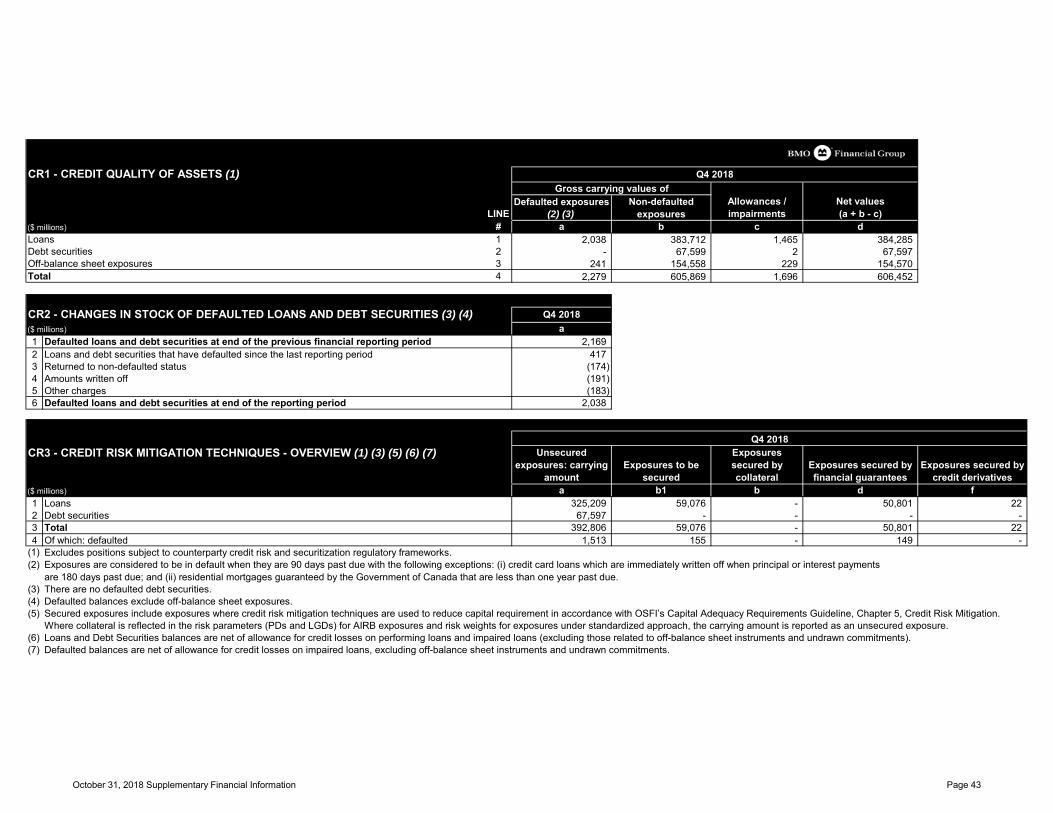
CR1 - CREDIT QUALITY OF ASSETS (1)
LINEDefaulted exposures
(2) (3)Non-defaulted
exposuresAllowances / impairments
Net values(a + b - c)
($ millions) # a b c dLoans 1 2,038 383,712 1,465 384,285Debt securities 2 - 67,599 2 67,597Off-balance sheet exposures 3 241 154,558 229 154,570Total 4 2,279 605,869 1,696 606,452
CR2 - CHANGES IN STOCK OF DEFAULTED LOANS AND DEBT SECURITIES (3) (4) Q4 2018($ millions) a1 Defaulted loans and debt securities at end of the previous financial reporting period 2,1692 Loans and debt securities that have defaulted since the last reporting period 4173 Returned to non-defaulted status (174)4 Amounts written off (191)5 Other charges (183)6 Defaulted loans and debt securities at end of the reporting period 2,038
CR3 - CREDIT RISK MITIGATION TECHNIQUES - OVERVIEW (1) (3) (5) (6) (7) Unsecured exposures: carrying
amount Exposures to be
secured
Exposures secured by collateral
Exposures secured by financial guarantees
Exposures secured by credit derivatives
($ millions) a b1 b d f1 Loans 325,209 59,076 - 50,801 222 Debt securities 67,597 - - - -3 Total 392,806 59,076 - 50,801 224 Of which: defaulted 1,513 155 - 149 -
(1) Excludes positions subject to counterparty credit risk and securitization regulatory frameworks.(2) Exposures are considered to be in default when they are 90 days past due with the following exceptions: (i) credit card loans which are immediately written off when principal or interest payments
are 180 days past due; and (ii) residential mortgages guaranteed by the Government of Canada that are less than one year past due.(3) There are no defaulted debt securities.(4) Defaulted balances exclude off-balance sheet exposures.(5) Secured exposures include exposures where credit risk mitigation techniques are used to reduce capital requirement in accordance with OSFI’s Capital Adequacy Requirements Guideline, Chapter 5, Credit Risk Mitigation.
Where collateral is reflected in the risk parameters (PDs and LGDs) for AIRB exposures and risk weights for exposures under standardized approach, the carrying amount is reported as an unsecured exposure. (6) Loans and Debt Securities balances are net of allowance for credit losses on performing loans and impaired loans (excluding those related to off-balance sheet instruments and undrawn commitments).(7) Defaulted balances are net of allowance for credit losses on impaired loans, excluding off-balance sheet instruments and undrawn commitments.
Q4 2018
Q4 2018Gross carrying values of
October 31, 2018 Supplementary Financial Information Page 43
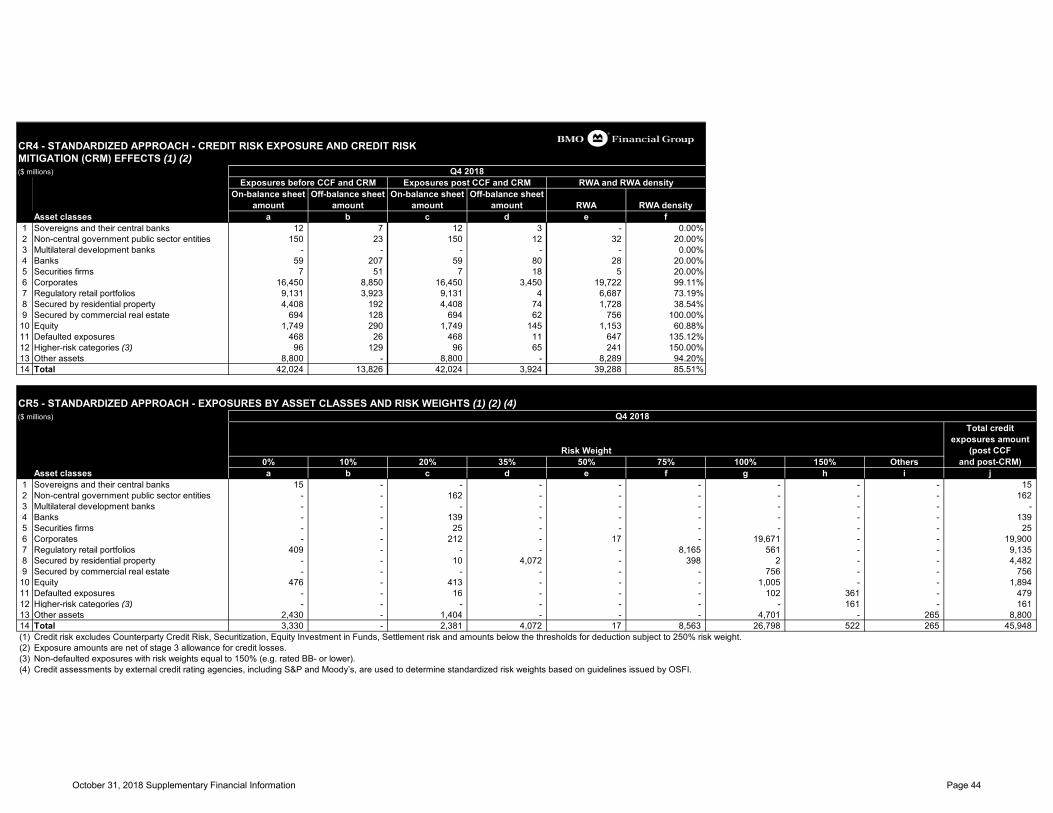
CR4 - STANDARDIZED APPROACH - CREDIT RISK EXPOSURE AND CREDIT RISK MITIGATION (CRM) EFFECTS (1) (2)($ millions)
On-balance sheet amount
Off-balance sheet amount
On-balance sheet amount
Off-balance sheet amount RWA RWA density
Asset classes a b c d e f1 Sovereigns and their central banks 12 7 12 3 - 0.00%2 Non-central government public sector entities 150 23 150 12 32 20.00%3 Multilateral development banks - - - - - 0.00%4 Banks 59 207 59 80 28 20.00%5 Securities firms 7 51 7 18 5 20.00%6 Corporates 16,450 8,850 16,450 3,450 19,722 99.11%7 Regulatory retail portfolios 9,131 3,923 9,131 4 6,687 73.19%8 Secured by residential property 4,408 192 4,408 74 1,728 38.54%9 Secured by commercial real estate 694 128 694 62 756 100.00%10 Equity 1,749 290 1,749 145 1,153 60.88%11 Defaulted exposures 468 26 468 11 647 135.12%12 Higher-risk categories (3) 96 129 96 65 241 150.00%13 Other assets 8,800 - 8,800 - 8,289 94.20%14 Total 42,024 13,826 42,024 3,924 39,288 85.51%
CR5 - STANDARDIZED APPROACH - EXPOSURES BY ASSET CLASSES AND RISK WEIGHTS (1) (2) (4)($ millions)
Total credit exposures amount
(post CCF 0% 10% 20% 35% 50% 75% 100% 150% Others and post-CRM)
Asset classes a b c d e f g h i j1 Sovereigns and their central banks 15 - - - - - - - - 152 Non-central government public sector entities - - 162 - - - - - - 1623 Multilateral development banks - - - - - - - - - -4 Banks - - 139 - - - - - - 1395 Securities firms - - 25 - - - - - - 256 Corporates - - 212 - 17 - 19,671 - - 19,9007 Regulatory retail portfolios 409 - - - - 8,165 561 - - 9,1358 Secured by residential property - - 10 4,072 - 398 2 - - 4,4829 Secured by commercial real estate - - - - - - 756 - - 75610 Equity 476 - 413 - - - 1,005 - - 1,89411 Defaulted exposures - - 16 - - - 102 361 - 47912 Higher-risk categories (3) - - - - - - - 161 - 16113 Other assets 2,430 - 1,404 - - - 4,701 - 265 8,80014 Total 3,330 - 2,381 4,072 17 8,563 26,798 522 265 45,948(1) Credit risk excludes Counterparty Credit Risk, Securitization, Equity Investment in Funds, Settlement risk and amounts below the thresholds for deduction subject to 250% risk weight.(2) Exposure amounts are net of stage 3 allowance for credit losses.(3) Non-defaulted exposures with risk weights equal to 150% (e.g. rated BB- or lower).(4) Credit assessments by external credit rating agencies, including S&P and Moody’s, are used to determine standardized risk weights based on guidelines issued by OSFI.
Q4 2018
Risk Weight
Q4 2018Exposures before CCF and CRM Exposures post CCF and CRM RWA and RWA density
October 31, 2018 Supplementary Financial Information Page 44
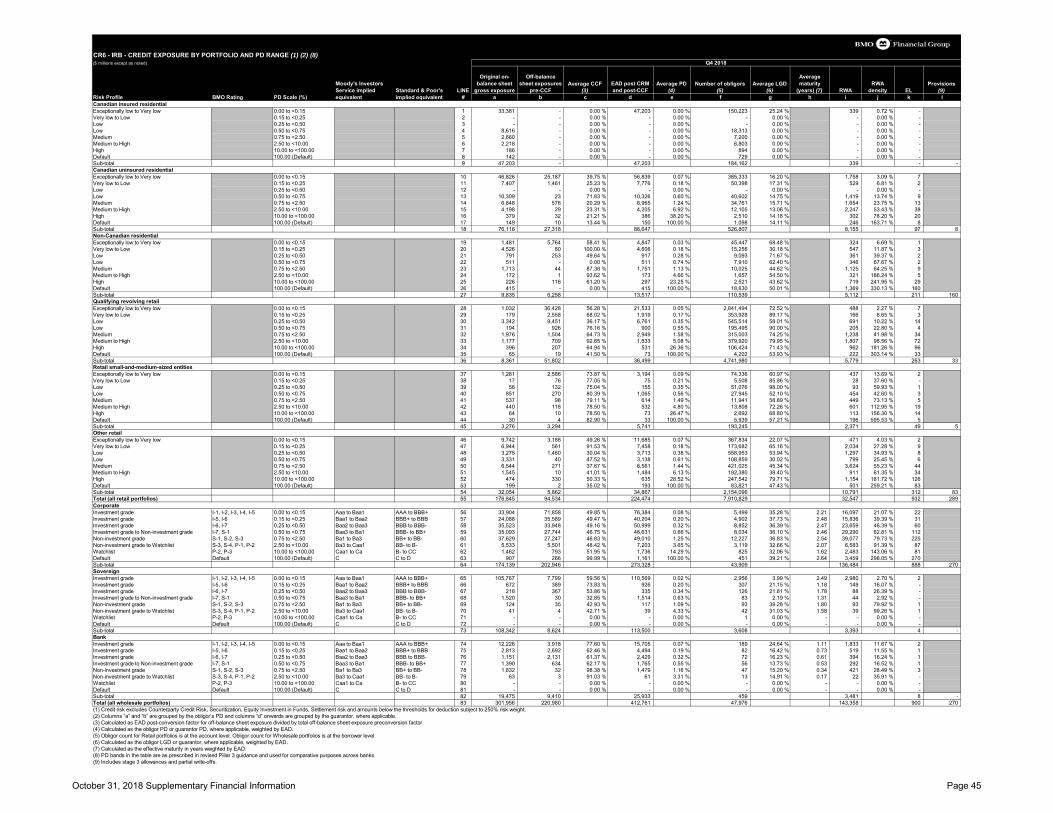
CR6 - IRB - CREDIT EXPOSURE BY PORTFOLIO AND PD RANGE (1) (2) (8)($ millions except as noted)
Moody's Investors Service implied Standard & Poor's LINE
Original on-balance sheet
gross exposure
Off-balance sheet exposures
pre-CCFAverage CCF
(3)EAD post CRM and post-CCF
Average PD (4)
Number of obligors (5)
Average LGD (6)
Average maturity
(years) (7) RWARWA
density ELProvisions
(9)Risk Profile BMO Rating PD Scale (%) equivalent implied equivalent # a b c d e f g h i j k lCanadian insured residentialExceptionally low to Very low 0.00 to <0.15 1 33,381 - 0.00 % 47,203 0.00 % 150,223 25.24 % 339 0.72 % -Very low to Low 0.15 to <0.25 2 - - 0.00 % - 0.00 % - 0.00 % - 0.00 % -Low 0.25 to <0.50 3 - - 0.00 % - 0.00 % - 0.00 % - 0.00 % -Low 0.50 to <0.75 4 8,616 - 0.00 % - 0.00 % 18,313 0.00 % - 0.00 % -Medium 0.75 to <2.50 5 2,660 - 0.00 % - 0.00 % 7,200 0.00 % - 0.00 % -Medium to High 2.50 to <10.00 6 2,218 - 0.00 % - 0.00 % 6,803 0.00 % - 0.00 % -High 10.00 to <100.00 7 186 - 0.00 % - 0.00 % 894 0.00 % - 0.00 % -Default 100.00 (Default) 8 142 - 0.00 % - 0.00 % 729 0.00 % - 0.00 % -Sub-total 9 47,203 - 47,203 184,162 339 - -Canadian uninsured residentialExceptionally low to Very low 0.00 to <0.15 10 46,826 25,187 39.75 % 56,839 0.07 % 385,333 16.20 % 1,758 3.09 % 7Very low to Low 0.15 to <0.25 11 7,407 1,461 25.23 % 7,776 0.18 % 50,398 17.31 % 529 6.81 % 2Low 0.25 to <0.50 12 - - 0.00 % - 0.00 % - 0.00 % - 0.00 % -Low 0.50 to <0.75 13 10,309 23 71.83 % 10,326 0.60 % 40,602 14.75 % 1,419 13.74 % 9Medium 0.75 to <2.50 14 6,848 576 20.29 % 6,965 1.24 % 34,761 15.71 % 1,654 23.75 % 13Medium to High 2.50 to <10.00 15 4,198 29 23.31 % 4,205 6.92 % 12,105 13.06 % 2,247 53.43 % 38High 10.00 to <100.00 16 379 32 21.21 % 386 38.20 % 2,510 14.18 % 302 78.20 % 20Default 100.00 (Default) 17 149 10 13.44 % 150 100.00 % 1,098 14.11 % 246 163.71 % 8Sub-total 18 76,116 27,318 86,647 526,807 8,155 97 8Non-Canadian residentialExceptionally low to Very low 0.00 to <0.15 19 1,481 5,764 58.41 % 4,847 0.03 % 45,447 68.48 % 324 6.69 % 1Very low to Low 0.15 to <0.25 20 4,526 80 100.00 % 4,606 0.18 % 15,256 30.18 % 547 11.87 % 3Low 0.25 to <0.50 21 791 253 49.64 % 917 0.28 % 9,093 71.67 % 361 39.37 % 2Low 0.50 to <0.75 22 511 - 0.00 % 511 0.74 % 7,910 62.40 % 346 67.67 % 2Medium 0.75 to <2.50 23 1,713 44 87.38 % 1,751 1.13 % 10,025 44.62 % 1,125 64.25 % 9Medium to High 2.50 to <10.00 24 172 1 93.62 % 173 4.66 % 1,657 54.50 % 321 186.24 % 5High 10.00 to <100.00 25 226 116 61.20 % 297 23.25 % 2,521 43.62 % 719 241.95 % 29Default 100.00 (Default) 26 415 - 0.00 % 415 100.00 % 18,630 50.01 % 1,369 330.13 % 160Sub-total 27 9,835 6,258 13,517 110,539 5,112 211 160Qualifying revolving retailExceptionally low to Very low 0.00 to <0.15 28 1,032 36,428 56.28 % 21,533 0.05 % 2,841,494 72.52 % 488 2.27 % 7Very low to Low 0.15 to <0.25 29 179 2,558 68.02 % 1,919 0.17 % 353,928 89.17 % 166 8.65 % 3Low 0.25 to <0.50 30 3,342 9,451 36.17 % 6,761 0.35 % 545,514 58.01 % 691 10.22 % 14Low 0.50 to <0.75 31 194 926 76.16 % 900 0.55 % 195,495 90.00 % 205 22.80 % 4Medium 0.75 to <2.50 32 1,976 1,504 64.73 % 2,949 1.58 % 315,003 74.25 % 1,238 41.98 % 34Medium to High 2.50 to <10.00 33 1,177 709 92.65 % 1,833 5.08 % 379,920 79.95 % 1,807 98.56 % 72High 10.00 to <100.00 34 396 207 64.94 % 531 26.36 % 106,424 71.43 % 962 181.26 % 96Default 100.00 (Default) 35 65 19 41.50 % 73 100.00 % 4,202 53.93 % 222 303.14 % 33Sub-total 36 8,361 51,802 36,499 4,741,980 5,779 263 33Retail small-and-medium-sized entitiesExceptionally low to Very low 0.00 to <0.15 37 1,281 2,586 73.87 % 3,194 0.09 % 74,336 60.97 % 437 13.69 % 2Very low to Low 0.15 to <0.25 38 17 76 77.05 % 75 0.21 % 5,508 85.86 % 28 37.60 % -Low 0.25 to <0.50 39 56 132 75.04 % 155 0.35 % 51,076 98.00 % 93 59.93 % 1Low 0.50 to <0.75 40 851 270 80.39 % 1,065 0.56 % 27,945 52.10 % 454 42.60 % 3Medium 0.75 to <2.50 41 537 98 79.11 % 614 1.49 % 11,941 58.89 % 449 73.13 % 5Medium to High 2.50 to <10.00 42 440 118 78.50 % 532 4.80 % 13,808 72.26 % 601 112.95 % 19High 10.00 to <100.00 43 64 10 78.50 % 73 26.47 % 2,692 68.80 % 113 156.30 % 14Default 100.00 (Default) 44 30 4 82.90 % 33 100.00 % 5,939 57.21 % 196 595.53 % 5Sub-total 45 3,276 3,294 5,741 193,245 2,371 49 5Other retailExceptionally low to Very low 0.00 to <0.15 46 9,742 3,188 49.26 % 11,685 0.07 % 367,834 22.07 % 471 4.03 % 2Very low to Low 0.15 to <0.25 47 6,944 561 91.53 % 7,458 0.18 % 173,682 65.16 % 2,034 27.28 % 9Low 0.25 to <0.50 48 3,275 1,460 30.04 % 3,713 0.38 % 558,953 53.94 % 1,297 34.93 % 8Low 0.50 to <0.75 49 3,331 40 47.52 % 3,138 0.61 % 108,859 30.02 % 799 25.45 % 6Medium 0.75 to <2.50 50 6,544 271 37.67 % 6,561 1.44 % 421,025 45.34 % 3,624 55.23 % 44Medium to High 2.50 to <10.00 51 1,545 10 41.01 % 1,484 6.13 % 192,380 38.40 % 911 61.35 % 34High 10.00 to <100.00 52 474 330 50.33 % 635 28.52 % 247,542 79.71 % 1,154 181.72 % 126Default 100.00 (Default) 53 199 2 35.02 % 193 100.00 % 83,821 47.43 % 501 259.21 % 83Sub-total 54 32,054 5,862 34,867 2,154,096 10,791 312 83Total (all retail portfolios) 55 176,845 94,534 224,474 7,910,829 32,547 932 289CorporateInvestment grade I-1, I-2, I-3, I-4, I-5 0.00 to <0.15 Aaa to Baa1 AAA to BBB+ 56 33,904 71,858 49.85 % 76,384 0.08 % 5,499 35.28 % 2.21 16,097 21.07 % 22Investment grade I-5, I-6 0.15 to <0.25 Baa1 to Baa2 BBB+ to BBB 57 24,088 35,589 49.47 % 40,204 0.20 % 4,902 37.73 % 2.48 15,836 39.39 % 31Investment grade I-6, I-7 0.25 to <0.50 Baa2 to Baa3 BBB to BBB- 58 35,523 33,948 49.16 % 50,999 0.32 % 8,852 36.39 % 2.47 23,659 46.39 % 60Investment grade to Non-investment grade I-7, S-1 0.50 to <0.75 Baa3 to Ba1 BBB- to BB+ 59 35,093 27,744 46.75 % 46,631 0.66 % 8,034 36.10 % 2.46 29,290 62.81 % 112Non-investment grade S-1, S-2, S-3 0.75 to <2.50 Ba1 to Ba3 BB+ to BB- 60 37,629 27,247 46.83 % 49,010 1.25 % 12,227 36.83 % 2.54 39,077 79.73 % 225Non-investment grade to Watchlist S-3, S-4, P-1, P-2 2.50 to <10.00 Ba3 to Caa1 BB- to B- 61 5,533 5,501 48.42 % 7,203 3.65 % 3,119 32.66 % 2.07 6,583 91.39 % 87Watchlist P-2, P-3 10.00 to <100.00 Caa1 to Ca B- to CC 62 1,462 793 51.95 % 1,736 14.29 % 825 32.06 % 1.62 2,483 143.06 % 81Default Default 100.00 (Default) C C to D 63 907 266 99.99 % 1,161 100.00 % 451 39.21 % 2.64 3,459 298.05 % 270Sub-total 64 174,139 202,946 273,328 43,909 136,484 888 270SovereignInvestment grade I-1, I-2, I-3, I-4, I-5 0.00 to <0.15 Aaa to Baa1 AAA to BBB+ 65 105,767 7,799 59.56 % 110,569 0.02 % 2,956 3.99 % 2.49 2,980 2.70 % 2Investment grade I-5, I-6 0.15 to <0.25 Baa1 to Baa2 BBB+ to BBB 66 672 389 73.83 % 926 0.20 % 307 21.15 % 1.18 149 16.07 % -Investment grade I-6, I-7 0.25 to <0.50 Baa2 to Baa3 BBB to BBB- 67 218 367 53.86 % 335 0.34 % 126 21.81 % 1.78 88 26.39 % -Investment grade to Non-investment grade I-7, S-1 0.50 to <0.75 Baa3 to Ba1 BBB- to BB+ 68 1,520 30 32.85 % 1,514 0.63 % 83 2.19 % 1.31 44 2.92 % -Non-investment grade S-1, S-2, S-3 0.75 to <2.50 Ba1 to Ba3 BB+ to BB- 69 124 35 42.93 % 117 1.09 % 93 39.28 % 1.80 93 79.92 % 1Non-investment grade to Watchlist S-3, S-4, P-1, P-2 2.50 to <10.00 Ba3 to Caa1 BB- to B- 70 41 4 42.71 % 39 4.33 % 42 31.03 % 1.58 39 99.26 % 1Watchlist P-2, P-3 10.00 to <100.00 Caa1 to Ca B- to CC 71 - - 0.00 % - 0.00 % 1 0.00 % - - 0.00 % -Default Default 100.00 (Default) C C to D 72 - - 0.00 % - 0.00 % - 0.00 % - - 0.00 % -Sub-total 73 108,342 8,624 113,500 3,608 3,393 4 -BankInvestment grade I-1, I-2, I-3, I-4, I-5 0.00 to <0.15 Aaa to Baa1 AAA to BBB+ 74 12,226 3,918 77.60 % 15,705 0.07 % 189 24.64 % 1.11 1,833 11.67 % 2Investment grade I-5, I-6 0.15 to <0.25 Baa1 to Baa2 BBB+ to BBB 75 2,813 2,692 62.46 % 4,494 0.19 % 82 16.42 % 0.73 519 11.55 % 1Investment grade I-6, I-7 0.25 to <0.50 Baa2 to Baa3 BBB to BBB- 76 1,151 2,131 61.37 % 2,429 0.32 % 72 16.23 % 0.61 394 16.24 % 1Investment grade to Non-investment grade I-7, S-1 0.50 to <0.75 Baa3 to Ba1 BBB- to BB+ 77 1,390 634 62.17 % 1,765 0.55 % 56 13.73 % 0.53 292 16.52 % 1Non-investment grade S-1, S-2, S-3 0.75 to <2.50 Ba1 to Ba3 BB+ to BB- 78 1,832 32 98.38 % 1,479 1.16 % 47 15.20 % 0.34 421 28.49 % 3Non-investment grade to Watchlist S-3, S-4, P-1, P-2 2.50 to <10.00 Ba3 to Caa1 BB- to B- 79 63 3 91.03 % 61 3.31 % 13 14.91 % 0.17 22 35.91 % -Watchlist P-2, P-3 10.00 to <100.00 Caa1 to Ca B- to CC 80 - - 0.00 % - 0.00 % - 0.00 % - - 0.00 % -Default Default 100.00 (Default) C C to D 81 - - 0.00 % - 0.00 % - 0.00 % - - 0.00 % -Sub-total 82 19,475 9,410 25,933 459 3,481 8 -Total (all wholesale portfolios) 83 301,956 220,980 412,761 47,976 143,358 900 270(1) Credit risk excludes Counterparty Credit Risk, Securitization, Equity Investment in Funds, Settlement risk and amounts below the thresholds for deduction subject to 250% risk weight.(2) Columns “a” and “b” are grouped by the obligor’s PD and columns “d” onwards are grouped by the guarantor, where applicable.(3) Calculated as EAD post-conversion factor for off-balance sheet exposure divided by total off-balance sheet exposure preconversion factor.(4) Calculated as the obligor PD or guarantor PD, where applicable, weighted by EAD.(5) Obligor count for Retail portfolios is at the account level. Obligor count for Wholesale portfolios is at the borrower level. (6) Calculated as the obligor LGD or guarantor, where applicable, weighted by EAD.(7) Calculated as the effective maturity in years weighted by EAD.(8) PD bands in the table are as prescribed in revised Pillar 3 guidance and used for comparative purposes across banks. (9) Includes stage 3 allowances and partial write-offs.
Q4 2018
October 31, 2018 Supplementary Financial Information Page 45
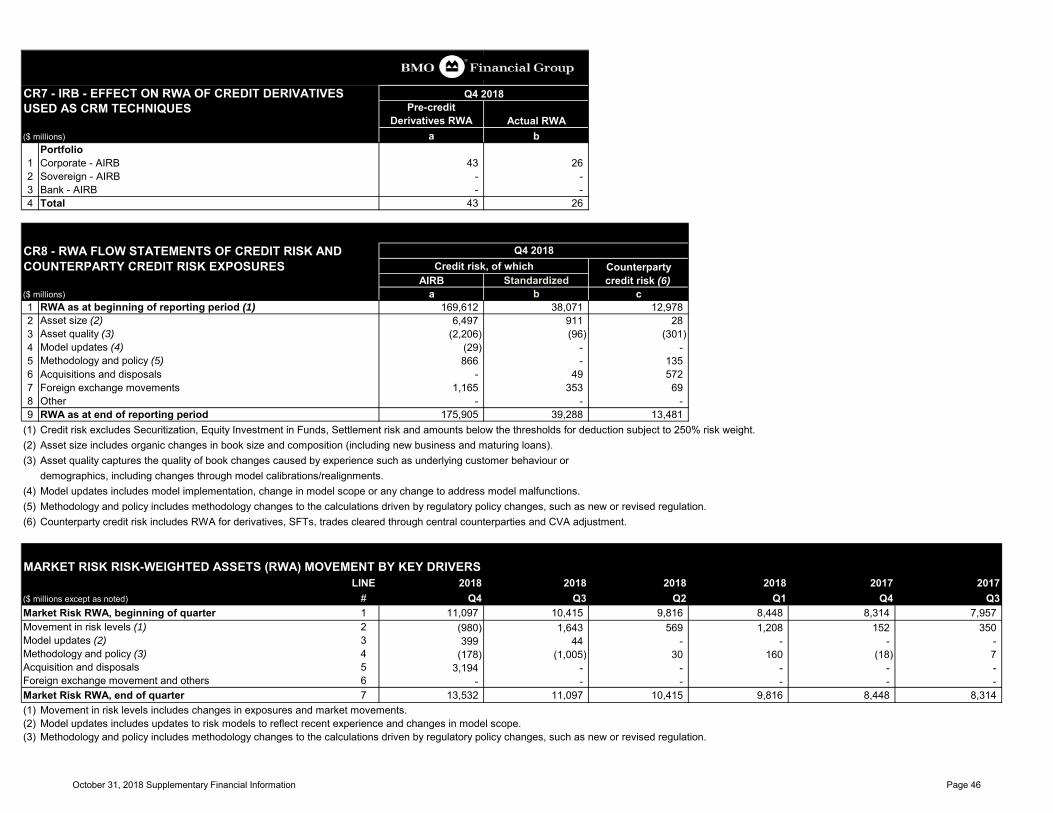
CR7 - IRB - EFFECT ON RWA OF CREDIT DERIVATIVES Q4 2018USED AS CRM TECHNIQUES Pre-credit
Derivatives RWA Actual RWA($ millions) a b
Portfolio 1 Corporate - AIRB 43 262 Sovereign - AIRB - -3 Bank - AIRB - -4 Total 43 26
CR8 - RWA FLOW STATEMENTS OF CREDIT RISK AND COUNTERPARTY CREDIT RISK EXPOSURES Credit risk, of which Counterparty
AIRB Standardized credit risk (6)($ millions) a b c1 RWA as at beginning of reporting period (1) 169,612 38,071 12,9782 Asset size (2) 6,497 911 283 Asset quality (3) (2,206) (96) (301)4 Model updates (4) (29) - -5 Methodology and policy (5) 866 - 1356 Acquisitions and disposals - 49 5727 Foreign exchange movements 1,165 353 698 Other - - -9 RWA as at end of reporting period 175,905 39,288 13,481
(1) Credit risk excludes Securitization, Equity Investment in Funds, Settlement risk and amounts below the thresholds for deduction subject to 250% risk weight.(2) Asset size includes organic changes in book size and composition (including new business and maturing loans).(3) Asset quality captures the quality of book changes caused by experience such as underlying customer behaviour or
demographics, including changes through model calibrations/realignments.(4) Model updates includes model implementation, change in model scope or any change to address model malfunctions.(5) Methodology and policy includes methodology changes to the calculations driven by regulatory policy changes, such as new or revised regulation.(6) Counterparty credit risk includes RWA for derivatives, SFTs, trades cleared through central counterparties and CVA adjustment.
MARKET RISK RISK-WEIGHTED ASSETS (RWA) MOVEMENT BY KEY DRIVERS LINE 2018 2018 2018 2018 2017 2017
($ millions except as noted) # Q4 Q3 Q2 Q1 Q4 Q3Market Risk RWA, beginning of quarter 1 11,097 10,415 9,816 8,448 8,314 7,957 Movement in risk levels (1) 2 (980) 1,643 569 1,208 152 350 Model updates (2) 3 399 44 - - - - Methodology and policy (3) 4 (178) (1,005) 30 160 (18) 7 Acquisition and disposals 5 3,194 - - - - - Foreign exchange movement and others 6 - - - - - - Market Risk RWA, end of quarter 7 13,532 11,097 10,415 9,816 8,448 8,314 (1) Movement in risk levels includes changes in exposures and market movements.(2) Model updates includes updates to risk models to reflect recent experience and changes in model scope.(3) Methodology and policy includes methodology changes to the calculations driven by regulatory policy changes, such as new or revised regulation.
Q4 2018
October 31, 2018 Supplementary Financial Information Page 46
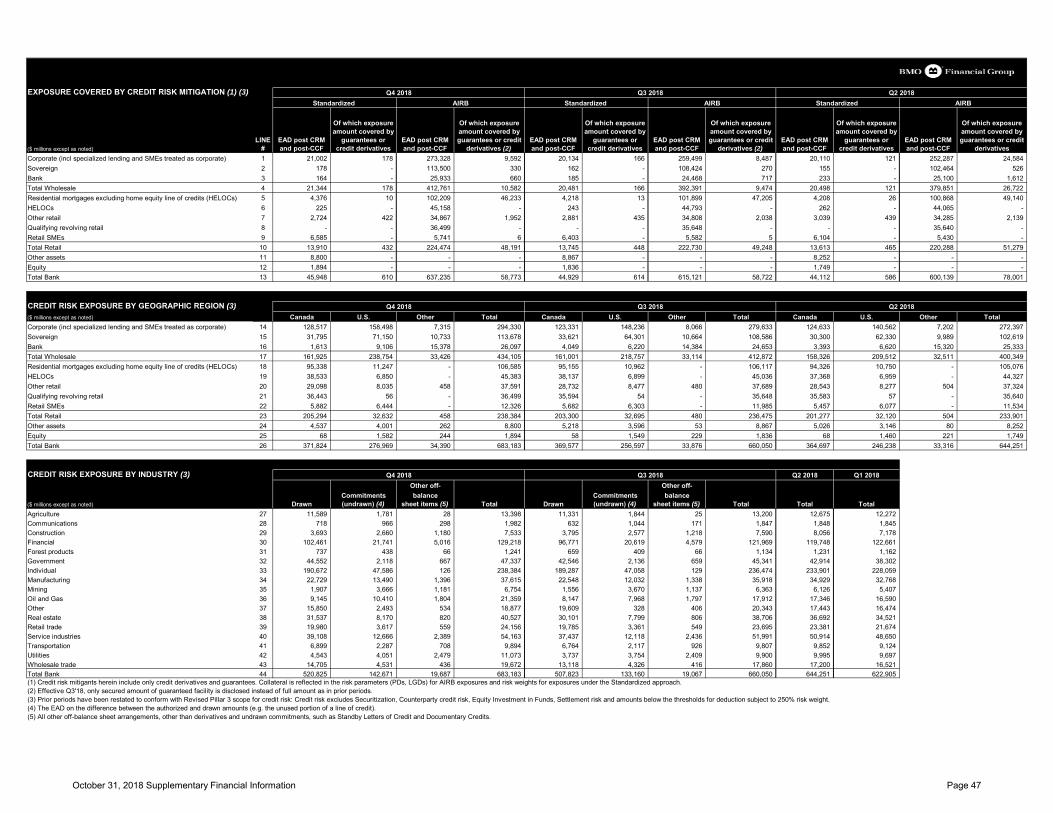
EXPOSURE COVERED BY CREDIT RISK MITIGATION (1) (3)Standardized AIRB Standardized AIRB Standardized AIRB
($ millions except as noted)LINE
#EAD post CRM and post-CCF
Of which exposure amount covered by
guarantees or credit derivatives
EAD post CRM and post-CCF
Of which exposure amount covered by guarantees or credit
derivatives (2)EAD post CRM and post-CCF
Of which exposure amount covered by
guarantees or credit derivatives
EAD post CRM and post-CCF
Of which exposure amount covered by guarantees or credit
derivatives (2)EAD post CRM and post-CCF
Of which exposure amount covered by
guarantees or credit derivatives
EAD post CRM and post-CCF
Of which exposure amount covered by guarantees or credit
derivativesCorporate (incl specialized lending and SMEs treated as corporate) 1 21,002 178 273,328 9,592 20,134 166 259,499 8,487 20,110 121 252,287 24,584 Sovereign 2 178 - 113,500 330 162 - 108,424 270 155 - 102,464 526 Bank 3 164 - 25,933 660 185 - 24,468 717 233 - 25,100 1,612 Total Wholesale 4 21,344 178 412,761 10,582 20,481 166 392,391 9,474 20,498 121 379,851 26,722 Residential mortgages excluding home equity line of credits (HELOCs) 5 4,376 10 102,209 46,233 4,218 13 101,899 47,205 4,208 26 100,868 49,140 HELOCs 6 225 - 45,158 - 243 - 44,793 - 262 - 44,065 - Other retail 7 2,724 422 34,867 1,952 2,881 435 34,808 2,038 3,039 439 34,285 2,139 Qualifying revolving retail 8 - - 36,499 - - - 35,648 - - - 35,640 - Retail SMEs 9 6,585 - 5,741 6 6,403 - 5,582 5 6,104 - 5,430 - Total Retail 10 13,910 432 224,474 48,191 13,745 448 222,730 49,248 13,613 465 220,288 51,279 Other assets 11 8,800 - - - 8,867 - - - 8,252 - - - Equity 12 1,894 - - - 1,836 - - - 1,749 - - - Total Bank 13 45,948 610 637,235 58,773 44,929 614 615,121 58,722 44,112 586 600,139 78,001
CREDIT RISK EXPOSURE BY GEOGRAPHIC REGION (3)($ millions except as noted) Canada U.S. Other Total Canada U.S. Other Total Canada U.S. Other TotalCorporate (incl specialized lending and SMEs treated as corporate) 14 128,517 158,498 7,315 294,330 123,331 148,236 8,066 279,633 124,633 140,562 7,202 272,397 Sovereign 15 31,795 71,150 10,733 113,678 33,621 64,301 10,664 108,586 30,300 62,330 9,989 102,619 Bank 16 1,613 9,106 15,378 26,097 4,049 6,220 14,384 24,653 3,393 6,620 15,320 25,333 Total Wholesale 17 161,925 238,754 33,426 434,105 161,001 218,757 33,114 412,872 158,326 209,512 32,511 400,349 Residential mortgages excluding home equity line of credits (HELOCs) 18 95,338 11,247 - 106,585 95,155 10,962 - 106,117 94,326 10,750 - 105,076 HELOCs 19 38,533 6,850 - 45,383 38,137 6,899 - 45,036 37,368 6,959 - 44,327 Other retail 20 29,098 8,035 458 37,591 28,732 8,477 480 37,689 28,543 8,277 504 37,324 Qualifying revolving retail 21 36,443 56 - 36,499 35,594 54 - 35,648 35,583 57 - 35,640 Retail SMEs 22 5,882 6,444 - 12,326 5,682 6,303 - 11,985 5,457 6,077 - 11,534 Total Retail 23 205,294 32,632 458 238,384 203,300 32,695 480 236,475 201,277 32,120 504 233,901 Other assets 24 4,537 4,001 262 8,800 5,218 3,596 53 8,867 5,026 3,146 80 8,252 Equity 25 68 1,582 244 1,894 58 1,549 229 1,836 68 1,460 221 1,749 Total Bank 26 371,824 276,969 34,390 683,183 369,577 256,597 33,876 660,050 364,697 246,238 33,316 644,251
CREDIT RISK EXPOSURE BY INDUSTRY (3) Q4 2018 Q3 2018 Q2 2018 Q1 2018Other off- Other off-
Commitments balance Commitments balance($ millions except as noted) Drawn (undrawn) (4) sheet items (5) Total Drawn (undrawn) (4) sheet items (5) Total Total TotalAgriculture 27 11,589 1,781 28 13,398 11,331 1,844 25 13,200 12,675 12,272 Communications 28 718 966 298 1,982 632 1,044 171 1,847 1,848 1,845 Construction 29 3,693 2,660 1,180 7,533 3,795 2,577 1,218 7,590 8,056 7,178 Financial 30 102,461 21,741 5,016 129,218 96,771 20,619 4,579 121,969 119,748 122,661 Forest products 31 737 438 66 1,241 659 409 66 1,134 1,231 1,162 Government 32 44,552 2,118 667 47,337 42,546 2,136 659 45,341 42,914 38,302 Individual 33 190,672 47,586 126 238,384 189,287 47,058 129 236,474 233,901 228,059 Manufacturing 34 22,729 13,490 1,396 37,615 22,548 12,032 1,338 35,918 34,929 32,768 Mining 35 1,907 3,666 1,181 6,754 1,556 3,670 1,137 6,363 6,126 5,407 Oil and Gas 36 9,145 10,410 1,804 21,359 8,147 7,968 1,797 17,912 17,346 16,590 Other 37 15,850 2,493 534 18,877 19,609 328 406 20,343 17,443 16,474 Real estate 38 31,537 8,170 820 40,527 30,101 7,799 806 38,706 36,692 34,521 Retail trade 39 19,980 3,617 559 24,156 19,785 3,361 549 23,695 23,381 21,674 Service industries 40 39,108 12,666 2,389 54,163 37,437 12,118 2,436 51,991 50,914 48,650 Transportation 41 6,899 2,287 708 9,894 6,764 2,117 926 9,807 9,852 9,124 Utilities 42 4,543 4,051 2,479 11,073 3,737 3,754 2,409 9,900 9,995 9,697 Wholesale trade 43 14,705 4,531 436 19,672 13,118 4,326 416 17,860 17,200 16,521 Total Bank 44 520,825 142,671 19,687 683,183 507,823 133,160 19,067 660,050 644,251 622,905 (1) Credit risk mitigants herein include only credit derivatives and guarantees. Collateral is reflected in the risk parameters (PDs, LGDs) for AIRB exposures and risk weights for exposures under the Standardized approach.(2) Effective Q3'18, only secured amount of guaranteed facility is disclosed instead of full amount as in prior periods.(3) Prior periods have been restated to conform with Revised Pillar 3 scope for credit risk: Credit risk excludes Securitization, Counterparty credit risk, Equity Investment in Funds, Settlement risk and amounts below the thresholds for deduction subject to 250% risk weight.(4) The EAD on the difference between the authorized and drawn amounts (e.g. the unused portion of a line of credit). (5) All other off-balance sheet arrangements, other than derivatives and undrawn commitments, such as Standby Letters of Credit and Documentary Credits.
Q4 2018 Q3 2018 Q2 2018
Q4 2018 Q3 2018 Q2 2018
October 31, 2018 Supplementary Financial Information Page 47
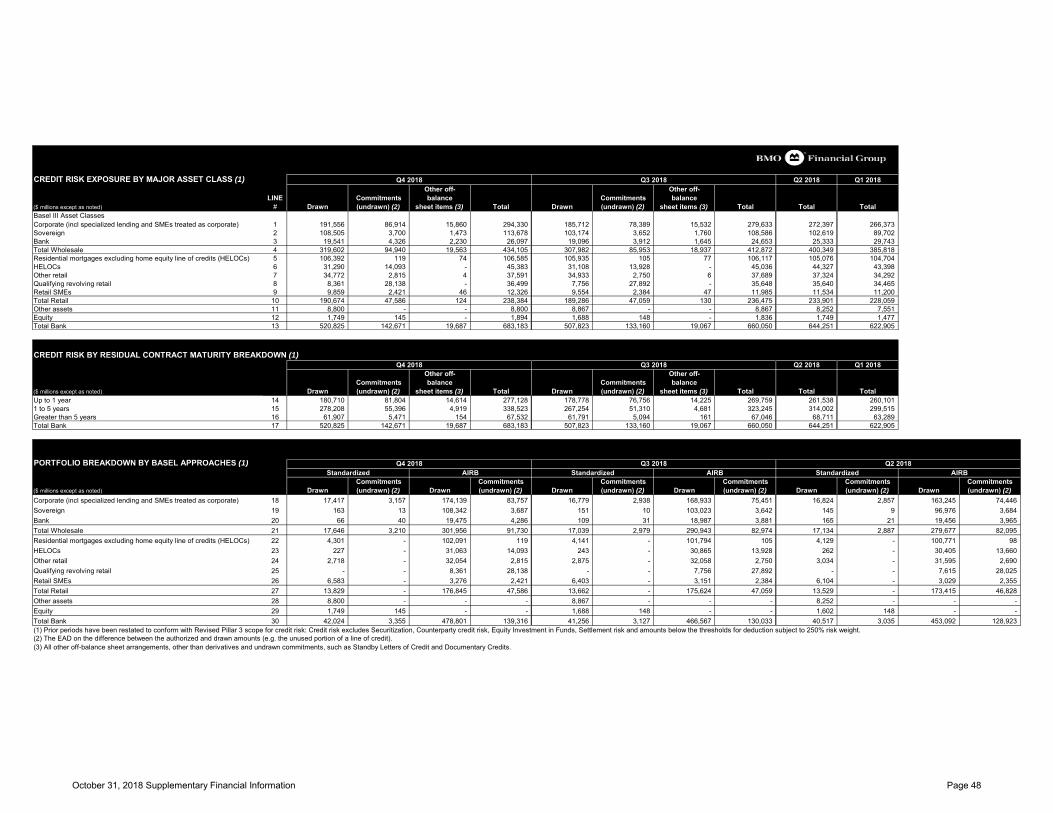
CREDIT RISK EXPOSURE BY MAJOR ASSET CLASS (1) Q4 2018 Q3 2018 Q2 2018 Q1 2018Other off- Other off-
LINE Commitments balance Commitments balance($ millions except as noted) # Drawn (undrawn) (2) sheet items (3) Total Drawn (undrawn) (2) sheet items (3) Total Total TotalBasel III Asset ClassesCorporate (incl specialized lending and SMEs treated as corporate) 1 191,556 86,914 15,860 294,330 185,712 78,389 15,532 279,633 272,397 266,373 Sovereign 2 108,505 3,700 1,473 113,678 103,174 3,652 1,760 108,586 102,619 89,702 Bank 3 19,541 4,326 2,230 26,097 19,096 3,912 1,645 24,653 25,333 29,743 Total Wholesale 4 319,602 94,940 19,563 434,105 307,982 85,953 18,937 412,872 400,349 385,818 Residential mortgages excluding home equity line of credits (HELOCs) 5 106,392 119 74 106,585 105,935 105 77 106,117 105,076 104,704 HELOCs 6 31,290 14,093 - 45,383 31,108 13,928 - 45,036 44,327 43,398 Other retail 7 34,772 2,815 4 37,591 34,933 2,750 6 37,689 37,324 34,292 Qualifying revolving retail 8 8,361 28,138 - 36,499 7,756 27,892 - 35,648 35,640 34,465 Retail SMEs 9 9,859 2,421 46 12,326 9,554 2,384 47 11,985 11,534 11,200 Total Retail 10 190,674 47,586 124 238,384 189,286 47,059 130 236,475 233,901 228,059 Other assets 11 8,800 - - 8,800 8,867 - - 8,867 8,252 7,551 Equity 12 1,749 145 - 1,894 1,688 148 - 1,836 1,749 1,477 Total Bank 13 520,825 142,671 19,687 683,183 507,823 133,160 19,067 660,050 644,251 622,905
CREDIT RISK BY RESIDUAL CONTRACT MATURITY BREAKDOWN (1)Q4 2018 Q3 2018 Q2 2018 Q1 2018
Other off- Other off-Commitments balance Commitments balance
($ millions except as noted) Drawn (undrawn) (2) sheet items (3) Total Drawn (undrawn) (2) sheet items (3) Total Total TotalUp to 1 year 14 180,710 81,804 14,614 277,128 178,778 76,756 14,225 269,759 261,538 260,101 1 to 5 years 15 278,208 55,396 4,919 338,523 267,254 51,310 4,681 323,245 314,002 299,515 Greater than 5 years 16 61,907 5,471 154 67,532 61,791 5,094 161 67,046 68,711 63,289 Total Bank 17 520,825 142,671 19,687 683,183 507,823 133,160 19,067 660,050 644,251 622,905
PORTFOLIO BREAKDOWN BY BASEL APPROACHES (1) Q4 2018 Q3 2018 Q2 2018Standardized AIRB Standardized AIRB Standardized AIRB
Commitments Commitments Commitments Commitments Commitments Commitments($ millions except as noted) Drawn (undrawn) (2) Drawn (undrawn) (2) Drawn (undrawn) (2) Drawn (undrawn) (2) Drawn (undrawn) (2) Drawn (undrawn) (2)Corporate (incl specialized lending and SMEs treated as corporate) 18 17,417 3,157 174,139 83,757 16,779 2,938 168,933 75,451 16,824 2,857 163,245 74,446 Sovereign 19 163 13 108,342 3,687 151 10 103,023 3,642 145 9 96,976 3,684 Bank 20 66 40 19,475 4,286 109 31 18,987 3,881 165 21 19,456 3,965 Total Wholesale 21 17,646 3,210 301,956 91,730 17,039 2,979 290,943 82,974 17,134 2,887 279,677 82,095 Residential mortgages excluding home equity line of credits (HELOCs) 22 4,301 - 102,091 119 4,141 - 101,794 105 4,129 - 100,771 98 HELOCs 23 227 - 31,063 14,093 243 - 30,865 13,928 262 - 30,405 13,660 Other retail 24 2,718 - 32,054 2,815 2,875 - 32,058 2,750 3,034 - 31,595 2,690 Qualifying revolving retail 25 - - 8,361 28,138 - - 7,756 27,892 - - 7,615 28,025 Retail SMEs 26 6,583 - 3,276 2,421 6,403 - 3,151 2,384 6,104 - 3,029 2,355 Total Retail 27 13,829 - 176,845 47,586 13,662 - 175,624 47,059 13,529 - 173,415 46,828 Other assets 28 8,800 - - - 8,867 - - - 8,252 - - - Equity 29 1,749 145 - - 1,688 148 - - 1,602 148 - - Total Bank 30 42,024 3,355 478,801 139,316 41,256 3,127 466,567 130,033 40,517 3,035 453,092 128,923 (1) Prior periods have been restated to conform with Revised Pillar 3 scope for credit risk: Credit risk excludes Securitization, Counterparty credit risk, Equity Investment in Funds, Settlement risk and amounts below the thresholds for deduction subject to 250% risk weight.(2) The EAD on the difference between the authorized and drawn amounts (e.g. the unused portion of a line of credit). (3) All other off-balance sheet arrangements, other than derivatives and undrawn commitments, such as Standby Letters of Credit and Documentary Credits.
October 31, 2018 Supplementary Financial Information Page 48
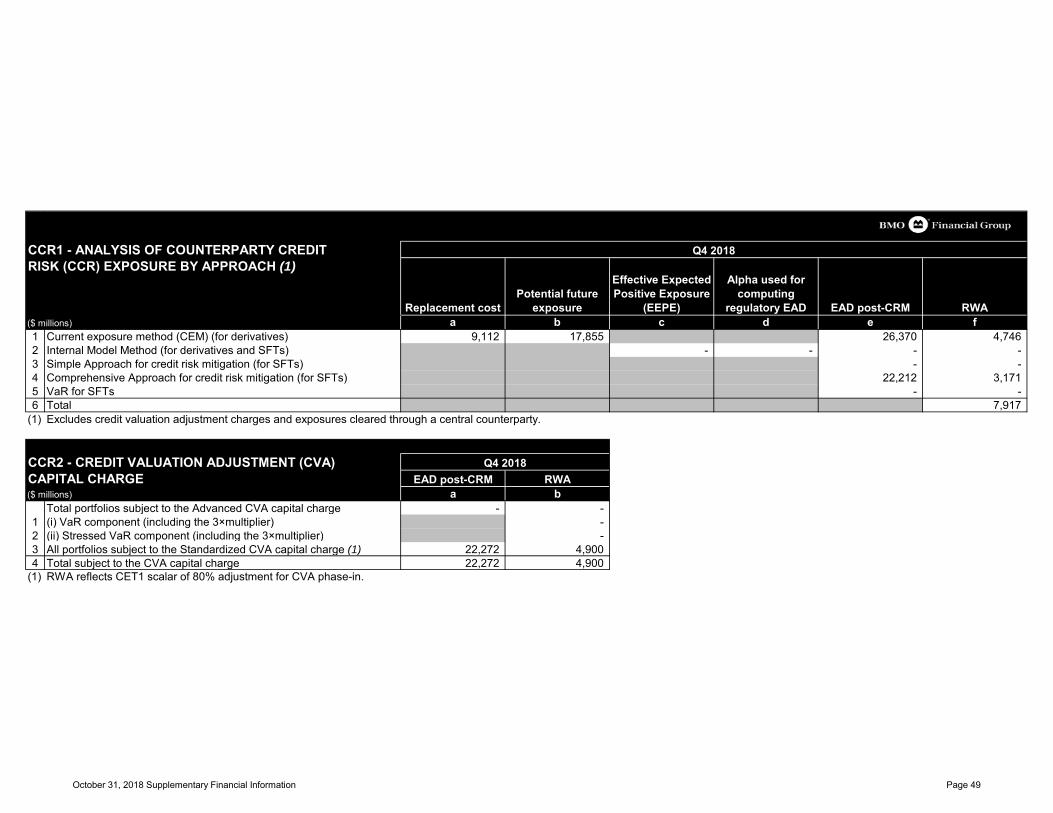
CCR1 - ANALYSIS OF COUNTERPARTY CREDIT RISK (CCR) EXPOSURE BY APPROACH (1)
Replacement costPotential future
exposure
Effective Expected Positive Exposure
(EEPE)
Alpha used for computing
regulatory EAD EAD post-CRM RWA($ millions) a b c d e f1 Current exposure method (CEM) (for derivatives) 9,112 17,855 26,370 4,746 2 Internal Model Method (for derivatives and SFTs) - - - - 3 Simple Approach for credit risk mitigation (for SFTs) - - 4 Comprehensive Approach for credit risk mitigation (for SFTs) 22,212 3,171 5 VaR for SFTs - - 6 Total 7,917
(1) Excludes credit valuation adjustment charges and exposures cleared through a central counterparty.
CCR2 - CREDIT VALUATION ADJUSTMENT (CVA)CAPITAL CHARGE EAD post-CRM RWA($ millions) a b
Total portfolios subject to the Advanced CVA capital charge - -1 (i) VaR component (including the 3×multiplier) -2 (ii) Stressed VaR component (including the 3×multiplier) -3 All portfolios subject to the Standardized CVA capital charge (1) 22,272 4,9004 Total subject to the CVA capital charge 22,272 4,900
(1) RWA reflects CET1 scalar of 80% adjustment for CVA phase-in.
Q4 2018
Q4 2018
October 31, 2018 Supplementary Financial Information Page 49
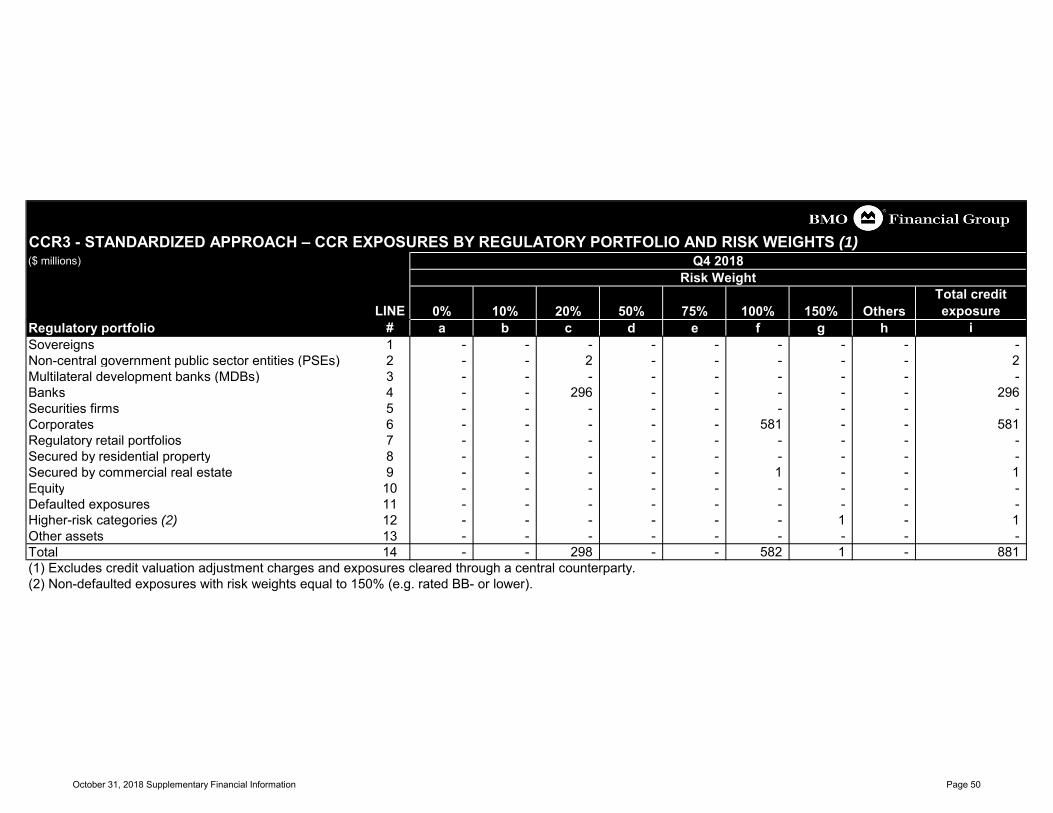
CCR3 - STANDARDIZED APPROACH – CCR EXPOSURES BY REGULATORY PORTFOLIO AND RISK WEIGHTS (1)($ millions)
LINE 0% 10% 20% 50% 75% 100% 150% OthersTotal credit exposure
Regulatory portfolio # a b c d e f g h iSovereigns 1 - - - - - - - - -Non-central government public sector entities (PSEs) 2 - - 2 - - - - - 2Multilateral development banks (MDBs) 3 - - - - - - - - -Banks 4 - - 296 - - - - - 296Securities firms 5 - - - - - - - - -Corporates 6 - - - - - 581 - - 581Regulatory retail portfolios 7 - - - - - - - - -Secured by residential property 8 - - - - - - - - -Secured by commercial real estate 9 - - - - - 1 - - 1Equity 10 - - - - - - - - -Defaulted exposures 11 - - - - - - - - -Higher-risk categories (2) 12 - - - - - - 1 - 1Other assets 13 - - - - - - - - -Total 14 - - 298 - - 582 1 - 881(1) Excludes credit valuation adjustment charges and exposures cleared through a central counterparty.(2) Non-defaulted exposures with risk weights equal to 150% (e.g. rated BB- or lower).
Q4 2018Risk Weight
October 31, 2018 Supplementary Financial Information Page 50
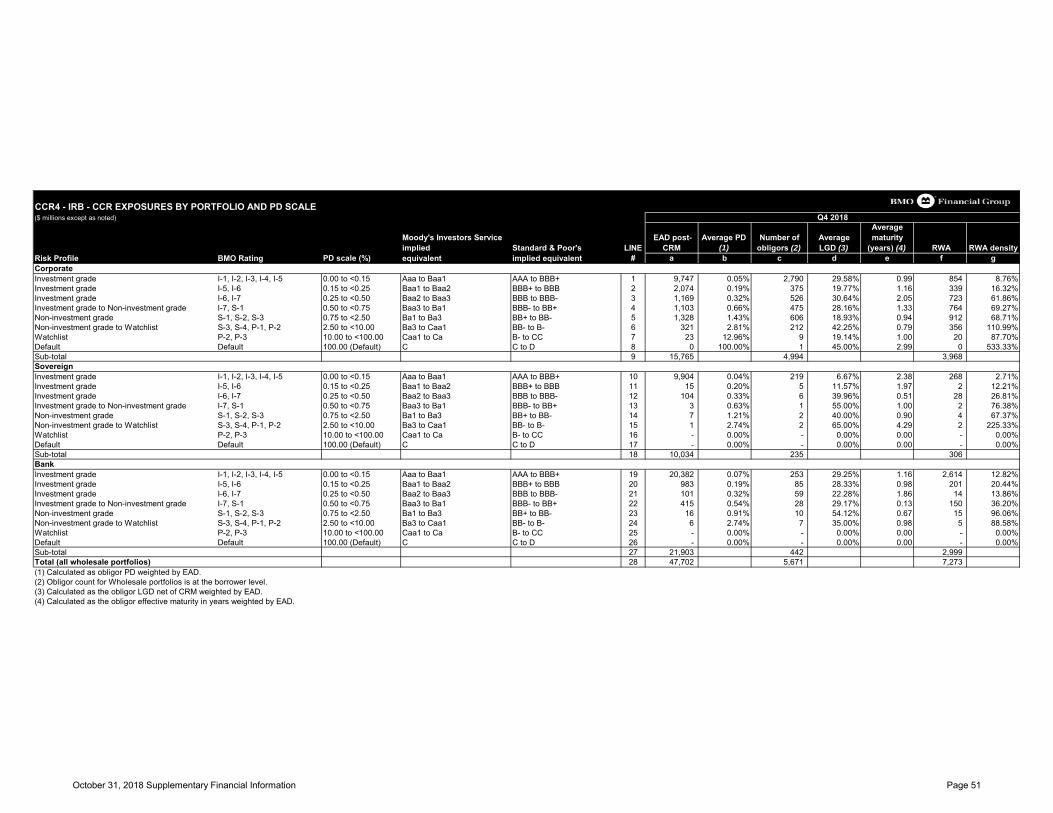
CCR4 - IRB - CCR EXPOSURES BY PORTFOLIO AND PD SCALE($ millions except as noted)
Moody's Investors Service implied Standard & Poor's LINE
EAD post-CRM
Average PD (1)
Number of obligors (2)
Average LGD (3)
Average maturity
(years) (4) RWA RWA densityRisk Profile BMO Rating PD scale (%) equivalent implied equivalent # a b c d e f gCorporateInvestment grade I-1, I-2, I-3, I-4, I-5 0.00 to <0.15 Aaa to Baa1 AAA to BBB+ 1 9,747 0.05% 2,790 29.58% 0.99 854 8.76%Investment grade I-5, I-6 0.15 to <0.25 Baa1 to Baa2 BBB+ to BBB 2 2,074 0.19% 375 19.77% 1.16 339 16.32%Investment grade I-6, I-7 0.25 to <0.50 Baa2 to Baa3 BBB to BBB- 3 1,169 0.32% 526 30.64% 2.05 723 61.86%Investment grade to Non-investment grade I-7, S-1 0.50 to <0.75 Baa3 to Ba1 BBB- to BB+ 4 1,103 0.66% 475 28.16% 1.33 764 69.27%Non-investment grade S-1, S-2, S-3 0.75 to <2.50 Ba1 to Ba3 BB+ to BB- 5 1,328 1.43% 606 18.93% 0.94 912 68.71%Non-investment grade to Watchlist S-3, S-4, P-1, P-2 2.50 to <10.00 Ba3 to Caa1 BB- to B- 6 321 2.81% 212 42.25% 0.79 356 110.99%Watchlist P-2, P-3 10.00 to <100.00 Caa1 to Ca B- to CC 7 23 12.96% 9 19.14% 1.00 20 87.70%Default Default 100.00 (Default) C C to D 8 0 100.00% 1 45.00% 2.99 0 533.33%Sub-total 9 15,765 4,994 3,968SovereignInvestment grade I-1, I-2, I-3, I-4, I-5 0.00 to <0.15 Aaa to Baa1 AAA to BBB+ 10 9,904 0.04% 219 6.67% 2.38 268 2.71%Investment grade I-5, I-6 0.15 to <0.25 Baa1 to Baa2 BBB+ to BBB 11 15 0.20% 5 11.57% 1.97 2 12.21%Investment grade I-6, I-7 0.25 to <0.50 Baa2 to Baa3 BBB to BBB- 12 104 0.33% 6 39.96% 0.51 28 26.81%Investment grade to Non-investment grade I-7, S-1 0.50 to <0.75 Baa3 to Ba1 BBB- to BB+ 13 3 0.63% 1 55.00% 1.00 2 76.38%Non-investment grade S-1, S-2, S-3 0.75 to <2.50 Ba1 to Ba3 BB+ to BB- 14 7 1.21% 2 40.00% 0.90 4 67.37%Non-investment grade to Watchlist S-3, S-4, P-1, P-2 2.50 to <10.00 Ba3 to Caa1 BB- to B- 15 1 2.74% 2 65.00% 4.29 2 225.33%Watchlist P-2, P-3 10.00 to <100.00 Caa1 to Ca B- to CC 16 - 0.00% - 0.00% 0.00 - 0.00%Default Default 100.00 (Default) C C to D 17 - 0.00% - 0.00% 0.00 - 0.00%Sub-total 18 10,034 235 306BankInvestment grade I-1, I-2, I-3, I-4, I-5 0.00 to <0.15 Aaa to Baa1 AAA to BBB+ 19 20,382 0.07% 253 29.25% 1.16 2,614 12.82%Investment grade I-5, I-6 0.15 to <0.25 Baa1 to Baa2 BBB+ to BBB 20 983 0.19% 85 28.33% 0.98 201 20.44%Investment grade I-6, I-7 0.25 to <0.50 Baa2 to Baa3 BBB to BBB- 21 101 0.32% 59 22.28% 1.86 14 13.86%Investment grade to Non-investment grade I-7, S-1 0.50 to <0.75 Baa3 to Ba1 BBB- to BB+ 22 415 0.54% 28 29.17% 0.13 150 36.20%Non-investment grade S-1, S-2, S-3 0.75 to <2.50 Ba1 to Ba3 BB+ to BB- 23 16 0.91% 10 54.12% 0.67 15 96.06%Non-investment grade to Watchlist S-3, S-4, P-1, P-2 2.50 to <10.00 Ba3 to Caa1 BB- to B- 24 6 2.74% 7 35.00% 0.98 5 88.58%Watchlist P-2, P-3 10.00 to <100.00 Caa1 to Ca B- to CC 25 - 0.00% - 0.00% 0.00 - 0.00%Default Default 100.00 (Default) C C to D 26 - 0.00% - 0.00% 0.00 - 0.00%Sub-total 27 21,903 442 2,999Total (all wholesale portfolios) 28 47,702 5,671 7,273(1) Calculated as obligor PD weighted by EAD.(2) Obligor count for Wholesale portfolios is at the borrower level. (3) Calculated as the obligor LGD net of CRM weighted by EAD.(4) Calculated as the obligor effective maturity in years weighted by EAD.
Q4 2018
October 31, 2018 Supplementary Financial Information Page 51
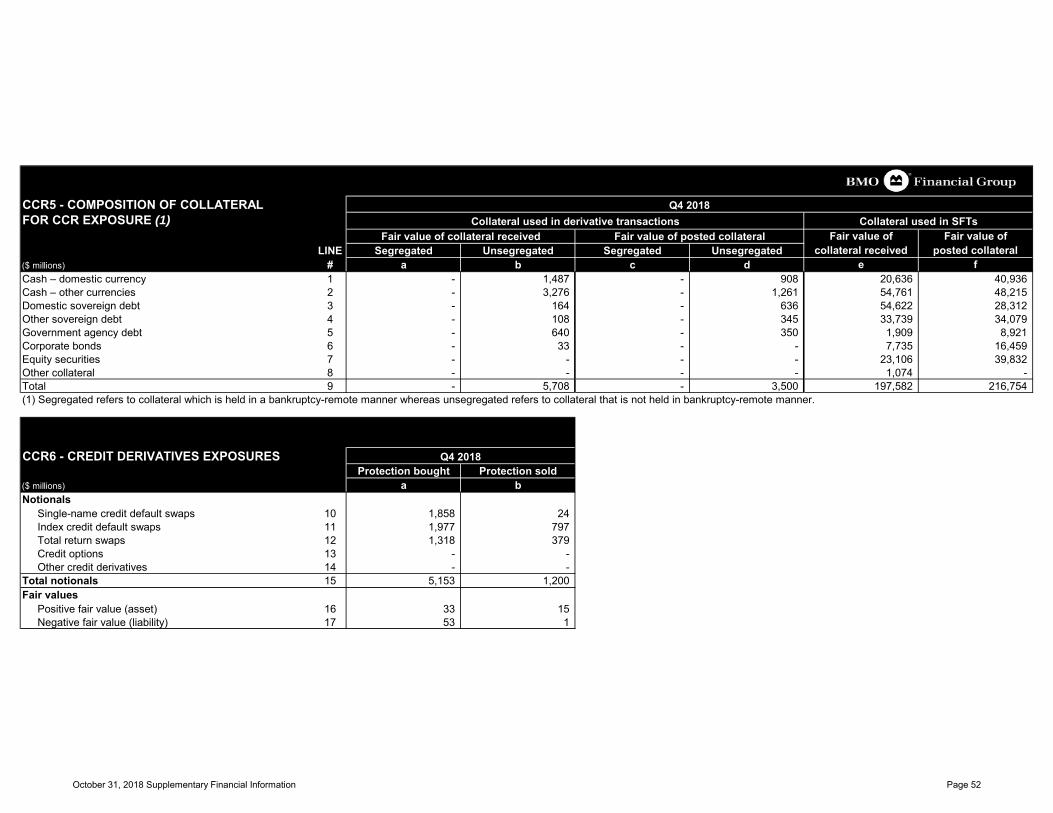
CCR5 - COMPOSITION OF COLLATERAL FOR CCR EXPOSURE (1)
Fair value of Fair value of LINE Segregated Unsegregated Segregated Unsegregated collateral received posted collateral
($ millions) # a b c d e fCash – domestic currency 1 - 1,487 - 908 20,636 40,936Cash – other currencies 2 - 3,276 - 1,261 54,761 48,215Domestic sovereign debt 3 - 164 - 636 54,622 28,312Other sovereign debt 4 - 108 - 345 33,739 34,079Government agency debt 5 - 640 - 350 1,909 8,921Corporate bonds 6 - 33 - - 7,735 16,459Equity securities 7 - - - - 23,106 39,832Other collateral 8 - - - - 1,074 -Total 9 - 5,708 - 3,500 197,582 216,754(1) Segregated refers to collateral which is held in a bankruptcy-remote manner whereas unsegregated refers to collateral that is not held in bankruptcy-remote manner.
CCR6 - CREDIT DERIVATIVES EXPOSURESProtection bought Protection sold
($ millions) a bNotionals
Single-name credit default swaps 10 1,858 24Index credit default swaps 11 1,977 797Total return swaps 12 1,318 379Credit options 13 - -Other credit derivatives 14 - -
Total notionals 15 5,153 1,200Fair values
Positive fair value (asset) 16 33 15Negative fair value (liability) 17 53 1
Q4 2018
Q4 2018Collateral used in derivative transactions Collateral used in SFTs
Fair value of collateral received Fair value of posted collateral
October 31, 2018 Supplementary Financial Information Page 52
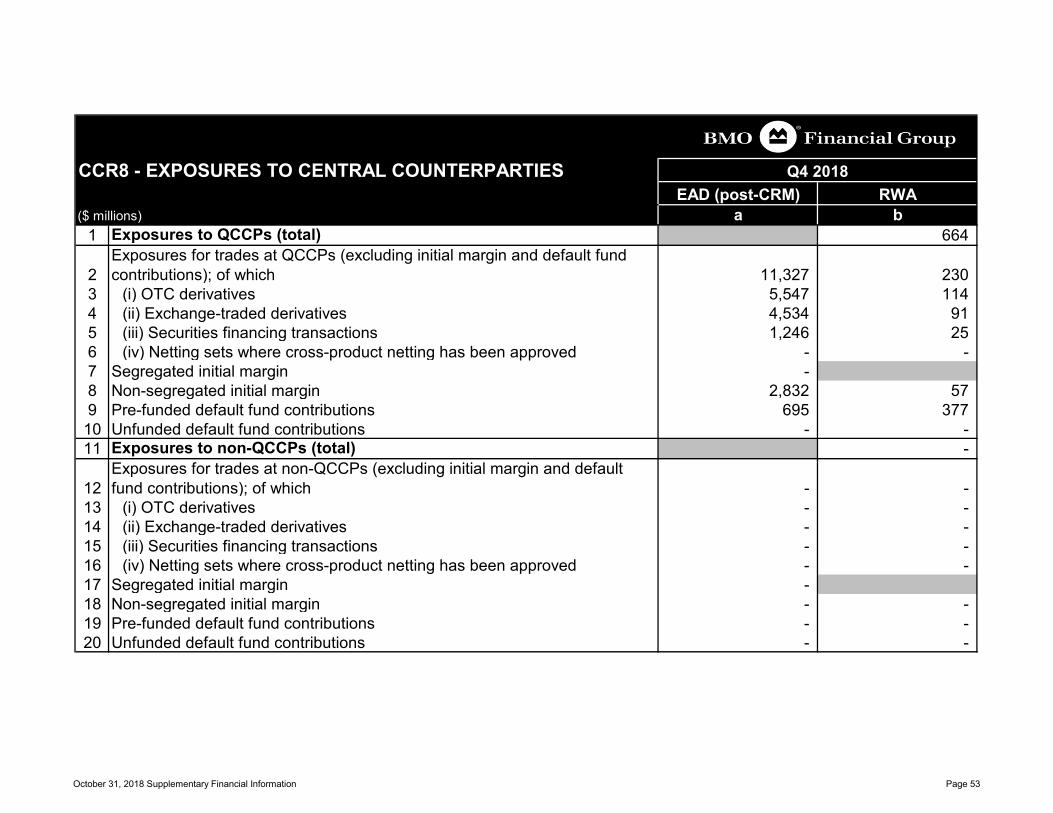
CCR8 - EXPOSURES TO CENTRAL COUNTERPARTIESEAD (post-CRM) RWA
($ millions) a b1 Exposures to QCCPs (total) 664
2Exposures for trades at QCCPs (excluding initial margin and default fund contributions); of which 11,327 230
3 (i) OTC derivatives 5,547 1144 (ii) Exchange-traded derivatives 4,534 915 (iii) Securities financing transactions 1,246 256 (iv) Netting sets where cross-product netting has been approved - -7 Segregated initial margin -8 Non-segregated initial margin 2,832 579 Pre-funded default fund contributions 695 377
10 Unfunded default fund contributions - -11 Exposures to non-QCCPs (total) -
12Exposures for trades at non-QCCPs (excluding initial margin and default fund contributions); of which - -
13 (i) OTC derivatives - -14 (ii) Exchange-traded derivatives - -15 (iii) Securities financing transactions - -16 (iv) Netting sets where cross-product netting has been approved - -17 Segregated initial margin -18 Non-segregated initial margin - -19 Pre-funded default fund contributions - -20 Unfunded default fund contributions - -
Q4 2018
October 31, 2018 Supplementary Financial Information Page 53
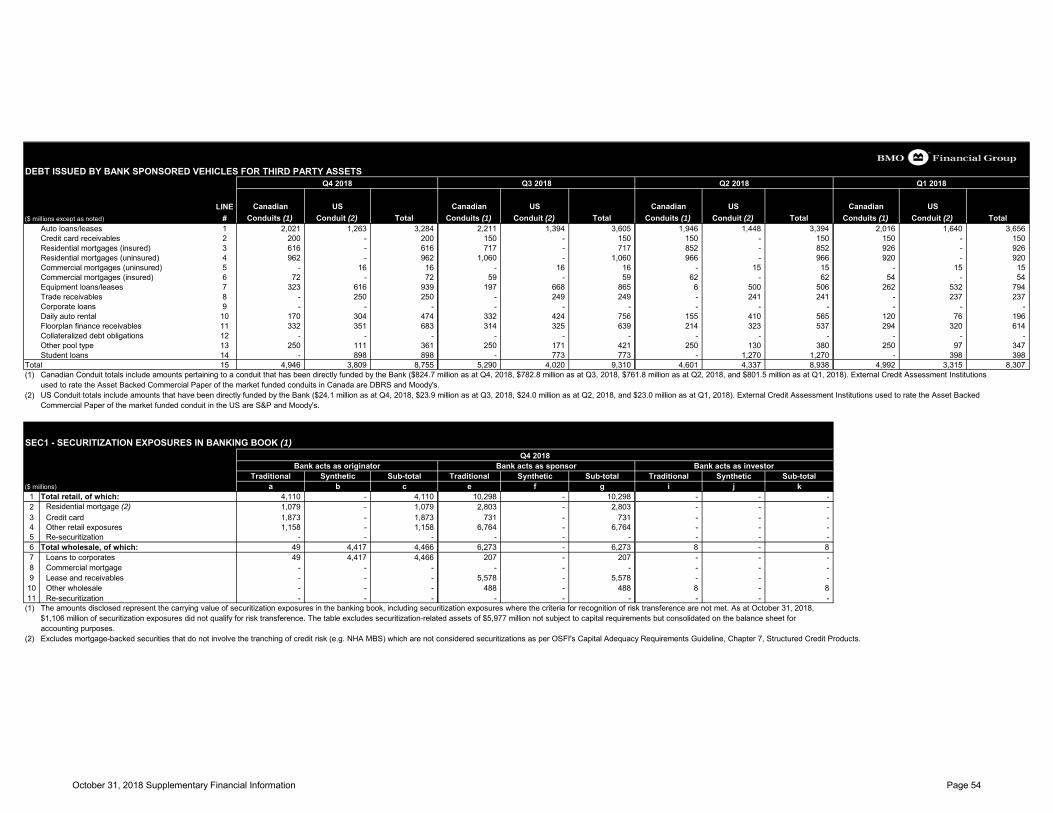
DEBT ISSUED BY BANK SPONSORED VEHICLES FOR THIRD PARTY ASSETS Q4 2018 Q3 2018 Q2 2018 Q1 2018
LINE Canadian US Canadian US Canadian US Canadian US ($ millions except as noted) # Conduits (1) Conduit (2) Total Conduits (1) Conduit (2) Total Conduits (1) Conduit (2) Total Conduits (1) Conduit (2) Total
Auto loans/leases 1 2,021 1,263 3,284 2,211 1,394 3,605 1,946 1,448 3,394 2,016 1,640 3,656 Credit card receivables 2 200 - 200 150 - 150 150 - 150 150 - 150 Residential mortgages (insured) 3 616 - 616 717 - 717 852 - 852 926 - 926 Residential mortgages (uninsured) 4 962 - 962 1,060 - 1,060 966 - 966 920 - 920 Commercial mortgages (uninsured) 5 - 16 16 - 16 16 - 15 15 - 15 15 Commercial mortgages (insured) 6 72 - 72 59 - 59 62 - 62 54 - 54 Equipment loans/leases 7 323 616 939 197 668 865 6 500 506 262 532 794 Trade receivables 8 - 250 250 - 249 249 - 241 241 - 237 237 Corporate loans 9 - - - - - - - - - - - - Daily auto rental 10 170 304 474 332 424 756 155 410 565 120 76 196 Floorplan finance receivables 11 332 351 683 314 325 639 214 323 537 294 320 614 Collateralized debt obligations 12 - - - - - - - - - - - - Other pool type 13 250 111 361 250 171 421 250 130 380 250 97 347 Student loans 14 - 898 898 - 773 773 - 1,270 1,270 - 398 398
Total 15 4,946 3,809 8,755 5,290 4,020 9,310 4,601 4,337 8,938 4,992 3,315 8,307 (1) Canadian Conduit totals include amounts pertaining to a conduit that has been directly funded by the Bank ($824.7 million as at Q4, 2018, $782.8 million as at Q3, 2018, $761.8 million as at Q2, 2018, and $801.5 million as at Q1, 2018). External Credit Assessment Institutions
used to rate the Asset Backed Commercial Paper of the market funded conduits in Canada are DBRS and Moody's. (2) US Conduit totals include amounts that have been directly funded by the Bank ($24.1 million as at Q4, 2018, $23.9 million as at Q3, 2018, $24.0 million as at Q2, 2018, and $23.0 million as at Q1, 2018). External Credit Assessment Institutions used to rate the Asset Backed
Commercial Paper of the market funded conduit in the US are S&P and Moody's.
SEC1 - SECURITIZATION EXPOSURES IN BANKING BOOK (1)
Traditional Synthetic Sub-total Traditional Synthetic Sub-total Traditional Synthetic Sub-total($ millions) a b c e f g i j k
1 Total retail, of which: 4,110 - 4,110 10,298 - 10,298 - - -2 Residential mortgage (2) 1,079 - 1,079 2,803 - 2,803 - - -3 Credit card 1,873 - 1,873 731 - 731 - - -4 Other retail exposures 1,158 - 1,158 6,764 - 6,764 - - -5 Re-securitization - - - - - - - - -6 Total wholesale, of which: 49 4,417 4,466 6,273 - 6,273 8 - 87 Loans to corporates 49 4,417 4,466 207 - 207 - - -8 Commercial mortgage - - - - - - - - -9 Lease and receivables - - - 5,578 - 5,578 - - -
10 Other wholesale - - - 488 - 488 8 - 811 Re-securitization - - - - - - - - -
(1) The amounts disclosed represent the carrying value of securitization exposures in the banking book, including securitization exposures where the criteria for recognition of risk transference are not met. As at October 31, 2018,$1,106 million of securitization exposures did not qualify for risk transference. The table excludes securitization-related assets of $5,977 million not subject to capital requirements but consolidated on the balance sheet for accounting purposes.
(2) Excludes mortgage-backed securities that do not involve the tranching of credit risk (e.g. NHA MBS) which are not considered securitizations as per OSFI's Capital Adequacy Requirements Guideline, Chapter 7, Structured Credit Products.
Q4 2018Bank acts as originator Bank acts as sponsor Bank acts as investor
October 31, 2018 Supplementary Financial Information Page 54
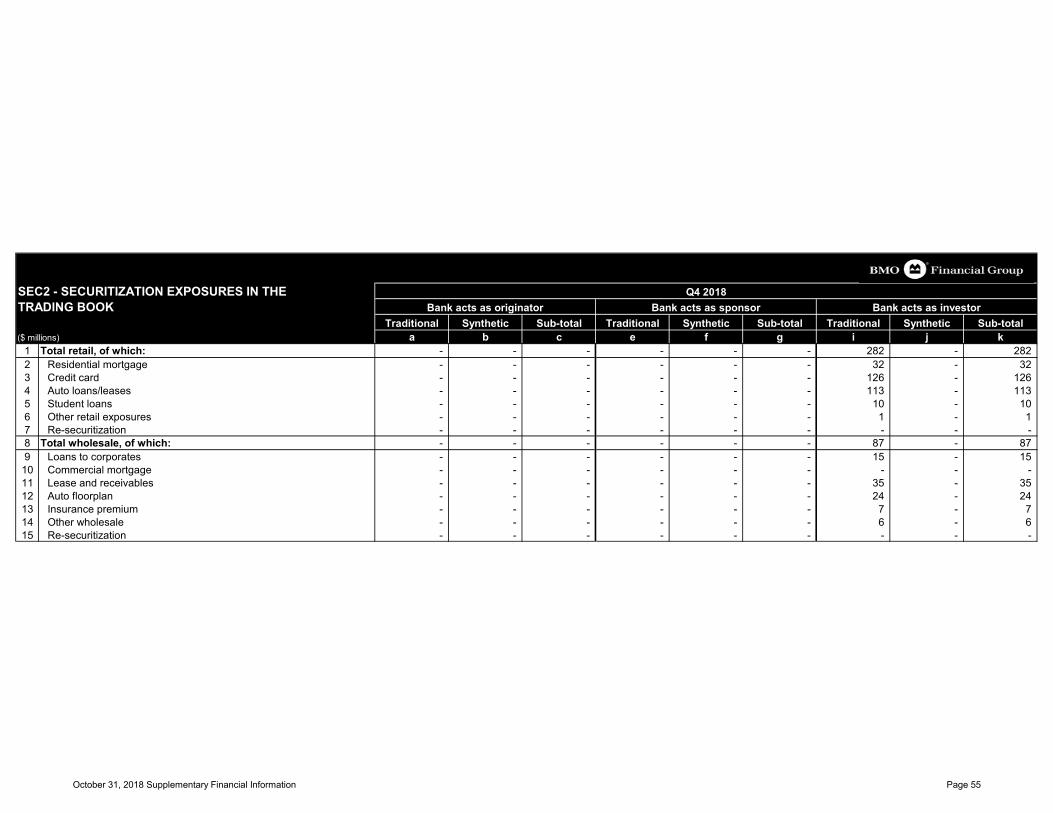
SEC2 - SECURITIZATION EXPOSURES IN THE TRADING BOOK
Traditional Synthetic Sub-total Traditional Synthetic Sub-total Traditional Synthetic Sub-total($ millions) a b c e f g i j k
1 Total retail, of which: - - - - - - 282 - 2822 Residential mortgage - - - - - - 32 - 323 Credit card - - - - - - 126 - 1264 Auto loans/leases - - - - - - 113 - 1135 Student loans - - - - - - 10 - 106 Other retail exposures - - - - - - 1 - 17 Re-securitization - - - - - - - - -8 Total wholesale, of which: - - - - - - 87 - 879 Loans to corporates - - - - - - 15 - 1510 Commercial mortgage - - - - - - - - -11 Lease and receivables - - - - - - 35 - 3512 Auto floorplan - - - - - - 24 - 2413 Insurance premium - - - - - - 7 - 714 Other wholesale - - - - - - 6 - 615 Re-securitization - - - - - - - - -
Q4 2018Bank acts as originator Bank acts as sponsor Bank acts as investor
October 31, 2018 Supplementary Financial Information Page 55
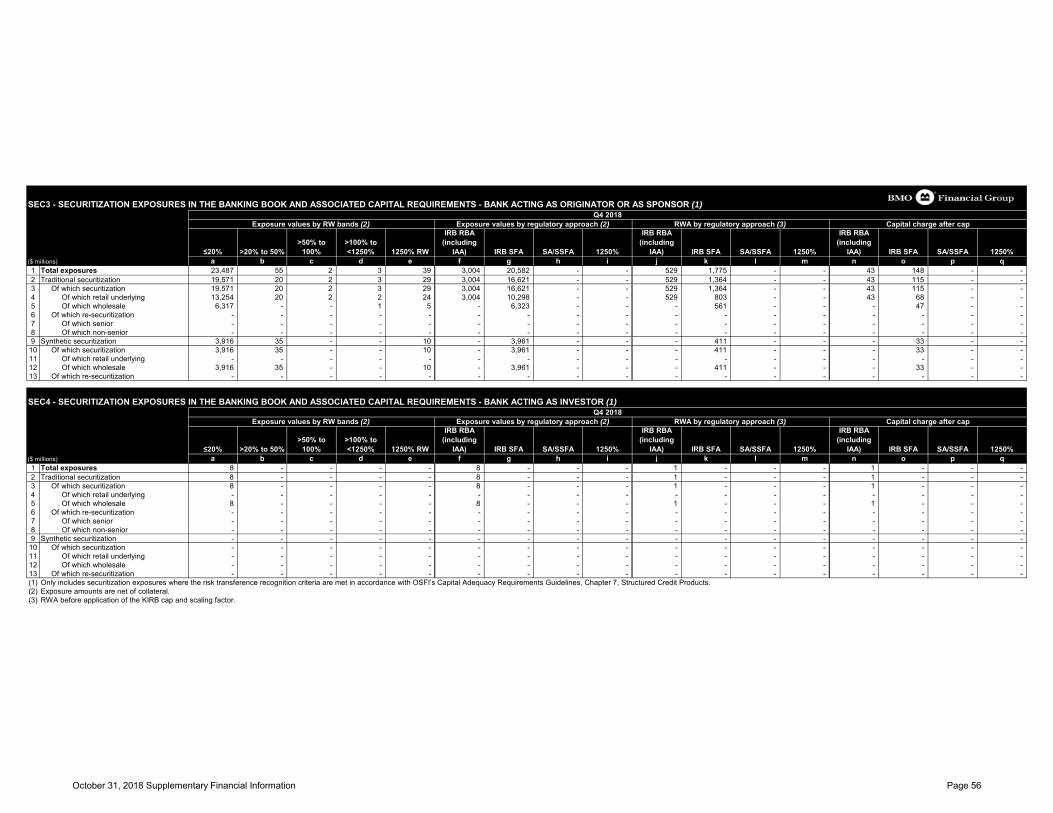
SEC3 - SECURITIZATION EXPOSURES IN THE BANKING BOOK AND ASSOCIATED CAPITAL REQUIREMENTS - BANK ACTING AS ORIGINATOR OR AS SPONSOR (1)
≤20% >20% to 50% >50% to
100% >100% to <1250% 1250% RW
IRB RBA (including
IAA) IRB SFA SA/SSFA 1250%
IRB RBA (including
IAA) IRB SFA SA/SSFA 1250%
IRB RBA (including
IAA) IRB SFA SA/SSFA 1250% ($ millions) a b c d e f g h i j k l m n o p q1 Total exposures 23,487 55 2 3 39 3,004 20,582 - - 529 1,775 - - 43 148 - -2 Traditional securitization 19,571 20 2 3 29 3,004 16,621 - - 529 1,364 - - 43 115 - -3 Of which securitization 19,571 20 2 3 29 3,004 16,621 - - 529 1,364 - - 43 115 - -4 Of which retail underlying 13,254 20 2 2 24 3,004 10,298 - - 529 803 - - 43 68 - -5 Of which wholesale 6,317 - - 1 5 - 6,323 - - - 561 - - - 47 - -6 Of which re-securitization - - - - - - - - - - - - - - - - -7 Of which senior - - - - - - - - - - - - - - - - -8 Of which non-senior - - - - - - - - - - - - - - - - -9 Synthetic securitization 3,916 35 - - 10 - 3,961 - - - 411 - - - 33 - -
10 Of which securitization 3,916 35 - - 10 - 3,961 - - - 411 - - - 33 - -11 Of which retail underlying - - - - - - - - - - - - - - - - -12 Of which wholesale 3,916 35 - - 10 - 3,961 - - - 411 - - - 33 - -13 Of which re-securitization - - - - - - - - - - - - - - - - -
SEC4 - SECURITIZATION EXPOSURES IN THE BANKING BOOK AND ASSOCIATED CAPITAL REQUIREMENTS - BANK ACTING AS INVESTOR (1)
≤20% >20% to 50% >50% to
100% >100% to <1250% 1250% RW
IRB RBA (including
IAA) IRB SFA SA/SSFA 1250%
IRB RBA (including
IAA) IRB SFA SA/SSFA 1250%
IRB RBA (including
IAA) IRB SFA SA/SSFA 1250% ($ millions) a b c d e f g h i j k l m n o p q1 Total exposures 8 - - - - 8 - - - 1 - - - 1 - - -2 Traditional securitization 8 - - - - 8 - - - 1 - - - 1 - - -3 Of which securitization 8 - - - - 8 - - - 1 - - - 1 - - -4 Of which retail underlying - - - - - - - - - - - - - - - - -5 Of which wholesale 8 - - - - 8 - - - 1 - - - 1 - - -6 Of which re-securitization - - - - - - - - - - - - - - - - -7 Of which senior - - - - - - - - - - - - - - - - -8 Of which non-senior - - - - - - - - - - - - - - - - -9 Synthetic securitization - - - - - - - - - - - - - - - - -
10 Of which securitization - - - - - - - - - - - - - - - - -11 Of which retail underlying - - - - - - - - - - - - - - - - -12 Of which wholesale - - - - - - - - - - - - - - - - -13 Of which re-securitization - - - - - - - - - - - - - - - - -(1) Only includes securitization exposures where the risk transference recognition criteria are met in accordance with OSFI’s Capital Adequacy Requirements Guidelines, Chapter 7, Structured Credit Products. (2) Exposure amounts are net of collateral. (3) RWA before application of the KIRB cap and scaling factor.
Exposure values by RW bands (2) Exposure values by regulatory approach (2) RWA by regulatory approach (3) Capital charge after cap
Q4 2018Exposure values by RW bands (2) Exposure values by regulatory approach (2) RWA by regulatory approach (3) Capital charge after cap
Q4 2018
October 31, 2018 Supplementary Financial Information Page 56
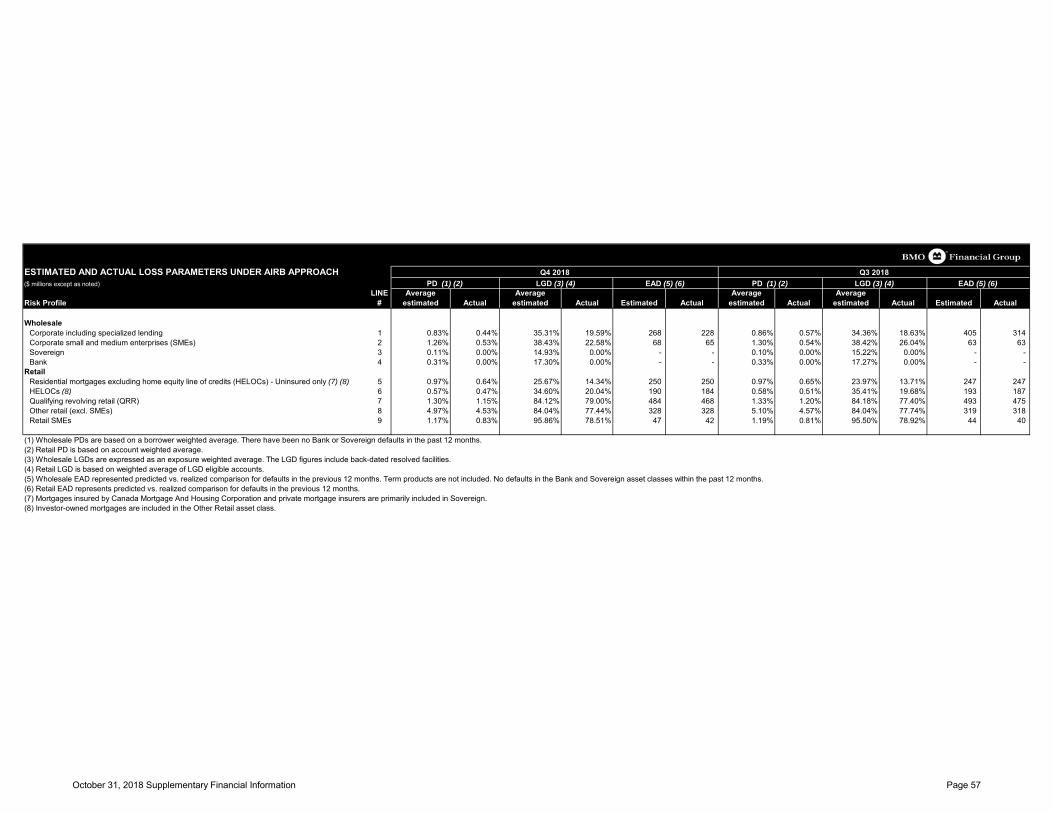
ESTIMATED AND ACTUAL LOSS PARAMETERS UNDER AIRB APPROACH($ millions except as noted)
Risk ProfileLINE
#Average
estimated ActualAverage
estimated Actual Estimated ActualAverage
estimated ActualAverage
estimated Actual Estimated Actual
WholesaleCorporate including specialized lending 1 0.83% 0.44% 35.31% 19.59% 268 228 0.86% 0.57% 34.36% 18.63% 405 314 Corporate small and medium enterprises (SMEs) 2 1.26% 0.53% 38.43% 22.58% 68 65 1.30% 0.54% 38.42% 26.04% 63 63 Sovereign 3 0.11% 0.00% 14.93% 0.00% - - 0.10% 0.00% 15.22% 0.00% - - Bank 4 0.31% 0.00% 17.30% 0.00% - - 0.33% 0.00% 17.27% 0.00% - -
Retail Residential mortgages excluding home equity line of credits (HELOCs) - Uninsured only (7) (8) 5 0.97% 0.64% 25.67% 14.34% 250 250 0.97% 0.65% 23.97% 13.71% 247 247 HELOCs (8) 6 0.57% 0.47% 34.60% 20.04% 190 184 0.58% 0.51% 35.41% 19.68% 193 187 Qualifying revolving retail (QRR) 7 1.30% 1.15% 84.12% 79.00% 484 468 1.33% 1.20% 84.18% 77.40% 493 475 Other retail (excl. SMEs) 8 4.97% 4.53% 84.04% 77.44% 328 328 5.10% 4.57% 84.04% 77.74% 319 318 Retail SMEs 9 1.17% 0.83% 95.86% 78.51% 47 42 1.19% 0.81% 95.50% 78.92% 44 40
(1) Wholesale PDs are based on a borrower weighted average. There have been no Bank or Sovereign defaults in the past 12 months.(2) Retail PD is based on account weighted average.(3) Wholesale LGDs are expressed as an exposure weighted average. The LGD figures include back-dated resolved facilities.(4) Retail LGD is based on weighted average of LGD eligible accounts.(5) Wholesale EAD represented predicted vs. realized comparison for defaults in the previous 12 months. Term products are not included. No defaults in the Bank and Sovereign asset classes within the past 12 months.(6) Retail EAD represents predicted vs. realized comparison for defaults in the previous 12 months.(7) Mortgages insured by Canada Mortgage And Housing Corporation and private mortgage insurers are primarily included in Sovereign.(8) Investor-owned mortgages are included in the Other Retail asset class.
Q4 2018 Q3 2018PD (1) (2) LGD (3) (4) EAD (5) (6) PD (1) (2) LGD (3) (4) EAD (5) (6)
October 31, 2018 Supplementary Financial Information Page 57
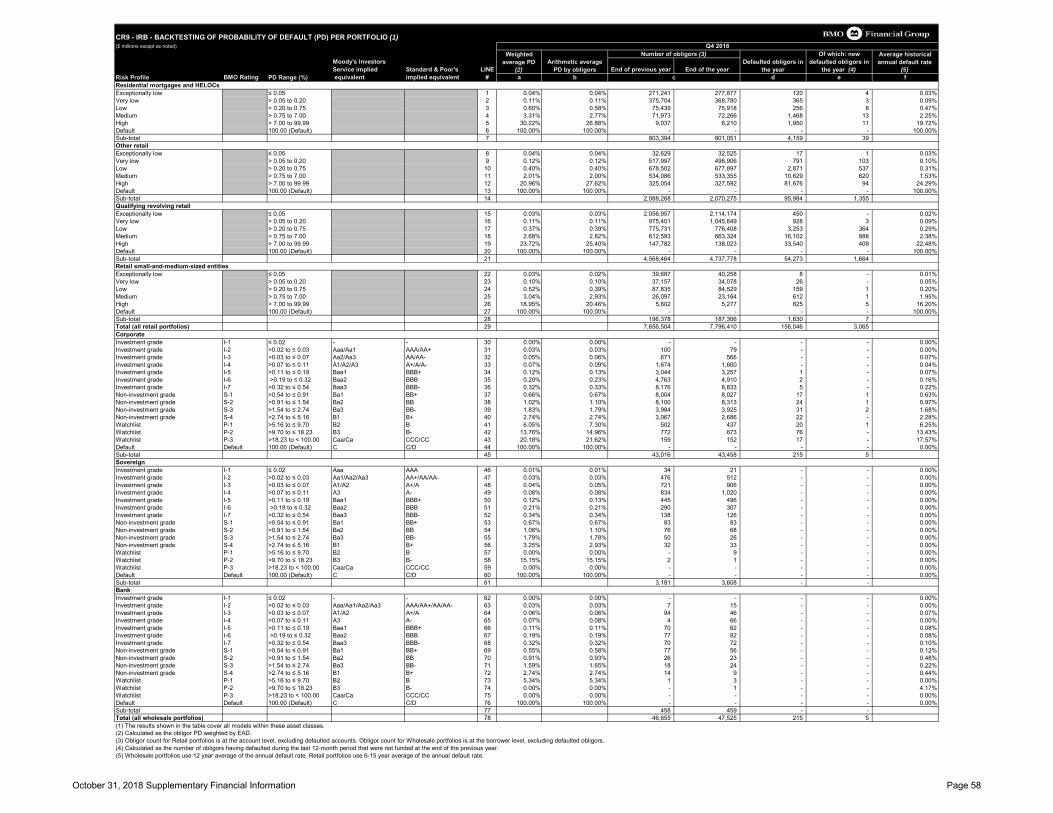
CR9 - IRB - BACKTESTING OF PROBABILITY OF DEFAULT (PD) PER PORTFOLIO (1)($ millions except as noted) Q4 2018
Moody's Investors Service implied Standard & Poor's LINE End of previous year End of the year
Risk Profile BMO Rating PD Range (%) equivalent implied equivalent # a b d e fResidential mortgages and HELOCsExceptionally low ≤ 0.05 1 0.04% 0.04% 271,241 277,877 120 4 0.03%Very low > 0.05 to 0.20 2 0.11% 0.11% 375,704 368,780 365 3 0.09%Low > 0.20 to 0.75 3 0.60% 0.58% 75,439 75,918 256 8 0.47%Medium > 0.75 to 7.00 4 3.31% 2.77% 71,973 72,266 1,468 13 2.25%High > 7.00 to 99.99 5 30.22% 26.88% 9,037 6,210 1,950 11 19.72%Default 100.00 (Default) 6 100.00% 100.00% - - - - 100.00%Sub-total 7 803,394 801,051 4,159 39Other retailExceptionally low ≤ 0.05 8 0.04% 0.04% 32,629 32,525 17 1 0.03%Very low > 0.05 to 0.20 9 0.12% 0.12% 517,997 498,906 791 103 0.10%Low > 0.20 to 0.75 10 0.40% 0.40% 678,502 677,897 2,871 537 0.31%Medium > 0.75 to 7.00 11 2.01% 2.00% 534,086 533,355 10,629 620 1.53%High > 7.00 to 99.99 12 20.96% 27.62% 325,054 327,592 81,676 94 24.29%Default 100.00 (Default) 13 100.00% 100.00% - - - - 100.00%Sub-total 14 2,088,268 2,070,275 95,984 1,355Qualifying revolving retailExceptionally low ≤ 0.05 15 0.03% 0.03% 2,056,957 2,114,174 450 - 0.02%Very low > 0.05 to 0.20 16 0.11% 0.11% 975,401 1,045,849 928 3 0.09%Low > 0.20 to 0.75 17 0.37% 0.39% 775,731 776,408 3,253 364 0.29%Medium > 0.75 to 7.00 18 2.68% 2.82% 612,593 663,324 16,102 888 2.38%High > 7.00 to 99.99 19 23.72% 25.40% 147,782 138,023 33,540 409 22.48%Default 100.00 (Default) 20 100.00% 100.00% - - - - 100.00%Sub-total 21 4,568,464 4,737,778 54,273 1,664Retail small-and-medium-sized entitiesExceptionally low ≤ 0.05 22 0.03% 0.02% 39,687 40,258 8 - 0.01%Very low > 0.05 to 0.20 23 0.10% 0.10% 37,157 34,078 26 - 0.05%Low > 0.20 to 0.75 24 0.52% 0.39% 87,835 84,529 159 1 0.20%Medium > 0.75 to 7.00 25 3.04% 2.93% 26,097 23,164 612 1 1.95%High > 7.00 to 99.99 26 18.95% 20.46% 5,602 5,277 825 5 16.20%Default 100.00 (Default) 27 100.00% 100.00% - - - - 100.00%Sub-total 28 196,378 187,306 1,630 7Total (all retail portfolios) 29 7,656,504 7,796,410 156,046 3,065CorporateInvestment grade I-1 ≤ 0.02 - - 30 0.00% 0.00% - - - - 0.00%Investment grade I-2 >0.02 to ≤ 0.03 Aaa/Aa1 AAA/AA+ 31 0.03% 0.03% 100 79 - - 0.00%Investment grade I-3 >0.03 to ≤ 0.07 Aa2/Aa3 AA/AA- 32 0.05% 0.06% 671 566 - - 0.07%Investment grade I-4 >0.07 to ≤ 0.11 A1/A2/A3 A+/A/A- 33 0.07% 0.09% 1,674 1,600 - - 0.04%Investment grade I-5 >0.11 to ≤ 0.19 Baa1 BBB+ 34 0.12% 0.13% 3,044 3,257 1 - 0.07%Investment grade I-6 >0.19 to ≤ 0.32 Baa2 BBB 35 0.20% 0.23% 4,763 4,910 2 - 0.16%Investment grade I-7 >0.32 to ≤ 0.54 Baa3 BBB- 36 0.32% 0.33% 8,176 8,833 5 - 0.22%Non-investment grade S-1 >0.54 to ≤ 0.91 Ba1 BB+ 37 0.66% 0.67% 8,004 8,027 17 1 0.63%Non-investment grade S-2 >0.91 to ≤ 1.54 Ba2 BB 38 1.02% 1.10% 8,100 8,313 24 1 0.97%Non-investment grade S-3 >1.54 to ≤ 2.74 Ba3 BB- 39 1.83% 1.79% 3,984 3,925 31 2 1.68%Non-investment grade S-4 >2.74 to ≤ 5.16 B1 B+ 40 2.74% 2.74% 3,067 2,686 22 - 2.28%Watchlist P-1 >5.16 to ≤ 9.70 B2 B 41 6.05% 7.30% 502 437 20 1 6.25%Watchlist P-2 >9.70 to ≤ 18.23 B3 B- 42 13.76% 14.96% 772 673 76 - 13.43%Watchlist P-3 >18.23 to < 100.00 Caa/Ca CCC/CC 43 20.18% 21.62% 159 152 17 - 17.57%Default Default 100.00 (Default) C C/D 44 100.00% 100.00% - - - - 0.00%Sub-total 45 43,016 43,458 215 5SovereignInvestment grade I-1 ≤ 0.02 Aaa AAA 46 0.01% 0.01% 34 21 - - 0.00%Investment grade I-2 >0.02 to ≤ 0.03 Aa1/Aa2/Aa3 AA+/AA/AA- 47 0.03% 0.03% 476 512 - - 0.00%Investment grade I-3 >0.03 to ≤ 0.07 A1/A2 A+/A 48 0.04% 0.05% 721 906 - - 0.00%Investment grade I-4 >0.07 to ≤ 0.11 A3 A- 49 0.08% 0.08% 834 1,020 - - 0.00%Investment grade I-5 >0.11 to ≤ 0.19 Baa1 BBB+ 50 0.12% 0.13% 445 496 - - 0.00%Investment grade I-6 >0.19 to ≤ 0.32 Baa2 BBB 51 0.21% 0.21% 290 307 - - 0.00%Investment grade I-7 >0.32 to ≤ 0.54 Baa3 BBB- 52 0.34% 0.34% 138 126 - - 0.00%Non-investment grade S-1 >0.54 to ≤ 0.91 Ba1 BB+ 53 0.67% 0.67% 83 83 - - 0.00%Non-investment grade S-2 >0.91 to ≤ 1.54 Ba2 BB 54 1.08% 1.10% 76 68 - - 0.00%Non-investment grade S-3 >1.54 to ≤ 2.74 Ba3 BB- 55 1.79% 1.78% 50 26 - - 0.00%Non-investment grade S-4 >2.74 to ≤ 5.16 B1 B+ 56 3.25% 2.93% 32 33 - - 0.00%Watchlist P-1 >5.16 to ≤ 9.70 B2 B 57 0.00% 0.00% - 9 - - 0.00%Watchlist P-2 >9.70 to ≤ 18.23 B3 B- 58 15.15% 15.15% 2 1 - - 0.00%Watchlist P-3 >18.23 to < 100.00 Caa/Ca CCC/CC 59 0.00% 0.00% - - - - 0.00%Default Default 100.00 (Default) C C/D 60 100.00% 100.00% - - - - 0.00%Sub-total 61 3,181 3,608 - -BankInvestment grade I-1 ≤ 0.02 - - 62 0.00% 0.00% - - - - 0.00%Investment grade I-2 >0.02 to ≤ 0.03 Aaa/Aa1/Aa2/Aa3 AAA/AA+/AA/AA- 63 0.03% 0.03% 7 15 - - 0.00%Investment grade I-3 >0.03 to ≤ 0.07 A1/A2 A+/A 64 0.06% 0.06% 94 46 - - 0.07%Investment grade I-4 >0.07 to ≤ 0.11 A3 A- 65 0.07% 0.08% 4 66 - - 0.00%Investment grade I-5 >0.11 to ≤ 0.19 Baa1 BBB+ 66 0.11% 0.11% 70 62 - - 0.08%Investment grade I-6 >0.19 to ≤ 0.32 Baa2 BBB 67 0.19% 0.19% 77 82 - - 0.08%Investment grade I-7 >0.32 to ≤ 0.54 Baa3 BBB- 68 0.32% 0.32% 70 72 - - 0.10%Non-investment grade S-1 >0.54 to ≤ 0.91 Ba1 BB+ 69 0.55% 0.58% 77 56 - - 0.12%Non-investment grade S-2 >0.91 to ≤ 1.54 Ba2 BB 70 0.91% 0.93% 26 23 - - 0.48%Non-investment grade S-3 >1.54 to ≤ 2.74 Ba3 BB- 71 1.59% 1.65% 18 24 - - 0.22%Non-investment grade S-4 >2.74 to ≤ 5.16 B1 B+ 72 2.74% 2.74% 14 9 - - 0.44%Watchlist P-1 >5.16 to ≤ 9.70 B2 B 73 5.34% 5.34% 1 3 - - 0.00%Watchlist P-2 >9.70 to ≤ 18.23 B3 B- 74 0.00% 0.00% - 1 - - 4.17%Watchlist P-3 >18.23 to < 100.00 Caa/Ca CCC/CC 75 0.00% 0.00% - - - - 0.00%Default Default 100.00 (Default) C C/D 76 100.00% 100.00% - - - - 0.00%Sub-total 77 458 459 - -Total (all wholesale portfolios) 78 46,655 47,525 215 5(1) The results shown in the table cover all models within these asset classes.(2) Calculated as the obligor PD weighted by EAD.(3) Obligor count for Retail portfolios is at the account level, excluding defaulted accounts. Obligor count for Wholesale portfolios is at the borrower level, excluding defaulted obligors.(4) Calculated as the number of obligors having defaulted during the last 12-month period that were not funded at the end of the previous year.(5) Wholesale portfolios use 12 year average of the annual default rate. Retail portfolios use 6-15 year average of the annual default rate.
Defaulted obligors in the year
Of which: new defaulted obligors in
the year (4)
Average historical annual default rate
(5)c
Weighted average PD
(2)Arithmetic average
PD by obligors
Number of obligors (3)
October 31, 2018 Supplementary Financial Information Page 58
2
BASEL GLOSSARY
AIRB (Advanced Internal Ratings Based approach): The AIRB approach is the most advanced of the range of options for determining the capital requirements for credit risk. This option allows banks to use their own internal model to measure credit risk capital requirements, subject to regulatory approval. OSFI has indicated that it expects the largest Canadian Banksto adopt the AIRB approach.
Basel Capital Floor: A capital floor is measured based on the Basel standardized approach for credit risk and internal model market risk, as prescribed by OSFI in CAR.
Capital Adequacy Requirements (CAR): OSFI's Capital Adequacy Requirements guideline.
Credit Conversion Factor (CCF) converts an off balance sheet exposure to its credit exposure equivalent.
Credit Risk Mitigation (CRM) are techniques under the CAR that banks use to mitigate credit risk and applicable capital, including exposures collateralized by first priority claims, in whole or in part with cash or securities, a loan exposure guaranteed by a third party, or a credit derivative to offset various forms of credit risk.
Credit valuation adjustment (CVA) is the adjustment that a bank must add as capital charge to cover the risk of mark-to-market losses on the expected counterparty risk to OTCderivatives.
The Current exposure method (CEM) is a method to calculate the exposure at default for OTC derivatives when the Internal Models Method (IMM) is not used.
Drawn: The amount of funds invested or advanced to a customer.
Exposure at Default (EAD): EAD for on-balance sheet amounts represents outstandings, grossed up by provisions for credit losses on impaired loans and write-offs. EAD for undrawn and other off-balance sheet are estimated using CCFs.
Exposure at Default OTC Derivatives: Represent the net gross positive replacement costs plus the potential credit exposure amount.
HELOCs: Home Equity Lines of Credit comprise lines of credit secured by equity in a residential property.
OSFI: Office of the Superintendent of Financial Institutions.
Pillar 3: OSFI prescribed regulatory disclosures to promote market discipline.
Qualifying central counterparty (QCCP) is an entity that is licensed to operate as a central counterparty (CCP) and is permitted by the appropriate regulator/overseer to operate as such with respect to the products offered.
RWA Density is the ratio of Σ risk weighted assets / (total exposures post CCF and post CRM). It provides a synthetic metric on riskiness of each portfolio.
Scaling Factor: Regulatory requirement of an incremental multiplier of 1.06 applied to AIRB credit risk RWA.
Securities Financing Transactions (SFT): transactions such as repurchase agreements, reverse repurchase agreements, security lending and borrowing, and wholesale margin lending transactions.
Standardized Approach: This option allows banks to measure capital requirements by multiplying exposures by defined percentages based on the exposures product type and external credit rating (if applicable).
Value at risk (VaR) is a measure of how much a set of investments might lose (with a given probability), given normal market conditions, in a set time period.
October 31, 2018 Supplementary Financial Information Page 59


![X2[n]=u[n]+u[-n] x2[n] [n] x2[n]](https://img.pdfslide.us/doc/110x75/626a91065c876f7b4e5c12b7/x2nunu-n-x2n-n-x2n.jpg)