Embed Size (px)
Citation preview

Supplementary Figure 1. TRAF3 protein expression in the muscle and fat samples from mice
treated with NC or HFD for 24 weeks. n=4 for each group. n.s. no significant difference. The data
represent as the mean ± s.d. Statistical analysis was carried out by Student’s two-tailed t-test.
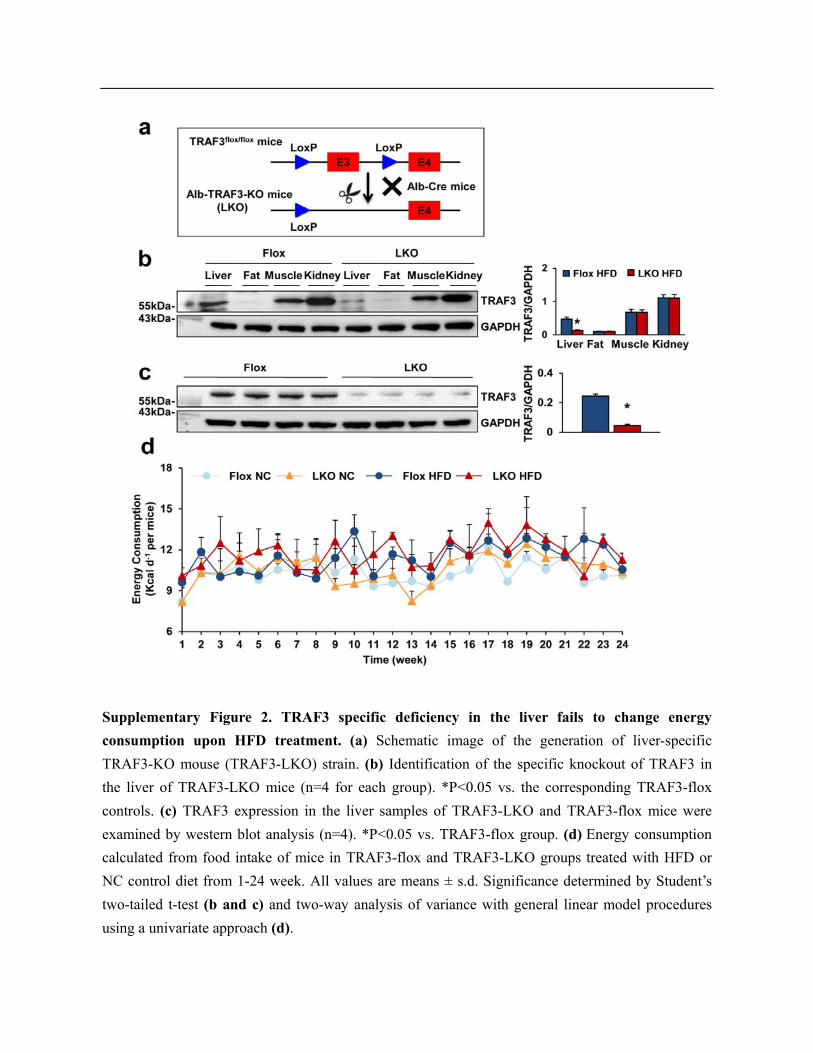
Supplementary Figure 2. TRAF3 specific deficiency in the liver fails to change energy
consumption upon HFD treatment. (a) Schematic image of the generation of liver-specific
TRAF3-KO mouse (TRAF3-LKO) strain. (b) Identification of the specific knockout of TRAF3 in
the liver of TRAF3-LKO mice (n=4 for each group). *P<0.05 vs. the corresponding TRAF3-flox
controls. (c) TRAF3 expression in the liver samples of TRAF3-LKO and TRAF3-flox mice were
examined by western blot analysis (n=4). *P<0.05 vs. TRAF3-flox group. (d) Energy consumption
calculated from food intake of mice in TRAF3-flox and TRAF3-LKO groups treated with HFD or
NC control diet from 1-24 week. All values are means ± s.d. Significance determined by Student’s
two-tailed t-test (b and c) and two-way analysis of variance with general linear model procedures
using a univariate approach (d).

Supplementary Figure 3. Hepatic TRAF3 overexpression does not significantly influence
energy consumption upon HFD administration. (a) Schematic workflow of the establishment of
the liver-specific TRAF3-TG (TRAF3-LTG) mouse strains. (b) TRAF3 protein expression in the
livers and other organs of mice with TRAF3-LTG and NTG controls (n=4). (c) Western blotting
reveals TRAF3 expression in the liver samples of different TRAF3-LTG mouse lines (n=4 for each
line). *P<0.05 vs. NTG controls. (d) Energy consumption of mice in NTG/NC, TRAF3-LTG/NC,
NTG/HFD, and TRAF3-LTG/HFD groups during 1-24 week. All values are means ± s.d.
Significance determined by Student’s two-tailed t-test (b) and two-way analysis of variance with
general linear model procedures using a univariate approach (d).
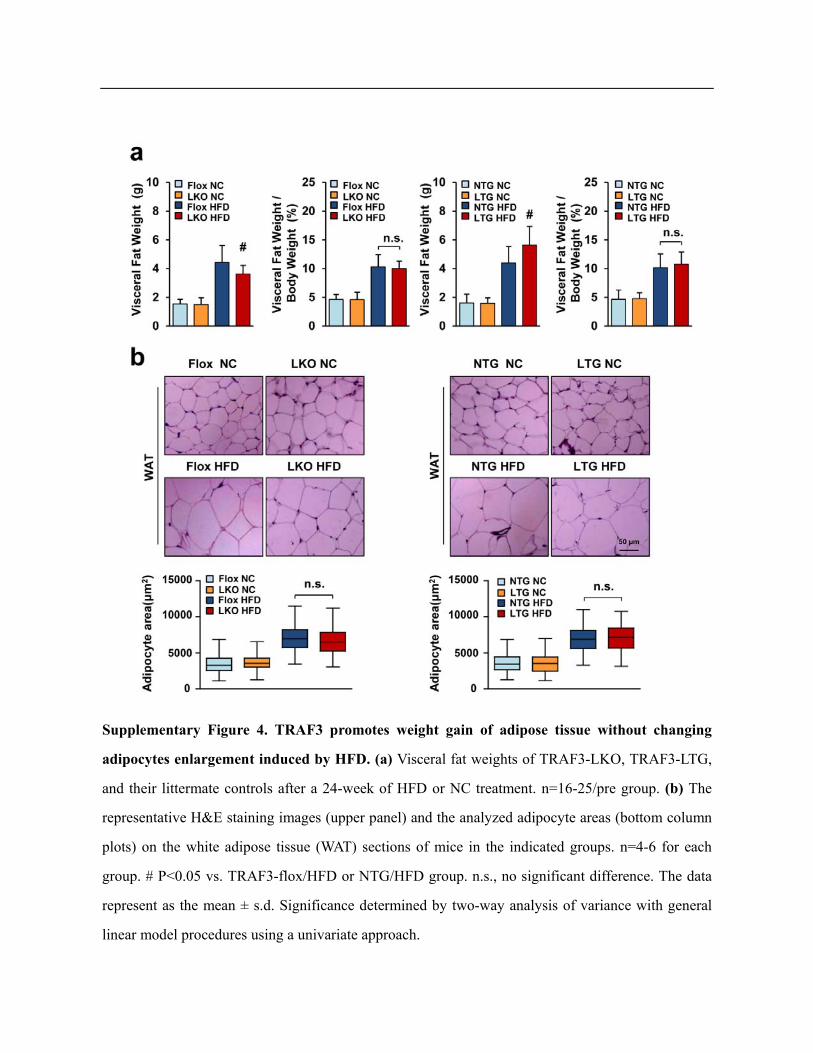
Supplementary Figure 4. TRAF3 promotes weight gain of adipose tissue without changing
adipocytes enlargement induced by HFD. (a) Visceral fat weights of TRAF3-LKO, TRAF3-LTG,
and their littermate controls after a 24-week of HFD or NC treatment. n=16-25/pre group. (b) The
representative H&E staining images (upper panel) and the analyzed adipocyte areas (bottom column
plots) on the white adipose tissue (WAT) sections of mice in the indicated groups. n=4-6 for each
group. # P<0.05 vs. TRAF3-flox/HFD or NTG/HFD group. n.s., no significant difference. The data
represent as the mean ± s.d. Significance determined by two-way analysis of variance with general
linear model procedures using a univariate approach.
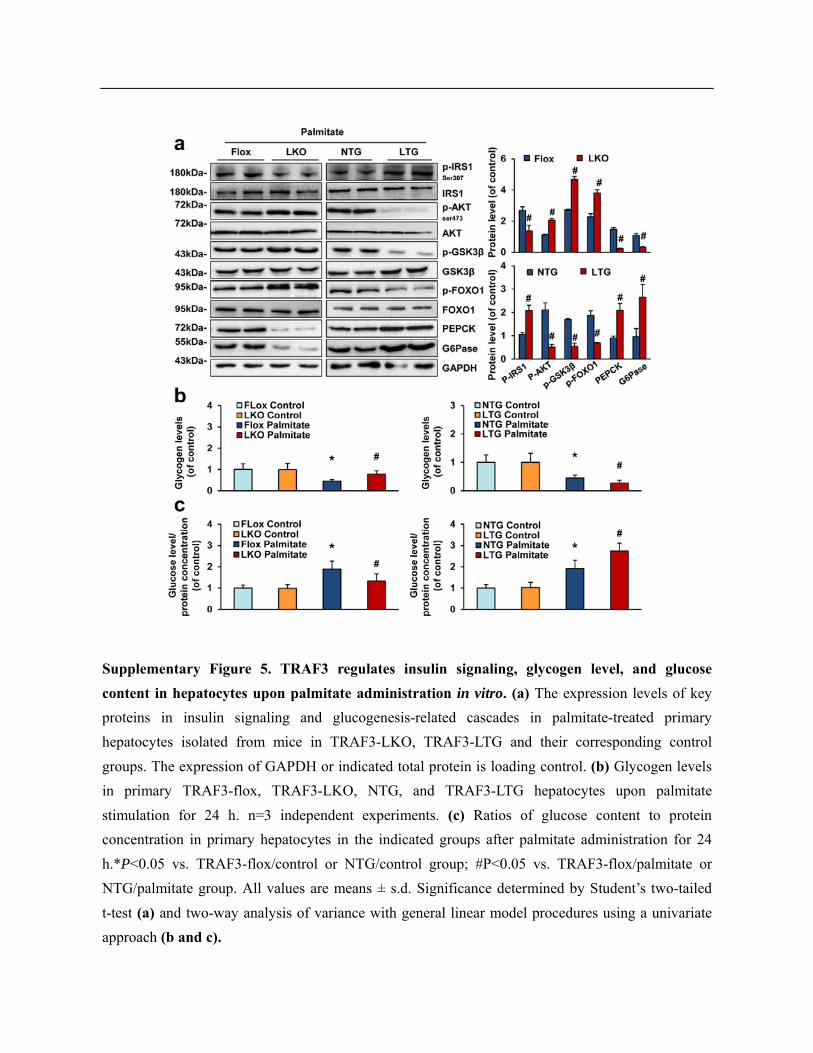
Supplementary Figure 5. TRAF3 regulates insulin signaling, glycogen level, and glucose
content in hepatocytes upon palmitate administration in vitro. (a) The expression levels of key
proteins in insulin signaling and glucogenesis-related cascades in palmitate-treated primary
hepatocytes isolated from mice in TRAF3-LKO, TRAF3-LTG and their corresponding control
groups. The expression of GAPDH or indicated total protein is loading control. (b) Glycogen levels
in primary TRAF3-flox, TRAF3-LKO, NTG, and TRAF3-LTG hepatocytes upon palmitate
stimulation for 24 h. n=3 independent experiments. (c) Ratios of glucose content to protein
concentration in primary hepatocytes in the indicated groups after palmitate administration for 24
h.*P<0.05 vs. TRAF3-flox/control or NTG/control group; #P<0.05 vs. TRAF3-flox/palmitate or
NTG/palmitate group. All values are means ± s.d. Significance determined by Student’s two-tailed
t-test (a) and two-way analysis of variance with general linear model procedures using a univariate
approach (b and c).
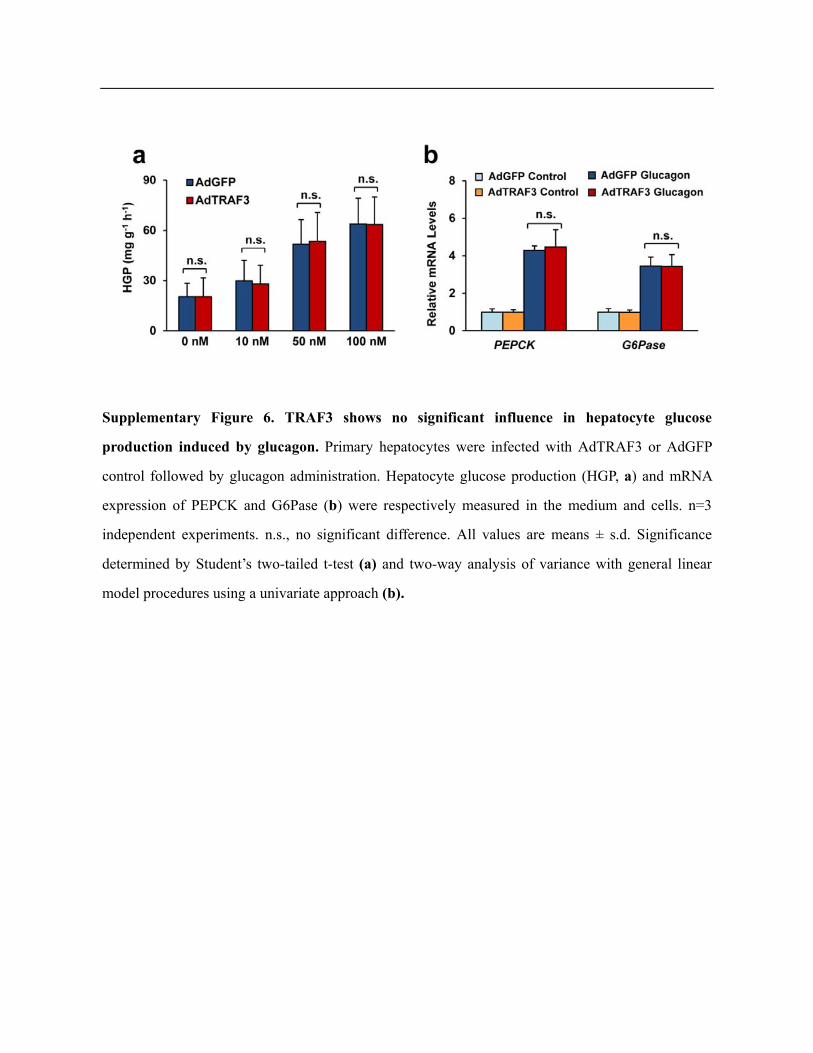
Supplementary Figure 6. TRAF3 shows no significant influence in hepatocyte glucose
production induced by glucagon. Primary hepatocytes were infected with AdTRAF3 or AdGFP
control followed by glucagon administration. Hepatocyte glucose production (HGP, a) and mRNA
expression of PEPCK and G6Pase (b) were respectively measured in the medium and cells. n=3
independent experiments. n.s., no significant difference. All values are means ± s.d. Significance
determined by Student’s two-tailed t-test (a) and two-way analysis of variance with general linear
model procedures using a univariate approach (b).

Supplementary Figure 7. Represent photographs of livers from TRAF3-flox and TRAF3-LKO
mice administered with a HFD for 24 weeks.
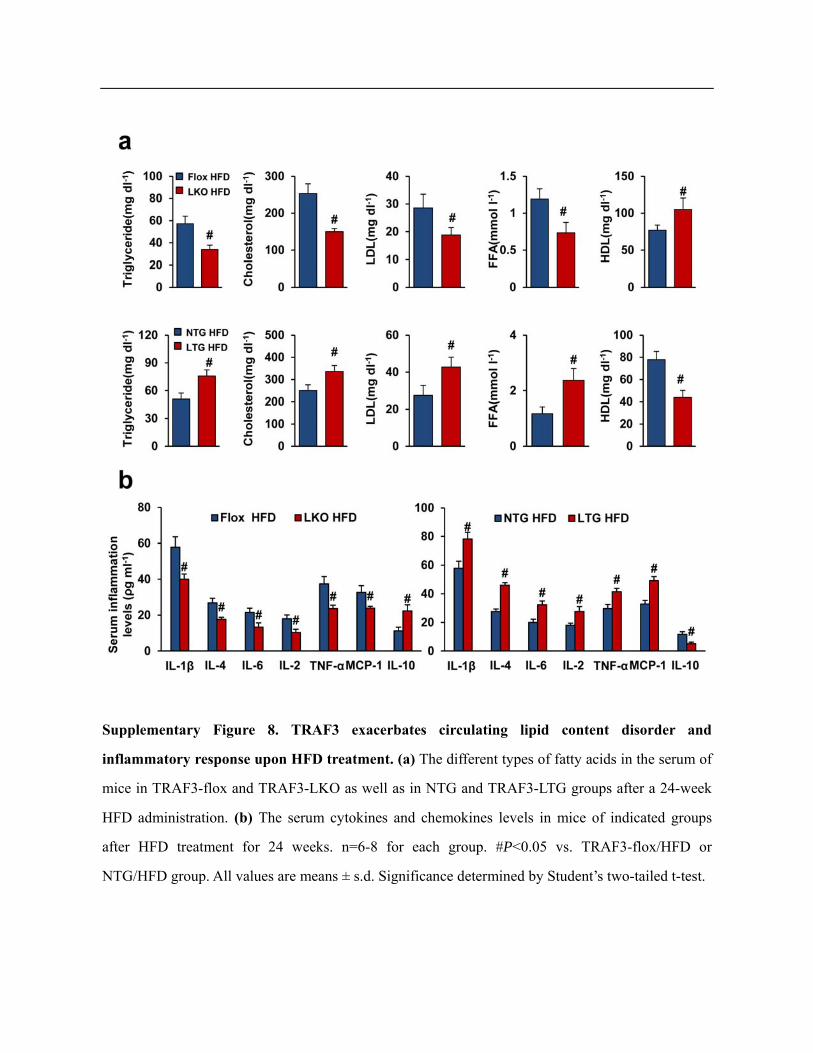
Supplementary Figure 8. TRAF3 exacerbates circulating lipid content disorder and
inflammatory response upon HFD treatment. (a) The different types of fatty acids in the serum of
mice in TRAF3-flox and TRAF3-LKO as well as in NTG and TRAF3-LTG groups after a 24-week
HFD administration. (b) The serum cytokines and chemokines levels in mice of indicated groups
after HFD treatment for 24 weeks. n=6-8 for each group. #P<0.05 vs. TRAF3-flox/HFD or
NTG/HFD group. All values are means ± s.d. Significance determined by Student’s two-tailed t-test.
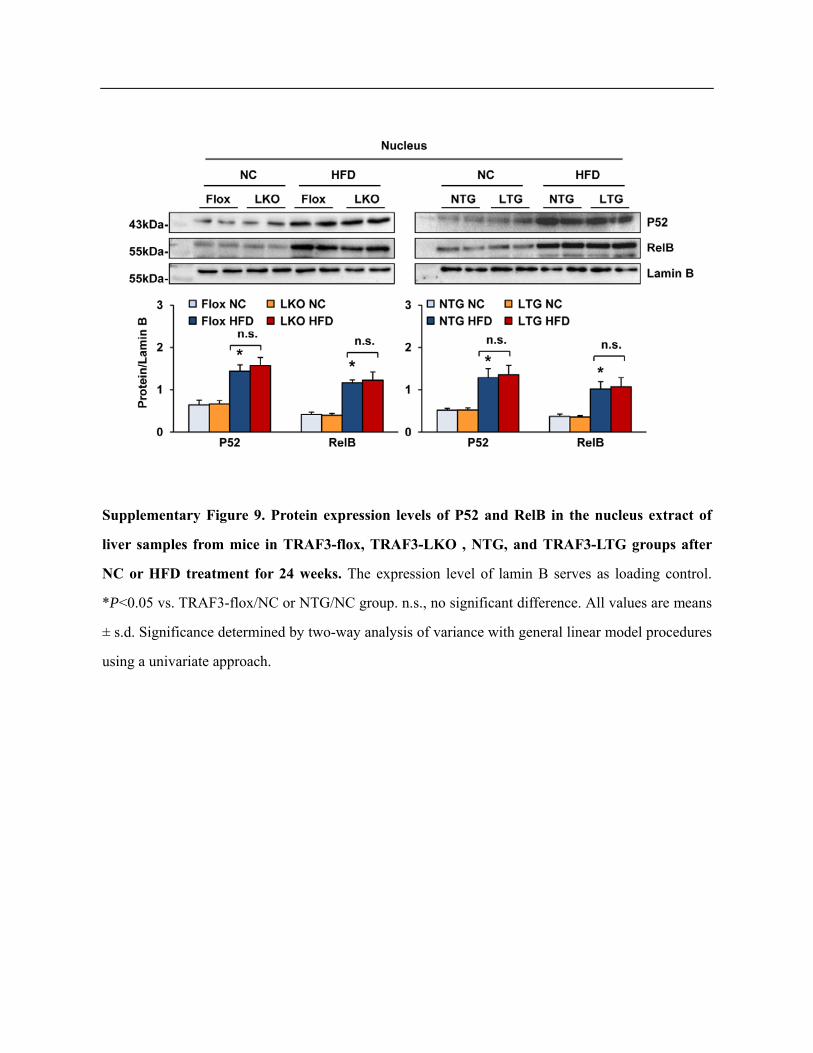
Supplementary Figure 9. Protein expression levels of P52 and RelB in the nucleus extract of
liver samples from mice in TRAF3-flox, TRAF3-LKO , NTG, and TRAF3-LTG groups after
NC or HFD treatment for 24 weeks. The expression level of lamin B serves as loading control.
*P<0.05 vs. TRAF3-flox/NC or NTG/NC group. n.s., no significant difference. All values are means
± s.d. Significance determined by two-way analysis of variance with general linear model procedures
using a univariate approach.


(continued)
Supplementary Figure 10. Liver-specific TRAF3 knockdown prevents against insulin
resistance, hepatic steatosis and inflammatory response in ob/ob mice. (a) TRAF3 expression in
the liver, muscle, and fat of ob/ob mice and lean controls fed with NC diet (n=4). *P<0.05 compared
with lean controls. n.s., no significant difference. (b) Identification of the downregulation of TRAF3
in the liver by injecting AdshTRAF3 in ob/ob mice. Mice injected with AdshRNA serve as controls.
(c) The body weights of ob/ob mice after 4 weeks of administration of AdshTRAF3 or AdshRNA
control (n=14–22). (d) Fasting blood glucose, fasting serum insulin, and the calculated HOMA-IR of
ob/ob mice injected with AdshTRAF3 or AdshRNA at 8 week of age and fed for an additional 4
weeks (n=8–12). (e and f) Glucose and insulin tolerance of ob/ob mice was examined via IPGTT (e)
and IPITT (f) assays, respectively, 4 weeks after AdshTRAF3 or AdshRNA injection. AUC of blood
glucose levels was calculated (n=8–12 per group). (g) The liver weight and the LW/BW ratio of
ob/ob mice after 4 weeks of AdshTRAF3 or AdshRNA treatment (n=14–22). (h) Represent H&E
(upper) and oil red O (bottom) staining images of liver sections from ob/ob mice in AdshTRAF3 and
AdshRNA groups (n=8–12). Scan bar=100 μm. (i) TG, TC and NEFA levels in the liver samples of
ob/ob mice injected with AdshTRAF3 or AdshRNA controls (n=6–8). (j and k) mRNA expression of
PEPCK and G6Pase (j) and inflammation-related genes (k) in the liver samples of AdshTRAF3 or
AdshRNA-treated ob/ob mice (n=6-8). #P<0.05 compared with AdshRNA-treated ob/ob mice. All
values are means ± s.d. Significance determined by Student’s two-tailed t-test.

Supplementary Figure 11. The expression levels of P-MEK1/2, P-ERK, P-p38 and their
corresponding total proteins in the liver samples of HFD- or NC-treated mice in TRAF3-flox,
TRAF3-LKO , NTG, and TRAF3-LTG groups for 24 weeks (n=4). n.s., no significant difference.
All values are means ± s.d. Significance determined by two-way analysis of variance with general
linear model procedures using a univariate approach.
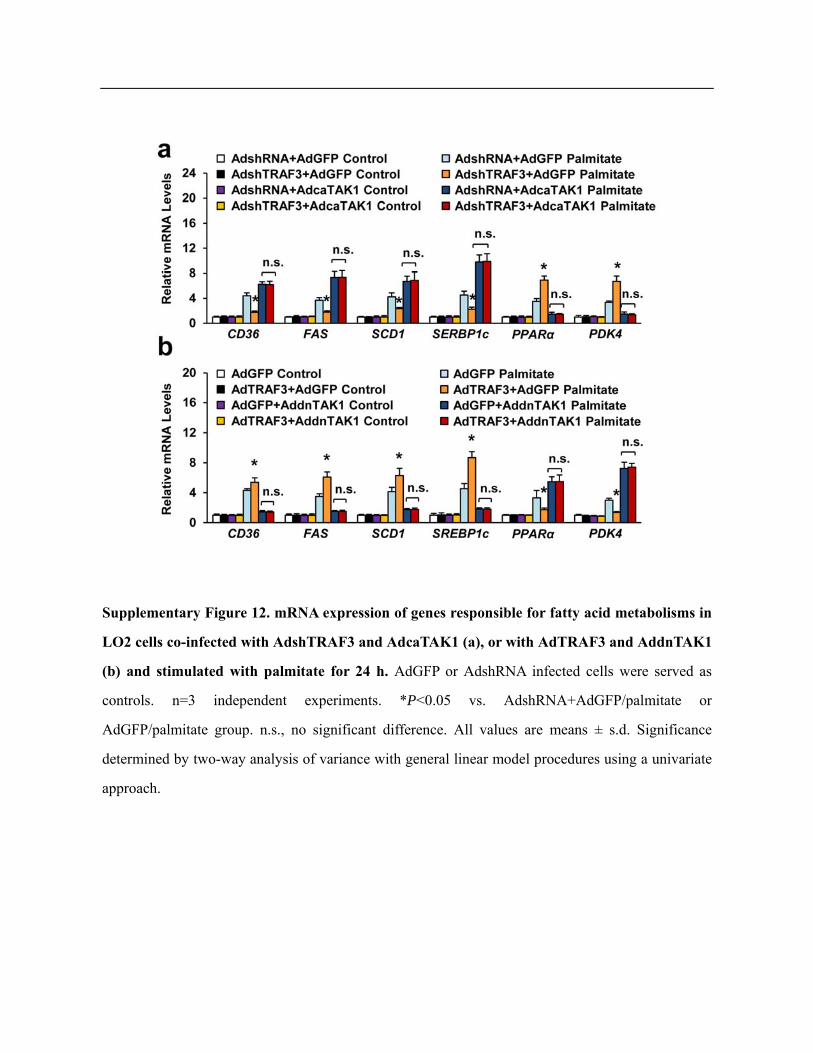
Supplementary Figure 12. mRNA expression of genes responsible for fatty acid metabolisms in
LO2 cells co-infected with AdshTRAF3 and AdcaTAK1 (a), or with AdTRAF3 and AddnTAK1
(b) and stimulated with palmitate for 24 h. AdGFP or AdshRNA infected cells were served as
controls. n=3 independent experiments. *P<0.05 vs. AdshRNA+AdGFP/palmitate or
AdGFP/palmitate group. n.s., no significant difference. All values are means ± s.d. Significance
determined by two-way analysis of variance with general linear model procedures using a univariate
approach.

Supplementary Figure 13. Full gel scans relating to indicated figures.

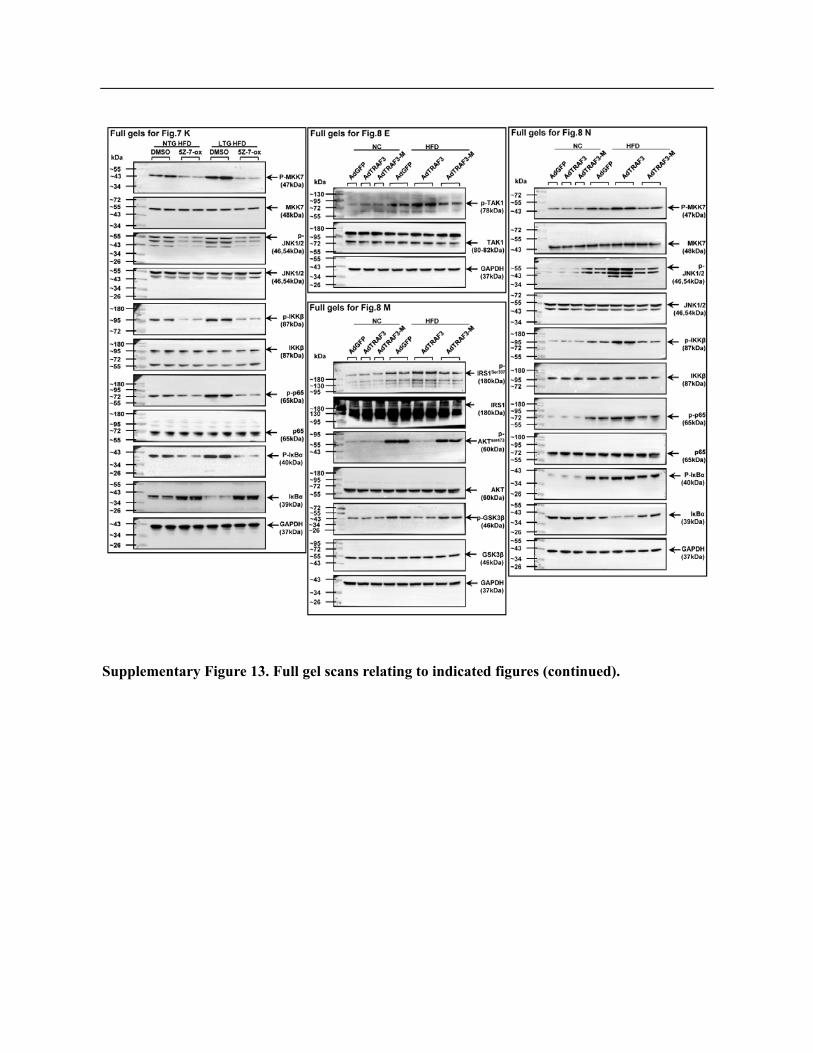
Supplementary Figure 13. Full gel scans relating to indicated figures (continued).

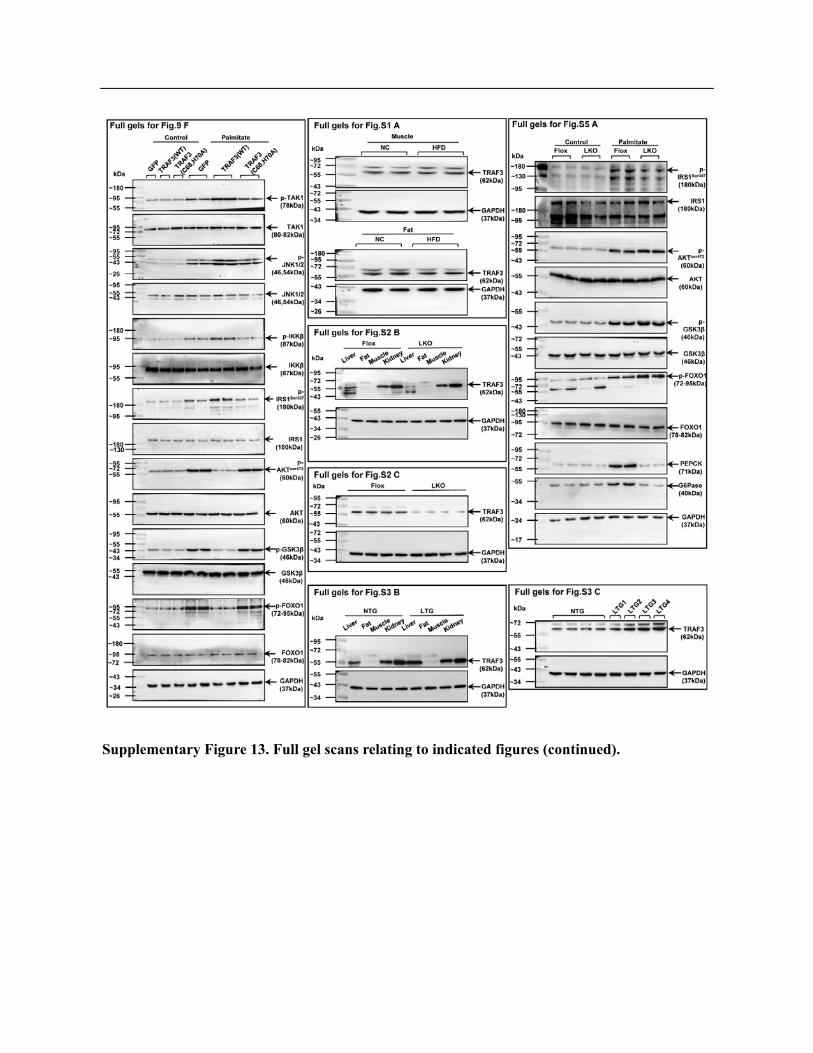
Supplementary Figure 13. Full gel scans relating to indicated figures (continued).

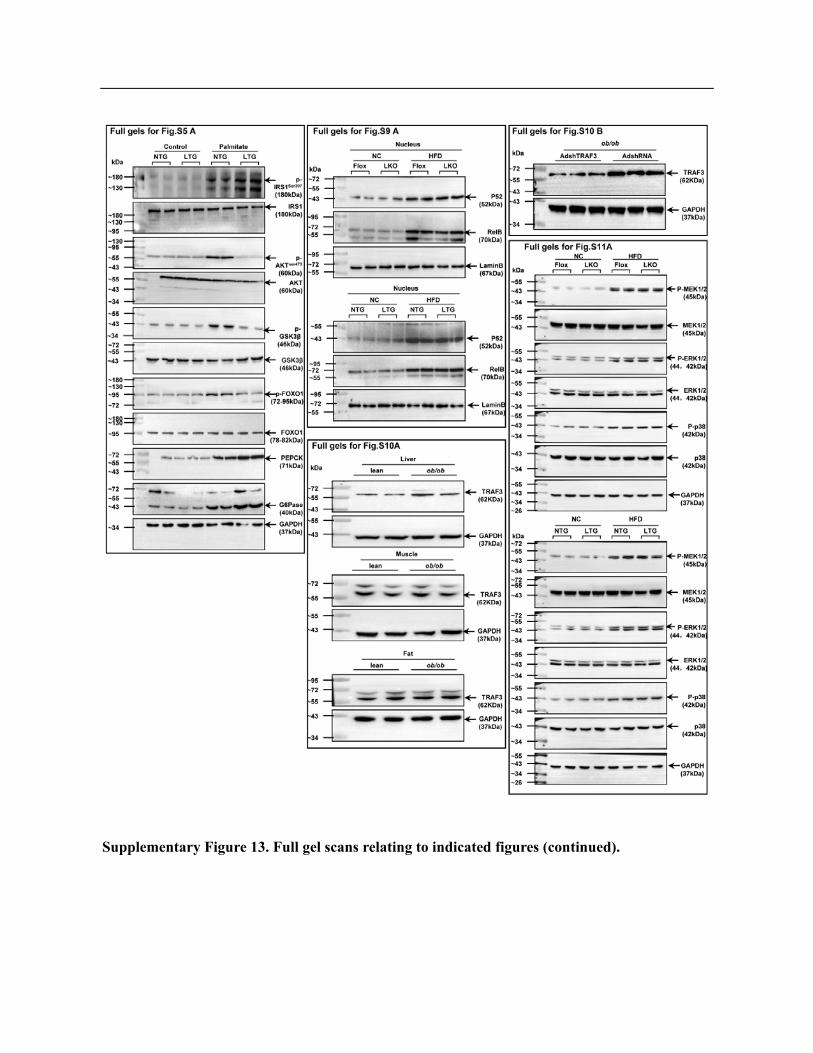
Supplementary Figure 13. Full gel scans relating to indicated figures (continued).
Supplementary Figure 13. Full gel scans relating to indicated figures (continued).
Supplementary Figure 13. Full gel scans relating to indicated figures (continued).
Supplementary Figure 13. Full gel scans relating to indicated figures (continued).

Supplementary Table 1. Serum levels of aminotransferase in mice at 24 week after high-fat diet treatment.
Groups TRAF3-flox TRAF3-LKO NTG TRAF3-LTG
Serum aminotransferase
ALT (U/l) 88.73 ± 8.74 48.80 ± 2.25 # 88.73 ± 10.02 136.20 ± 5.57 #
AST (U/l) 140.91 ± 16.31 55.70 ± 2.31 # 147.18 ± 10.99 190.10 ± 11.77 #
ALP (U/l) 174.73 ± 15.28 61.30 ± 3.40 # 175.45 ± 11.89 212.60 ± 10.29 #
#P<0.05 vs. corresponding TRAF3-flox or NTG group.

Supplementary Table 2. The primers used to genotype the conditional cardiac-specific TRAF3 knockout mice.
Primer name Primer
P1 TTGCGGAACCCTTCGAAGTTCC
P2 AGGAGGCACAGCTGAAGCTGTG
P3 AGCTTCAGAAGGCCACAGAGTT
P4 CTGGTCTTGGGCTATCTACAAACTC
P5 TGCTTTGGCCAAATTGTTACA
P6 GTACACTGTAGCTATCTTCAGATACACC
P1+P2 to detect the gene targeting, Product: 1740bp P3+P4 to detect the Flox allele or FloxNeo allele, Product: WT allele→320bp; FloxNeo allele→1.92kb, Flox allele→406bp P5+P6 to detect the existence of left Loxp site, Product: △LoxP→200bp; LoxP insert→240bp

Supplementary Table 3. The clinical information of NAFLD patients and donors.
Type Gender Age
(years)
BMI
(kg/m2)
AST
(U/L)
ALT
(U/L)
Cholesterol
(mg/dL)
Triglycerides
(mg/dL)
HDL
(mg/dL)
LDL
(mg/dL)
FBS
(mg/dL)
Insulin
(μU/mL)
NAFLD Male 38 31.24 59 77 159 184 45 138 95 12.5
NAFLD Male 42 30.45 55 62 154 171 42 123 82 11.6
NAFLD Female 45 35.63 62 91 168 198 42 150 102 13.4
NAFLD Female 49 30.45 49 65 158 172 44 122 92 12
NAFLD Female 52 34.61 64 89 172 185 36 144 94 14.1
NAFLD Male 53 39.18 56 85 170 182 38 146 98 13.4
NAFLD Male 56 36.88 66 89 188 203 34 157 104 15.2
Normal Male 32 22.4 20 26 135 140 62 84 76 6.5
Normal Female 42 24.2 19 28 136 148 56 85 80 7.2
Normal Male 46 23.53 18 24 130 145 60 82 78 6.8
Normal Female 51 21 18 25 128 136 68 76 75 6.2

Supplementary Table 4. Histologic Features of NAFLD Patients.
Type Gender Age
(years)
Steatosis
(0-3)
Lobular
inflammation
(0-3)
Ballooning
(0-2)
Fibrosis
(0-4)
NAS
(1-8)
NAFLD Male 38 3 2 0 0 5
NAFLD Male 42 3 1 0 0 4
NAFLD Female 45 3 2 1 0 6
NAFLD Female 49 3 2 0 0 5
NAFLD Female 52 3 2 0 0 5
NAFLD Male 53 3 2 1 0 6
NAFLD Male 56 3 3 1 1 7
Supplementary Table 5. Primers for Real-time PCR detection.
Gene Sequence5'---3'
GAPDH Forward ACTCCACTCACGGCAAATTC
Reverse TCTCCATGGTGGTGAAGACA
TRAF3-H Forward ACTGCAAGAGTCAGGTTCCG
Reverse CAAGTGTGCACTCAACTCGC
TRAF3-M Forward ACTGAGCTGGAGAGCGTAGA
Reverse GCGCTTGTAGTCACGGATCT
PEPCK forward TGCCCCAGGCAGTGAGGAAGTT
reverse GTCAGTGAGAGCCAGCCAACAGT
G6Pase forward TCTGTCCCGGATCTACCTTG
reverse GCTGGCAAAGGGTGTAGTGT
ABCG1 forward TGAACCCGTTTCTTTGGCACCG
reverse AGTCCCGCATGATGCTGAGGAA
CYP7A1 forward TCAAAGAGCGCTGTCTGGGTCA
reverse TTTCCCGGGCTTTATGTGCGGT
SREBP-1c forward CACTTCTGGAGACATCGCAAAC
reverse ATGGTAGACAACAGCCGCATC
ACCα forward GGCCAGTGCTATGCTGAGAT
reverse AGGGTCAAGTGCTGCTCCA
FAS forward CTGCGGAAACTTCAGGAAATG
reverse GGTTCGGAATGCTATCCAGG
SCD1 forward TCTTCCTTATCATTGCCAACACCA
reverse GCGTTGAGCACCAGAGTGTATCG
CD36 forward TGGGTTTTGCACATCAAAGA
reverse GATGGACCTGCAAATGTCAGA
FABP1 forward TGGTCCGCAATGAGTTCACCCT
reverse CCAGCTTGACGACTGCCTTGACTT
FATP1 forward TGCACAGCAGGTACTACCGCAT
reverse TGCGCAGTACCACCGTCAAC
PPAR-α forward TATTCGGCTGAAGCTGGTGTAC
reverse CTGGCATTTGTTCCGGTTCT
ACOX forward CGGAAGATACATAAAGGAGACC
reverse AAGTAGGACACCATACCACCC
CPT-1α forward AGGACCCTGAGGCATCTATT reverse ATGACCTCCTGGCATTCTCC

MCAD forward TGGCGTATGGGTGTACAGGG
reverse CCAAATACTTCTTTTTTTGTTGATCA
LCAD forward GGAGTAAGAACGAACGCCAA
reverse GCCACGACGATCACGAGAT
UCP2 forward GCTGGTGGTGGTCGGAGATA
reverse ACTGGCCCAAGGCAGAGTT
PPAR-γ forward ATTCTGGCCCACCAACTTCGG
reverse TGGAAGCCTGATGCTTTATCCCCA
PDK4 forward TTCACACCTTCACCACATGC
reverse AAAGGGCGGTTTTCTTGATG
G6PC forward TCTGTCCCGGATCTACCTTG
reverse GCTGGCAAAGGGTGTAGTGT
HMGCR forward ATCATGTGCTGCTTCGGCTGCAT
reverse AAATTGGACGACCCTCACGGCT
IL-1β forward CCGTGGACCTTCCAGGATGA
reverse GGGAACGTCACACACCAGCA
IL-6 forward AGTTGCCTTCTTGGGACTGA
reverse TCCACGATTTCCCAGAGAAC
TNF-α forward CATCTTCTCAAAATTCGAGTGACAA
reverse TGGGAGTAGACAAGGTACAACCC
MCP1 forward TAAAAACCTGGATCGGAACCAAA
reverse GCATTAGCTTCAGATTTACGGGT
iNOS forward TGCGCCTTTGCTCATGACATCGA
reverse ATGGATGCTGCTGAGGGCTCTGTT
IL-10 forward CCAAGCCTTATCGGAAATGA
reverse TTTTCACAGGGGAGAAATCG

Supplementary Table 6. Primers for the creation of TRAF3/TAK1 construct.
Primer Sequence (5’ to 3’)
TRAF3-1F: CGCGGATCCATGGAGTCGAGTAAAAAGATG
TRAF3-568R: CCGCTCGAGTCAGGGATCGGGCAGATCC
TRAF3-267F: CGCGGATCCAGCAACTCGCTCGAAAAGAA
TRAF3-266R: CCGCTCGAGCCACTCCTTCAGCAGGTTGA
TRAF3-376R: CCGCTCGAGCCGAGCCACTTGCCCCGCGCT
TAK1-1F: CGCGGATCCATGTCTACAGCCTCTGCCGC
TAK1-579R: CCGCTCGAGTCATGAAGTGCCTTGTCGTT
TAK1-301F: CGCGGATCCCCTTGTCAGTATTCAGATGA
TAK1-481F: CGCGGATCCCAGCCTCTAGCACCGTGC
TAK1-300R: CCGCTCGAG ATACTGTAATGGCTCATCTG
TAK1-480R: CCGCTCGAG TAGTTGGTGATCCAGTGTAA