Embed Size (px)
Citation preview
Supplementary Figure 1
Strategy for targeted knockout of mir-1000
miR-1000 is located in the first intron of the msi gene, but represents an independent transcription unit, transcribed from the opposite strand of the DNA. miR-1000 deletion mutants were generated by targeted homologous recombination, as described (ref 41). Left and right homology arms (blue bars) were amplified by PCR from genomic DNA (diagram not to scale). The 4436bp left arm was amplified with: LF-ACGAAGGTAACCATATCTCAGACC, LR-TTAACATTGTTGAGCGTCATTAGC; the 4199bp right arm was amplified with: RF-CAGCACTTTATTCAATTCACTTGG and RR-AATACTGTGGCGACTTTAGGTAGG. Following recombination, 141 bp spanning the miRNA hairpin was deleted and replaced with a mini-white cassette (red). The presence of the intron-containing mini-white marker is expected to disrupt msi function. The mini-white marker in the miR-1000 allele is flanked by loxP sites (purple triangles) and was excised by crossing the mutant to heat shock-CRE flies. After CRE mediated excision, a single LoxP site is left in the msi intron. Genetic complementation tests showed that msi function was not compromised in the mini-white–excised miR-1000 mutant strains (miR-1000KO1), or in the mini-white–excised miR-1000 RMCE alleles (miR-1000KO2 depicted in Fig 1c). Deletion of the miRNA in the various mutants was confirmed by genomic DNA PCR and by microRNA quantitative-PCR. All genetic tests were done using flies carrying two independently generated alleles or an allele in trans to a chromosomal deletion (Df(3R)Exel6203) removing the miR-1000 locus.
Nature Neuroscience: doi:10.1038.nn.3935
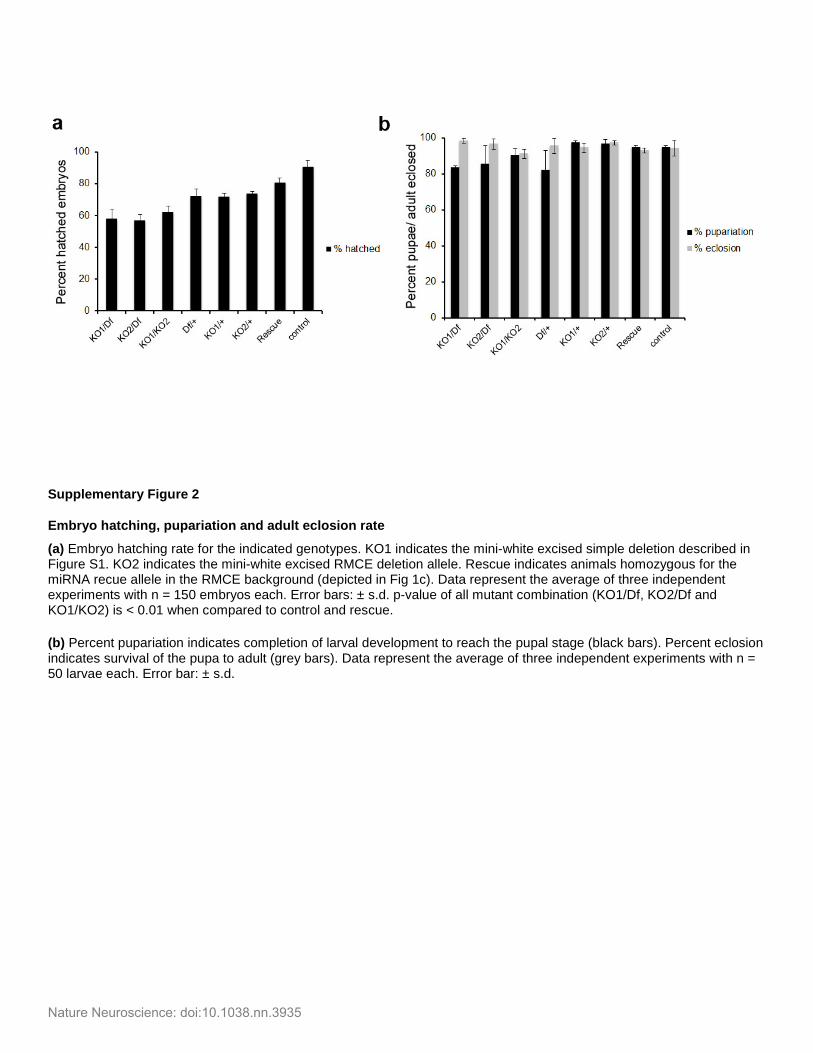
Supplementary Figure 2
Embryo hatching, pupariation and adult eclosion rate
(a) Embryo hatching rate for the indicated genotypes. KO1 indicates the mini-white excised simple deletion described in Figure S1. KO2 indicates the mini-white excised RMCE deletion allele. Rescue indicates animals homozygous for the miRNA recue allele in the RMCE background (depicted in Fig 1c). Data represent the average of three independent experiments with n = 150 embryos each. Error bars: ± s.d. p-value of all mutant combination (KO1/Df, KO2/Df and KO1/KO2) is < 0.01 when compared to control and rescue. (b) Percent pupariation indicates completion of larval development to reach the pupal stage (black bars). Percent eclosion indicates survival of the pupa to adult (grey bars). Data represent the average of three independent experiments with n = 50 larvae each. Error bar: ± s.d.
Nature Neuroscience: doi:10.1038.nn.3935
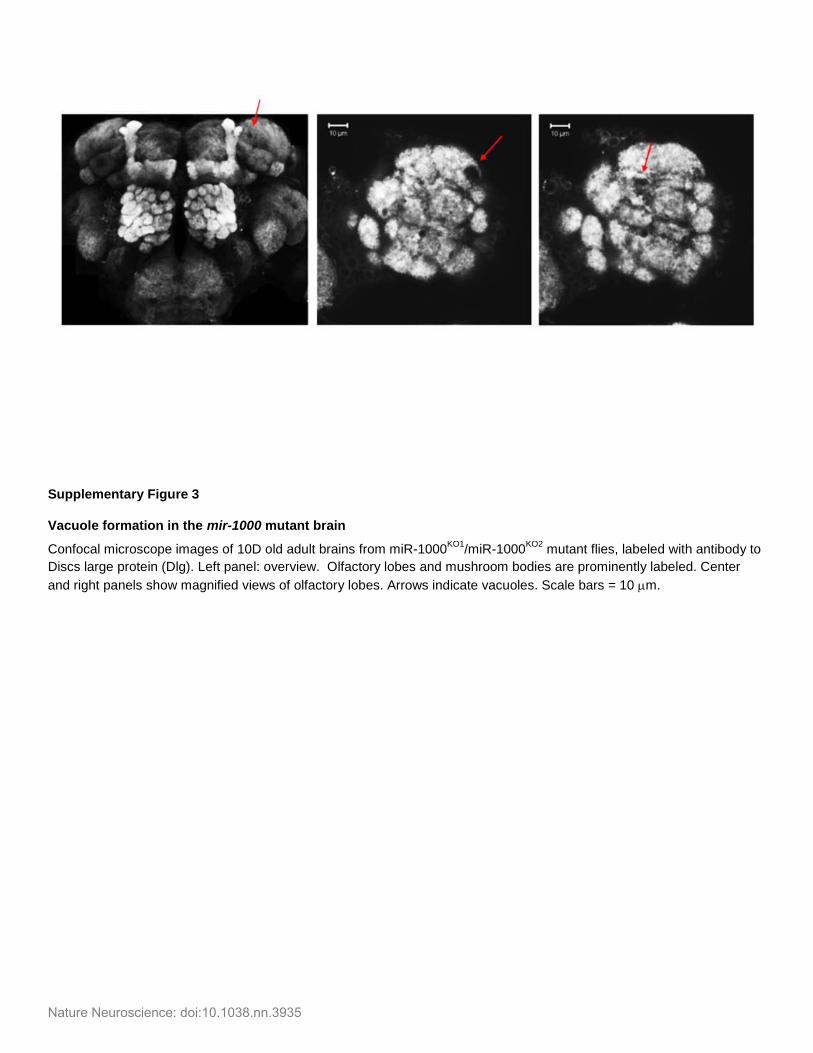
Supplementary Figure 3
Vacuole formation in the mir-1000 mutant brain
Confocal microscope images of 10D old adult brains from miR-1000KO1/miR-1000KO2 mutant flies, labeled with antibody to Discs large protein (Dlg). Left panel: overview. Olfactory lobes and mushroom bodies are prominently labeled. Center and right panels show magnified views of olfactory lobes. Arrows indicate vacuoles. Scale bars = 10 µm.
Nature Neuroscience: doi:10.1038.nn.3935
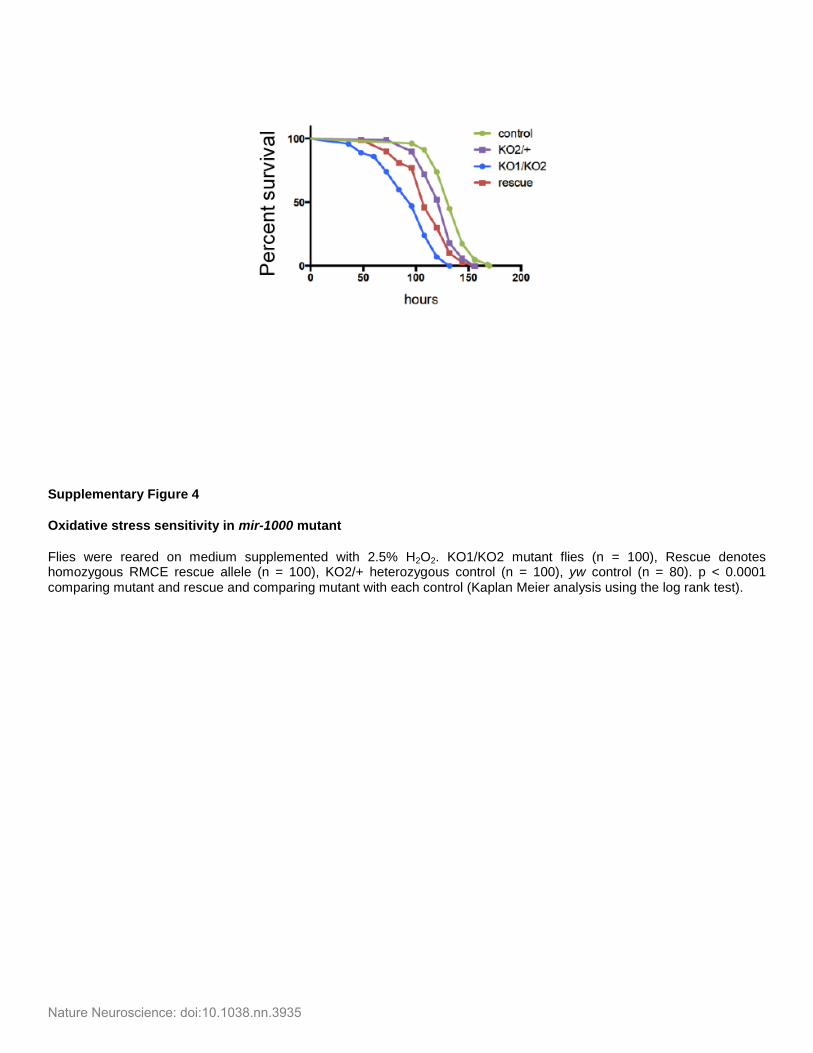
Supplementary Figure 4
Oxidative stress sensitivity in mir-1000 mutant
Flies were reared on medium supplemented with 2.5% H2O2. KO1/KO2 mutant flies (n = 100), Rescue denotes homozygous RMCE rescue allele (n = 100), KO2/+ heterozygous control (n = 100), yw control (n = 80). p < 0.0001 comparing mutant and rescue and comparing mutant with each control (Kaplan Meier analysis using the log rank test).
Nature Neuroscience: doi:10.1038.nn.3935
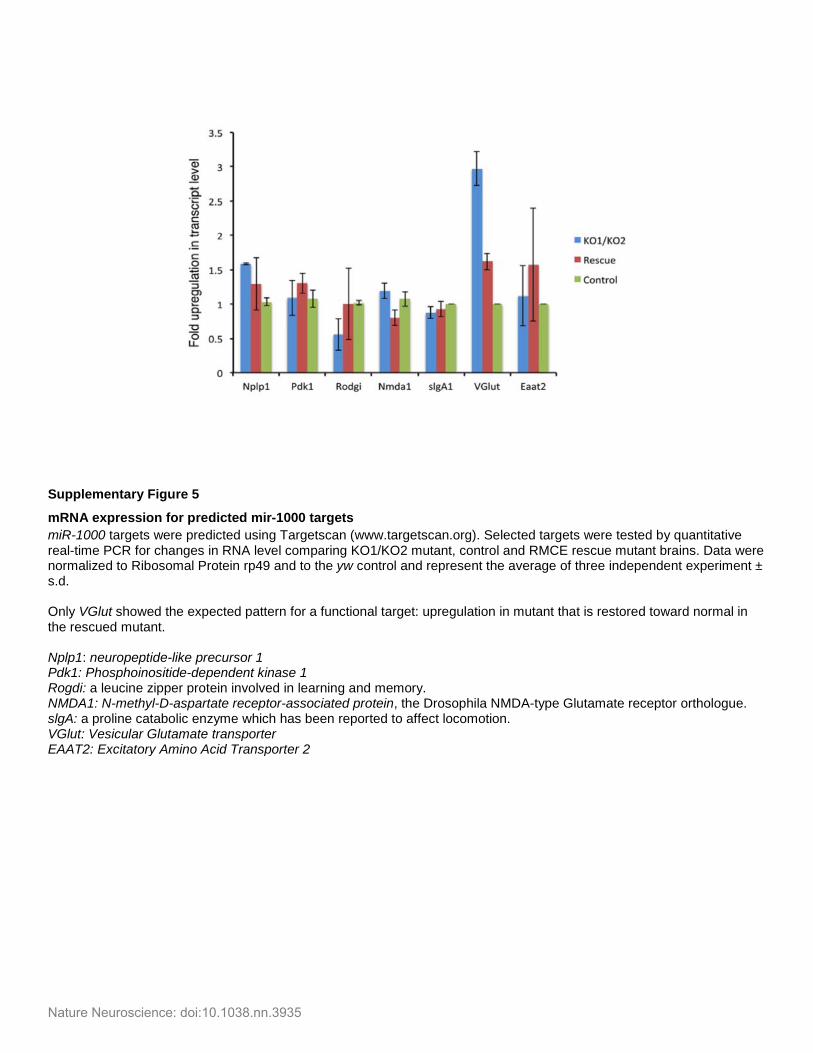
Supplementary Figure 5
mRNA expression for predicted mir-1000 targets miR-1000 targets were predicted using Targetscan (www.targetscan.org). Selected targets were tested by quantitative real-time PCR for changes in RNA level comparing KO1/KO2 mutant, control and RMCE rescue mutant brains. Data were normalized to Ribosomal Protein rp49 and to the yw control and represent the average of three independent experiment ± s.d. Only VGlut showed the expected pattern for a functional target: upregulation in mutant that is restored toward normal in the rescued mutant. Nplp1: neuropeptide-like precursor 1 Pdk1: Phosphoinositide-dependent kinase 1 Rogdi: a leucine zipper protein involved in learning and memory. NMDA1: N-methyl-D-aspartate receptor-associated protein, the Drosophila NMDA-type Glutamate receptor orthologue. slgA: a proline catabolic enzyme which has been reported to affect locomotion. VGlut: Vesicular Glutamate transporter EAAT2: Excitatory Amino Acid Transporter 2
Nature Neuroscience: doi:10.1038.nn.3935
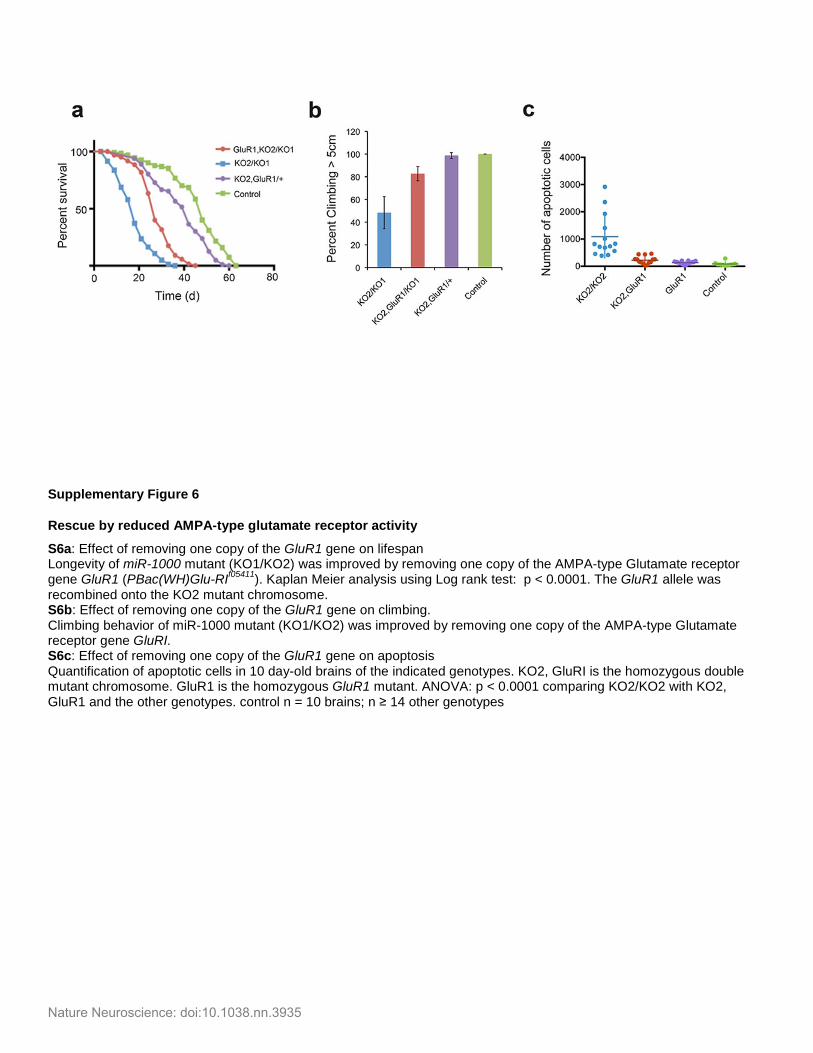
Supplementary Figure 6
Rescue by reduced AMPA-type glutamate receptor activity
S6a: Effect of removing one copy of the GluR1 gene on lifespan Longevity of miR-1000 mutant (KO1/KO2) was improved by removing one copy of the AMPA-type Glutamate receptor gene GluR1 (PBac(WH)Glu-RIf05411). Kaplan Meier analysis using Log rank test: p < 0.0001. The GluR1 allele was recombined onto the KO2 mutant chromosome. S6b: Effect of removing one copy of the GluR1 gene on climbing. Climbing behavior of miR-1000 mutant (KO1/KO2) was improved by removing one copy of the AMPA-type Glutamate receptor gene GluRI. S6c: Effect of removing one copy of the GluR1 gene on apoptosis Quantification of apoptotic cells in 10 day-old brains of the indicated genotypes. KO2, GluRI is the homozygous double mutant chromosome. GluR1 is the homozygous GluR1 mutant. ANOVA: p < 0.0001 comparing KO2/KO2 with KO2, GluR1 and the other genotypes. control n = 10 brains; n ≥ 14 other genotypes
Nature Neuroscience: doi:10.1038.nn.3935
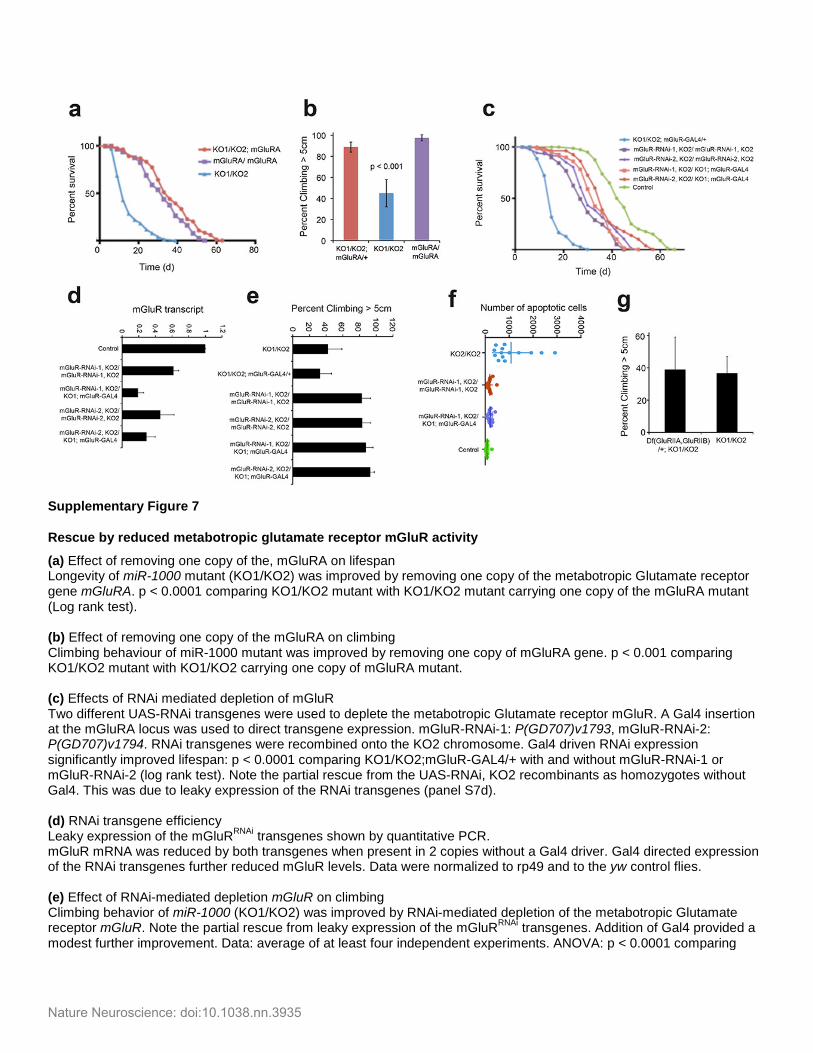
Supplementary Figure 7
Rescue by reduced metabotropic glutamate receptor mGluR activity
(a) Effect of removing one copy of the, mGluRA on lifespan Longevity of miR-1000 mutant (KO1/KO2) was improved by removing one copy of the metabotropic Glutamate receptor gene mGluRA. p < 0.0001 comparing KO1/KO2 mutant with KO1/KO2 mutant carrying one copy of the mGluRA mutant (Log rank test). (b) Effect of removing one copy of the mGluRA on climbing Climbing behaviour of miR-1000 mutant was improved by removing one copy of mGluRA gene. p < 0.001 comparing KO1/KO2 mutant with KO1/KO2 carrying one copy of mGluRA mutant. (c) Effects of RNAi mediated depletion of mGluR Two different UAS-RNAi transgenes were used to deplete the metabotropic Glutamate receptor mGluR. A Gal4 insertion at the mGluRA locus was used to direct transgene expression. mGluR-RNAi-1: P(GD707)v1793, mGluR-RNAi-2: P(GD707)v1794. RNAi transgenes were recombined onto the KO2 chromosome. Gal4 driven RNAi expression significantly improved lifespan: p < 0.0001 comparing KO1/KO2;mGluR-GAL4/+ with and without mGluR-RNAi-1 or mGluR-RNAi-2 (log rank test). Note the partial rescue from the UAS-RNAi, KO2 recombinants as homozygotes without Gal4. This was due to leaky expression of the RNAi transgenes (panel S7d). (d) RNAi transgene efficiency Leaky expression of the mGluRRNAi transgenes shown by quantitative PCR. mGluR mRNA was reduced by both transgenes when present in 2 copies without a Gal4 driver. Gal4 directed expression of the RNAi transgenes further reduced mGluR levels. Data were normalized to rp49 and to the yw control flies. (e) Effect of RNAi-mediated depletion mGluR on climbing Climbing behavior of miR-1000 (KO1/KO2) was improved by RNAi-mediated depletion of the metabotropic Glutamate receptor mGluR. Note the partial rescue from leaky expression of the mGluRRNAi transgenes. Addition of Gal4 provided a modest further improvement. Data: average of at least four independent experiments. ANOVA: p < 0.0001 comparing
Nature Neuroscience: doi:10.1038.nn.3935
KO1/KO2;mGluR-GAL4 with KO2, mGluRRNAi 1/KO1; mGluR-GAL4 and KO2, mGluRRNAi 2/KO1;mGluR-GAL4. (f) Effect of reducing mGluR on apoptosis Quantification of apoptotic cells in 10 day-old brains of the indicated genotypes. ANOVA: p < 0.0001 comparing KO2/KO2 with all the other genotypes. Control n = 10 brains; n ≥ 14 other genotypes. This data set was collected in the same experiment as the data shown in Fig S6c. The control and KO2/KO2 samples are the same. (g) Effect of reducing GluRIIA and GluRIIB on climbing Left: KO1/KO2 mutant carrying one copy of Df(2L)Exel8016, which removes GluRIIA and GluRIIB. Data represent the average of 3 independent experiments. t-test: ns.
Nature Neuroscience: doi:10.1038.nn.3935
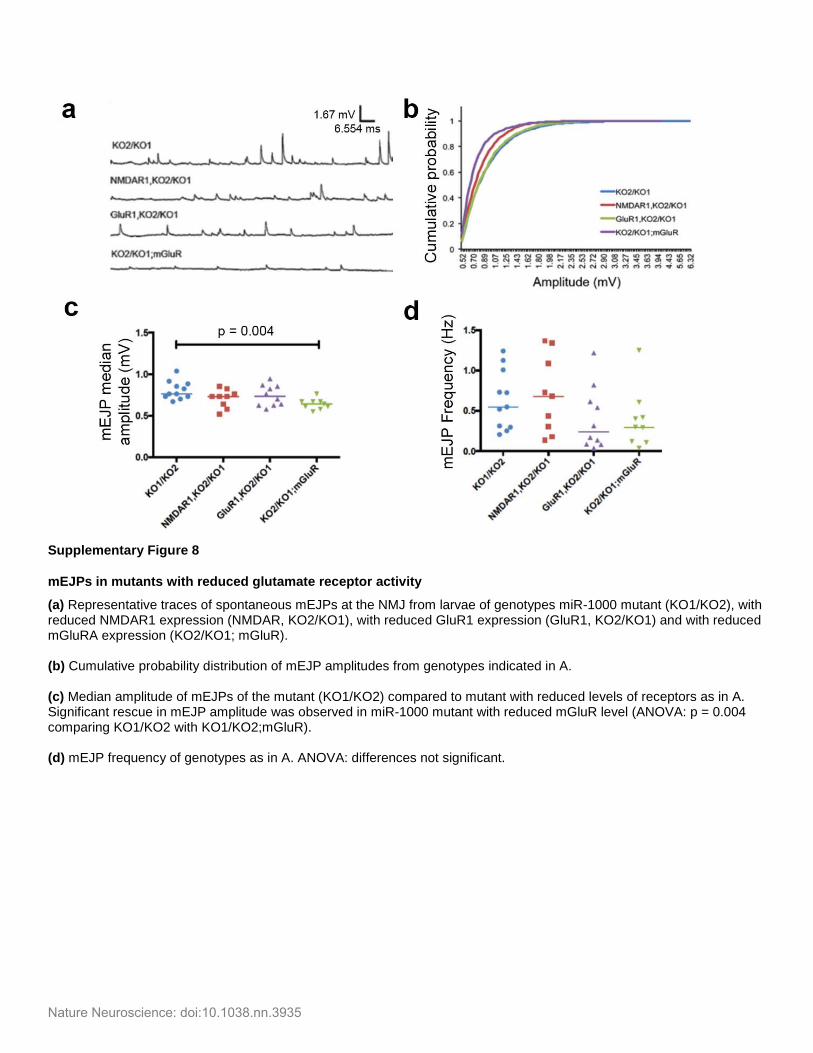
Supplementary Figure 8
mEJPs in mutants with reduced glutamate receptor activity
(a) Representative traces of spontaneous mEJPs at the NMJ from larvae of genotypes miR-1000 mutant (KO1/KO2), with reduced NMDAR1 expression (NMDAR, KO2/KO1), with reduced GluR1 expression (GluR1, KO2/KO1) and with reduced mGluRA expression (KO2/KO1; mGluR). (b) Cumulative probability distribution of mEJP amplitudes from genotypes indicated in A. (c) Median amplitude of mEJPs of the mutant (KO1/KO2) compared to mutant with reduced levels of receptors as in A. Significant rescue in mEJP amplitude was observed in miR-1000 mutant with reduced mGluR level (ANOVA: p = 0.004 comparing KO1/KO2 with KO1/KO2;mGluR). (d) mEJP frequency of genotypes as in A. ANOVA: differences not significant.
Nature Neuroscience: doi:10.1038.nn.3935
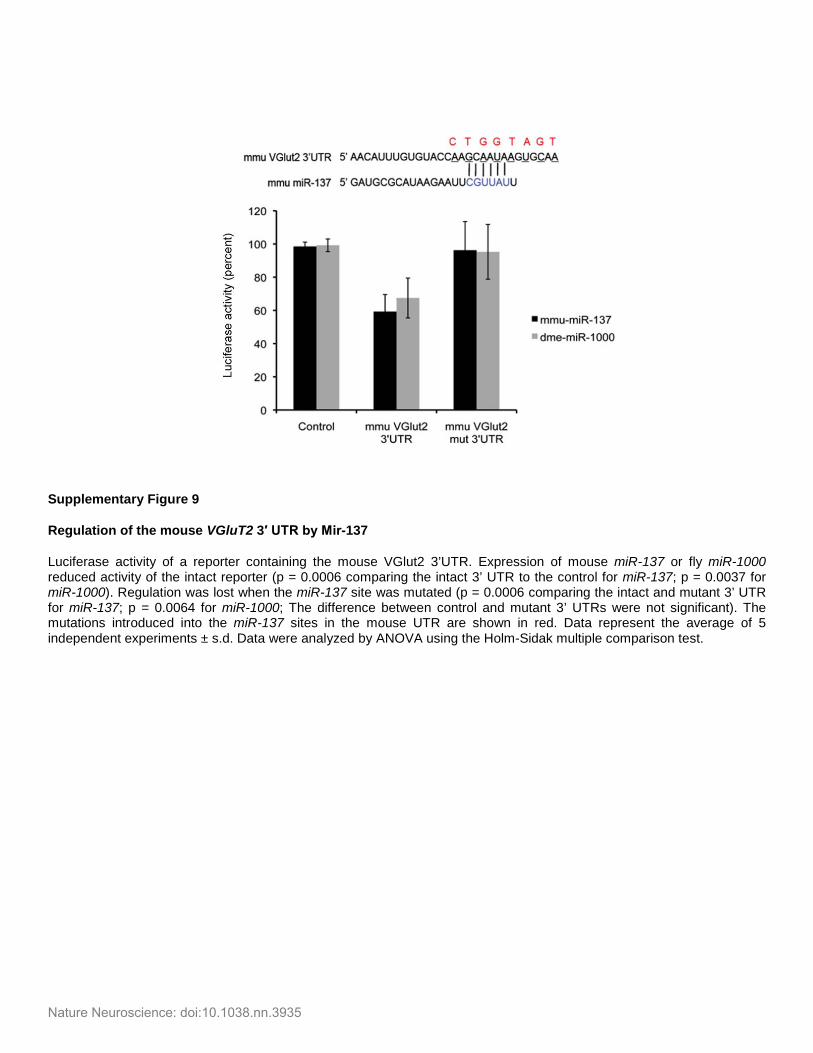
Supplementary Figure 9
Regulation of the mouse VGluT2 3′ UTR by Mir-137
Luciferase activity of a reporter containing the mouse VGlut2 3’UTR. Expression of mouse miR-137 or fly miR-1000 reduced activity of the intact reporter (p = 0.0006 comparing the intact 3’ UTR to the control for miR-137; p = 0.0037 for miR-1000). Regulation was lost when the miR-137 site was mutated (p = 0.0006 comparing the intact and mutant 3’ UTR for miR-137; p = 0.0064 for miR-1000; The difference between control and mutant 3’ UTRs were not significant). The mutations introduced into the miR-137 sites in the mouse UTR are shown in red. Data represent the average of 5 independent experiments ± s.d. Data were analyzed by ANOVA using the Holm-Sidak multiple comparison test.
Nature Neuroscience: doi:10.1038.nn.3935
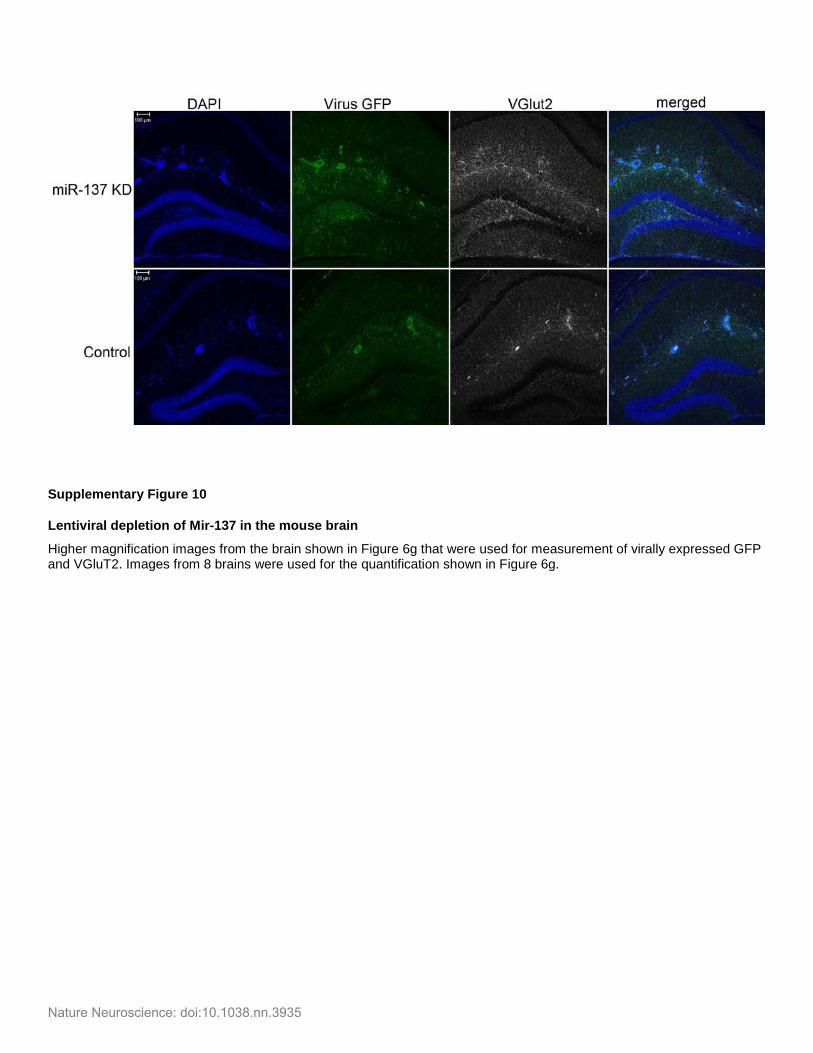
Supplementary Figure 10
Lentiviral depletion of Mir-137 in the mouse brain
Higher magnification images from the brain shown in Figure 6g that were used for measurement of virally expressed GFP and VGluT2. Images from 8 brains were used for the quantification shown in Figure 6g.
Nature Neuroscience: doi:10.1038.nn.3935
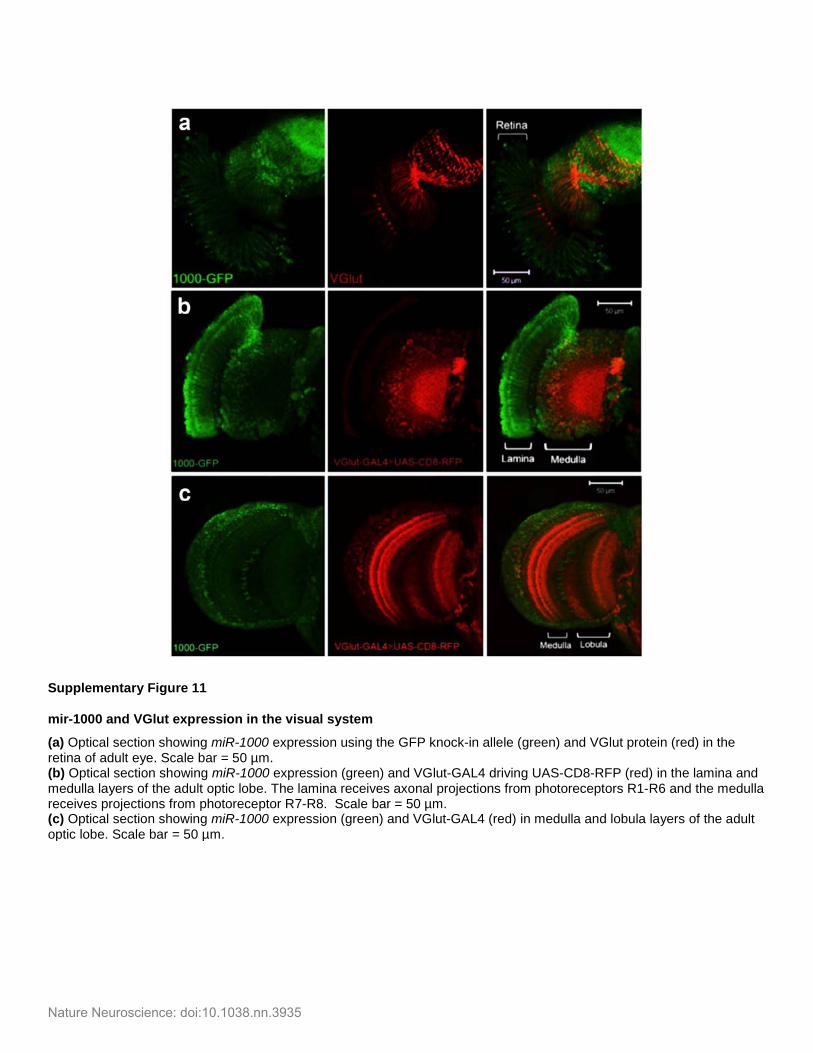
Supplementary Figure 11
mir-1000 and VGlut expression in the visual system
(a) Optical section showing miR-1000 expression using the GFP knock-in allele (green) and VGlut protein (red) in the retina of adult eye. Scale bar = 50 µm. (b) Optical section showing miR-1000 expression (green) and VGlut-GAL4 driving UAS-CD8-RFP (red) in the lamina and medulla layers of the adult optic lobe. The lamina receives axonal projections from photoreceptors R1-R6 and the medulla receives projections from photoreceptor R7-R8. Scale bar = 50 µm. (c) Optical section showing miR-1000 expression (green) and VGlut-GAL4 (red) in medulla and lobula layers of the adult optic lobe. Scale bar = 50 µm.
Nature Neuroscience: doi:10.1038.nn.3935