Embed Size (px)
Citation preview
S U P P L E M E N TA RY I N F O R M AT I O N
WWW.NATURE.COM/NATURECELLBIOLOGY 1
DOI: 10.1038/ncb3337
% p
ositi
ve h
epat
ocyt
espe
r cel
l lay
er
120
40
0CV1 CV2 CV3 PA PV3 PV2 PV1
100
20
Lgr4 mRNALgr5 mRNA
60
80
b
Supplementary Figure 1Planas-Paz & Orsini et al.
Parenchyma
Lgr5 mRNA Lgr4 mRNA DAPI
a
dLgr4 promoter Lgr4 locus ATG
2 21
AlbCre mice
x
... 21Lgr4lox mice
Lgr4 promoter Lgr4 locus
2 ...Lgr4LKO mice
Lgr5 promoter Lgr5 locus ATG
...Lgr5lox mice
Lgr5 promoter Lgr5 locus
...Lgr5LKO mice
22
22
liver-specificLgr4 KO
x
Lgr4/5dLKO mice
liver-specificLgr5 KO
liver-specificLgr4/5 dKO
AlbCre mice
x
2 21 ...Rnf43-LacZ
mice
Rnf43 promoter BAC transgenic
Exon Exon
c
Exon ExonLoxP
ExonLoxP
LoxP
ExonLoxP
Exon ExonLoxPLoxP
LacZ
Supplementary Figure 1 LGR4 and LGR5 expression and mouse model generation. a, Lgr4 and Lgr5 ISH in liver parenchyma of control mice. The images are representative for 4 mice each. b, Percent of hepatocytes expressing Lgr4 and Lgr5 in the indicated liver zones. n = 4 mice. These data involved
assessment of 3346 cells from the indicated mice. c, Scheme depicting the generation of Rnf43-LacZ mice. d, Scheme depicting the generation of liver-specific Lgr4/5dLKO mice by crossing with AlbCre mice. Data represent mean ± s.d. Scale bars, (a) 20 µm and (magnification in a) 10 µm.
© 2016 Macmillan Publishers Limited. All rights reserved
S U P P L E M E N TA RY I N F O R M AT I O N
2 WWW.NATURE.COM/NATURECELLBIOLOGY
Supplementary Figure 2Planas-Paz & Orsini et al.
Lgr4ki/R26-LacZ mice(10 days)
Nuclear Fast Red LacZ
b cLgr4ki/R26-LacZ mice
(10 months)Lgr5ki/R26-LacZ mice
(10 days)
Nuclear Fast Red LacZ
Lgr5ki/R26-LacZ mice(18 months)
cvcv
pvpv
pv
cvpv
cvpv
cvcv
pv
Axin2 mRNA Lgr5 mRNA
Lgr5Ki/R26-LacZ mice (10 days)
Beta-Gal Axin2 mRNA DAPI
Lgr5ki/R26-LacZ mice (10 days)e f
Nuclear Fast Red LacZ
i
WT mice
Lgr4ki/R26LacZ miceLgr5ki/R26LacZ mice
5 days
10 days
10/18 months
Tamoxifeninjections
LacZ staining(Lineage tracing)
a
d10 days18 months
Dis
tribu
tion
of L
acZ+
cel
ls 100
80
40
0CV1 CV2 CV3 PA PV3 PV2 PV1
60
20
Parenchyma Parenchyma Parenchyma Parenchyma
3 days 14 days
EdUinjections
EdUstaining
l
GS EdU DAPI
central vein parenchyma portal vein
CV PVPA
% E
dU+
hepa
tocy
tes
ns6
4
0
nsns
2
m n
Dis
tribu
tion
ofE
dU+
hepa
tocy
tes
100
80
40
0CV1 CV2 CV3 PA PV3 PV2 PV1
60
20
Lgr5ki/R26-LacZ mice
7 days 48h
Tamoxifeninjections
tdTOM/Ki67staining
Lgr5ki/R26-tdTOM mice
PH
h
g
j k
cvcvcv cv
LacZ+ LacZ-
% p
eric
entra
l hep
atoc
ytes 120
80
0
40
100
20
60
Axin2 mRNALgr5 mRNA
Haematoxylin tdTOM
Lgr5ki/R26-tdTOM mice (10 days)
Haematoxylin Ki67
ns80
0
40
20
60
% K
i67+
hep
atoc
ytes
i i
ii
ii
cv
cv
cv
cvcv
cv
tdTOM+ tdTOM-
Haematoxylin tdTOM
Haematoxylin Ki67
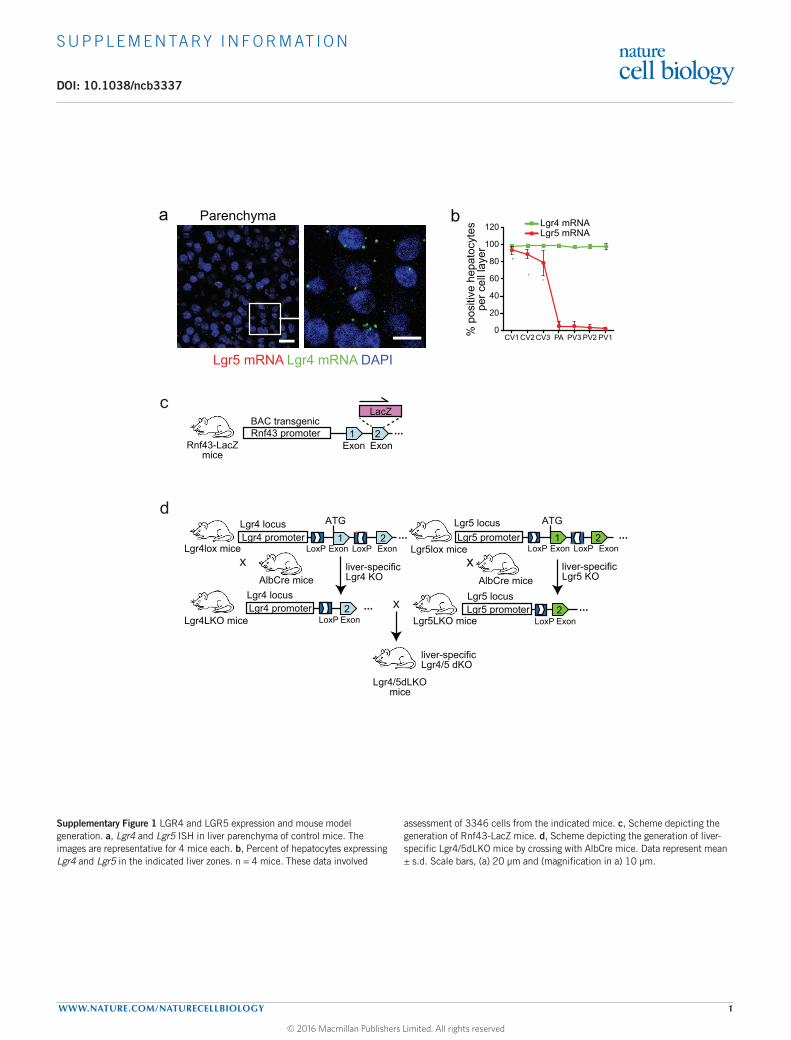
Supplementary Figure 2 LGR4 and LGR5 lineage tracing. a, Scheme depicting lineage tracing in Lgr4ki/R26-LacZ and Lgr5ki/R26-LacZ mice. b, LacZ staining in Lgr4ki/R26-LacZ mice showing LGR4+ hepatocytes in the liver (magnified area: parenchyma) after 10 days or 10 months of tracing. c, LacZ staining in Lgr5ki/R26-LacZ mice showing no LGR5+ hepatocytes in the liver (magnified area: parenchyma) after 10 days or 18 months of tracing. d, Distribution of Lgr5ki/R26-LacZ+ hepatocytes after 10 days or 18 months of tracing. n = 3 mice per group. These data involved assessment of 210 cells (10 days) and 330 cells (18 months) from the indicated mice. e, Axin2 ISH and β-Gal staining in Lgr5ki/R26-LacZ mice after 10 days of tracing showing Axin2+/LacZ+ hepatocytes. f, LacZ staining, Axin2 and Lgr5 co-ISH in consecutive liver sections of Lgr5ki/R26-LacZ mice after 10 days of tracing. g, Percent of hepatocytes expressing Axin2 and Lgr5 in Lgr5ki/R26-LacZ+ and Lgr5ki/R26-LacZ- hepatocytes. n = 4 mice. h, Scheme depicting lineage tracing in Lgr5ki/tdTOM mice 2 days post-PH. i, tdTOM
and Ki67 staining on consecutive liver sections of Lgr5ki/R26-tdTOM mice 2 days post-PH. Arrowheads indicate tdTOM+/Ki67+ hepatocytes. j, tdTOM+/Ki67+ hepatocytes quantified in Lgr5ki/R26-tdTOM mice 2 days post-PH. n = 4 mice. k, Scheme depicting EdU injections in WT mice. l, GS and EdU co-staining in control mice. Arrowheads indicate EdU+ hepatocytes. m, EdU+ hepatocytes quantified in liver zones of control mice. n = 5 mice. n, Distribution of EdU+ hepatocytes in the indicated liver zones. n = 5 mice. These data involved assessment of (d) 210 cells (10 days) and 330 cells (18 months); (g) 1970 LacZ- and 87 LacZ+ cells; (j) 14681 tdTOM- and 49 tdTOM+ cells; (m) 2650 cells; and (n) 577 cells from the indicated mice. CV, central vein; PV, portal vein. The images in (b, c) and (e, f, i, l) are representative for 3 and 4 mice each, respectively. Data represent mean ± s.d. ns, not significant; two-tailed unpaired t-test (j) and one-way ANOVA with Tukey’s test (m) were used. Scale bars, (b, c, f) 100 µm, (magnifications in b, c) 50 µm, (e, l, magnification in f) 20 µm and (i) 50 µm.
© 2016 Macmillan Publishers Limited. All rights reserved
S U P P L E M E N TA RY I N F O R M AT I O N
WWW.NATURE.COM/NATURECELLBIOLOGY 3
Supplementary Figure 3Planas-Paz & Orsini et al.
cont
rol
HNF4α CK19 DAPI
Lgr4
/5dL
KO
cv
cv
pv
pv
P2 P10 P30
pv
pv
cv
cv
pv
pv
cv
cv
cont
rol
SOX9 DAPI
Lgr4
/5dL
KO
P2 P10 P30
cv
cv
pv
pv
cv
cv
pv
pv
cv
cv
pv
pv
c
d
a P2 P10 P30
cont
rol
Lgr4
/5dL
KO
cv
cv
pv
pv
GS CK19 DAPI
cv
cv
pv cv
cv
pv
pvpv
b
***
% G
S st
aini
ng
***6
4
2
0
***controlLgr4/5dLKO
P2 P10 P30
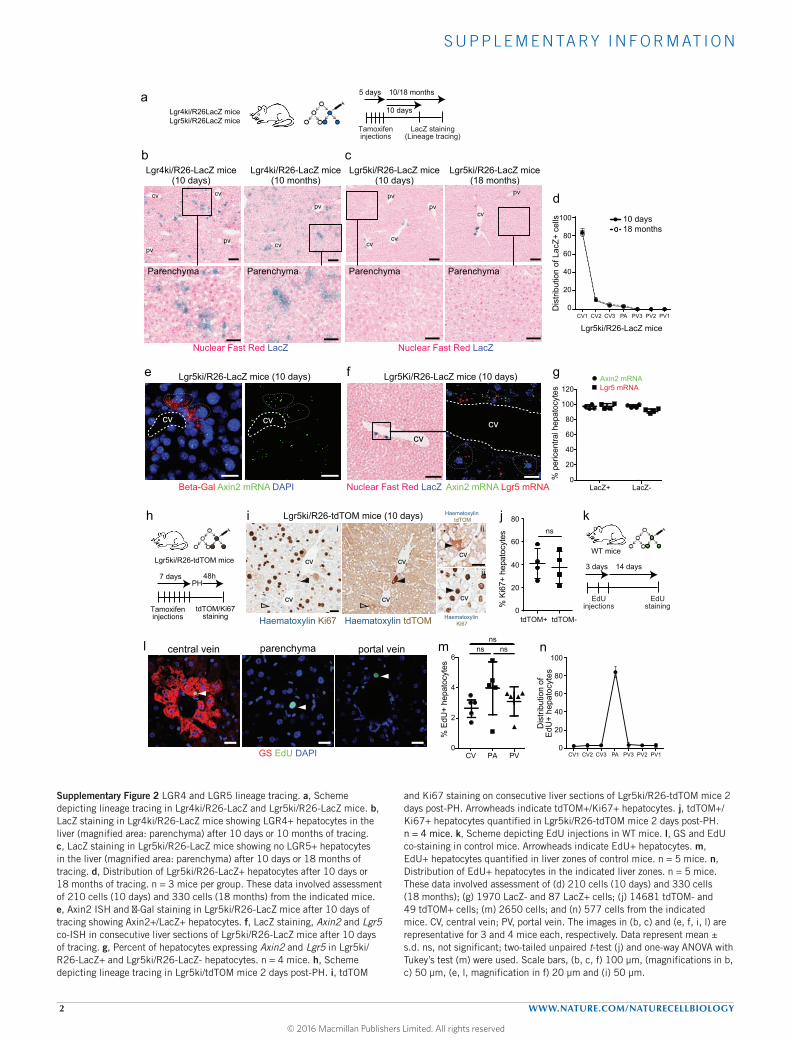
Supplementary Figure 3 Role of LGR4 and LGR5 during hepatocyte maturation and differentiation. a, GS and CK19 co-staining in P2, P10 and P30 control and Lgr4/5dLKO mice. b, GS+ staining quantified in the indicated mice. n = 4 mice (P10 control and P30 control) and 5 mice (all other groups). c, HNF4α and CK19 co-staining in P2, P10 and P30 control
and Lgr4/5dLKO mice. d, SOX9 staining in P2, P10 and P30 control and Lgr4/5dLKO mice. CV, central vein; PV, portal vein. The images in (a, c, d) are representative for 29 mice, and the stainings were repeated 2 times. Data represent mean ± s.d. **, P<0.01; ***, P<0.001; ****, P<0.0001; two-tailed unpaired t-test (b) was used. Scale bars, 20 µm.
© 2016 Macmillan Publishers Limited. All rights reserved
S U P P L E M E N TA RY I N F O R M AT I O N
4 WWW.NATURE.COM/NATURECELLBIOLOGY
-7
fold change [log2]-6 -5 -4 -3 -2 -1 0 1 2 43
sign
ifica
nce
[-log
10]
1
2
3
8
4
5
6
7
9
10
Lgr4/5dLKO :: control RNA expression
Hsd17b13
Hal
Slc1a2
Gulo
Lhpp
Oat
Glul
Cyp2e1
Rdh9
Slc13a3
Cyp27e1
Slc16a10
Blvrb
Aqp9
Plbd1
Slc22a1
Ahr
Lgr4
Axin2Lect2
Tnfrsf19
Supplementary Figure 4Planas-Paz & Orsini et al.
a b
signed log10p MannWhitneyU U pval ajd netlog10
0.1
0.2
0.3
0.4
0.5
0.6
0.7
0.8
1 2 3 4 105 6 7 8 9
sign
ed lo
g10p
KSw
Dp
11
0
0.9
12 13
Lgr4/5dLKO :: controlGene sets: down
Pericentral genesPeriportal genesWnt signaling
cv
pv
pv
cv
control Lgr4/5dLKO
ARG1 DAPI
control Lgr4/5dLKO
PCK1 DAPI
c d
pvcvpv
cv
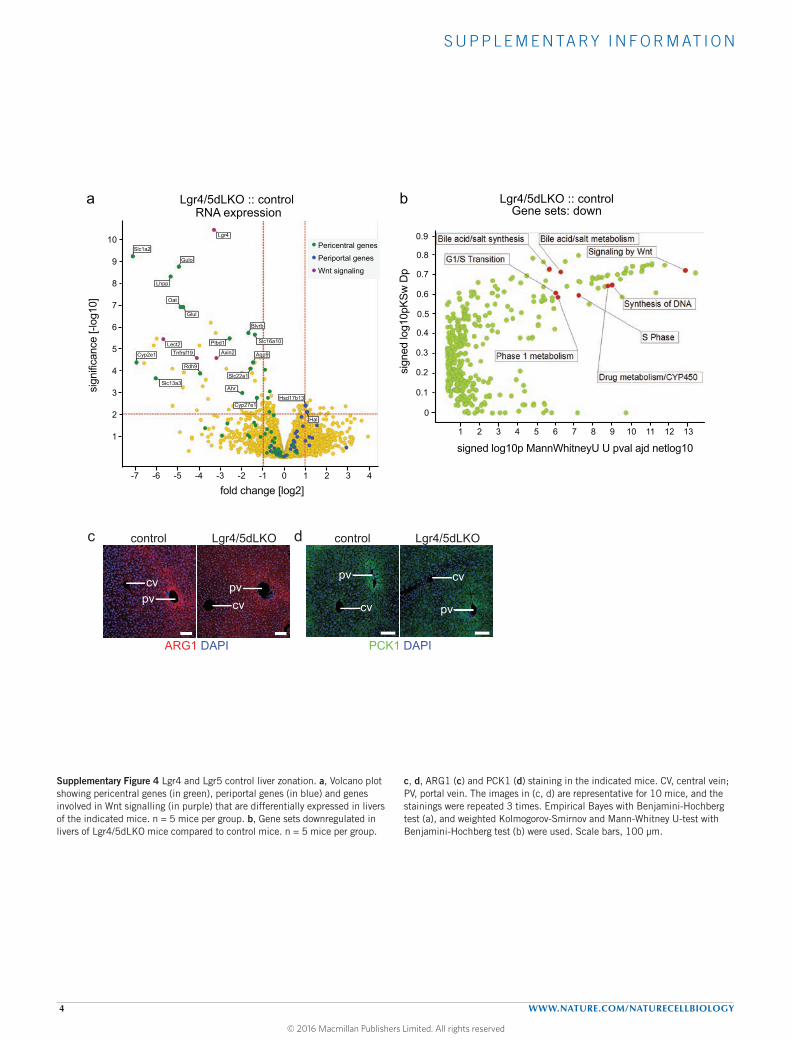
Supplementary Figure 4 Lgr4 and Lgr5 control liver zonation. a, Volcano plot showing pericentral genes (in green), periportal genes (in blue) and genes involved in Wnt signalling (in purple) that are differentially expressed in livers of the indicated mice. n = 5 mice per group. b, Gene sets downregulated in livers of Lgr4/5dLKO mice compared to control mice. n = 5 mice per group.
c, d, ARG1 (c) and PCK1 (d) staining in the indicated mice. CV, central vein; PV, portal vein. The images in (c, d) are representative for 10 mice, and the stainings were repeated 3 times. Empirical Bayes with Benjamini-Hochberg test (a), and weighted Kolmogorov-Smirnov and Mann-Whitney U-test with Benjamini-Hochberg test (b) were used. Scale bars, 100 µm.
© 2016 Macmillan Publishers Limited. All rights reserved
S U P P L E M E N TA RY I N F O R M AT I O N
WWW.NATURE.COM/NATURECELLBIOLOGY 5
Supplementary Figure 5Planas-Paz & Orsini et al.
Wild type
Lgr4KO
Lgr5KO
Lgr4/5dKO
a
GS CK19 Ki67 DAPI
cont
rol
Lgr4
/5dL
KO
P2
cvpv
cv pv
parenchyma
parenchyma
P10
cv pv
parenchyma
cvpv
parenchyma
P30
cv pv
parenchyma
cvpv
parenchyma
Haem
atoxylin Ki67
*
% K
i67+
hep
atoc
ytes ns60
40
20
0CV PV PA
control Lgr4/5dLKO
ns
b c
GS CK19 Ki67 DAPI GS CK19 Ki67 DAPI
% K
i67+
hep
atoc
ytes ns*40
30
20
0CV PV PA
control Lgr4/5dLKO
*
10
ns
% K
i67+
hep
atoc
ytes ns15
10
5
0CV PV PA
control Lgr4/5dLKO
ns
cont
rol
Lgr4
/5dL
KO
cont
rol
Lgr4
/5dL
KO
d
ns
% K
i67+
live
r cel
ls 100
75
50
0control Lgr4LKO
Lgr5LKO Lgr4/5dLKO
nsns
25
e
E16
.5
f
ns
Live
r wei
ght
(% b
ody
wei
ght)
60
40
20
0P2 P10 P30
control Lgr4/5dLKO
*
*
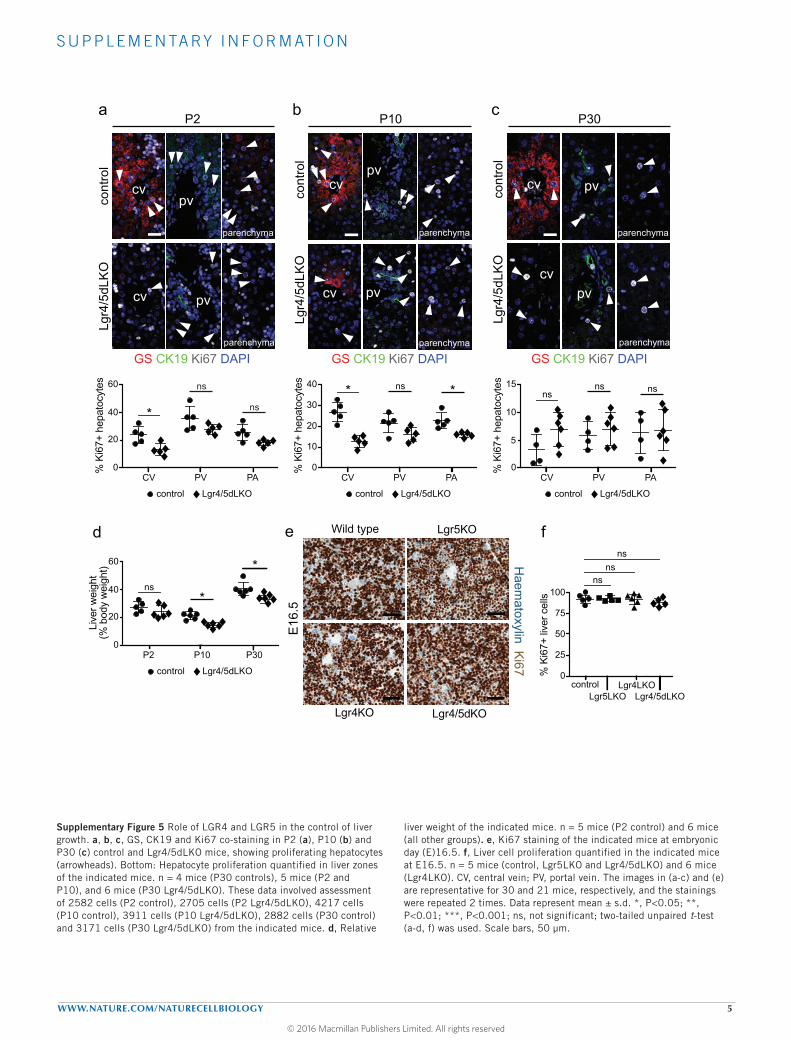
Supplementary Figure 5 Role of LGR4 and LGR5 in the control of liver growth. a, b, c, GS, CK19 and Ki67 co-staining in P2 (a), P10 (b) and P30 (c) control and Lgr4/5dLKO mice, showing proliferating hepatocytes (arrowheads). Bottom: Hepatocyte proliferation quantified in liver zones of the indicated mice. n = 4 mice (P30 controls), 5 mice (P2 and P10), and 6 mice (P30 Lgr4/5dLKO). These data involved assessment of 2582 cells (P2 control), 2705 cells (P2 Lgr4/5dLKO), 4217 cells (P10 control), 3911 cells (P10 Lgr4/5dLKO), 2882 cells (P30 control) and 3171 cells (P30 Lgr4/5dLKO) from the indicated mice. d, Relative
liver weight of the indicated mice. n = 5 mice (P2 control) and 6 mice (all other groups). e, Ki67 staining of the indicated mice at embryonic day (E)16.5. f, Liver cell proliferation quantified in the indicated mice at E16.5. n = 5 mice (control, Lgr5LKO and Lgr4/5dLKO) and 6 mice (Lgr4LKO). CV, central vein; PV, portal vein. The images in (a-c) and (e) are representative for 30 and 21 mice, respectively, and the stainings were repeated 2 times. Data represent mean ± s.d. *, P<0.05; **, P<0.01; ***, P<0.001; ns, not significant; two-tailed unpaired t-test (a-d, f) was used. Scale bars, 50 µm.
© 2016 Macmillan Publishers Limited. All rights reserved
S U P P L E M E N TA RY I N F O R M AT I O N
6 WWW.NATURE.COM/NATURECELLBIOLOGY
5 days 7 days
Tamoxifeninjections
LacZ staining(Lineage tracing)
Lgr5ki/R26LacZ mice
PH
h i
b
Axin2 mRNA
cv pvcv
pv
ISH
sig
nals
per h
epat
ocyt
e
Axin2 in WTAxin2 in WT d2 post-PH
8
4
0CV1 CV2 CV3 PA PV3 PV2 PV1
6
2
********
********
* * *
Supplementary Figure 6Planas-Paz & Orsini et al.
Wild type d2 post-PHWild typea
Nuclear Fast Red LacZ
Lgr5ki/R26-LacZ mice + PH
cvcv
pv
cv
Wild type d2 post-PH
Lgr5 mRNALgr4 mRNA
d
cv cvpv
pv
Wild type
ISH
sig
nals
per h
epat
ocyt
e
Lgr5 in WTLgr5 in WT d2 post-PH
4
3
2
0CV1 CV2 CV3 PA PV3 PV2 PV1
1ISH
sig
nals
per h
epat
ocyt
e
10
8
4
0CV1 CV2 CV3 PA PV3 PV2 PV1
6
2
Lgr4 in WTLgr4 in WT d2 post-PH
e f
control + PH :: controlRNA expression
fold change [log2]
sign
ifica
nce
[-log
10]
2 310-1-2-3-4-5-6 76540
2
3
1
5
4
4.5
3.5
2.5
1.5
0.5
Tnfrsf12aKrt7
Afp
Krt19
Sox9
Lgr4
Lgr5
Lgr4/5dLKO + PH :: control + PHRNA expression
fold change [log2]
sign
ifica
nce
[-log
10]
20246810 40
6
8
4
12
1011
9
7
5
3
Tnfrsf12a
Krt7Afp
Krt19
Sox9
Lgr5
Lgr4
12
c
g
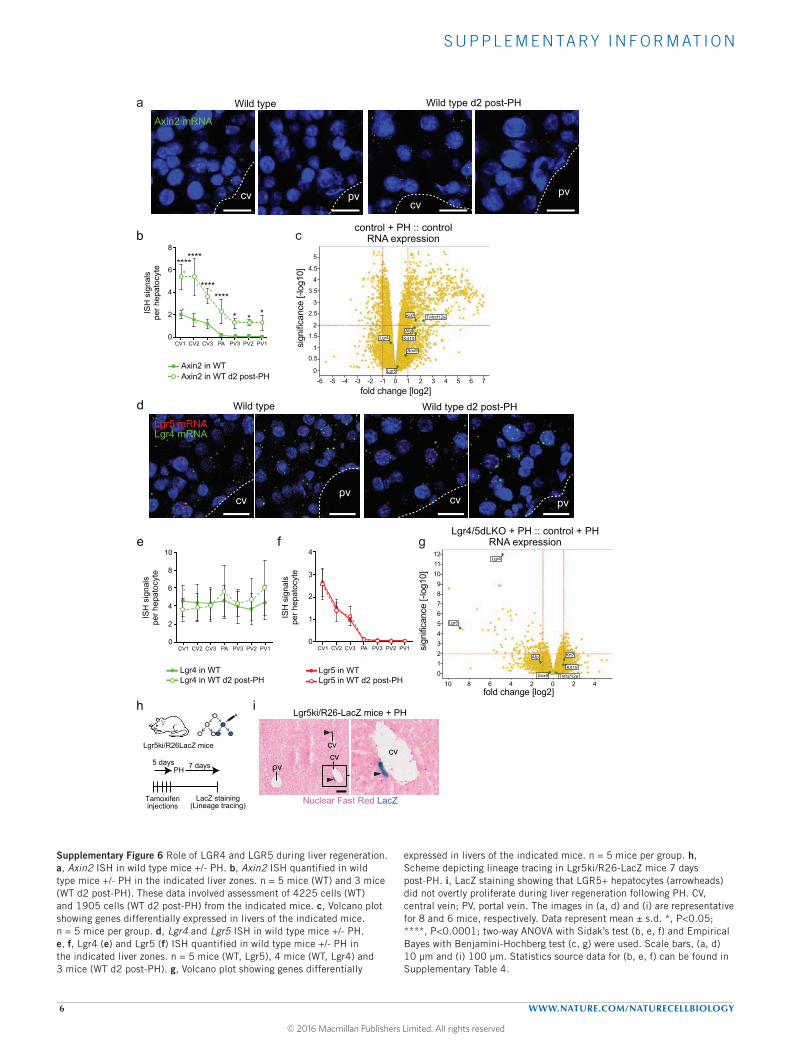
Supplementary Figure 6 Role of LGR4 and LGR5 during liver regeneration. a, Axin2 ISH in wild type mice +/- PH. b, Axin2 ISH quantified in wild type mice +/- PH in the indicated liver zones. n = 5 mice (WT) and 3 mice (WT d2 post-PH). These data involved assessment of 4225 cells (WT) and 1905 cells (WT d2 post-PH) from the indicated mice. c, Volcano plot showing genes differentially expressed in livers of the indicated mice. n = 5 mice per group. d, Lgr4 and Lgr5 ISH in wild type mice +/- PH. e, f, Lgr4 (e) and Lgr5 (f) ISH quantified in wild type mice +/- PH in the indicated liver zones. n = 5 mice (WT, Lgr5), 4 mice (WT, Lgr4) and 3 mice (WT d2 post-PH). g, Volcano plot showing genes differentially
expressed in livers of the indicated mice. n = 5 mice per group. h, Scheme depicting lineage tracing in Lgr5ki/R26-LacZ mice 7 days post-PH. i, LacZ staining showing that LGR5+ hepatocytes (arrowheads) did not overtly proliferate during liver regeneration following PH. CV, central vein; PV, portal vein. The images in (a, d) and (i) are representative for 8 and 6 mice, respectively. Data represent mean ± s.d. *, P<0.05; ****, P<0.0001; two-way ANOVA with Sidak’s test (b, e, f) and Empirical Bayes with Benjamini-Hochberg test (c, g) were used. Scale bars, (a, d) 10 µm and (i) 100 µm. Statistics source data for (b, e, f) can be found in Supplementary Table 4.
© 2016 Macmillan Publishers Limited. All rights reserved
S U P P L E M E N TA RY I N F O R M AT I O N
WWW.NATURE.COM/NATURECELLBIOLOGY 7
Supplementary Table Legends
Supplementary Table 1 Differential gene expression analysis. Differentially expressed genes in Lgr4/5dLKO vs control mouse livers +/- PH.
Supplementary Table 2 Gene set enrichment analysis. Differentially expressed gene sets in Lgr4/5dLKO vs control mouse livers +/- PH.
Supplementary Table 3 Probes used for Taqman RT-PCR.
Supplementary Table 4 Statistics source data.
© 2016 Macmillan Publishers Limited. All rights reserved