Embed Size (px)
Citation preview
1
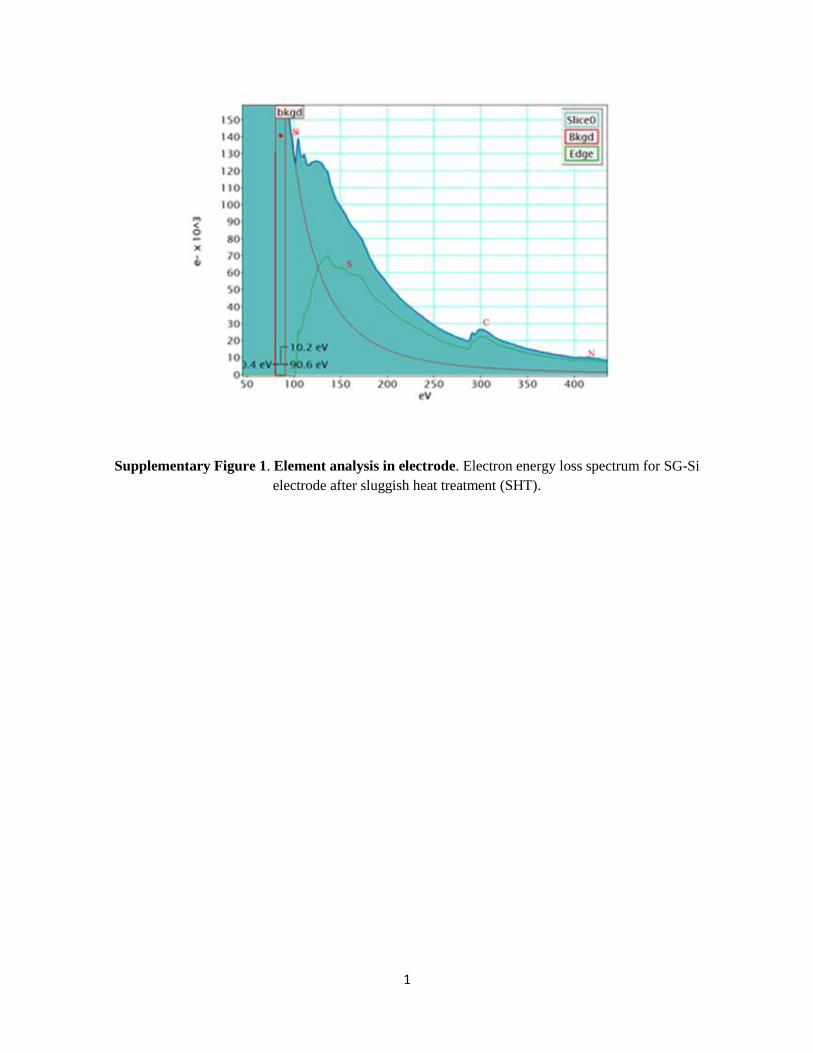
Supplementary Figure 1. Element analysis in electrode. Electron energy loss spectrum for SG-Si
electrode after sluggish heat treatment (SHT).
2
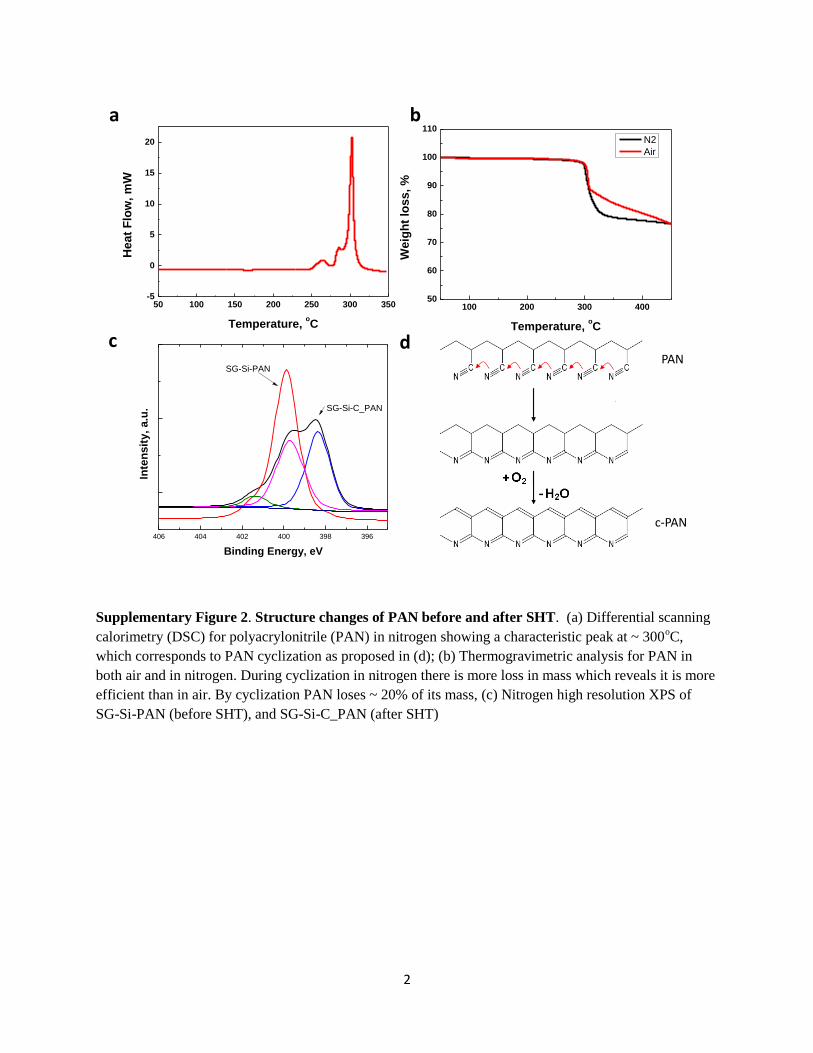
Supplementary Figure 2. Structure changes of PAN before and after SHT. (a) Differential scanning
calorimetry (DSC) for polyacrylonitrile (PAN) in nitrogen showing a characteristic peak at ~ 300oC,
which corresponds to PAN cyclization as proposed in (d); (b) Thermogravimetric analysis for PAN in
both air and in nitrogen. During cyclization in nitrogen there is more loss in mass which reveals it is more
efficient than in air. By cyclization PAN loses ~ 20% of its mass, (c) Nitrogen high resolution XPS of
SG-Si-PAN (before SHT), and SG-Si-C_PAN (after SHT)
50 100 150 200 250 300 350-5
0
5
10
15
20
Heat
Flo
w, m
W
Temperature, oC
100 200 300 40050
60
70
80
90
100
110
We
igh
t lo
ss
, %
Temperature, oC
N2
Air
PAN
c-PAN406 404 402 400 398 396
SG-Si-C_PAN
Inte
nsit
y,
a.u
.
Binding Energy, eV
SG-Si-PAN
a b
c d

3
Supplementary Figure 3. Effect of annealing PAN on resistance. Electrochemical impedance for a
coin cell fabricated using PAN-coated copper foil vs lithium, same method of cell testing as described in
the experimental section. The figure reveals that both the electrode series resistance and the charge
transfer resistance have been decreased after the sluggish heat treatment.
0 500 1000 1500 20000
500
1000
1500
2000
PAN-b
efore
SHT
Zim
, o
hm
s
Zre, ohms
PAN-a
fter
SHT
4
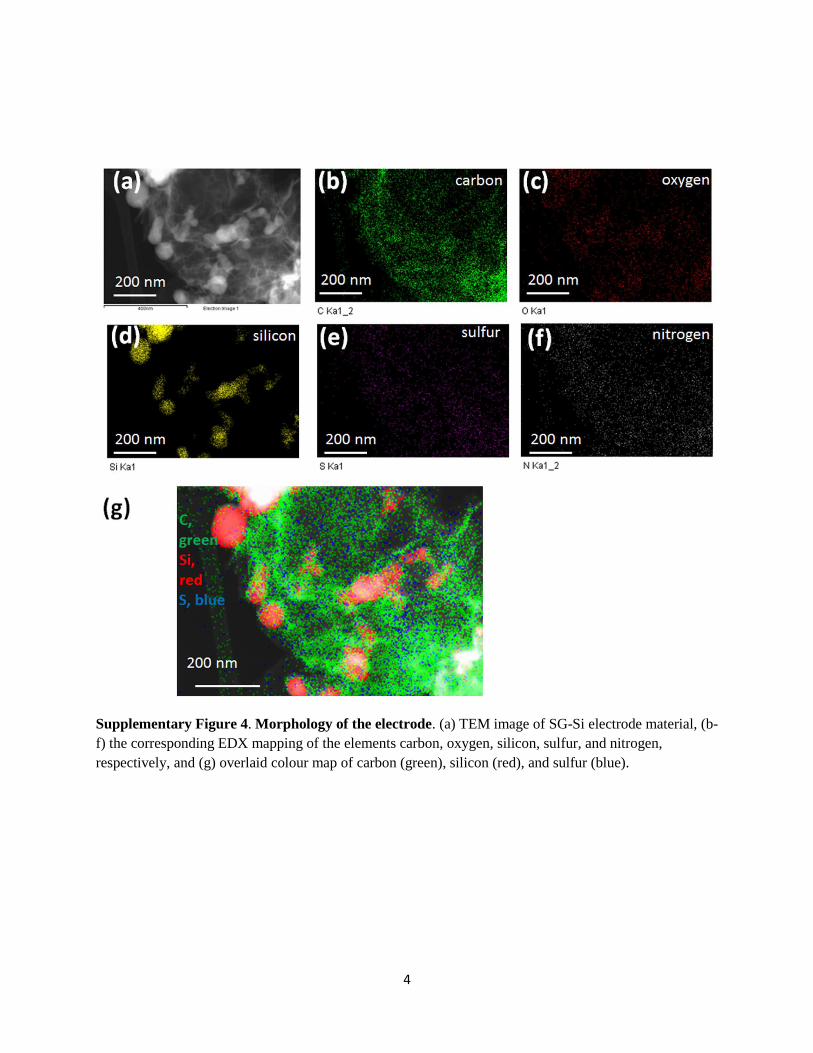
Supplementary Figure 4. Morphology of the electrode. (a) TEM image of SG-Si electrode material, (b-
f) the corresponding EDX mapping of the elements carbon, oxygen, silicon, sulfur, and nitrogen,
respectively, and (g) overlaid colour map of carbon (green), silicon (red), and sulfur (blue).
5
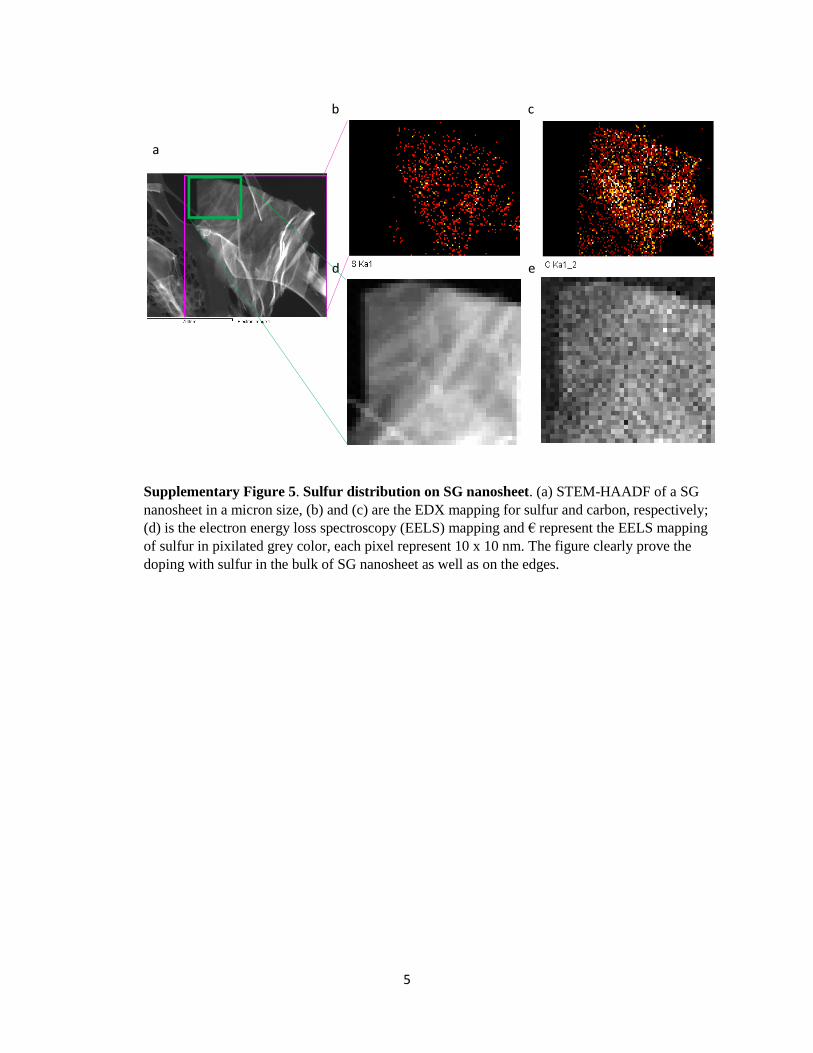
Supplementary Figure 5. Sulfur distribution on SG nanosheet. (a) STEM-HAADF of a SG
nanosheet in a micron size, (b) and (c) are the EDX mapping for sulfur and carbon, respectively;
(d) is the electron energy loss spectroscopy (EELS) mapping and € represent the EELS mapping
of sulfur in pixilated grey color, each pixel represent 10 x 10 nm. The figure clearly prove the
doping with sulfur in the bulk of SG nanosheet as well as on the edges.
a
b c
d e

6
Supplementary Figure 6. Morphology of SG-Si-PAN electrode. (a) The as-prepared electrode after
drying, (b) The electrode after sluggish heat treatment, and (c) The electrode extracted from a coin cell
which was cycled for 100 cycles.
SHT treatment at
450oC
SG-Si-PAN electrodeSG-Si-c_PAN electrode
After cycling in a coin cell
a b
c

7
0 50 100 150 200 250
0.00
0.05
0.10
0.15
0.20
0.25
electrode before SHT
(dV
/dlo
g(D
) P
ore
Vo
lum
e (
cm
³/g
)
Pore Diameter (nm)
electrode after SHT
Supplementary Figure 7. Porosity in the electrode. Comparison of pore size distribution for the SG-Si
electrode before and after SHT. The pore volume increases after SHT which provide void space that
compensate the volume expansion of Si during lithiation.

8
Supplementary Figure 8. Cyclic voltammogram curves of G-Si anode material in coin cell.
Supplementary Figure 9. Cycle stability of a reference cell. The cell was fabricated using SiNP (60%),
PVDF (20%) as binder, and super P (20%) as conducting carbon, the performance was tested at 0.1Ag-1
.
2 4 6 8 10 12 14 16 18 200
1000
2000
3000
4000
5000
Sp
ecif
ic c
ap
acit
y (
mA
h/g
)
Cycle No.
0
20
40
60
80
100
Eff
icie
ncy (
%)
0.0 0.3 0.6 0.9 1.2 1.5
-0.4
-0.2
0.0
0.2
0.4
Cu
rren
t d
ensi
ty, A
g-1
Potential, V vs. Li/Li+
1st cycle
2nd cycle
3rd cycle
4th cycle
5th cycle

9
Supplementary Figure 10. Reference battery testing. (a) SG-PAN, and (b) only c-PAN, after being
subjected to SHT treatment. The cells were tested at 0.1A g-1
then continued at 2 A g-1
. The SG-PAN
provide reversible capacity of ~ 250 mAh g-1
and the c-PAN provide ~ 25 mAh g-1
.
0 200 400 600 800 10000
50
100
150
200
Sp
ec
ific
Ca
pa
cit
y,
mA
h g
-1
Cycle No.
0 20 40 60 80 100 120 1400
200
400
600
800
Sp
ec
ific
Ca
pa
cit
y,
mA
h g
-1
Cycle No.
discharge
charge
0
20
40
60
80
100
Eff
icie
nc
y,
%
a
b
10
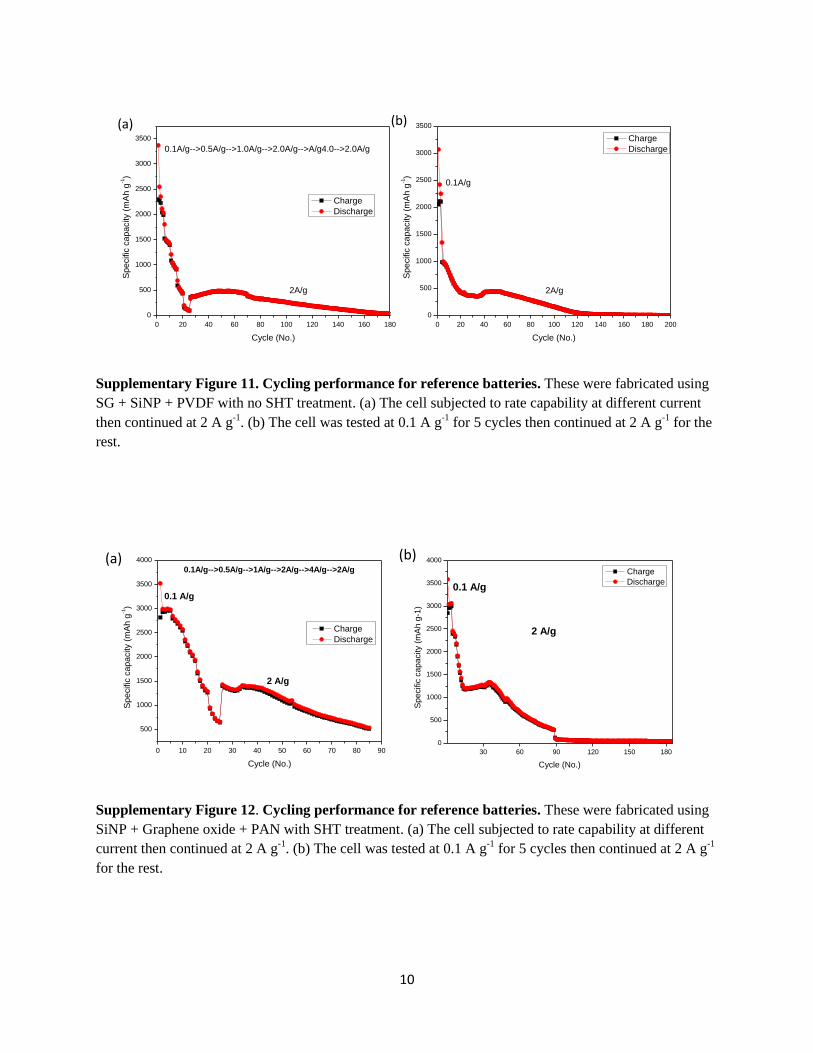
Supplementary Figure 11. Cycling performance for reference batteries. These were fabricated using
SG + SiNP + PVDF with no SHT treatment. (a) The cell subjected to rate capability at different current
then continued at 2 A g-1
. (b) The cell was tested at 0.1 A g-1
for 5 cycles then continued at 2 A g-1
for the
rest.
Supplementary Figure 12. Cycling performance for reference batteries. These were fabricated using
SiNP + Graphene oxide + PAN with SHT treatment. (a) The cell subjected to rate capability at different
current then continued at 2 A g-1
. (b) The cell was tested at 0.1 A g-1
for 5 cycles then continued at 2 A g-1
for the rest.
0 20 40 60 80 100 120 140 160 180
0
500
1000
1500
2000
2500
3000
3500
Sp
ecific
ca
pa
city (
mA
h g
-1)
Cycle (No.)
Charge
Discharge
2A/g
0.1A/g-->0.5A/g-->1.0A/g-->2.0A/g-->A/g4.0-->2.0A/g
0 20 40 60 80 100 120 140 160 180 200
0
500
1000
1500
2000
2500
3000
3500
Sp
ecific
ca
pa
city (
mA
h g
-1)
Cycle (No.)
Charge
Discharge
2A/g
0.1A/g
(a) (b)
30 60 90 120 150 180
0
500
1000
1500
2000
2500
3000
3500
4000
2 A/g
Sp
ecific
ca
pa
city (
mA
h g
-1)
Cycle (No.)
Charge
Discharge0.1 A/g
0 10 20 30 40 50 60 70 80 90
500
1000
1500
2000
2500
3000
3500
4000
2 A/g
0.1A/g-->0.5A/g-->1A/g-->2A/g-->4A/g-->2A/g
Sp
ecific
ca
pa
city (
mA
h g
-1)
Cycle (No.)
Charge
Discharge
0.1 A/g
(a) (b)

11
0 20 40 60 80 1000
500
1000
1500
2000
2500
3000
Vo
lum
etr
ic C
ap
acity, m
Ah
cm
-3
Cycle No.
Charge
Discharge
Supplementary Figure 13. Volumetric Capacity. The data presented here is for SG-Si-c-PAN electrode
for the cell performance with data shown in Figure 4b.

12
Supplementary Figure 14. Further battery performance. The results presented here is for SG-Si-c-
PAN electrode with ratio of 40:30:30, respectively. (a) The cell cycled at 0.1 A g-1
for conditioning then
continued at 1 A g-1
. (b) The cell started conditioning cycles then continued with rate capability at
different currents then continued cycling at 2 A g-1
. N.B. The Capacity measured here is per mass of
silicon and SG.
0 20 40 60 80 1000
1000
2000
3000
4000
Charge
Discharge
Efficiency
Sp
ecific
Ca
pa
city (
mA
h/g
)
Cycle number
0.1 A/g
1 A/g
0
20
40
60
80
100
Eff
icie
ncy (
%)
Si-SG-c_PAN 40:30:30
0 25 50 75 100 125 150 175 200 225 250
0
1000
2000
3000
4000
2 A/g
4 A
/g
3 A
/g2 A
/g
1.5
A/g
1 A
/g
0.5
A/g
Charge
Discharge
Efficiency
Sp
ec
ific
Ca
pa
cit
y (
mA
h/g
)
Cycle number
0.1
A/g
0
20
40
60
80
100
Eff
icie
nc
y (
%)
Si-SG-c_PAN 40:30:30
a
b

13
Supplementary Figure 15. After cycling characterization of SG-Si. (a) STEM image of SG-Si
electrode material after being cycled for 2275 cycles of charge discharge, b-f) the corresponding EDX
mapping of the elements carbon, oxygen, silicon, sulfur, and nitrogen, respectively.
Supplementary Figure 16. After cycling characterization of G-Si. The figure shows HAADF-STEM
image of the G-Si electrode after cycling for 800 cycles as shown in Figure 5e, it shows the
agglomeration of Si which explain the capacity fading.

14
Supplementary Figure 17. The optimized geometry of H passivated graphene (G). Top view (top)
and side view (bottom). C atoms are colored grey, H atoms white. Bond length is in angstrom.

15
Supplementary Figure 18. The optimized geometry of sulfur-doped graphene (S-G). top view (top)
and side view (bottom). C atoms are colored grey, H atoms are white, S atom is yellow. Bond lengths are
in angstrom.

16
Supplementary Figure 19. Geometries and bonding energy (BE) of the stable Si4 cluster adsorption
configurations. (a) On graphene, (b) On sulfur doped graphene. C atoms are colored grey, H atoms are
white, S atom is yellow, Si atoms are brown.

17
Supplementary Figure 20. Li adsorption and transition state. The figure quantifies Li diffusion barrier
for a) G-Si and b) SG-Si