Embed Size (px)
Citation preview
Supplementary
Butterfly Biology Systems: Connections and Interactions in Life History and Behaviour
Supplementary Figure legends
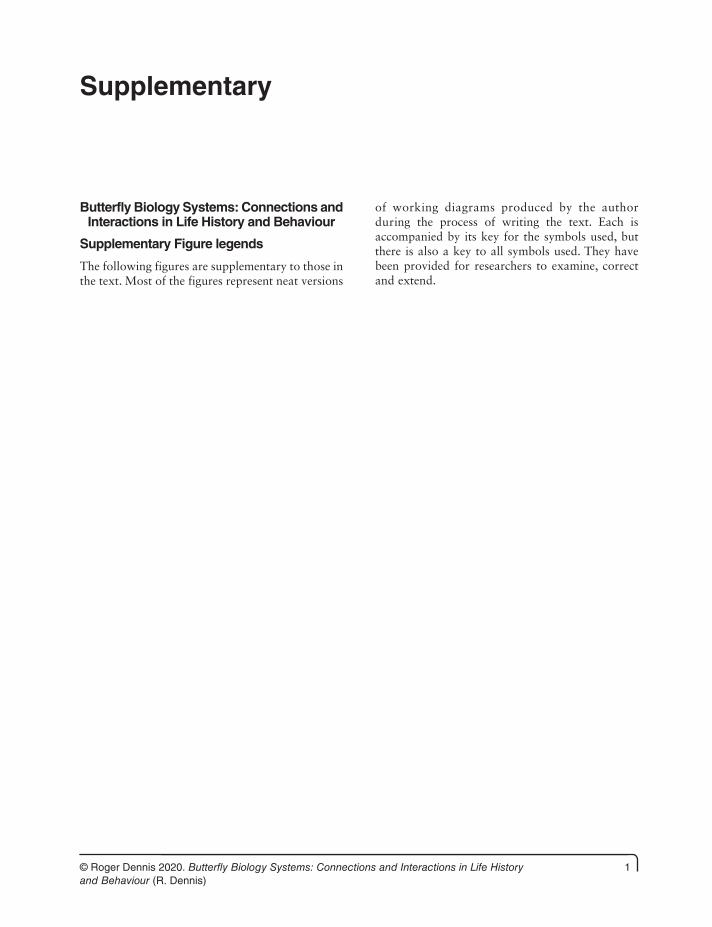
The following figures are supplementary to those in the text. Most of the figures represent neat versions
of working diagrams produced by the author during the process of writing the text. Each is accompanied by its key for the symbols used, but there is also a key to all symbols used. They have been provided for researchers to examine, correct and extend.
1© Roger Dennis 2020. Butterfly Biology Systems: Connections and Interactions in Life History and Behaviour (R. Dennis)

2 Supplementary
Müllerianmimicry
Predation
HybridsInter-species
confusion
Speciesrecognition
signals(courtship)
Sympatricevolution
Assortativemating
Aposematism Defences
Individualapparency
Reproductiveisolation
Fig. S1. A simple model for advancement of sympatric evolution in Müllerian mimics. The process of speciation through Müllerian mimicry is more likely to be one of enhancement of sympatric evolution (pre- and post-zygotic isolation mechanisms) than causation of sympatric speciation ab initio, but which may occur through hybridisation. The development of Müllerian mimics leads to a confusion between species that is considered to produce inter-racial hybrids with non-mimetic wing patterns (e.g. Heliconius erato × H. melpomene), thereby triggering additional species recognition signals (i.e. mating cues; sex pheromones; specialised visual signals) and assortative mating that further distinguishes closely matching Müllerian mimic forms as in Heliconius. Hybridisation between closely related species may create novel wing patterns, generating reproductive isolation from the two parental species, effecting sympatric speciation (e.g. Heliconius heurippa). The purple zone identifies factors leading to aposematism and Müllerian mimics (see Chapters C.7 and C.8), the orange zone factors enhancing sympatric evolution; these zones overlap. Links: continuous, positive associations; pecked, negative associations; red pecked link (after Finkbeiner et al., 2014) indicates that ineffectiveness in inducing mating behaviour may reduce the ability of butterflies to escape from predation (and vice versa). (See Jiggins et al., 2001a; Naisbit et al., 2003; Mavárez et al., 2006; Merrill et al., 2011, 2012, 2015; Elias and Joron, 2015.)
Supplementary 3
E L P N M RELPNMR
Resources (r)
1
2
3
4
5
6
7
8
equal
equivalent
intersection
partialintersection
contiguous
disjoint[trivial]
disjoint [dispersal]
1 2 3 4 5 .12345.
Species (s)
Speciescomparisons
disjoint [migration]
Step 3: HRISmean = (ΣHRIS)/nfor n locations
Step 2: HRIS = (ΣRIS)/(r2-r)½ where RIS is assessedover r resources. Process is repeated for n locations
(sites)
Step 1: RIS for pairedresources at different stages
Species 1 location 1
Species 1 location 2, etc
Individual resources: yellow,egg; green, larva; blue, pupa;
orange-red, adult.
Resource Intersection Scores(RIS)
10m
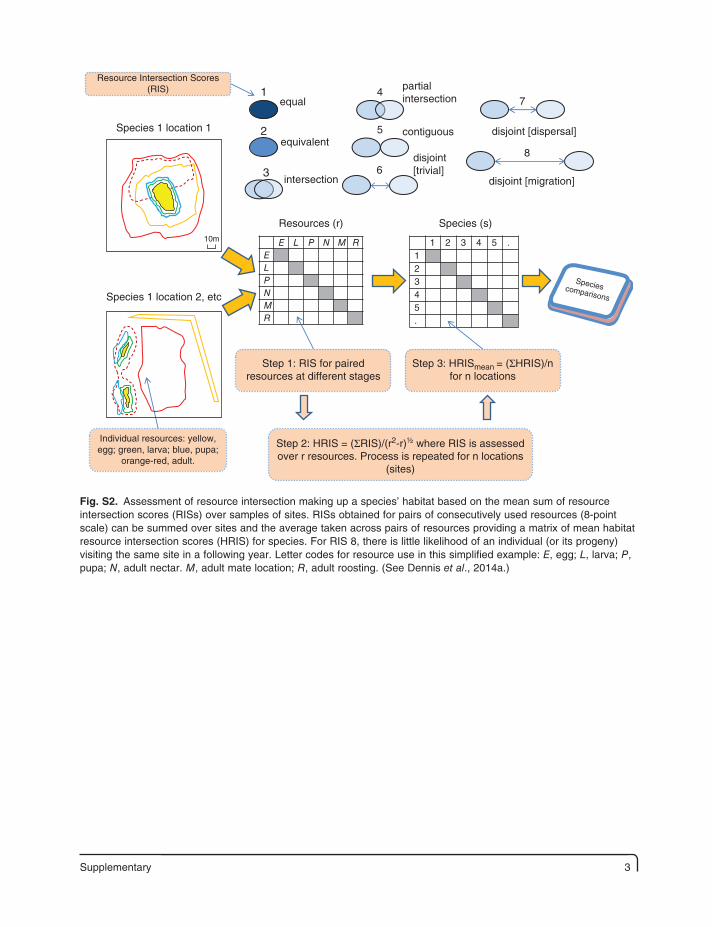
Fig. S2. Assessment of resource intersection making up a species’ habitat based on the mean sum of resource intersection scores (RISs) over samples of sites. RISs obtained for pairs of consecutively used resources (8-point scale) can be summed over sites and the average taken across pairs of resources providing a matrix of mean habitat resource intersection scores (HRIS) for species. For RIS 8, there is little likelihood of an individual (or its progeny) visiting the same site in a following year. Letter codes for resource use in this simplified example: E, egg; L, larva; P, pupa; N, adult nectar. M, adult mate location; R, adult roosting. (See Dennis et al., 2014a.)
4 Supplementary
Edges, corridors,barriers
+/– +/–
+/–
+/–
+/–
+/– +/–
+/–
+/–
+/–
+/– +/–
+/–
+/–
+/–
+/–
+/–
Δ+/–
Δ+/–
+
++
+
+
+
++
+ + +
+
+++
+
+ + ++
+
–
–
+
+
++
+
+
+
+
+
+
+–
–
–
––
–
–
–
–
––
Patch apparency(edge contrasts)
Patch arrangement(overlap, quality,
juxtaposition)
Patch dimensionsand density
Size
Density
Season ,Time of day:Ta R W
Bauplan
Flight height
MorphologyPhysiology
(wing load, aspectratio)
Flightdirectionality
Flight speed
Patch margins(resource-edge
encounters)
Individualperceptual range
Resource patchdetection
Resourcecontact
Encounter rate
Activity
MatingCourtship
HarassmentCompetition
Intra-specificsignals
Physiological age
Gn/Eninteractions
LANDSCAPE
RESOURCES
POPULATION
THERMAL CONDITIONS
FLIGHT
BEHAVIOUR
GENOTYPE PHENOTYPE
Patch quality
PERCEPTION
RESOURCEPATCH LEAVING
THRESHOLD
Key:
Environment EnGenotype Gn
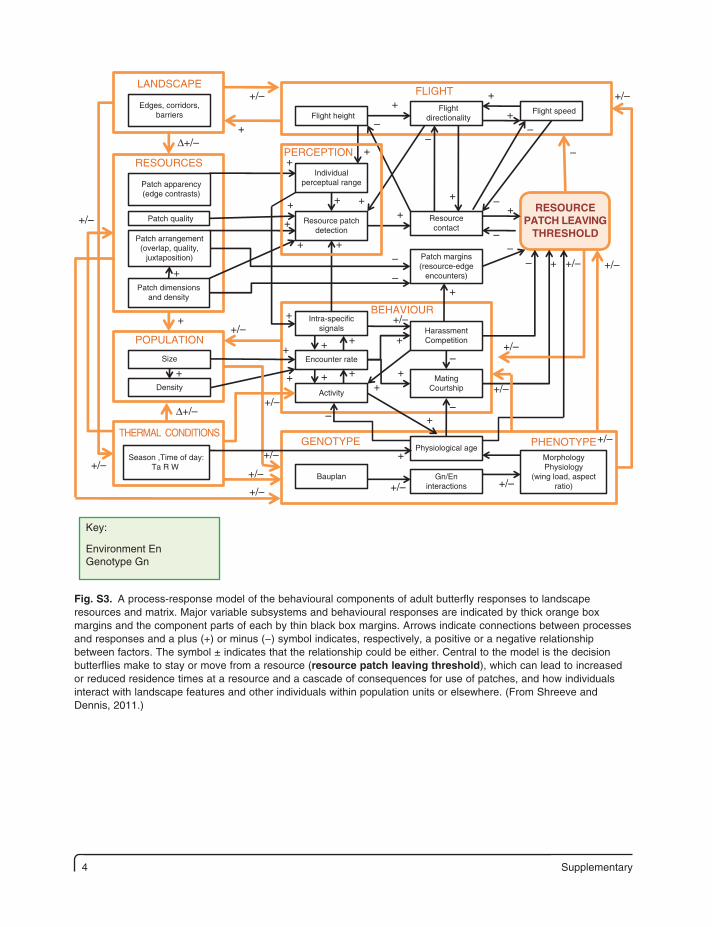
Fig. S3. A process-response model of the behavioural components of adult butterfly responses to landscape resources and matrix. Major variable subsystems and behavioural responses are indicated by thick orange box margins and the component parts of each by thin black box margins. Arrows indicate connections between processes and responses and a plus (+) or minus (−) symbol indicates, respectively, a positive or a negative relationship between factors. The symbol ± indicates that the relationship could be either. Central to the model is the decision butterflies make to stay or move from a resource (resource patch leaving threshold), which can lead to increased or reduced residence times at a resource and a cascade of consequences for use of patches, and how individuals interact with landscape features and other individuals within population units or elsewhere. (From Shreeve and Dennis, 2011.)
Supplementary 5
Asexual
dimorphism
Am
thermo-regulation/
activity
Am
mel
Af
mel
NS
SS
NS
SS
Possible impact: inter-species sexualselection created by male Colias philodiceeriphyle confusing melanic female Coliasalexandra for their own species.
Am
matepreference
(yellow over black)
Am
inter-speciessexual selection
Af
thermo-regulation/
activity
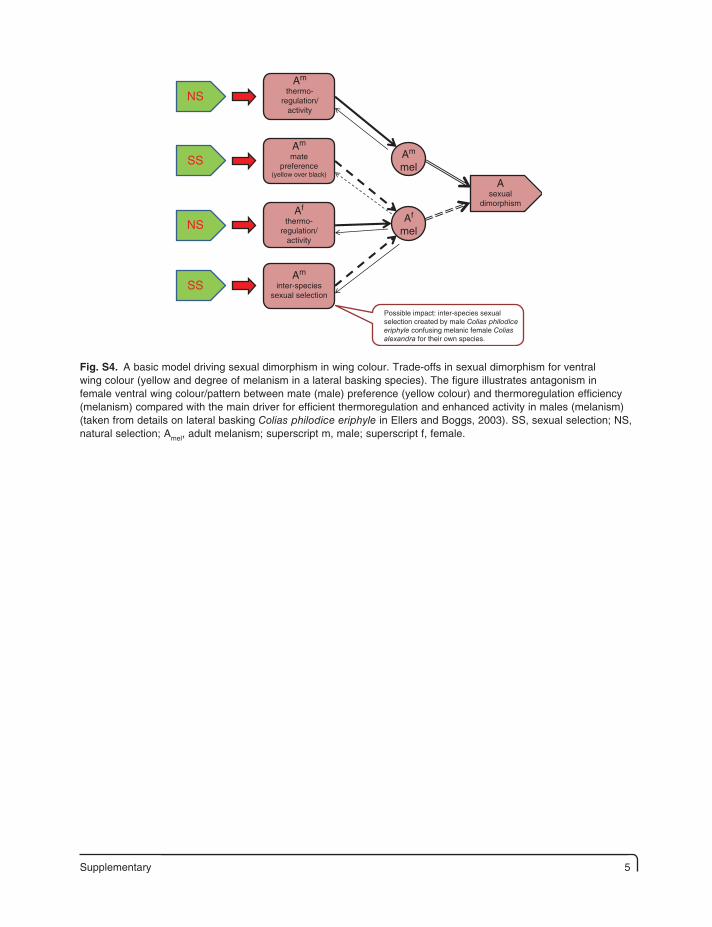
Fig. S4. A basic model driving sexual dimorphism in wing colour. Trade-offs in sexual dimorphism for ventral wing colour (yellow and degree of melanism in a lateral basking species). The figure illustrates antagonism in female ventral wing colour/pattern between mate (male) preference (yellow colour) and thermoregulation efficiency (melanism) compared with the main driver for efficient thermoregulation and enhanced activity in males (melanism) (taken from details on lateral basking Colias philodice eriphyle in Ellers and Boggs, 2003). SS, sexual selection; NS, natural selection; Amel, adult melanism; superscript m, male; superscript f, female.
6 Supplementary
Latitude(winter cold)
Ppt
Ta
Continentality(dry season)
HEt
AfS
Diapause
AEEt TE
b
EDT
TEbl50 Estmod EN
ES
ER
Em
Key:Adult (female) size Af
SAmbient temperature TaCritical body temperature (eggs) (causing 50% loss) TE
bl50Egg aestivation time AEE
tEgg development time EDTEgg body temperature TE
bEgg hibernation time HE
tEgg mortality EmEgg number ENEgg resources EREgg size ESEgg structural modifications (for resource retention and resistance to ambient conditions ESmod)Precipitation Ppt
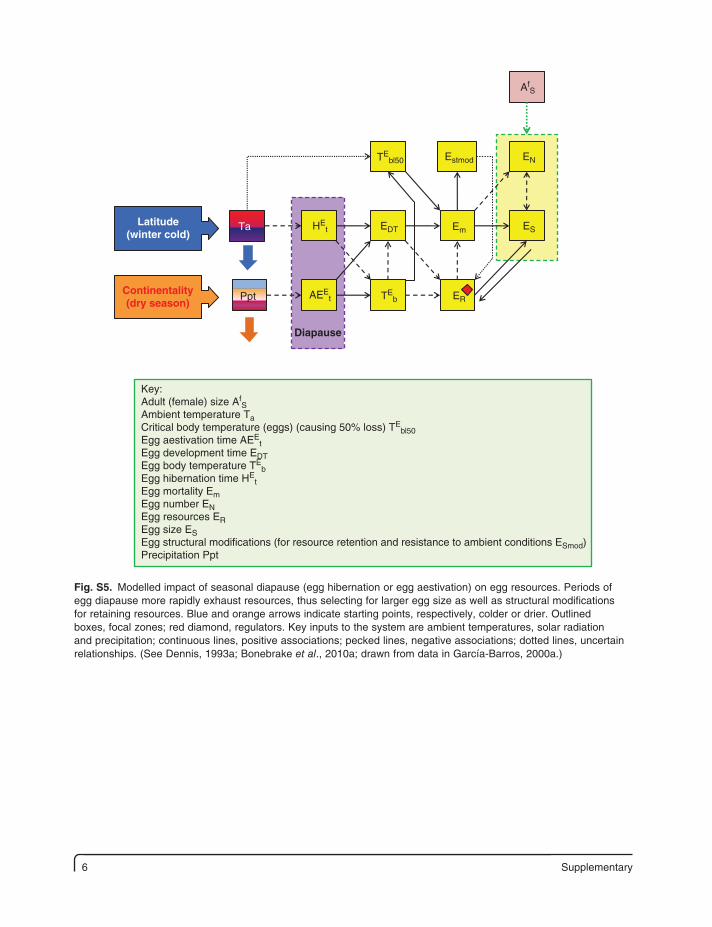
Fig. S5. Modelled impact of seasonal diapause (egg hibernation or egg aestivation) on egg resources. Periods of egg diapause more rapidly exhaust resources, thus selecting for larger egg size as well as structural modifications for retaining resources. Blue and orange arrows indicate starting points, respectively, colder or drier. Outlined boxes, focal zones; red diamond, regulators. Key inputs to the system are ambient temperatures, solar radiation and precipitation; continuous lines, positive associations; pecked lines, negative associations; dotted lines, uncertain relationships. (See Dennis, 1993a; Bonebrake et al., 2010a; drawn from data in García-Barros, 2000a.)
Supplementary 7
AfLS
TotalReproductiveInvestment
ER
OffspringFitness
AfSET
AfMR
AfTRAf
CR
AfOR
AfIR
Talim
HPQL
Afage
AfOI
+ +
++
+
+ +++
++
+
++
++
+
+
+
+
++
+
+
+
+
+
–
–
–
– –
––
–
–
+/–
+/–
–
–––
– –
–
–
–
––
–
–
––
–
AfS ES/Af
S
LhN
LhS
LhStarve Lh
HCS LhFC
Lhm
LDT
EDT
EmEN
ES
EL+W EP+E
Key:Adult (female) age Af
ageAdult (female) life span Af
LSAdult (female) capital resources Af
CRAdult (female) income resources Af
IRAdult (female) mating resources Af
MRAdult ovigeny index Af
OIAdult (female) oviposition rate Af
ORAdult (female) size Af
SAdult (female) stress experience total Af
SETAdult (female) total resources Af
TRAmbient air temperature (within finite limits) TalimEgg development time EDTEgg lipid and water EL+WEgg mortality EmEgg number ENEgg protein and energy EP+EEgg resources EREgg size ESHost plant quality HPQLLarval development time LDTLarval (hatchling) feeding capacity Lh
FCLarval (hatchling) head capsule size Lh
HCSLarval (hatchling) mortality Lh
mLarval (hatchling) number Lh
NLarval (hatchling) size Lh
SLarval (hatchling) starvation Lh
StarveNegative allometry of egg size on adult size (β<1)ES/Af
S
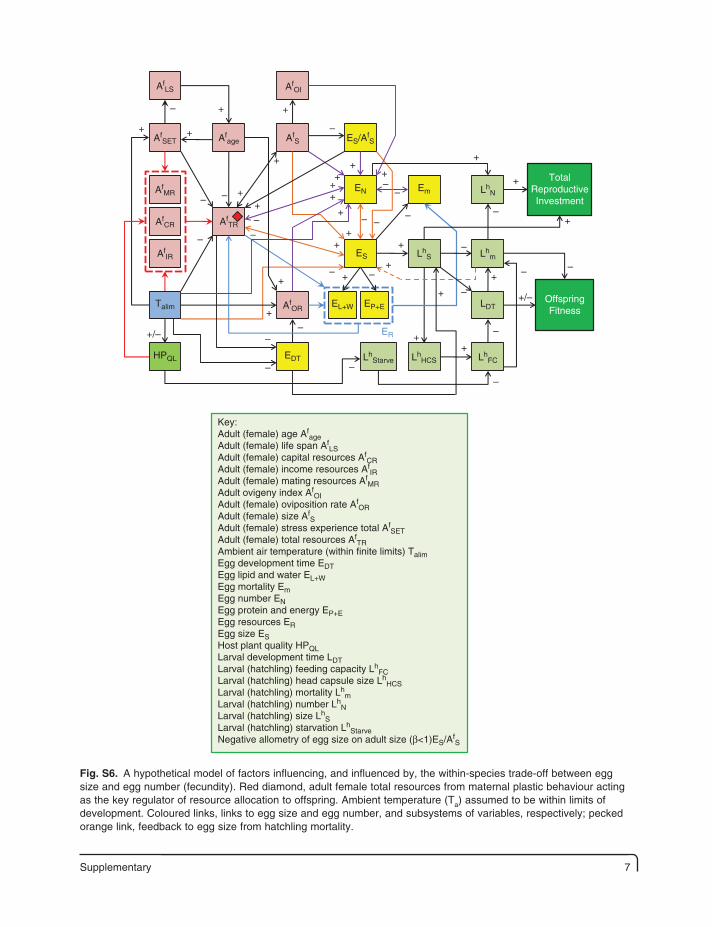
Fig. S6. A hypothetical model of factors influencing, and influenced by, the within-species trade-off between egg size and egg number (fecundity). Red diamond, adult female total resources from maternal plastic behaviour acting as the key regulator of resource allocation to offspring. Ambient temperature (Ta) assumed to be within limits of development. Coloured links, links to egg size and egg number, and subsystems of variables, respectively; pecked orange link, feedback to egg size from hatchling mortality.
8 Supplementary
L m+
+
+
+
+
+
+
–
–
–
–
–
–
–
+
L GR
L SA
Sr y
Tim
e av
aila
ble
bef
ore
nee
dto
dia
pau
se
(a)
S
SD
Pst
age
L DT,
DP
V
Opp
ortu
nitie
sfo
r co
ncea
lmen
t
Comm
unal
herb
ivory
AS
r y
L Rav
ail
ES,E
N(b
)
++
+
+
+
+
+
+ +
++
+
+
+
+
+
+
+
++
++
+
+–
–
–
–
––
–
–
+–
––
+
+
++
+
HP
spp
HP
QL
HP
QN
L BG
L fee
dtL s
tarv
e
L m(p
reda
tors
,P
aras
ites)
Ove
rtD
efen
ce(L
spin
es L
apos
L gre
g L w
eb)
L app
ar
L hid
eL c
ryp
L GR
L SL DT
HS
I
TbI
LGS
Ta R
Key
:A
dult
size
AS
Ann
ual r
ate
of in
crea
se r
yD
iapa
use
stag
e/ph
ase
atta
inm
ent D
p sta
geE
gg n
umbe
r E
NE
gg s
ize
ES
Hos
t pla
nt q
ualit
y H
PQ
LH
ost p
lant
qua
ntity
HP
QN
Hos
t pla
nt s
peci
es H
Psp
pH
iber
natio
n st
age
(larv
a) H
Sl
Larv
al c
onsp
icuo
usne
ss (
appa
renc
y) L
appa
rLa
rval
apo
sem
atis
m (
linke
d to
che
mic
al d
efen
ce)
L apo
sLa
rval
bio
mas
s ga
ined
LB
GLa
rval
cry
psis
(m
atch
ing
of e
nviro
nmen
tal o
bjec
t) L
cryp
Larv
al d
evel
opm
ent t
ime
L DT
Larv
al d
evel
opm
ent t
ime
to d
iapa
use
L DT,
DP
Larv
al fe
edin
g tim
e (1
nig
ht, 2
day
, 3 d
ay-n
ight
) L f
eedt
Larv
al g
row
th r
ate
L GR
Larv
al g
rega
rious
ness
Lgr
egLa
rval
hid
ing/
conc
ealm
ent L
hide
Larv
al m
orta
lity
L mLa
rval
res
ourc
e av
aila
bilit
y L R
avai
lLa
rval
siz
e L S
Larv
al s
pine
s/de
nse
hairs
Lsp
ines
Larv
al s
tarv
atio
n L s
tarv
eLa
rval
web
Lw
ebLe
ngth
of g
row
ing
seas
on L
GS
Sol
ar r
adia
tion
RT
empe
ratu
re (
ambi
ent)
Ta
Tem
pera
ture
(bo
dy, l
arva
l) T
bI
Vol
tinis
m (
num
ber
of b
rood
s) V
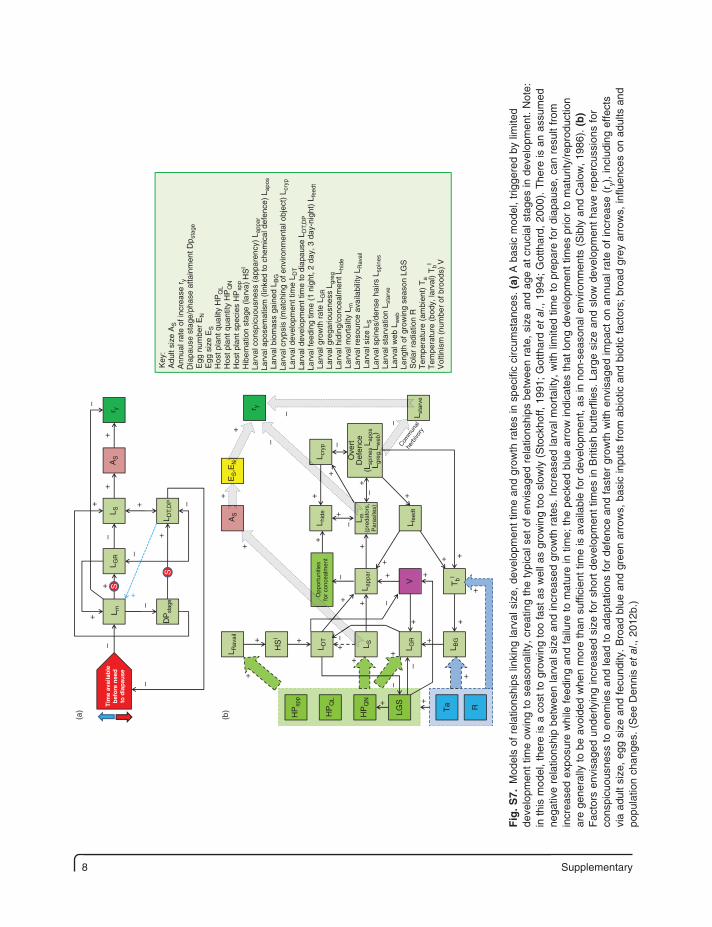
Fig
. S7.
Mod
els
of r
elat
ions
hips
link
ing
larv
al s
ize,
dev
elop
men
t tim
e an
d gr
owth
rat
es in
spe
cific
circ
umst
ance
s. (
a) A
bas
ic m
odel
, tr
igge
red
by li
mite
d de
velo
pmen
t tim
e ow
ing
to s
easo
nalit
y, c
reat
ing
the
typi
cal s
et o
f en
visa
ged
rela
tions
hips
bet
wee
n ra
te,
size
and
age
at
cruc
ial s
tage
s in
dev
elop
men
t. N
ote:
in
thi
s m
odel
, th
ere
is a
cos
t to
gro
win
g to
o fa
st a
s w
ell a
s gr
owin
g to
o sl
owly
(S
tock
hoff,
199
1; G
otth
ard
et a
l., 1
994;
Got
thar
d, 2
000)
. T
here
is a
n as
sum
ed
nega
tive
rela
tions
hip
betw
een
larv
al s
ize
and
incr
ease
d gr
owth
rat
es.
Incr
ease
d la
rval
mor
talit
y, w
ith li
mite
d tim
e to
pre
pare
for
dia
paus
e, c
an r
esul
t fr
om
incr
ease
d ex
posu
re w
hile
fee
ding
and
fai
lure
to
mat
ure
in t
ime;
the
pec
ked
blue
arr
ow in
dica
tes
that
long
dev
elop
men
t tim
es p
rior
to m
atur
ity/r
epro
duct
ion
are
gene
rally
to
be a
void
ed w
hen
mor
e th
an s
uffic
ient
tim
e is
ava
ilabl
e fo
r de
velo
pmen
t, as
in n
on-s
easo
nal e
nviro
nmen
ts (
Sib
ly a
nd C
alow
, 19
86).
(b
) F
acto
rs e
nvis
aged
und
erly
ing
incr
ease
d si
ze f
or s
hort
dev
elop
men
t tim
es in
Brit
ish
butte
rflie
s. L
arge
siz
e an
d sl
ow d
evel
opm
ent
have
rep
ercu
ssio
ns f
or
cons
picu
ousn
ess
to e
nem
ies
and
lead
to
adap
tatio
ns f
or d
efen
ce a
nd f
aste
r gr
owth
with
env
isag
ed im
pact
on
annu
al r
ate
of in
crea
se (
r y),
incl
udin
g ef
fect
s vi
a ad
ult
size
, eg
g si
ze a
nd f
ecun
dity
. B
road
blu
e an
d gr
een
arro
ws,
bas
ic in
puts
fro
m a
biot
ic a
nd b
iotic
fac
tors
; br
oad
grey
arr
ows,
influ
ence
s on
adu
lts a
nd
popu
latio
n ch
ange
s. (
See
Den
nis
et a
l., 2
012b
.)
Supplementary 9
LS Lm
HPQL
LECD LAppar
LDTLRCR
LAD
LR
LAct
LMetab LSTI
Lexp
ry
ARI Afage
Lnutstr Af,ms
LGR
LIVpred
LVpred LBPA
LBFI
Lpara
HPQL
HPSpp
Talim
PH
PHΔ
R
LGS
Ld
++ +
+
+
++
+ +
+–/++
+
+
+
+
+
++
+
+
++
+
+
+
++
+ ++
+
+
+
+
+
+
–
–
–
– –
–
– –
––
–
–
––
Key:Adult (female) age Af
ageAdult (females, male) size Af,m
sAdult reproductive investment (male spermatophores andfemale fecundity and egg size) ARIAnnual rate of population increase ryHost plant quality HPQLHost plant quantity HPQNHost plant species HPsppLarval activity LACTLarval biomass gained LBGLarval conspicuousness LApparLarval approximate digestibility of food = (LIG-LFrass)/LIG*100) LAD
Larval behavioural adjustments for avoiding predators (nightfeeding, concealed feeding) LBPALarval behaviour to improve access to food quality intake LBFILarval density LdLarval efficiency of conversion of digested food LECD = (LBG/LIG-LFrass )*100Larval exposure to predators LexpLarval relative consumption rate (mgfood/mgbiomass/day;LIG.d
–1) LRCRLarval development time LDTLarval frass production LFrassLarval growth rate LGRLarval ingested food LIGLarval metabolism (assimilated food metabolised) LMetabLarval mortality LmLarval resources (nitrogen and water) LR
Larval size LSLarval susceptibility to infections LSTILarval nutritional stress LnutstrLarval parasitism LparaLarval predation (by invertebrates) LIVpred
Larval predation (by vertebrates) LvpredLength of growing season LGSPhotoperiod PH
Photoperiod changes (decreases, increases) PHΔ
Solar radiation RTemperature (ambient air, within finite limits) Talim
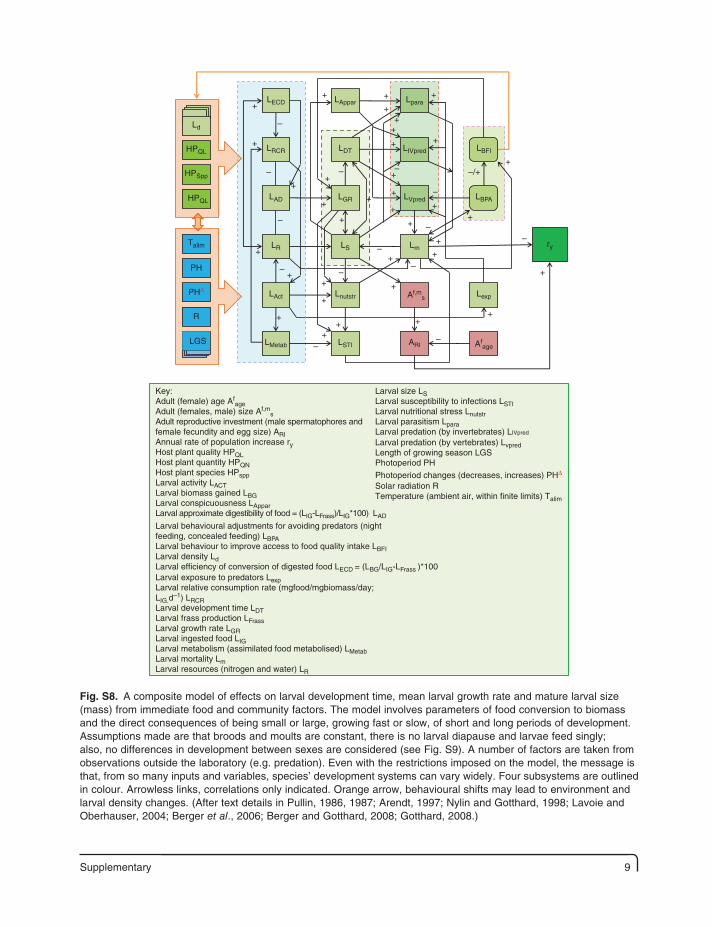
Fig. S8. A composite model of effects on larval development time, mean larval growth rate and mature larval size (mass) from immediate food and community factors. The model involves parameters of food conversion to biomass and the direct consequences of being small or large, growing fast or slow, of short and long periods of development. Assumptions made are that broods and moults are constant, there is no larval diapause and larvae feed singly; also, no differences in development between sexes are considered (see Fig. S9). A number of factors are taken from observations outside the laboratory (e.g. predation). Even with the restrictions imposed on the model, the message is that, from so many inputs and variables, species’ development systems can vary widely. Four subsystems are outlined in colour. Arrowless links, correlations only indicated. Orange arrow, behavioural shifts may lead to environment and larval density changes. (After text details in Pullin, 1986, 1987; Arendt, 1997; Nylin and Gotthard, 1998; Lavoie and Oberhauser, 2004; Berger et al., 2006; Berger and Gotthard, 2008; Gotthard, 2008.)
10 Supplementary
ry
LmGR
EN,ES
++
+
+
+ +
+
++/–
–(+)
+ +
+
++
+
+
+ +
+
+
+
––
–
– –
LmS
LmDT Am
S
AmMS
Ampmt
Aföprod
Adgens Aprot
Afpmt Am
MF
AfSσAf
MF
PmDT
GrowthBasic controls:(Seasonality,
Voltinism,Diapause)
&Basic cues:
(PhotoperiodTemperatureHost plants)
Key:Adult discrete generations AdgensAdult (female) mating frequency (polyandry) Af
MFAdult (female) oöcyte production/fertilisation Af
öprodAdult (female) size variation Af
SσAdult (male) mating frequency Am
MFAdult male mating success Am
MSAdult (female) pre-mating time Af
pmtAdult (male) pre-mating time Am
pmtAdult (male) protandry AprotAdult (male) size (reproductive resources) Am
SAnnual rate of increase ryEgg number and egg size (EN,ES)Larval (male) growth rate Lm
RLarval (male) development time Lm
DTLarval (male) size Lm
SPupal (male) development time Pm
DT
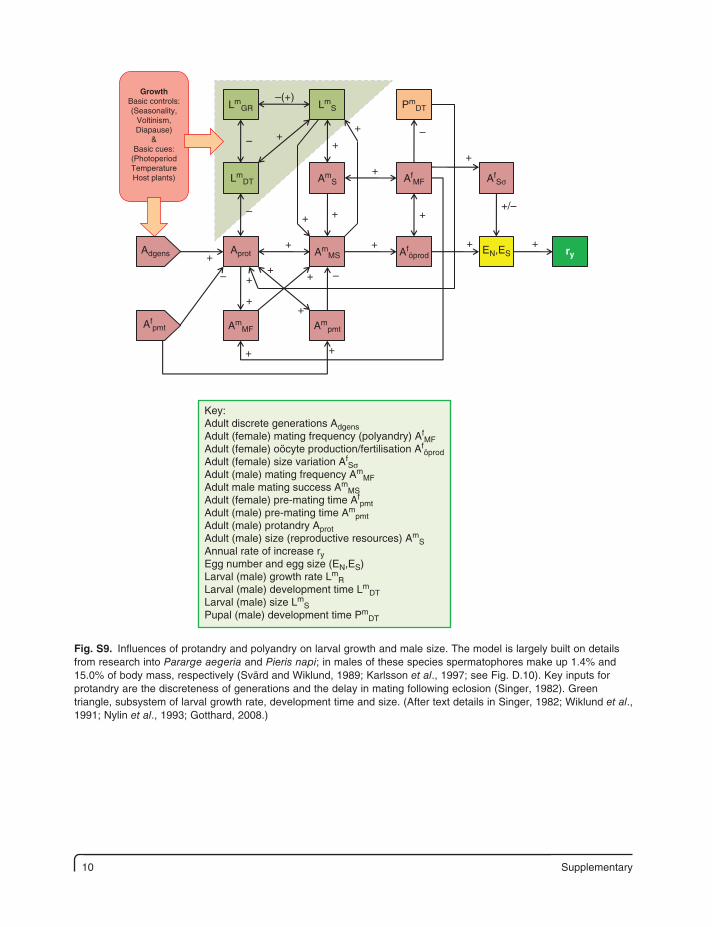
Fig. S9. Influences of protandry and polyandry on larval growth and male size. The model is largely built on details from research into Pararge aegeria and Pieris napi; in males of these species spermatophores make up 1.4% and 15.0% of body mass, respectively (Svärd and Wiklund, 1989; Karlsson et al., 1997; see Fig. D.10). Key inputs for protandry are the discreteness of generations and the delay in mating following eclosion (Singer, 1982). Green triangle, subsystem of larval growth rate, development time and size. (After text details in Singer, 1982; Wiklund et al., 1991; Nylin et al., 1993; Gotthard, 2008.)
Supplementary 11
EC
LH
abco
nd
HP
avai
lE
PS
DR
> B
R
I FR
pre-
empt
ive
I DV
c
–
–
––
–
–
–
–
–
–
–
+
+
+
+
++
++
++
++
+ ++
+
I Adp
rd
I DP
I Adf
r
I Ada
c
I Eu
I FR
L fee
d
I Mat
I MR
I RS
AN
E
S
(a)
S
(b)
I DV
c
I Adp
rd
AM
igr
DR
> B
R
I Adf
r
I Ada
c
–
–
–
–
–
––
+
+
+ +
++ +
+
+
++
++++
I Mat
AN
E
I Eu
I FR
I FR
pre-
empt
ive
L fee
dI M
R
I RS
Hab
cond
HP
avai
l
EC
L
EP
S
Key
:A
dult
mig
ratio
n A
mig
rA
dult
nect
ar fe
edin
g A
NE
Birt
h ra
te B
RD
eath
rat
e D
RE
nviro
nmen
tal c
ritic
al p
erio
d le
ngth
EC
LE
nviro
nmen
tal c
ritic
al p
erio
d se
verit
y E
PS
Hab
itat c
ondi
tions
Hab
cond
Hos
t pla
nt a
vaila
bilit
y H
P a
vail
Indi
vidu
al a
dapt
atio
ns to
abi
otic
con
ditio
ns I A
dac
Indi
vidu
al a
dapt
atio
ns to
mai
ntai
n fo
od r
eser
ves
I Adf
rIn
divi
dual
ada
ptat
ions
ver
sus
pred
atio
n I A
dprd
Indi
vidu
al c
ontin
uous
dev
elop
men
t ID
Vc
Indi
vidu
al d
iapa
use
I DP
Indi
vidu
al e
nerg
y us
e (c
f., w
ith c
ontin
uous
dev
elop
men
t) I E
uIn
divi
dual
food
res
erve
s (s
omat
ic m
aint
enan
ce)
I FR
Indi
vidu
al m
atin
g re
serv
es I M
RIn
divi
dual
mat
urat
ion
(beh
avio
ur, l
ife h
isto
ry a
nd m
orph
olog
y) I M
atIn
divi
dual
pre
-em
ptiv
e fo
od r
eser
ve b
uild
up
I FR
pre
-em
ptiv
eIn
divi
dual
rep
rodu
ctiv
e su
cces
s I R
SLa
rval
feed
ing
(her
bivo
ry)
L fee
d+
–
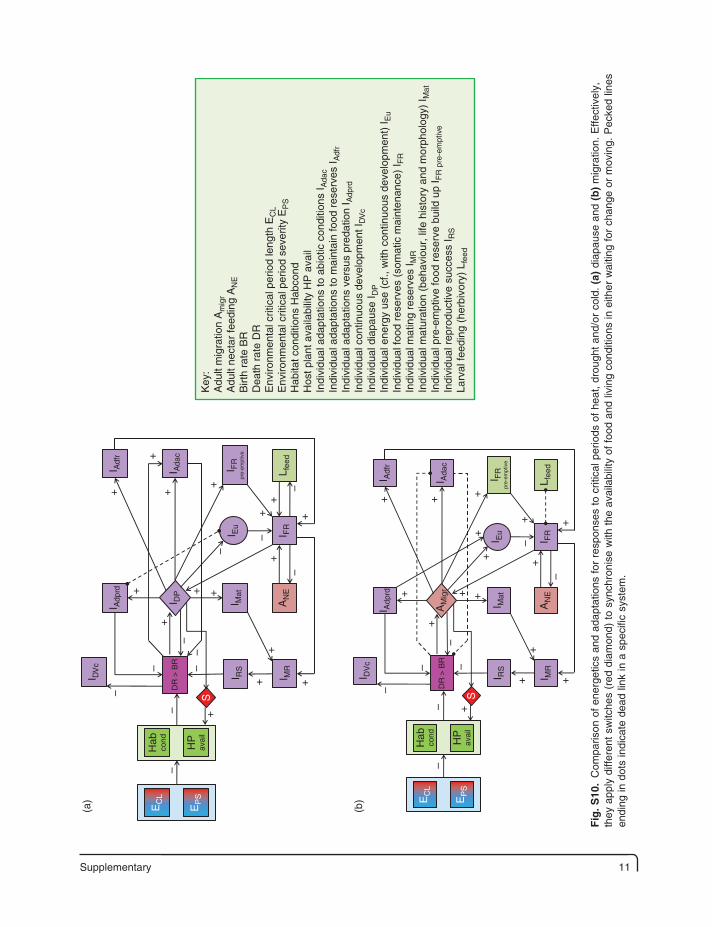
Fig
. S10
. C
ompa
rison
of
ener
getic
s an
d ad
apta
tions
for
res
pons
es t
o cr
itica
l per
iods
of
heat
, dr
ough
t an
d/or
col
d. (
a) d
iapa
use
and
(b)
mig
ratio
n. E
ffect
ivel
y,
they
app
ly d
iffer
ent
switc
hes
(red
dia
mon
d) t
o sy
nchr
onis
e w
ith t
he a
vaila
bilit
y of
foo
d an
d liv
ing
cond
ition
s in
eith
er w
aitin
g fo
r ch
ange
or
mov
ing.
Pec
ked
lines
en
ding
in d
ots
indi
cate
dea
d lin
k in
a s
peci
fic s
yste
m.
12 Supplementary
TaSummer
DIA
PA
US
E C
UE
S
PHSummer/autumn DPiii,p
Liii-ivfreezeavoid
Liii-ivDT
autumn
Lmautumn
frost
V r
Predsummer
+
+
+
+
++
+
+
+
+
+
+
–
–
––
–
––
–
–
– –
–
–
Atb forFAR
ADTtotal
AETspring
AfS Af
fec
Occasionalcontinuous
winterdevelopment
in mildclimates
TaAutumn/winter
Key:Adult body temperature ATbAdult emergence time (spring) AET springAdult (female) fecundity AfecAdult size (females) Af
SAmbient temperatures TaDiapausestage (3rd instar, pupal) DPiii,p
Flight activity range FARLarval development time (total instars) LDT totalLarval development time (3rd/4th instar) during autumn Liii-ivDTautumn
Larval freeze avoidance (cryoprotectants) Liii-ivfreeze avoid
Larval mortality (from autumn frost) Lm autumn frostPhotoperiod (photophase) PHPredation PredIntrinsic rate of increase rVoltinism (number of broods) V
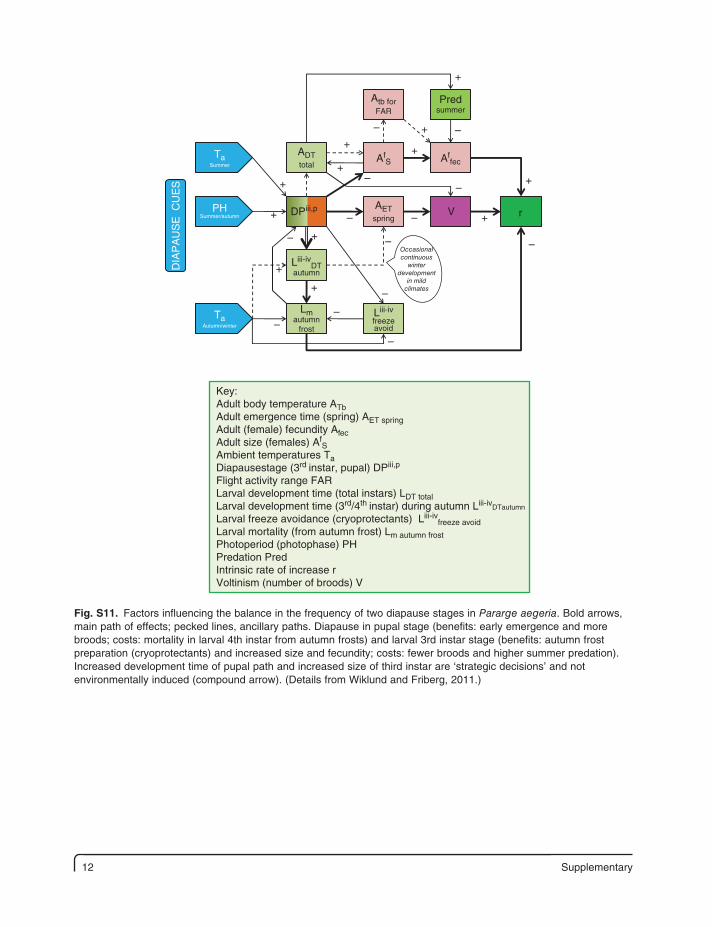
Fig. S11. Factors influencing the balance in the frequency of two diapause stages in Pararge aegeria. Bold arrows, main path of effects; pecked lines, ancillary paths. Diapause in pupal stage (benefits: early emergence and more broods; costs: mortality in larval 4th instar from autumn frosts) and larval 3rd instar stage (benefits: autumn frost preparation (cryoprotectants) and increased size and fecundity; costs: fewer broods and higher summer predation). Increased development time of pupal path and increased size of third instar are ‘strategic decisions’ and not environmentally induced (compound arrow). (Details from Wiklund and Friberg, 2011.)
Supplementary 13
Tree height Tree height
TaminTamax
0
10 15
0
(a)
Am Amating
Achemd Aage
Apredr Aretmig
AprotozAappar
AMSE
AlipidsAact
AgroundATFOTa
bmin
Tabll50
(freeze)
Tabmax
Wab
Apred
ACrawlTAdrink
Amasses
ANELdLfeed
ATTD
AWE
Affec
–
–
–
–
–
––
–
––
–
–
–
–
– +
+
–
–
–
–
–
–
–
–
+
++
+
+
++
+
+
++
+
+
+ +
+
+
+
+ +
+
+
+
+
+
+
+
+
+
+
+
+
+
+
+
+
+
+
MigD
r
Af:m
Ta
WETsur
(b)
ABIOTICINPUTS
me
mc
Predsp
AVTMD
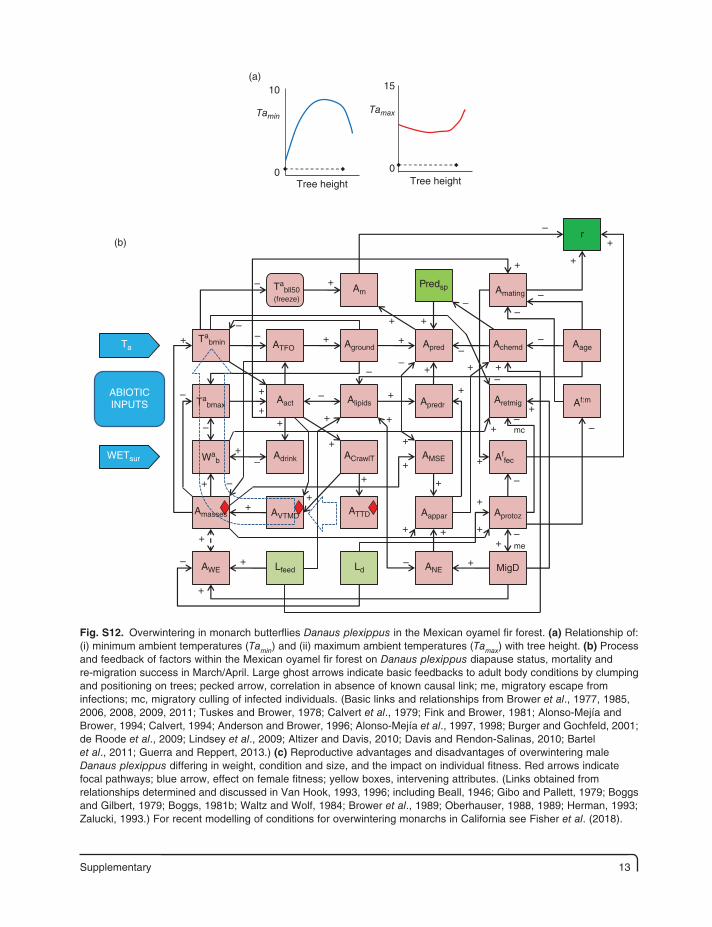
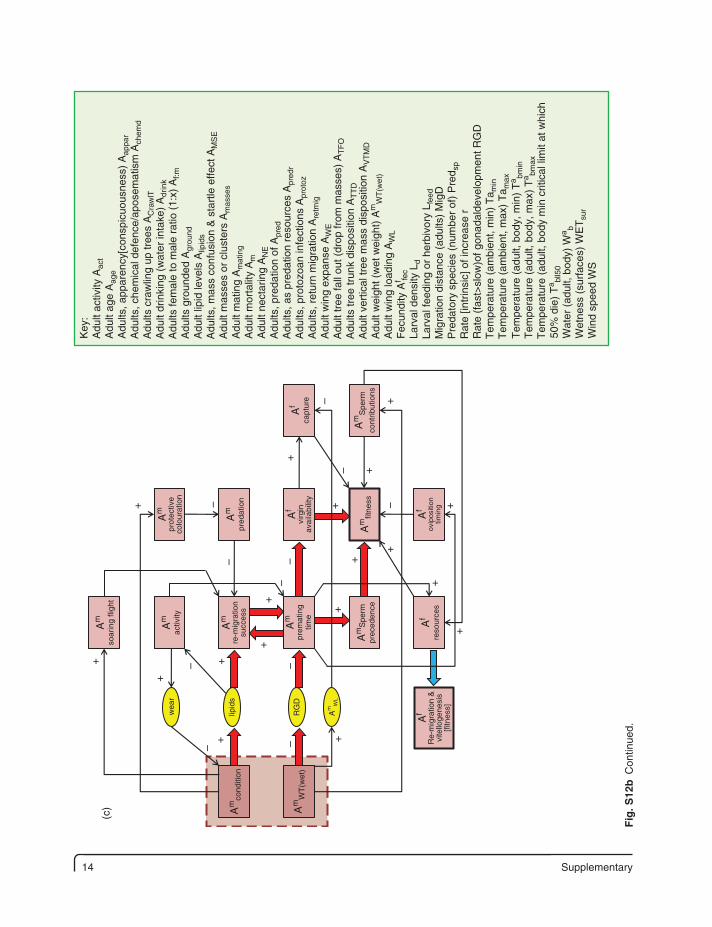
Fig. S12. Overwintering in monarch butterflies Danaus plexippus in the Mexican oyamel fir forest. (a) Relationship of: (i) minimum ambient temperatures (Tamin) and (ii) maximum ambient temperatures (Tamax) with tree height. (b) Process and feedback of factors within the Mexican oyamel fir forest on Danaus plexippus diapause status, mortality and re-migration success in March/April. Large ghost arrows indicate basic feedbacks to adult body conditions by clumping and positioning on trees; pecked arrow, correlation in absence of known causal link; me, migratory escape from infections; mc, migratory culling of infected individuals. (Basic links and relationships from Brower et al., 1977, 1985, 2006, 2008, 2009, 2011; Tuskes and Brower, 1978; Calvert et al., 1979; Fink and Brower, 1981; Alonso-Mejía and Brower, 1994; Calvert, 1994; Anderson and Brower, 1996; Alonso-Mejía et al., 1997, 1998; Burger and Gochfeld, 2001; de Roode et al., 2009; Lindsey et al., 2009; Altizer and Davis, 2010; Davis and Rendon-Salinas, 2010; Bartel et al., 2011; Guerra and Reppert, 2013.) (c) Reproductive advantages and disadvantages of overwintering male Danaus plexippus differing in weight, condition and size, and the impact on individual fitness. Red arrows indicate focal pathways; blue arrow, effect on female fitness; yellow boxes, intervening attributes. (Links obtained from relationships determined and discussed in Van Hook, 1993, 1996; including Beall, 1946; Gibo and Pallett, 1979; Boggs and Gilbert, 1979; Boggs, 1981b; Waltz and Wolf, 1984; Brower et al., 1989; Oberhauser, 1988, 1989; Herman, 1993; Zalucki, 1993.) For recent modelling of conditions for overwintering monarchs in California see Fisher et al. (2018).
14 Supplementary
Am
soar
ing
fligh
t
+
+
+
+
+
+
+
+
+
+
++
+
+
+
+
+
+
–
––
–
–
–
––
–
––
Am
prot
ectiv
eco
lour
atio
n
Am
activ
ity
Am
pred
atio
n
Af
virg
inav
aila
bilit
y
Af
capt
ure
Am
prem
atin
gtim
e
Am
Spe
rmpr
eced
ence
Am
WL
Am
Spe
rmco
ntrib
utio
nsA
mfit
ness
Af
ovip
ositi
ontim
ing
Af
reso
urce
s
Af
Re-
mig
ratio
n &
vite
lloge
nesi
s[fi
tnes
s]
Am
cond
ition
Am
WT
(wet
)
Am
re-m
igra
tion
succ
ess
lipid
s
RG
D
wea
r
(c)
Key
:A
dult
activ
ity A
act
Adu
lt ag
e A
age
Adu
lts, a
ppar
ency
[con
spic
uous
ness
) A
appa
rA
dults
, che
mic
al d
efen
ce/a
pose
mat
ism
Ach
emd
Adu
lts c
raw
ling
up tr
ees
AC
raw
lTA
dult
drin
king
(w
ater
inta
ke)
Adr
ink
Adu
lts fe
mal
e to
mal
e ra
tio (
1:x)
Af:m
Adu
lts g
roun
ded
Agr
ound
Adu
lt lip
id le
vels
Alip
ids
Adu
lts, m
ass
conf
usio
n &
sta
rtle
effe
ct A
MS
EA
dult
mas
ses
or c
lust
ers
Am
asse
sA
dult
mat
ing
Am
atin
gA
dult
mor
talit
y A
mA
dult
nect
arin
g A
NE
Adu
lts, p
reda
tion
of A
pred
Adu
lts, a
s pr
edat
ion
reso
urce
s A
pred
rA
dults
, pro
tozo
an in
fect
ions
Apr
otoz
Adu
lts, r
etur
n m
igra
tion
Are
tmig
Adu
lt w
ing
expa
nse
AW
EA
dult
tree
fall
out (
drop
from
mas
ses)
AT
FO
Adu
lts tr
ee tr
unk
disp
ositi
on A
TT
DA
dult
vert
ical
tree
mas
s di
spos
ition
AV
TM
DA
dult
wei
ght (
wet
wei
ght)
Am
WT
(wet
)A
dult
win
g lo
adin
g A
WL
Fec
undi
ty A
f fec
Larv
al d
ensi
ty L
dLa
rval
feed
ing
or h
erbi
vory
Lfe
edM
igra
tion
dist
ance
(ad
ults
) M
igD
Pre
dato
ry s
peci
es (
num
ber
of)
Pre
d sp
Rat
e [in
trin
sic]
of i
ncre
ase
rR
ate
(fas
t>sl
ow)o
f gon
adal
deve
lopm
ent R
GD
Tem
pera
ture
(am
bien
t, m
in)
Ta m
inT
empe
ratu
re (
ambi
ent,
max
) T
a max
Tem
pera
ture
(ad
ult,
body
, min
) T
a bmin
Tem
pera
ture
(ad
ult,
body
, max
) T
a bmax
Tem
pera
ture
(ad
ult,
body
min
crit
ical
lim
it at
whi
ch50
% d
ie)
Ta bl
l50
Wat
er (
adul
t, bo
dy)
Wa b
Wet
ness
(su
rfac
es)
WE
Tsu
rW
ind
spee
d W
S
Fig
. S12
b C
ontin
ued.
Supplementary 15
r
Abioticfactors
Weather
Climate
Bioticfactors
Host
plants:
size
density
isolation
chemistry
physical
defences
Lobsc
Lchdef
LGreg
Lth
TIb
WIb
Lapos
Lpalat Lpred
Ld
Lweb LPDE
LDTLcompet
LImdefLinfect
Lfeedef
Ldesic–
–
–
–
–
––
–
–
–
–
–
–
+
+
++
+ +
+++
+
++ +
+
+
++
+
+
+
++
++
–
––
–
–
–
––
–
++
+
+
++
+
+
+
+
++
+
+
+
+
+
++
++
++
+++++
+
+
+
+++
+
+
+
+
+/–
+/–
+/–
+/–
+
+Lfortrl
LnHPs
LGR
LR
LS Afecr
Lpara
Lappar Lpbdef
LmltdefLm
Lexp
TCnspPALHPpal
Key:
Adult (female) fecundity (realised) AfecrAdult weight AWTBody temperature (larvae) Tl
bBody water (larvae) Wl
bHost plant palatability HPpalIndividual autotoxicity costs IautoxIndividual mortality ImIndividual size ISIntrinsic (population) rate of increase rLarval aggregation and gregariousness LGregLarval aposematism LaposLarval chemical defence LchdefLarval competition (intra group) LcompetLarval concealment (hidden from view) LobscLarval conspicuousness LapparLarval density LdLarval desiccation LdesicLarval development time LDTLarval exposure (to enemies) LexpLarval feeding efficiency LfeedefLarval foraging trails (distances travelled) LfortrlLarval growth rate LGR
Larval infections (diseases) LinfectLarval immune defences LimdefLarval mortality LmLarval multiple defence arsenal LmltdefLarval novel food supply (new host plant source) LnHPsLarval palatability LpalatLarval parasitism LparaLarval physical and behavioural defences LpbdefLarval predation LpredLarval predator dilution effect LPDE
Larval resources LRLarval size LSLarval thermoregulation behaviour LthLarval web formation LwebPredator avoidance learning PALTrophic community (additional predator species) TCnsp
Iautox
+
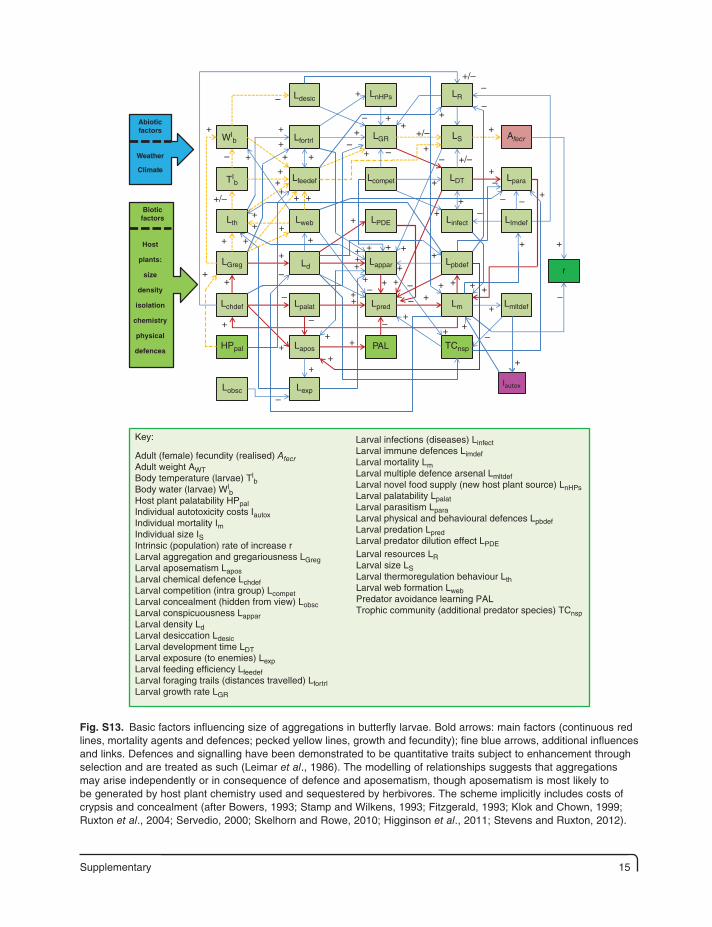
Fig. S13. Basic factors influencing size of aggregations in butterfly larvae. Bold arrows: main factors (continuous red lines, mortality agents and defences; pecked yellow lines, growth and fecundity); fine blue arrows, additional influences and links. Defences and signalling have been demonstrated to be quantitative traits subject to enhancement through selection and are treated as such (Leimar et al., 1986). The modelling of relationships suggests that aggregations may arise independently or in consequence of defence and aposematism, though aposematism is most likely to be generated by host plant chemistry used and sequestered by herbivores. The scheme implicitly includes costs of crypsis and concealment (after Bowers, 1993; Stamp and Wilkens, 1993; Fitzgerald, 1993; Klok and Chown, 1999; Ruxton et al., 2004; Servedio, 2000; Skelhorn and Rowe, 2010; Higginson et al., 2011; Stevens and Ruxton, 2012).
16 Supplementary
Impred/para
Ifpred/para
Am waittime
Am territoryholdingcapacity
Am materesources
Am
eclosiontime
Af
eclosiontime
Am matesuccess
Afec
Am intra-sexcompetitionAmn
Amprot
Afn
Ams
Afs
Am postemergence
mortality
Af pre-reproductive
period
Af
potentialmates
Af matesolicitation
Af polygamy
Af materesources
Af lifespan
Af matesuccess
Af %virgins
Vacantterritories
Abiotic&
Biotic Factors
(a)
+
+
+
+ +
+
+
+
++
+
+
+
+
+ +
++
+
++
+
+
+
+
+
+
+
+
++
+
+ –
–
–
–
–
–
+
+
–
––
–
––
–
–
–– –
–++
+–
+
Am lifespan
LmGR I
mDT
LfGR I
fDT
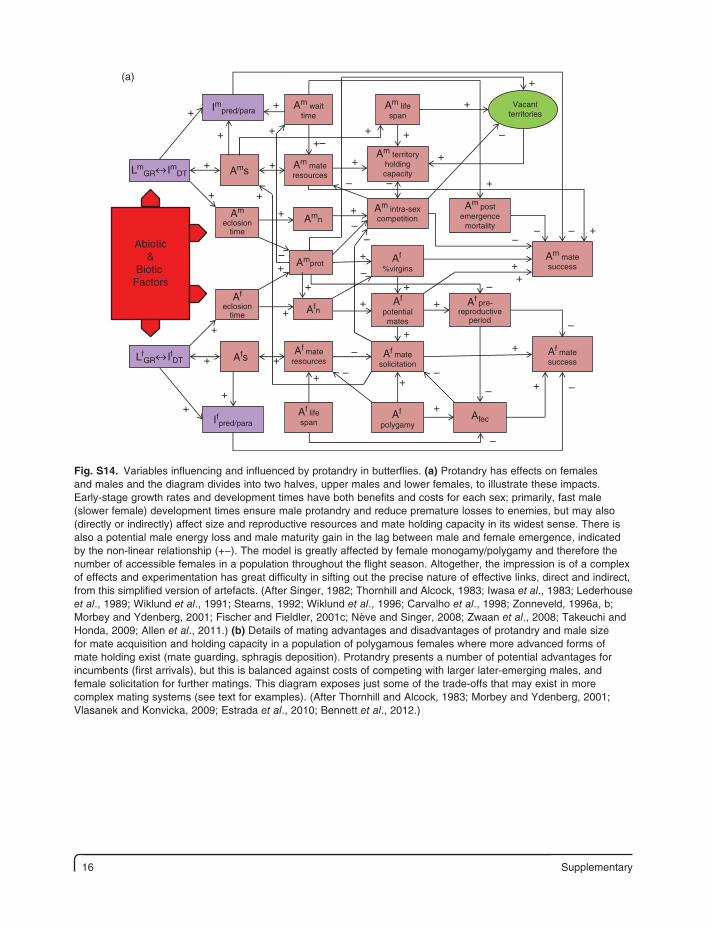
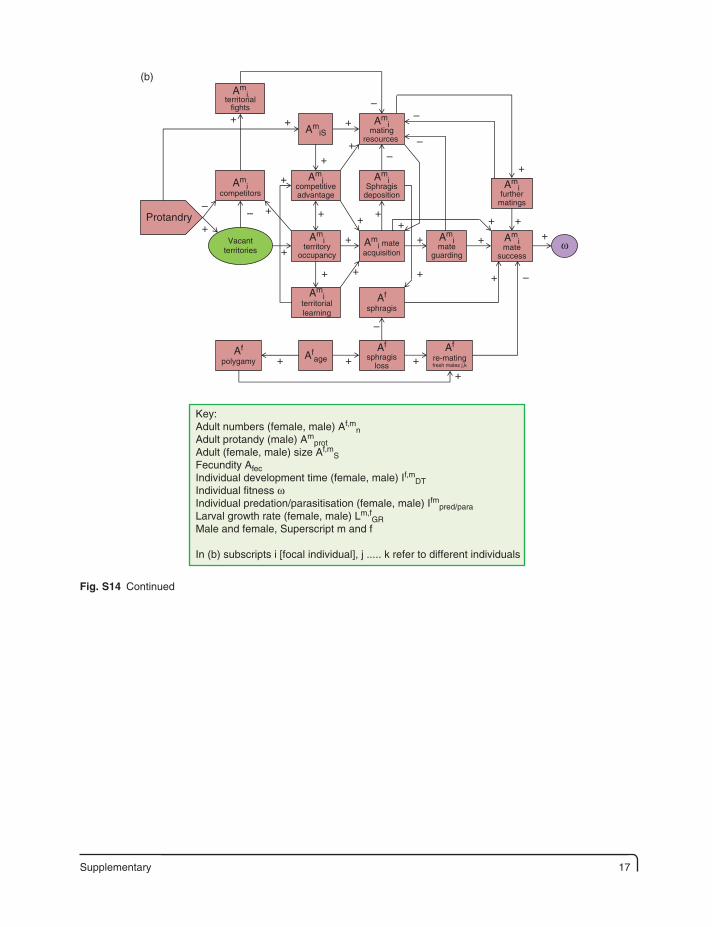
Fig. S14. Variables influencing and influenced by protandry in butterflies. (a) Protandry has effects on females and males and the diagram divides into two halves, upper males and lower females, to illustrate these impacts. Early-stage growth rates and development times have both benefits and costs for each sex; primarily, fast male (slower female) development times ensure male protandry and reduce premature losses to enemies, but may also (directly or indirectly) affect size and reproductive resources and mate holding capacity in its widest sense. There is also a potential male energy loss and male maturity gain in the lag between male and female emergence, indicated by the non-linear relationship (+−). The model is greatly affected by female monogamy/polygamy and therefore the number of accessible females in a population throughout the flight season. Altogether, the impression is of a complex of effects and experimentation has great difficulty in sifting out the precise nature of effective links, direct and indirect, from this simplified version of artefacts. (After Singer, 1982; Thornhill and Alcock, 1983; Iwasa et al., 1983; Lederhouse et al., 1989; Wiklund et al., 1991; Stearns, 1992; Wiklund et al., 1996; Carvalho et al., 1998; Zonneveld, 1996a, b; Morbey and Ydenberg, 2001; Fischer and Fieldler, 2001c; Nève and Singer, 2008; Zwaan et al., 2008; Takeuchi and Honda, 2009; Allen et al., 2011.) (b) Details of mating advantages and disadvantages of protandry and male size for mate acquisition and holding capacity in a population of polygamous females where more advanced forms of mate holding exist (mate guarding, sphragis deposition). Protandry presents a number of potential advantages for incumbents (first arrivals), but this is balanced against costs of competing with larger later-emerging males, and female solicitation for further matings. This diagram exposes just some of the trade-offs that may exist in more complex mating systems (see text for examples). (After Thornhill and Alcock, 1983; Morbey and Ydenberg, 2001; Vlasanek and Konvicka, 2009; Estrada et al., 2010; Bennett et al., 2012.)
Supplementary 17
Protandry
Vacantterritories
Ami
territorialfights
Ami
territoriallearning
Af
sphragis
Af
polygamy
Af
sphragisloss
Af
re-matingfresh males j,k
Afage
Ami
territoryoccupancy
Ami
matingresources
Ami
Sphragisdeposition
Ami
competitiveadvantage
Ami
competitorsAm
ifurther
matings
Ami
matesuccess
Ami
mateguarding
Ami mate
acquisition
+
(b)
ω
AmiS
+ +
+
++
+
+ +
+
+
+
+
+ + ++
+ +
++
+
+
+ ++
++
––
––
–
–
––
Key:Adult numbers (female, male) Af,m
nAdult protandy (male) Am
protAdult (female, male) size Af,m
SFecundity AfecIndividual development time (female, male) If,mDTIndividual fitness ωIndividual predation/parasitisation (female, male) Ifmpred/paraLarval growth rate (female, male) Lm,f
GRMale and female, Superscript m and f
In (b) subscripts i [focal individual], j ..... k refer to different individuals
Fig. S14 Continued
18 Supplementary
Af
matestat
Af
aspermstored
Af
ageAf
totmatetime
Amage
Af
mateevents
Af
matesolic
Am
spermtrans
Am
mateevents
Am
sphragtrans
Am
coptime
Am
antiaphrod
Am
capsule
Af
eggresorb
Am
competAf
harinj
Am
ejacmass
AmS
AfTR Af
LS
AfEWTAf
S
Afspermreplen
Afpredrisk
Affec
Keyfeedback
Afrefractperiod
Af
fertAf
signaAfNE
AfEL
?
?
?
Key:Adult (male, female) age Am,f
ageAdult (male) anti-aphrodisiacs transferred Am
anti aphrodAdult (female) apyrene sperm stored in bursa Af
asperm storedAdult (male) capsule (thick spematophore epidermis) production Am
capsuleAdult (male) competition for mates Am
competAdult (male) copulation time Am
cop timeAdult (female) eggs laid (total) Af
ELAdult (female) egg resorbance Af
egg resorbAdult (female) egg weight (mean) Af
EWTAdult male ejaculate mass (spermatophore size) Am
ejac massAdult (female) fecundity Af
fecAdult (female) fertility Af
fertAdult (female) harassment and injury Af
harinjAdult (female) lifespan Af
LSAdult mate events (male polygyny; female polyandry) Am,f
mate eventsAdult (female) mate solicitation Af
mate solicAdult (female) mating status (with: male virgins < non-virgin males) Af
mate statAdult (female) nectar feeding Af
NEAdult (female) predation risk Af
pred riskAdult (female) refractory period Af
refract periodAdult (female) resources (total, thorax, abdomen) AfTR
Adult (female) signa development Afsigna
Adult (female, male) size Af,mS
Adult (female) sperm replenishment Afsperm replen
Adult (male) sperm transferred (amount pyrene and eupyrene) Amsperm trans
Adult (male) sphragis transfer Amsphrag trans
Adult (female) total mating time Aftotmate time
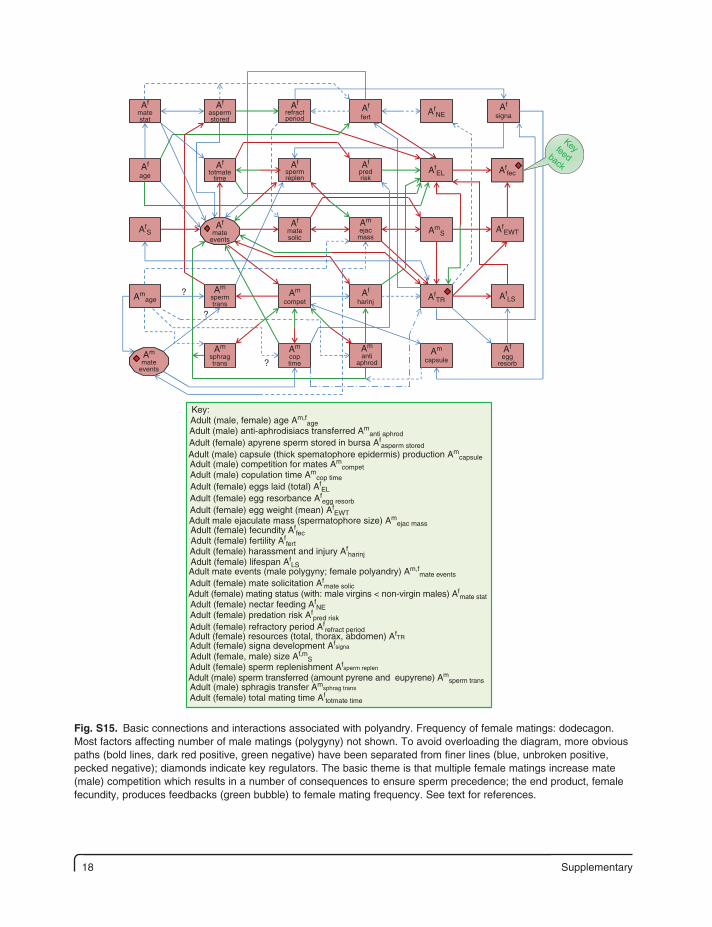
Fig. S15. Basic connections and interactions associated with polyandry. Frequency of female matings: dodecagon. Most factors affecting number of male matings (polygyny) not shown. To avoid overloading the diagram, more obvious paths (bold lines, dark red positive, green negative) have been separated from finer lines (blue, unbroken positive, pecked negative); diamonds indicate key regulators. The basic theme is that multiple female matings increase mate (male) competition which results in a number of consequences to ensure sperm precedence; the end product, female fecundity, produces feedbacks (green bubble) to female mating frequency. See text for references.
Supplementary 19
Am,fBd
Am,fact
Am,fNE
Am,fWT Amf
FLP Amfpred
Amf
Apredrisk
Amf
Gpredrisk
Amf
Cop durAmf
Ntincop
AmMGT AmMF AmLS
Amf
disturbAmf
predvigil
Amf
RsuccessAf
Eggshortfall
Af
OviptimeAm→f
nuptgifts
Affec
MATINGIMPACT
PREDATORIMPACT
Amf
appar
AmfFMR
Amf
TaFthresAm,f
Eexpend
Amf
MassBal
Amf
in cop
Amf
hidingAmf
harass
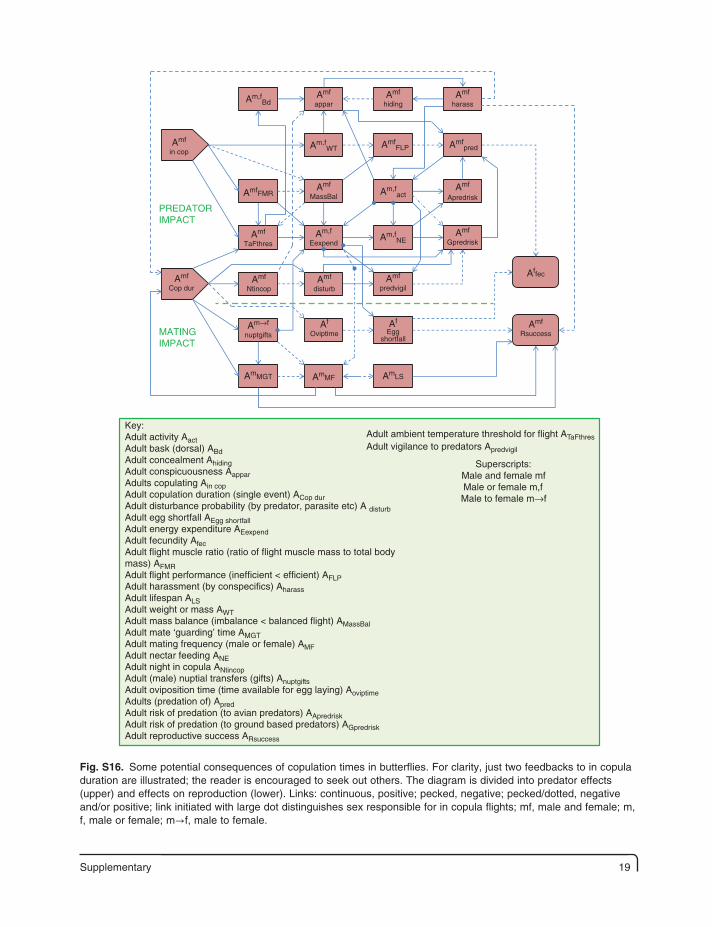
Key:Adult activity AactAdult bask (dorsal) ABdAdult concealment AhidingAdult conspicuousness AapparAdults copulating Ain copAdult copulation duration (single event) ACop durAdult disturbance probability (by predator, parasite etc) A disturbAdult egg shortfall AEgg shortfallAdult energy expenditure AEexpendAdult fecundity AfecAdult flight muscle ratio (ratio of flight muscle mass to total bodymass) AFMRAdult flight performance (inefficient < efficient) AFLPAdult harassment (by conspecifics) AharassAdult lifespan ALSAdult weight or mass AWTAdult mass balance (imbalance < balanced flight) AMassBalAdult mate ‘guarding’ time AMGTAdult mating frequency (male or female) AMFAdult nectar feeding ANEAdult night in copula ANtincopAdult (male) nuptial transfers (gifts) AnuptgiftsAdult oviposition time (time available for egg laying) AoviptimeAdults (predation of) ApredAdult risk of predation (to avian predators) AApredriskAdult risk of predation (to ground based predators) AGpredriskAdult reproductive success ARsuccess
Adult ambient temperature threshold for flight ATaFthresAdult vigilance to predators Apredvigil
Superscripts:Male and female mfMale or female m,fMale to female m→f
Fig. S16. Some potential consequences of copulation times in butterflies. For clarity, just two feedbacks to in copula duration are illustrated; the reader is encouraged to seek out others. The diagram is divided into predator effects (upper) and effects on reproduction (lower). Links: continuous, positive; pecked, negative; pecked/dotted, negative and/or positive; link initiated with large dot distinguishes sex responsible for in copula flights; mf, male and female; m, f, male or female; m→f, male to female.
20 Supplementary
Adult breedingsystem
(semelparity)
Af ovigenyindex
Ambienttemperature
Adult populationstructure(open)
Adult life historyexaptations
Adult size(mass, wing
expanse)
Abiotic influences(season, altitude,
latitude)
Am per copinvestment
Amf
copulationfrequency
Amf totalcopulation
time
Amf
copulationduration
Amf hiding
Amf crypsis
Amf
reproductivelifespan
Amf lateralbaskers
Amf
populationdensity
Amf
migration
Amf
predation
Amf
overnightmating
Amf diel(pm) mating
time
Amf Tbthreshold for
flight
Amf
hibernation
Amf mateopportunity
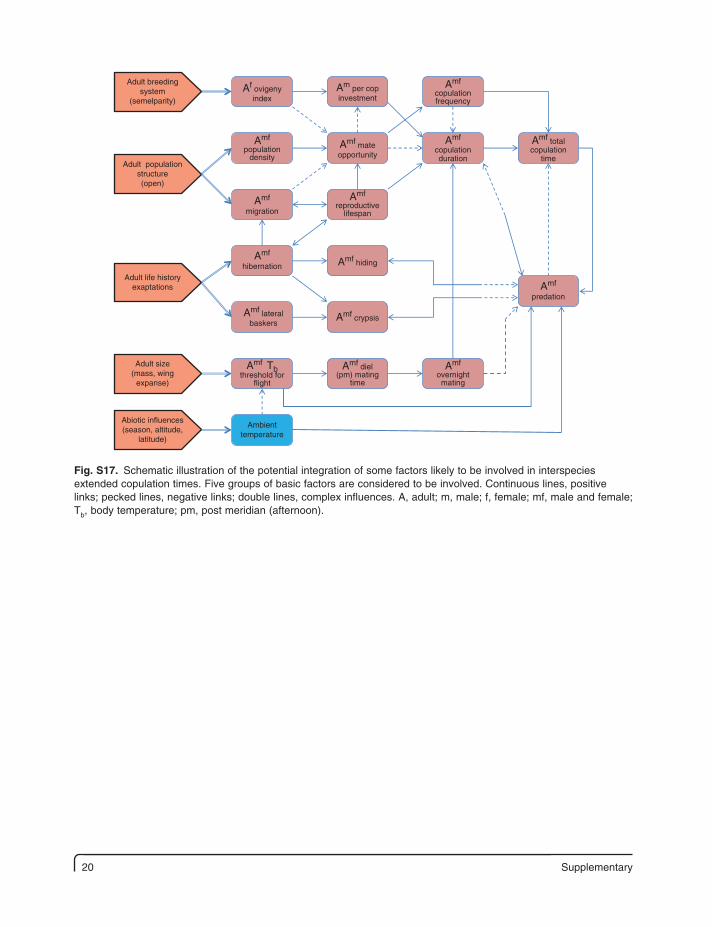
Fig. S17. Schematic illustration of the potential integration of some factors likely to be involved in interspecies extended copulation times. Five groups of basic factors are considered to be involved. Continuous lines, positive links; pecked lines, negative links; double lines, complex influences. A, adult; m, male; f, female; mf, male and female; Tb, body temperature; pm, post meridian (afternoon).
Supplementary 21
Af
polyandry
Af
hostseek
AApred risk
Af
Oviposn
AfOI
(capital > Incomebreeders)
Af
Eexpend
AFMR/AFLP
AfSI:RI
Afrest
AfWT Af
mobilityAf
Eshortfall
Af
semelp
ALS
ANE Apred ARsuccess
Lm
Ld
LWLGRLDT
LdefencesLparaLpred
HPQL
HPQN
HPpredictability
HPavailability
HPspecialism
HPconsumption
Key:Adult egg laying events AoviposnAdult egg shortfall AEshortfallAdult energy expenditure AEexpendAdult flight muscle ratio (ratio of flight muscle mass to total body mass) AFMRAdult flight performance (inefficient < efficient) AFLPAdult lifespan ALSAdult mobility AmobAdult weight or mass AWTAdult nectar feeding ANEAdult ovigeny Index AOIAdults (predation of) ApredAdult risk of predation (to avian predators) AApred riskAdult reproductive success ARsuccessAdult rest (stationary either feeding, resting, inert) ArestAdult searching for resources Ahost seekAdult soma investment relative to reproductive investment ASI:RIHost plant quality HPQLHost plant quantity/abundance HPQNLarval defences (spines, aposematism, threat etc) LdefencesLarval development time LDTLarval density LdLarval growth rate LGRLarval mass (weight) LWLarval mortality LmLarval parasitism and predation Lpred/LparaSemelparity Asemelp
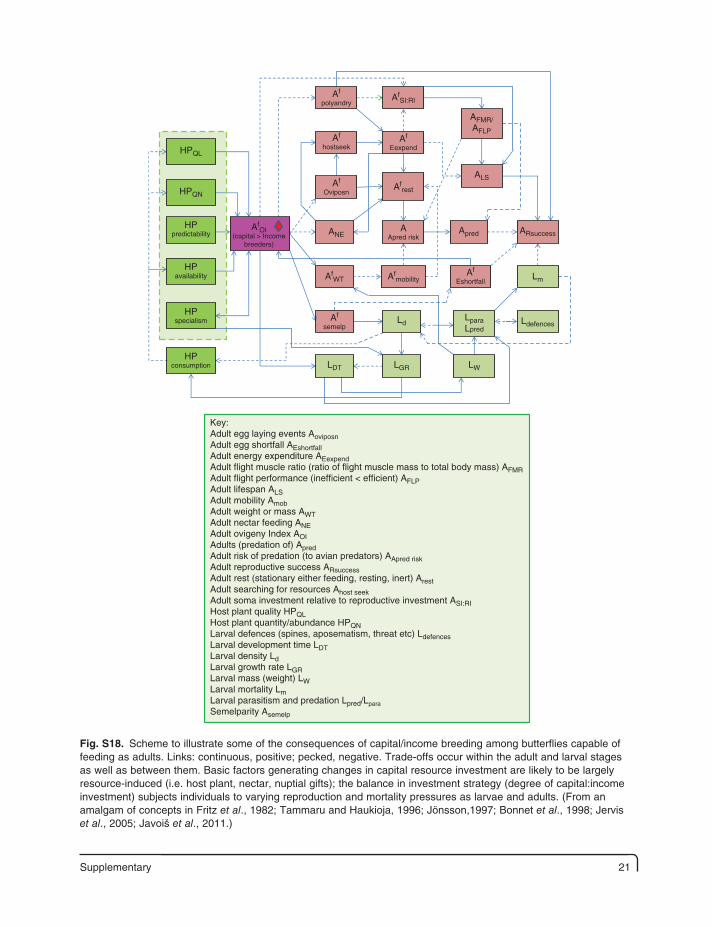
Fig. S18. Scheme to illustrate some of the consequences of capital/income breeding among butterflies capable of feeding as adults. Links: continuous, positive; pecked, negative. Trade-offs occur within the adult and larval stages as well as between them. Basic factors generating changes in capital resource investment are likely to be largely resource-induced (i.e. host plant, nectar, nuptial gifts); the balance in investment strategy (degree of capital:income investment) subjects individuals to varying reproduction and mortality pressures as larvae and adults. (From an amalgam of concepts in Fritz et al., 1982; Tammaru and Haukioja, 1996; Jönsson,1997; Bonnet et al., 1998; Jervis et al., 2005; Javoiš et al., 2011.)
22 Supplementary
Individualresources
(energy, mass)
Individualmetabolic
costs
Individualreproductive
success
Unpalatability Aposematism
Apparency(cryptic <
conspicuous)Predation Abundance
Predatornaivety
Predatorhunger
Predatorabundance
Prey diversityPrey speciesabundance
Predatordiversity
Herbivory
Habitatcontext
Habitatchanges(predator-preyassociations)
Species range
changes
SS
S
S
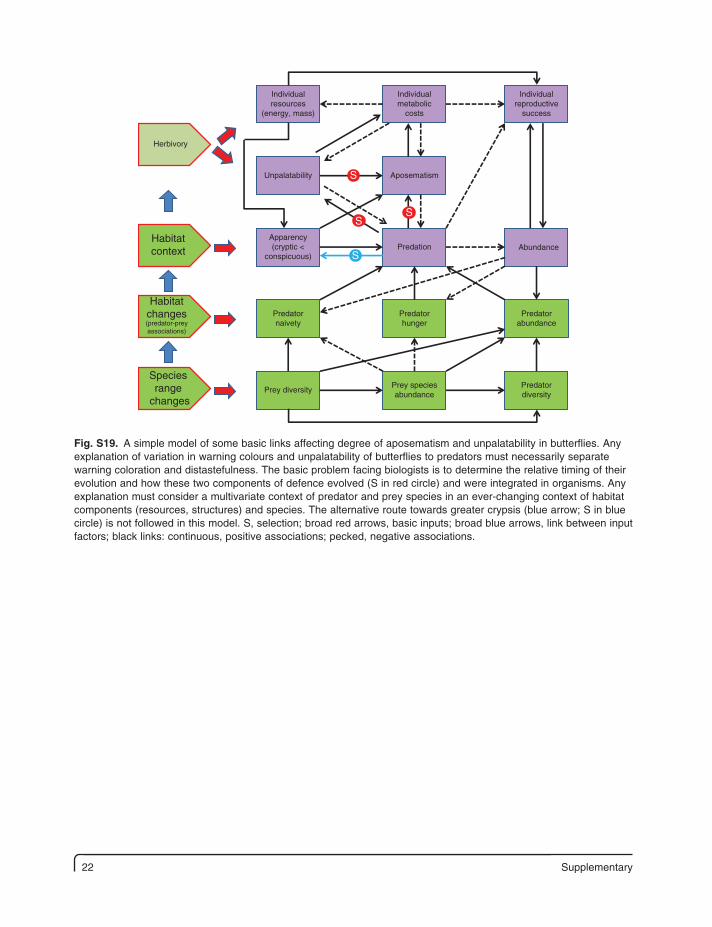
Fig. S19. A simple model of some basic links affecting degree of aposematism and unpalatability in butterflies. Any explanation of variation in warning colours and unpalatability of butterflies to predators must necessarily separate warning coloration and distastefulness. The basic problem facing biologists is to determine the relative timing of their evolution and how these two components of defence evolved (S in red circle) and were integrated in organisms. Any explanation must consider a multivariate context of predator and prey species in an ever-changing context of habitat components (resources, structures) and species. The alternative route towards greater crypsis (blue arrow; S in blue circle) is not followed in this model. S, selection; broad red arrows, basic inputs; broad blue arrows, link between input factors; black links: continuous, positive associations; pecked, negative associations.
Supplementary 23
ΔNb ωb
ωb
ωaΔNa
PCSb
Predsat
PCSa
%Abpred
Aaapos
Ab→a
min
↓
↑
HABITAT
BIOTOPE
Resources
–
+
+apostasis
+
+
+
+
+
++
+
–
–
–
–
–
–
–
– –
–
–
Life history pressures
‘Far community’
‘Nearcommunity’
(closely related taxato model & mimic)
divergence
convergence
Nb/Na
Nb/Na
(a)
%Predationof mimics
%Aapred
PCSa PCSmistakes
Predprey
discrim
Predvisibility,
psychology
Predsat
MimicGuild
(n spp)
Aa
predatorrejection
Aa
toxicity
Abpred
Ab
mimicaccuracy
Ab
predatorrejection
Ab
mimicvariation
BIOTOPECOMMUNITY
BIOTOPECONDITIONS
Predators
Alternative prey(food supply,their toxicity)
Habitat and
resources
(b)
Mimicry (accuracy)
Pre
dato
r (r
elat
ive
resp
onse
)
1
0
ΔNa
ΔNb
1
–
–
–
–
–
–
–
+
+
+++
+
+
+
+ + +
+
+
+
+ +
Open/closed
vegetation(light
environment)
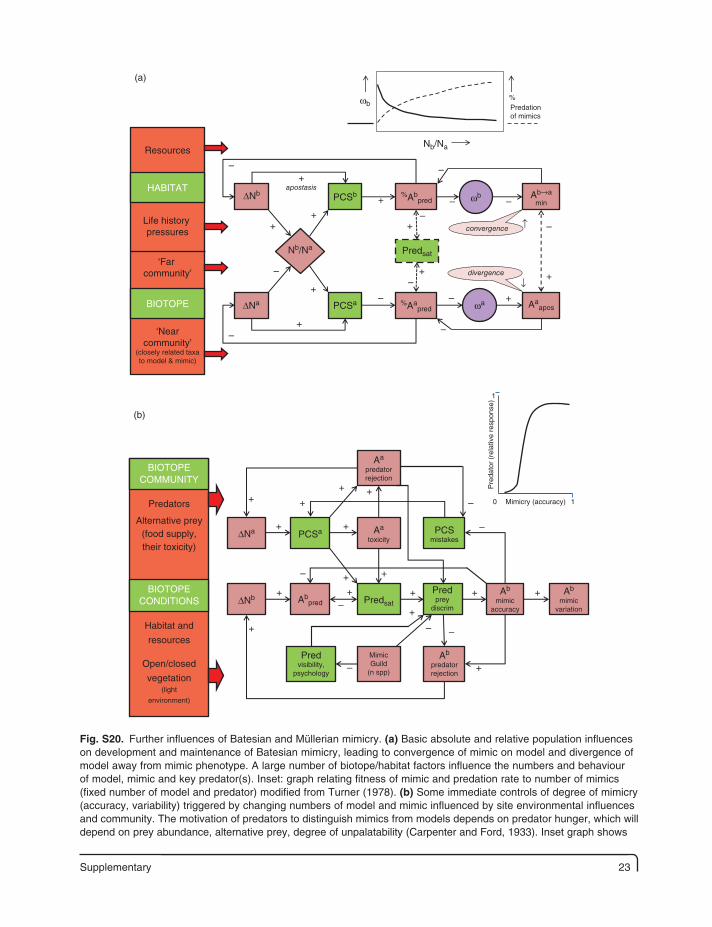
Fig. S20. Further influences of Batesian and Müllerian mimicry. (a) Basic absolute and relative population influences on development and maintenance of Batesian mimicry, leading to convergence of mimic on model and divergence of model away from mimic phenotype. A large number of biotope/habitat factors influence the numbers and behaviour of model, mimic and key predator(s). Inset: graph relating fitness of mimic and predation rate to number of mimics (fixed number of model and predator) modified from Turner (1978). (b) Some immediate controls of degree of mimicry (accuracy, variability) triggered by changing numbers of model and mimic influenced by site environmental influences and community. The motivation of predators to distinguish mimics from models depends on predator hunger, which will depend on prey abundance, alternative prey, degree of unpalatability (Carpenter and Ford, 1933). Inset graph shows
24 Supplementary
SEGREGATIONASSORTMENT
PCSb
(c)
apostasis
Abm
phys lifespan(mim<non-m)
Abf
phys lifespan(mim<non-m)
Abf
reproductivesuccess
Ab
habitat lightenviront(f < m)
Ab
Size (WE)(m < f)
Acapture
vulnerability(m < f)
Nbm
mim phenAbm
mim phen
Abm
non-mim phen
Ab
activity(f < m)
Nbf
mim phenPredf
mim phen
Predm
mim phen
PSI(non-m<mim)
Aconspic advr(non-m<mim)
Abm
mate success
Nb/Na
ΔNa
–
–
–
–
–
–
–
+
+
+
+
+
+
+
+
+
++
+
++
+
+ +
+
+
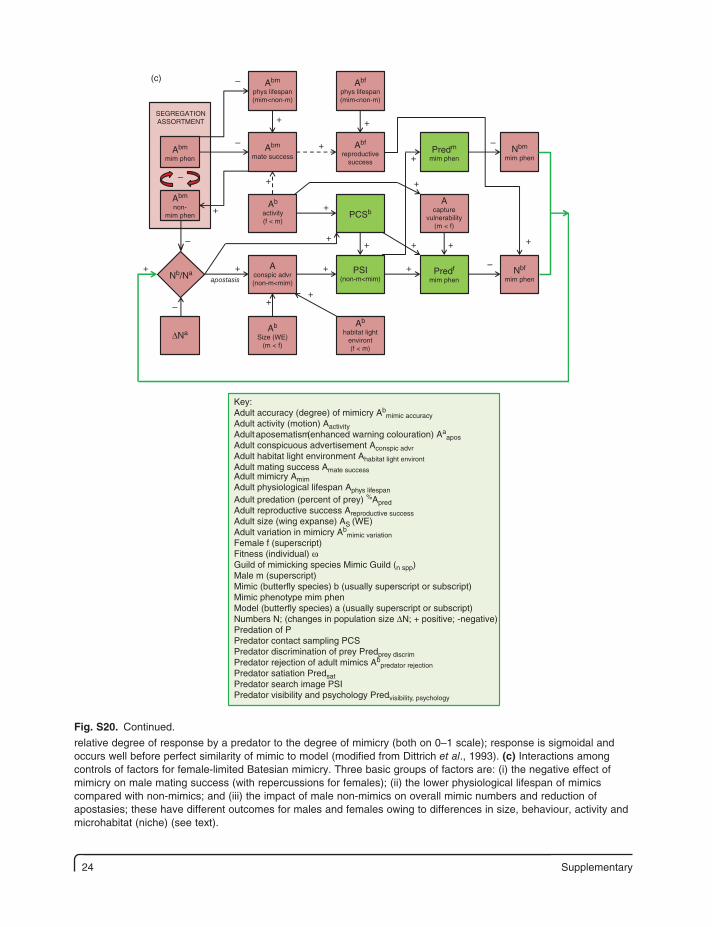
Key:Adult accuracy (degree) of mimicry Ab
mimic accuracyAdult activity (motion) AactivityAdult aposematism(enhanced warning colouration) Aa
aposAdult conspicuous advertisement Aconspic advrAdult habitat light environment Ahabitat light environtAdult mating success Amate successAdult mimicry AmimAdult physiological lifespan Aphys lifespan
Adult predation (percent of prey) %ApredAdult reproductive success Areproductive successAdult size (wing expanse) AS (WE)Adult variation in mimicry Ab
mimic variationFemale f (superscript)Fitness (individual) ωGuild of mimicking species Mimic Guild (n spp)Male m (superscript)Mimic (butterfly species) b (usually superscript or subscript)Mimic phenotype mim phenModel (butterfly species) a (usually superscript or subscript)Numbers N; (changes in population size ΔN; + positive; -negative)Predation of PPredator contact sampling PCSPredator discrimination of prey Predprey discrimPredator rejection of adult mimics Ab
predator rejectionPredator satiation PredsatPredator search image PSIPredator visibility and psychology Predvisibility, psychology
relative degree of response by a predator to the degree of mimicry (both on 0–1 scale); response is sigmoidal and occurs well before perfect similarity of mimic to model (modified from Dittrich et al., 1993). (c) Interactions among controls of factors for female-limited Batesian mimicry. Three basic groups of factors are: (i) the negative effect of mimicry on male mating success (with repercussions for females); (ii) the lower physiological lifespan of mimics compared with non-mimics; and (iii) the impact of male non-mimics on overall mimic numbers and reduction of apostasies; these have different outcomes for males and females owing to differences in size, behaviour, activity and microhabitat (niche) (see text).
Fig. S20. Continued.
Supplementary 25
∆Ta∆R
Predation(attention;attempts;
hits)
BaMwc < worest, feed
ATE(fine
adjustment)
ABdSecondarydefences
ABlaPrimary
defences
AapparAIEATb Am
Apredatorevasion
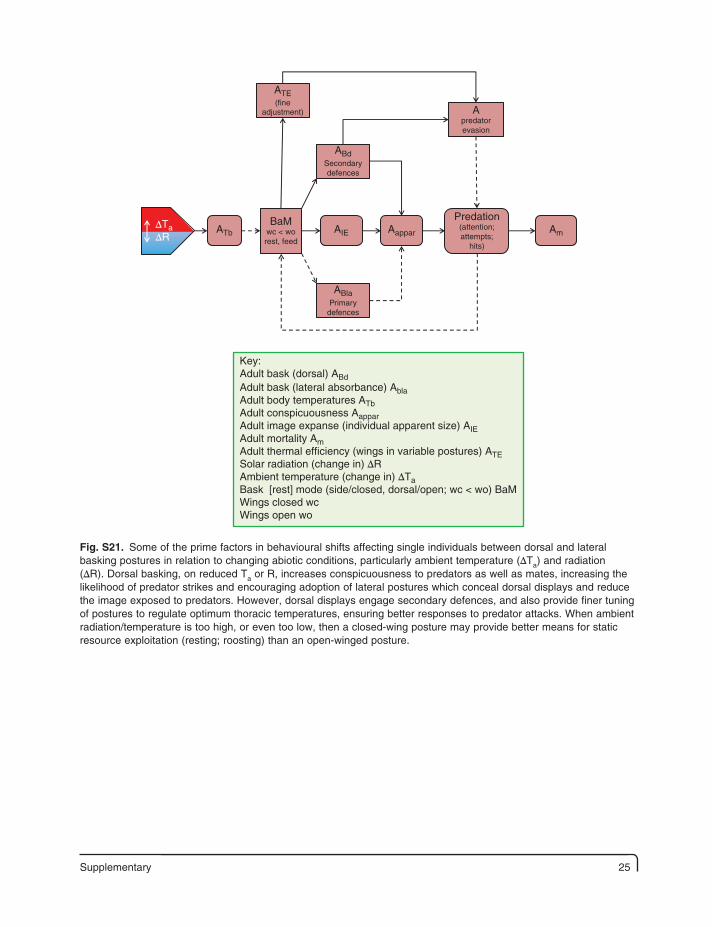
Key:Adult bask (dorsal) ABdAdult bask (lateral absorbance) AblaAdult body temperatures ATbAdult conspicuousness AapparAdult image expanse (individual apparent size) AIEAdult mortality AmAdult thermal efficiency (wings in variable postures) ATESolar radiation (change in) ∆RAmbient temperature (change in) ∆TaBask [rest] mode (side/closed, dorsal/open; wc < wo) BaMWings closed wcWings open wo
Fig. S21. Some of the prime factors in behavioural shifts affecting single individuals between dorsal and lateral basking postures in relation to changing abiotic conditions, particularly ambient temperature (ΔTa) and radiation (ΔR). Dorsal basking, on reduced Ta or R, increases conspicuousness to predators as well as mates, increasing the likelihood of predator strikes and encouraging adoption of lateral postures which conceal dorsal displays and reduce the image exposed to predators. However, dorsal displays engage secondary defences, and also provide finer tuning of postures to regulate optimum thoracic temperatures, ensuring better responses to predator attacks. When ambient radiation/temperature is too high, or even too low, then a closed-wing posture may provide better means for static resource exploitation (resting; roosting) than an open-winged posture.
26 Supplementary
(a)
E
S
54
50m
11
Clearing
Path
River Bollin
Concrete seatbase
DC
F
GH
B
A
(b)
M
C, Concrete seat baseM, MolehillsBE, Bare earth(scuffs)VD, Vegetation debris (leaves, twigs etc.)DG, Dead and dry (brown) grassLG, Live grass
M
M
BE
BE
BE
Aglais urticae
Polygonia c-album
Aglais io
VD
VD
VD
DGDG
LG
LG
CC
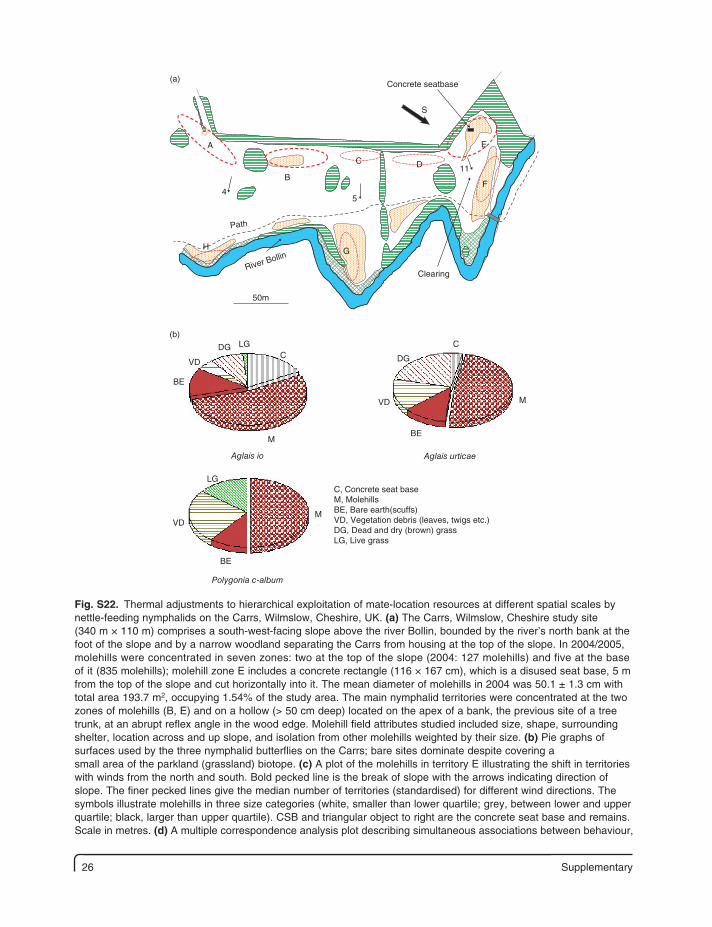
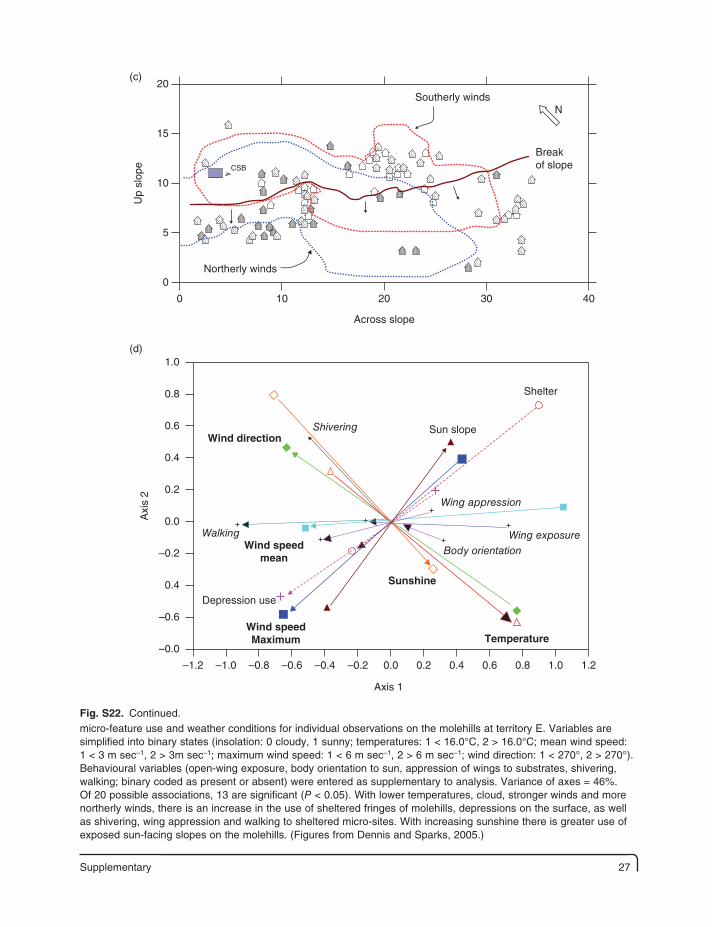
Fig. S22. Thermal adjustments to hierarchical exploitation of mate-location resources at different spatial scales by nettle-feeding nymphalids on the Carrs, Wilmslow, Cheshire, UK. (a) The Carrs, Wilmslow, Cheshire study site (340 m × 110 m) comprises a south-west-facing slope above the river Bollin, bounded by the river’s north bank at the foot of the slope and by a narrow woodland separating the Carrs from housing at the top of the slope. In 2004/2005, molehills were concentrated in seven zones: two at the top of the slope (2004: 127 molehills) and five at the base of it (835 molehills); molehill zone E includes a concrete rectangle (116 × 167 cm), which is a disused seat base, 5 m from the top of the slope and cut horizontally into it. The mean diameter of molehills in 2004 was 50.1 ± 1.3 cm with total area 193.7 m2, occupying 1.54% of the study area. The main nymphalid territories were concentrated at the two zones of molehills (B, E) and on a hollow (> 50 cm deep) located on the apex of a bank, the previous site of a tree trunk, at an abrupt reflex angle in the wood edge. Molehill field attributes studied included size, shape, surrounding shelter, location across and up slope, and isolation from other molehills weighted by their size. (b) Pie graphs of surfaces used by the three nymphalid butterflies on the Carrs; bare sites dominate despite covering a small area of the parkland (grassland) biotope. (c) A plot of the molehills in territory E illustrating the shift in territories with winds from the north and south. Bold pecked line is the break of slope with the arrows indicating direction of slope. The finer pecked lines give the median number of territories (standardised) for different wind directions. The symbols illustrate molehills in three size categories (white, smaller than lower quartile; grey, between lower and upper quartile; black, larger than upper quartile). CSB and triangular object to right are the concrete seat base and remains. Scale in metres. (d) A multiple correspondence analysis plot describing simultaneous associations between behaviour,
Supplementary 27
(c)20
Up
slop
e15
10
5
0
0 10
Northerly winds
Breakof slope
Southerly windsN
CSB
20
Across slope
30 40
(d)1.0
Axi
s 2
0.8
0.6
0.4
0.2
0.0
–0.2
0.4
–0.6
–0.0
–1.2 –1.0 –0.8 –0.6 –0.4 –0.2 0.0 0.2 0.4 0.6 0.8 1.0 1.2
Sun slope
Depression use
Wind direction
Wind speedmean
Wind speedMaximum
Sunshine
Temperature
Shivering
Walking
Body orientation
Wing exposure
Wing appression
Shelter
Axis 1
micro-feature use and weather conditions for individual observations on the molehills at territory E. Variables are simplified into binary states (insolation: 0 cloudy, 1 sunny; temperatures: 1 < 16.0°C, 2 > 16.0°C; mean wind speed: 1 < 3 m sec–1, 2 > 3m sec–1; maximum wind speed: 1 < 6 m sec–1, 2 > 6 m sec–1; wind direction: 1 < 270°, 2 > 270°). Behavioural variables (open-wing exposure, body orientation to sun, appression of wings to substrates, shivering, walking; binary coded as present or absent) were entered as supplementary to analysis. Variance of axes = 46%. Of 20 possible associations, 13 are significant (P < 0.05). With lower temperatures, cloud, stronger winds and more northerly winds, there is an increase in the use of sheltered fringes of molehills, depressions on the surface, as well as shivering, wing appression and walking to sheltered micro-sites. With increasing sunshine there is greater use of exposed sun-facing slopes on the molehills. (Figures from Dennis and Sparks, 2005.)
Fig. S22. Continued.
28 Supplementary
600
(a)
(b)
200
10.00 12.00
R W
m–2
Ta a
nd T
bT
a °C
14.00 16.00
10.00 12.00 14.00 16.00
40
30
20
0
8.00 12.00
Time of day (GMT)
16.00
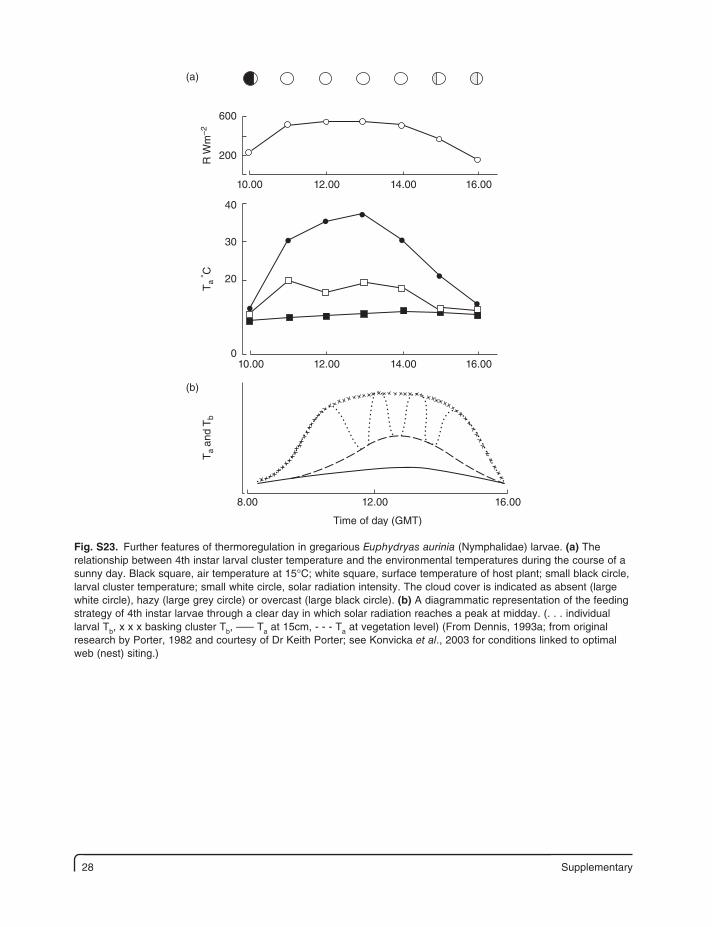
Fig. S23. Further features of thermoregulation in gregarious Euphydryas aurinia (Nymphalidae) larvae. (a) The relationship between 4th instar larval cluster temperature and the environmental temperatures during the course of a sunny day. Black square, air temperature at 15°C; white square, surface temperature of host plant; small black circle, larval cluster temperature; small white circle, solar radiation intensity. The cloud cover is indicated as absent (large white circle), hazy (large grey circle) or overcast (large black circle). (b) A diagrammatic representation of the feeding strategy of 4th instar larvae through a clear day in which solar radiation reaches a peak at midday. (. . . individual larval Tb, x x x basking cluster Tb, ––– Ta at 15cm, - - - Ta at vegetation level) (From Dennis, 1993a; from original research by Porter, 1982 and courtesy of Dr Keith Porter; see Konvicka et al., 2003 for conditions linked to optimal web (nest) siting.)
Supplementary 29
Summer drought
Satyrinae
Afmatingsystem
[mon<poly-andry]
Af
aestivation
Af
body water
Af
lifespan
Af
Resourcebase
Af
thermo-regulationefficiency
Af
mud-puddling
Af
potentialfecundity
(oviposition)
Af
fitness
(ω)
Am
number ofmatings
S
S
Am
summeradult
mortality
Am
sperm masstransfer
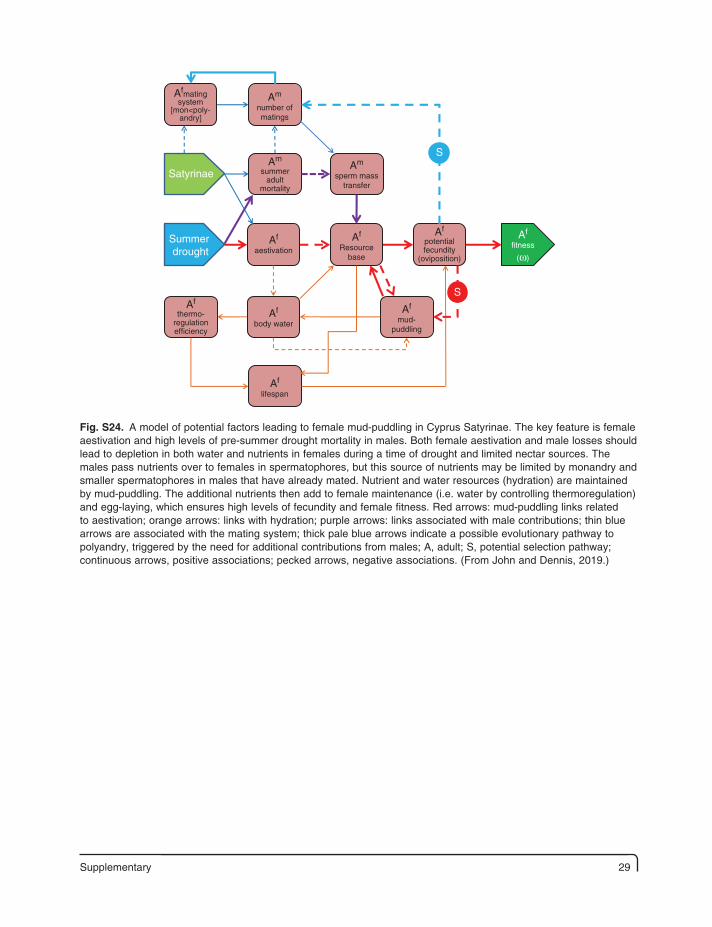
Fig. S24. A model of potential factors leading to female mud-puddling in Cyprus Satyrinae. The key feature is female aestivation and high levels of pre-summer drought mortality in males. Both female aestivation and male losses should lead to depletion in both water and nutrients in females during a time of drought and limited nectar sources. The males pass nutrients over to females in spermatophores, but this source of nutrients may be limited by monandry and smaller spermatophores in males that have already mated. Nutrient and water resources (hydration) are maintained by mud-puddling. The additional nutrients then add to female maintenance (i.e. water by controlling thermoregulation) and egg-laying, which ensures high levels of fecundity and female fitness. Red arrows: mud-puddling links related to aestivation; orange arrows: links with hydration; purple arrows: links associated with male contributions; thin blue arrows are associated with the mating system; thick pale blue arrows indicate a possible evolutionary pathway to polyandry, triggered by the need for additional contributions from males; A, adult; S, potential selection pathway; continuous arrows, positive associations; pecked arrows, negative associations. (From John and Dennis, 2019.)
30 Supplementary
HPdispersion
Am(f)
aposematism
Am
male-maleinteractions
Amappar
Af
predictability(unpred<pred)
Af
populationdensity
Af
flyway use
AmMLm
(patrol<perch)
AmTDcap
AmFvel
manoeuvringAm
Eexpend
AmWEAm
ThM
AmMS
?
Am(f)
predatoravoidance
Am(f)
pred riskAm(f)
pred
Key:Adult conspicuousness AapparAdult energy expenditure AEexpendAdult flight velocity (manoeuvring capacity) AFvelAdult mate location mode (male; seek or wait; patrol < perch) AMLmAdult mating success AMS Adult territorial defence of sites (holding capacity) ATDcapAdult predation ApredAdult risk of predation Apred riskAdult thorax musculature AThMAdult wing expanse AWELarval host plant distribution (concentration < dispersion) HP dispersion
m male, f female
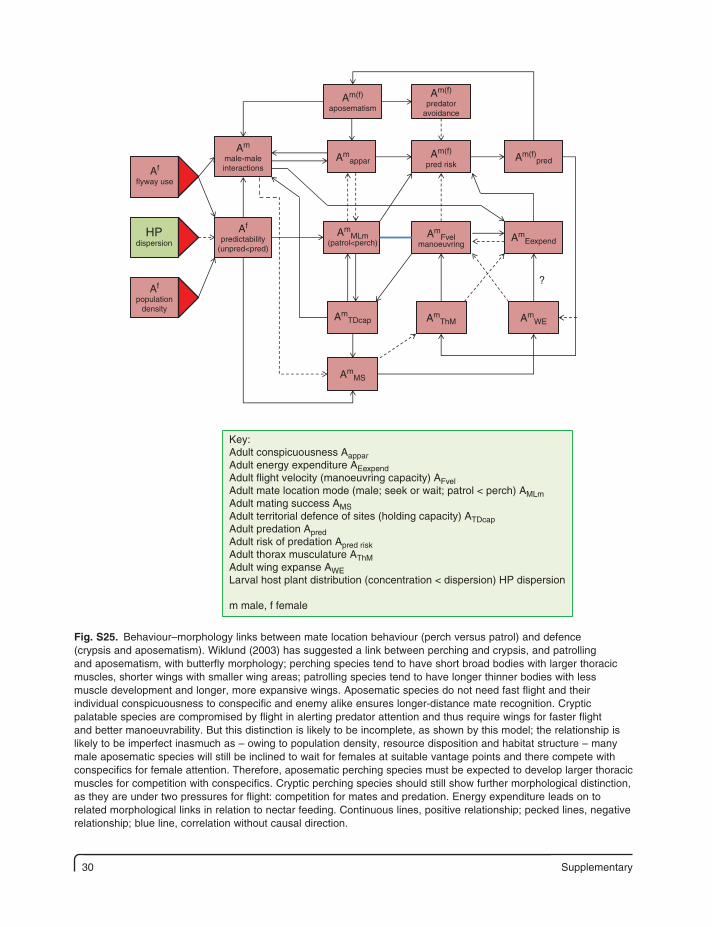
Fig. S25. Behaviour–morphology links between mate location behaviour (perch versus patrol) and defence (crypsis and aposematism). Wiklund (2003) has suggested a link between perching and crypsis, and patrolling and aposematism, with butterfly morphology; perching species tend to have short broad bodies with larger thoracic muscles, shorter wings with smaller wing areas; patrolling species tend to have longer thinner bodies with less muscle development and longer, more expansive wings. Aposematic species do not need fast flight and their individual conspicuousness to conspecific and enemy alike ensures longer-distance mate recognition. Cryptic palatable species are compromised by flight in alerting predator attention and thus require wings for faster flight and better manoeuvrability. But this distinction is likely to be incomplete, as shown by this model; the relationship is likely to be imperfect inasmuch as – owing to population density, resource disposition and habitat structure – many male aposematic species will still be inclined to wait for females at suitable vantage points and there compete with conspecifics for female attention. Therefore, aposematic perching species must be expected to develop larger thoracic muscles for competition with conspecifics. Cryptic perching species should still show further morphological distinction, as they are under two pressures for flight: competition for mates and predation. Energy expenditure leads on to related morphological links in relation to nectar feeding. Continuous lines, positive relationship; pecked lines, negative relationship; blue line, correlation without causal direction.
Supplementary 31
Am,f
Conspecificcontact
frequency(low < high)
Am,f
Massedcourtships:harassmentand vigorous
malecompetition
Am,f
Populationdensity
Am,f
Emergenceperiod
Am,f
Lifespan
Am,f
Damageand failedcourtships
Af
Selectivityof potential
mates
Af
Fecundityandω
Am,f
Cryptic coupling(pupal coupling;
post-nuptial flights;wings closed; signal
display design)
Am,f
Pre-copenergy
loss
Am,f
Matingprobability
Af
Mate refusalposture
(scent cues)
Am
Courtshipdisplay
Am,fij
Inter-species
interactions
BiotopeSpeciesdiversity
(congeners)
s
s
s
s
Am,f
Matingpatterns
(monandry<polyandry)
Am
Pre-coptime
Am
Enhancedsignalling
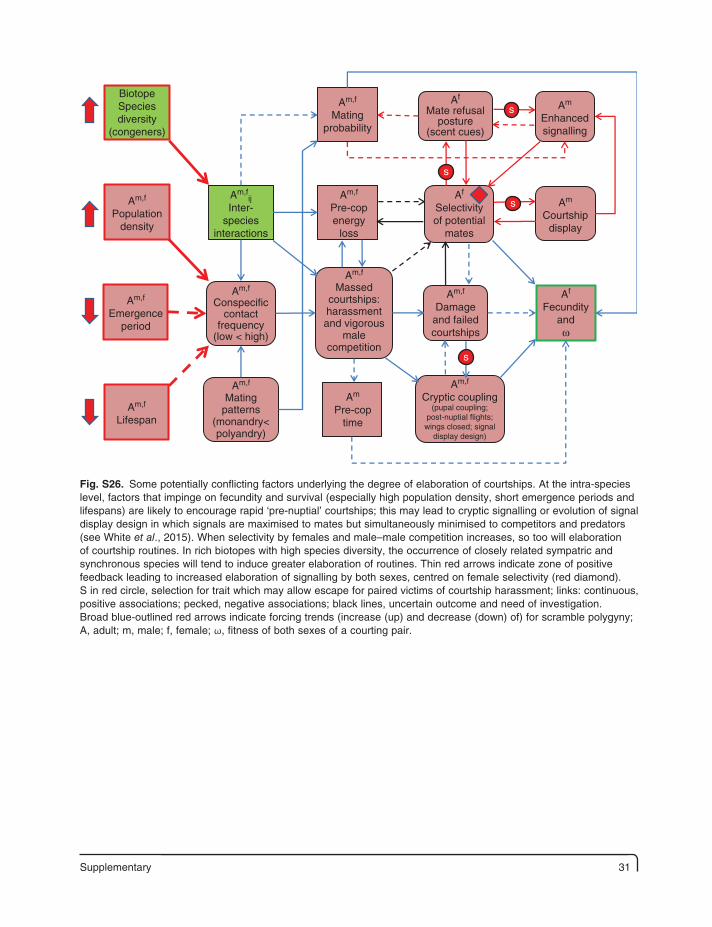
Fig. S26. Some potentially conflicting factors underlying the degree of elaboration of courtships. At the intra-species level, factors that impinge on fecundity and survival (especially high population density, short emergence periods and lifespans) are likely to encourage rapid ‘pre-nuptial’ courtships; this may lead to cryptic signalling or evolution of signal display design in which signals are maximised to mates but simultaneously minimised to competitors and predators (see White et al., 2015). When selectivity by females and male–male competition increases, so too will elaboration of courtship routines. In rich biotopes with high species diversity, the occurrence of closely related sympatric and synchronous species will tend to induce greater elaboration of routines. Thin red arrows indicate zone of positive feedback leading to increased elaboration of signalling by both sexes, centred on female selectivity (red diamond). S in red circle, selection for trait which may allow escape for paired victims of courtship harassment; links: continuous, positive associations; pecked, negative associations; black lines, uncertain outcome and need of investigation. Broad blue-outlined red arrows indicate forcing trends (increase (up) and decrease (down) of) for scramble polygyny; A, adult; m, male; f, female; ω, fitness of both sexes of a courting pair.
32 Supplementary
Roost sitearchitecture
Roostshelter
Adult roostdislodgement
Adultwetting(from
storms)
Adultvulnerabilityto predation
Adultpredation
AdultroostRH
Adultapparency
Roost lightconditions
(shade < light)
RoostTamin
Adult roostclustering
Adultpredator
alert
AdultTb
Roostvegetation
growth
Carnivorousarthropods
Roost sitedimensions
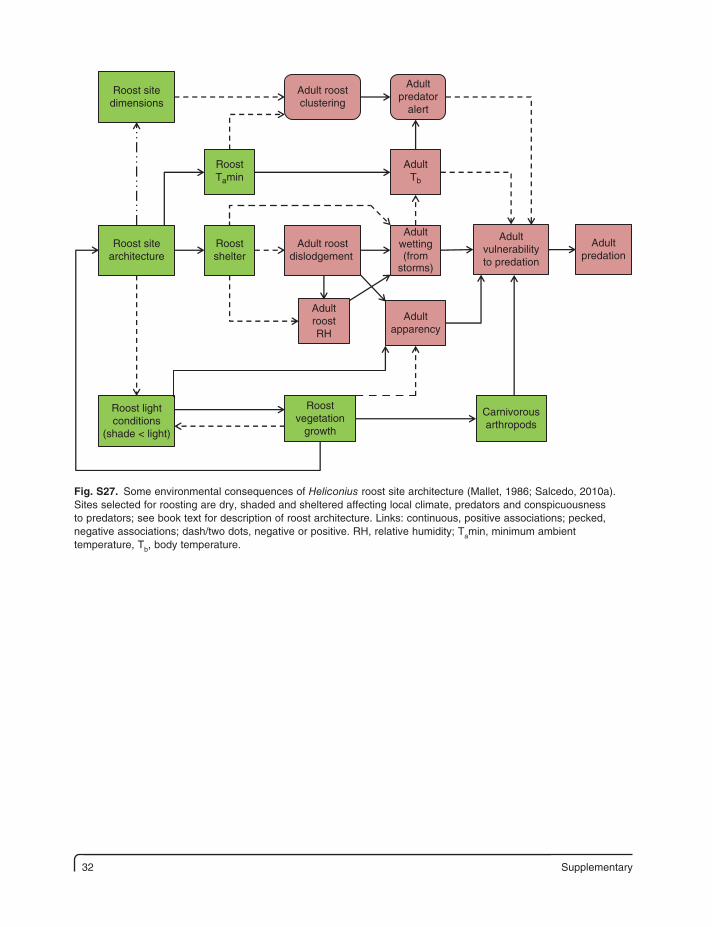
Fig. S27. Some environmental consequences of Heliconius roost site architecture (Mallet, 1986; Salcedo, 2010a). Sites selected for roosting are dry, shaded and sheltered affecting local climate, predators and conspicuousness to predators; see book text for description of roost architecture. Links: continuous, positive associations; pecked, negative associations; dash/two dots, negative or positive. RH, relative humidity; Tamin, minimum ambient temperature, Tb, body temperature.
Supplementary 33
Roost quality(dry, shelter,
shade)
Adultlifespan
Wingpattern
recognition
Adultvisualacuity
Adultolfactory
cues
Adult roostdislodgement
Adultpredator
alert
Adultaversion(predatorconfusion)
Apred Am Aapos
Adultroost
recruitment
Adulthomerange
Agreg roost
AapparPredatorlearning
Adult(prey)injury
Predatortasting
Predatorrejectionof prey
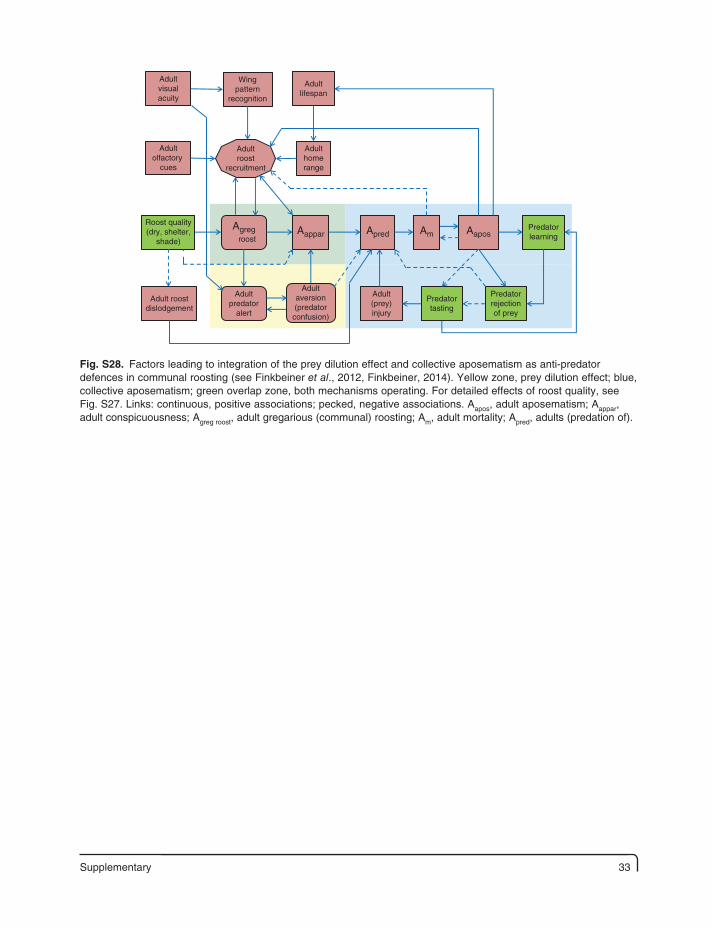
Fig. S28. Factors leading to integration of the prey dilution effect and collective aposematism as anti-predator defences in communal roosting (see Finkbeiner et al., 2012, Finkbeiner, 2014). Yellow zone, prey dilution effect; blue, collective aposematism; green overlap zone, both mechanisms operating. For detailed effects of roost quality, see Fig. S27. Links: continuous, positive associations; pecked, negative associations. Aapos, adult aposematism; Aappar, adult conspicuousness; Agreg roost, adult gregarious (communal) roosting; Am, adult mortality; Apred, adults (predation of).
34 Supplementary
LGreg
Lpred/para
LIndividualdefences
LWeb
formation
HPdepletion
LS
Lheadcapsule
size
Lmandlible
size
Lstarvation
Lfoodprocessing
rate
LHPpolyphagy
(wider use ofplant parts)
LdispersalLfood
needs
Lmobility
LHPPart use
Lappar
Lheatcapacity
Lleaffolding
Lmass
LdiseaseLintegrateddefences
Ldiscoveryof new HPresources
Lfeedtime
(night < day)
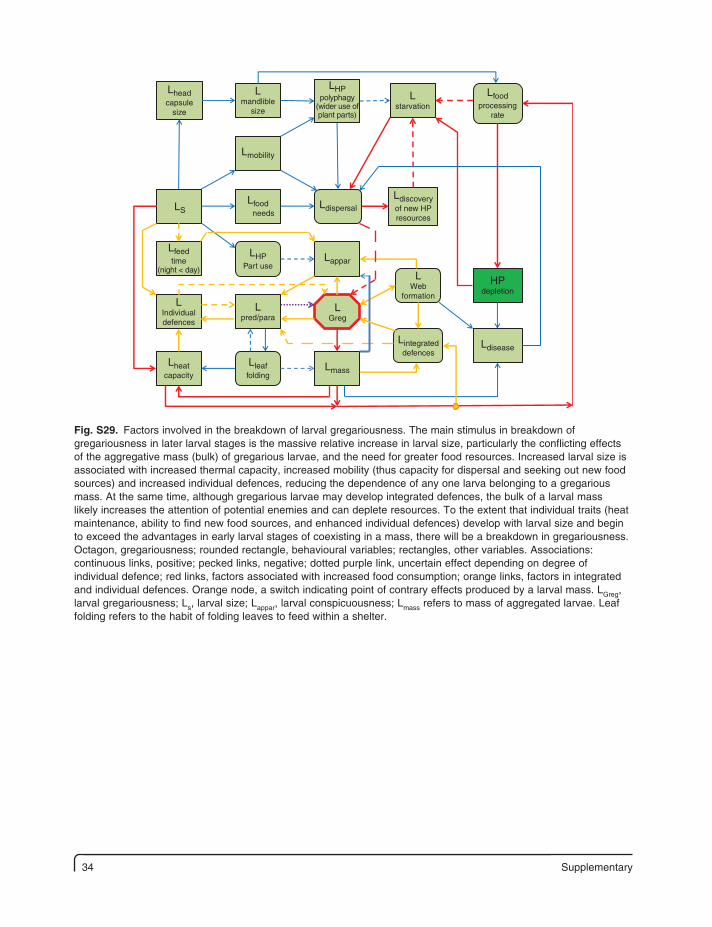
Fig. S29. Factors involved in the breakdown of larval gregariousness. The main stimulus in breakdown of gregariousness in later larval stages is the massive relative increase in larval size, particularly the conflicting effects of the aggregative mass (bulk) of gregarious larvae, and the need for greater food resources. Increased larval size is associated with increased thermal capacity, increased mobility (thus capacity for dispersal and seeking out new food sources) and increased individual defences, reducing the dependence of any one larva belonging to a gregarious mass. At the same time, although gregarious larvae may develop integrated defences, the bulk of a larval mass likely increases the attention of potential enemies and can deplete resources. To the extent that individual traits (heat maintenance, ability to find new food sources, and enhanced individual defences) develop with larval size and begin to exceed the advantages in early larval stages of coexisting in a mass, there will be a breakdown in gregariousness. Octagon, gregariousness; rounded rectangle, behavioural variables; rectangles, other variables. Associations: continuous links, positive; pecked links, negative; dotted purple link, uncertain effect depending on degree of individual defence; red links, factors associated with increased food consumption; orange links, factors in integrated and individual defences. Orange node, a switch indicating point of contrary effects produced by a larval mass. LGreg, larval gregariousness; Ls, larval size; Lappar, larval conspicuousness; Lmass refers to mass of aggregated larvae. Leaf folding refers to the habit of folding leaves to feed within a shelter.
Supplementary 35
TaR
LTb LGR LDT LFCD
LpEI LPPC Lpred/para
LEA(parasites,predators)
Lpth(larval
heating)Tex LS PS
ω
Afec
Lth Lappar
Larva:evolution
of defences
Larvae:Feed time(night < day)
S
S
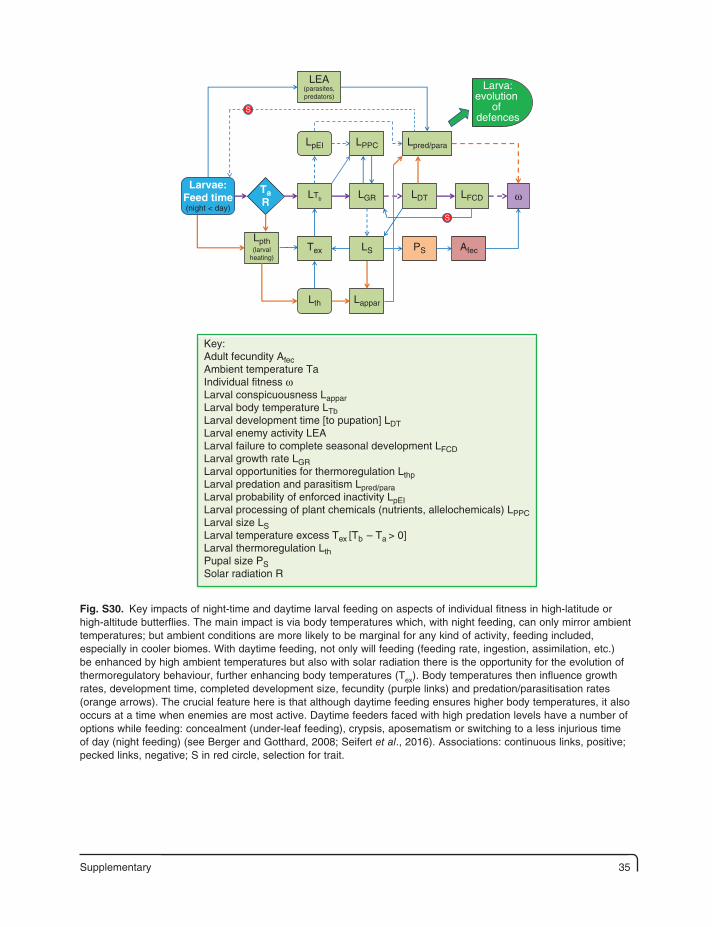
Key:Adult fecundity AfecAmbient temperature TaIndividual fitness ωLarval conspicuousness LapparLarval body temperature LTbLarval development time [to pupation] LDTLarval enemy activity LEALarval failure to complete seasonal development LFCDLarval growth rate LGRLarval opportunities for thermoregulation LthpLarval predation and parasitism Lpred/paraLarval probability of enforced inactivity LpEILarval processing of plant chemicals (nutrients, allelochemicals) LPPCLarval size LSLarval temperature excess Tex [Tb – Ta > 0]Larval thermoregulation LthPupal size PSSolar radiation R
Fig. S30. Key impacts of night-time and daytime larval feeding on aspects of individual fitness in high-latitude or high-altitude butterflies. The main impact is via body temperatures which, with night feeding, can only mirror ambient temperatures; but ambient conditions are more likely to be marginal for any kind of activity, feeding included, especially in cooler biomes. With daytime feeding, not only will feeding (feeding rate, ingestion, assimilation, etc.) be enhanced by high ambient temperatures but also with solar radiation there is the opportunity for the evolution of thermoregulatory behaviour, further enhancing body temperatures (Tex). Body temperatures then influence growth rates, development time, completed development size, fecundity (purple links) and predation/parasitisation rates (orange arrows). The crucial feature here is that although daytime feeding ensures higher body temperatures, it also occurs at a time when enemies are most active. Daytime feeders faced with high predation levels have a number of options while feeding: concealment (under-leaf feeding), crypsis, aposematism or switching to a less injurious time of day (night feeding) (see Berger and Gotthard, 2008; Seifert et al., 2016). Associations: continuous links, positive; pecked links, negative; S in red circle, selection for trait.
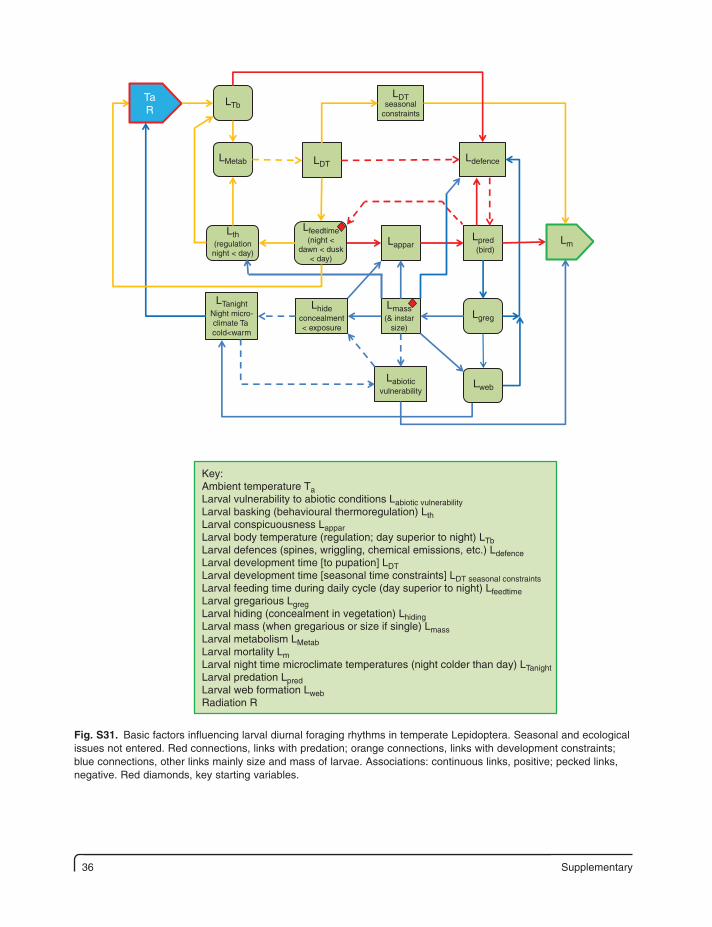
36 Supplementary
Lfeedtime(night <
dawn < dusk< day)
LapparLpred (bird)
Lm
Lth(regulationnight < day)
LMetab LDTLdefence
Lgreg
Lmass(& instar
size)
Lhideconcealment< exposure
LTanightNight micro-climate Ta cold<warm
LwebLabiotic
vulnerability
LDTseasonal
constraintsLTb
TaR
Key:Ambient temperature TaLarval vulnerability to abiotic conditions Labiotic vulnerabilityLarval basking (behavioural thermoregulation) LthLarval conspicuousness LapparLarval body temperature (regulation; day superior to night) LTbLarval defences (spines, wriggling, chemical emissions, etc.) LdefenceLarval development time [to pupation] LDTLarval development time [seasonal time constraints] LDT seasonal constraintsLarval feeding time during daily cycle (day superior to night) LfeedtimeLarval gregarious LgregLarval hiding (concealment in vegetation) LhidingLarval mass (when gregarious or size if single) LmassLarval metabolism LMetabLarval mortality LmLarval night time microclimate temperatures (night colder than day) LTanightLarval predation LpredLarval web formation LwebRadiation R
Fig. S31. Basic factors influencing larval diurnal foraging rhythms in temperate Lepidoptera. Seasonal and ecological issues not entered. Red connections, links with predation; orange connections, links with development constraints; blue connections, other links mainly size and mass of larvae. Associations: continuous links, positive; pecked links, negative. Red diamonds, key starting variables.
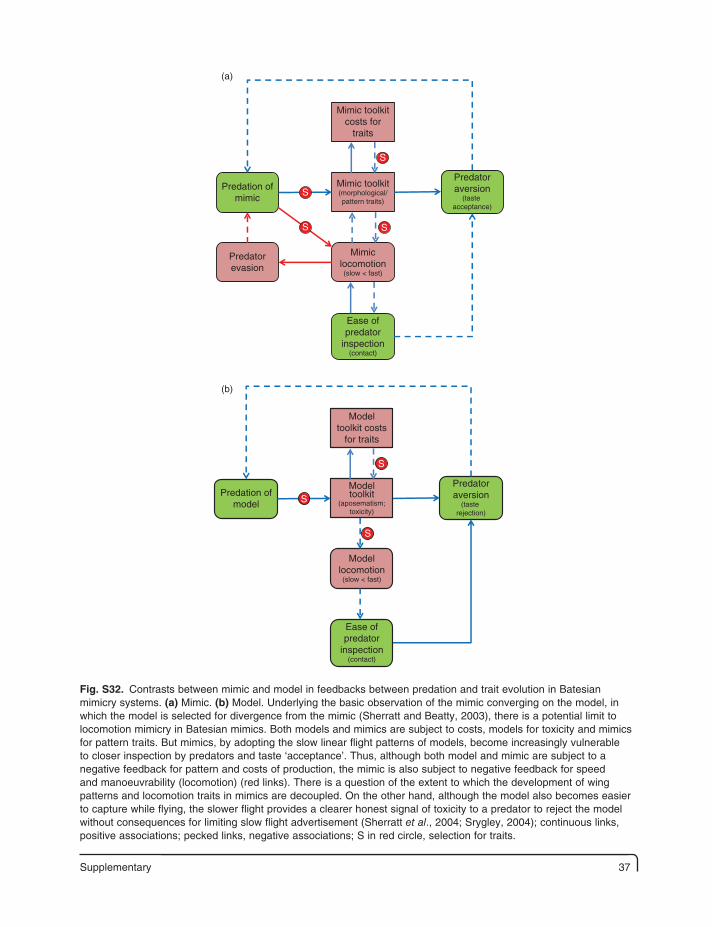
Supplementary 37
Mimic toolkit(morphological/pattern traits)
Mimiclocomotion(slow < fast)
Ease ofpredator
inspection(contact)
Predatoraversion
(taste acceptance)
Predation ofmimic
Predatorevasion
Mimic toolkitcosts for
traits
(a)
S
S
SS
Modeltoolkit
(aposematism;toxicity)
Modellocomotion(slow < fast)
Ease ofpredator
inspection(contact)
Predatoraversion
(taste rejection)
Predation ofmodel
Modeltoolkit costs
for traits
(b)
S
S
S
Fig. S32. Contrasts between mimic and model in feedbacks between predation and trait evolution in Batesian mimicry systems. (a) Mimic. (b) Model. Underlying the basic observation of the mimic converging on the model, in which the model is selected for divergence from the mimic (Sherratt and Beatty, 2003), there is a potential limit to locomotion mimicry in Batesian mimics. Both models and mimics are subject to costs, models for toxicity and mimics for pattern traits. But mimics, by adopting the slow linear flight patterns of models, become increasingly vulnerable to closer inspection by predators and taste ‘acceptance’. Thus, although both model and mimic are subject to a negative feedback for pattern and costs of production, the mimic is also subject to negative feedback for speed and manoeuvrability (locomotion) (red links). There is a question of the extent to which the development of wing patterns and locomotion traits in mimics are decoupled. On the other hand, although the model also becomes easier to capture while flying, the slower flight provides a clearer honest signal of toxicity to a predator to reject the model without consequences for limiting slow flight advertisement (Sherratt et al., 2004; Srygley, 2004); continuous links, positive associations; pecked links, negative associations; S in red circle, selection for traits.

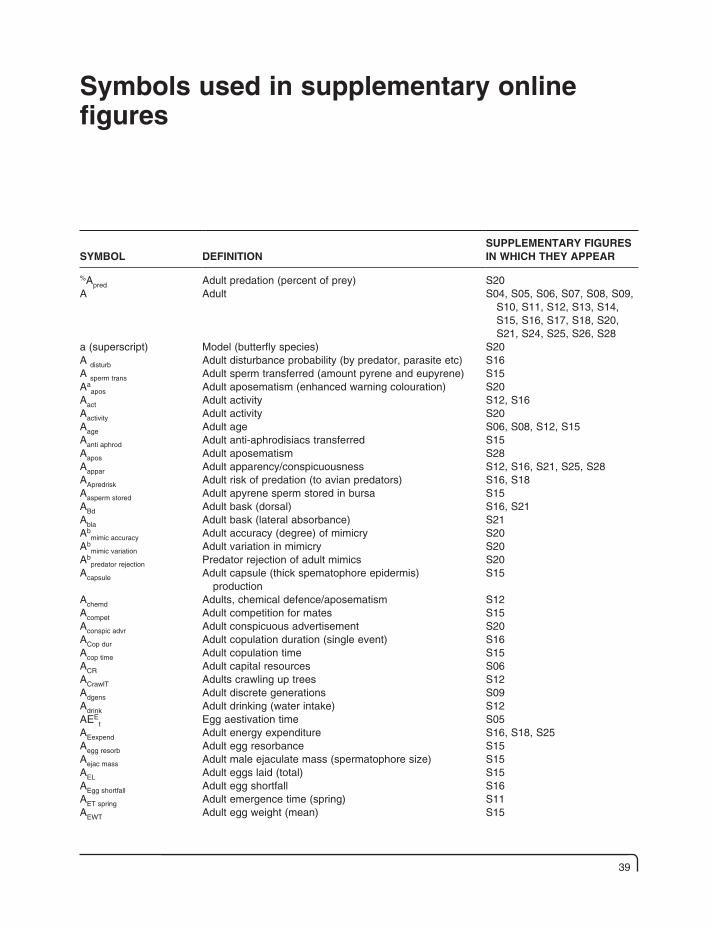
Symbols used in supplementary online figures
SYMBOL DEFINITIONSUPPLEMENTARY FIGURES IN WHICH THEY APPEAR
%Apred Adult predation (percent of prey) S20A Adult S04, S05, S06, S07, S08, S09,
S10, S11, S12, S13, S14, S15, S16, S17, S18, S20, S21, S24, S25, S26, S28
a (superscript) Model (butterfly species) S20A disturb Adult disturbance probability (by predator, parasite etc) S16A sperm trans Adult sperm transferred (amount pyrene and eupyrene) S15Aa
apos Adult aposematism (enhanced warning colouration) S20Aact Adult activity S12, S16Aactivity Adult activity S20Aage Adult age S06, S08, S12, S15Aanti aphrod Adult anti-aphrodisiacs transferred S15Aapos Adult aposematism S28Aappar Adult apparency/conspicuousness S12, S16, S21, S25, S28AApredrisk Adult risk of predation (to avian predators) S16, S18Aasperm stored Adult apyrene sperm stored in bursa S15ABd Adult bask (dorsal) S16, S21Abla Adult bask (lateral absorbance) S21Ab
mimic accuracy Adult accuracy (degree) of mimicry S20Ab
mimic variation Adult variation in mimicry S20Ab
predator rejection Predator rejection of adult mimics S20Acapsule Adult capsule (thick spematophore epidermis)
productionS15
Achemd Adults, chemical defence/aposematism S12Acompet Adult competition for mates S15Aconspic advr Adult conspicuous advertisement S20ACop dur Adult copulation duration (single event) S16Acop time Adult copulation time S15ACR Adult capital resources S06ACrawlT Adults crawling up trees S12Adgens Adult discrete generations S09Adrink Adult drinking (water intake) S12AEE
t Egg aestivation time S05AEexpend Adult energy expenditure S16, S18, S25Aegg resorb Adult egg resorbance S15Aejac mass Adult male ejaculate mass (spermatophore size) S15AEL Adult eggs laid (total) S15AEgg shortfall Adult egg shortfall S16AET spring Adult emergence time (spring) S11AEWT Adult egg weight (mean) S15
39
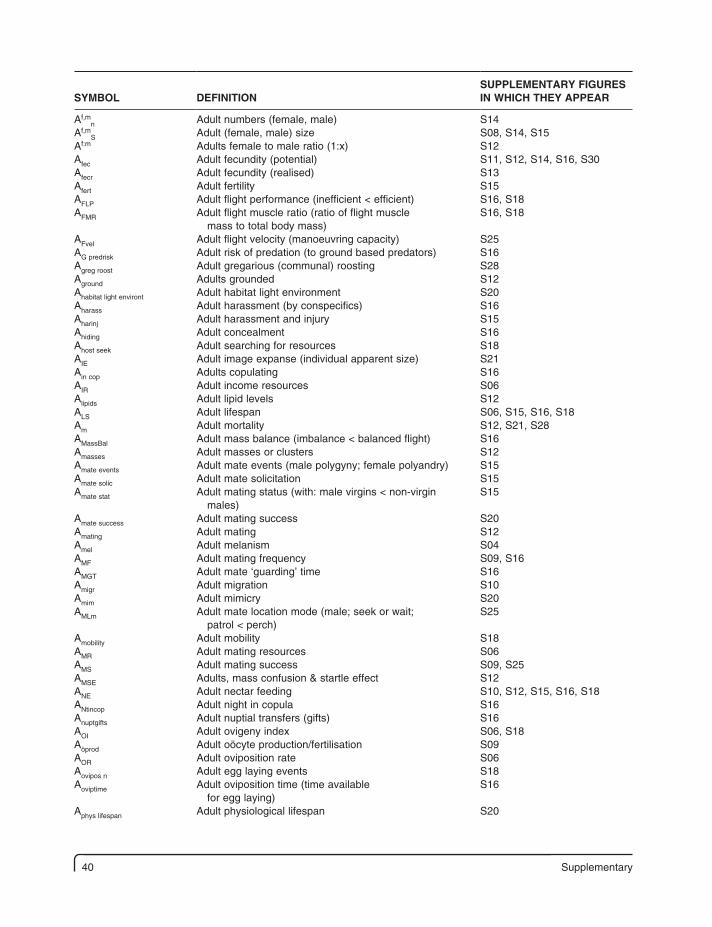
SYMBOL DEFINITIONSUPPLEMENTARY FIGURES IN WHICH THEY APPEAR
Af,mn Adult numbers (female, male) S14
Af,mS Adult (female, male) size S08, S14, S15
Af:m Adults female to male ratio (1:x) S12Afec Adult fecundity (potential) S11, S12, S14, S16, S30Afecr Adult fecundity (realised) S13Afert Adult fertility S15AFLP Adult flight performance (inefficient < efficient) S16, S18AFMR Adult flight muscle ratio (ratio of flight muscle
mass to total body mass)S16, S18
AFvel Adult flight velocity (manoeuvring capacity) S25AG predrisk Adult risk of predation (to ground based predators) S16Agreg roost Adult gregarious (communal) roosting S28Aground Adults grounded S12Ahabitat light environt Adult habitat light environment S20Aharass Adult harassment (by conspecifics) S16Aharinj Adult harassment and injury S15Ahiding Adult concealment S16Ahost seek Adult searching for resources S18AIE Adult image expanse (individual apparent size) S21Ain cop Adults copulating S16AIR Adult income resources S06Alipids Adult lipid levels S12ALS Adult lifespan S06, S15, S16, S18Am Adult mortality S12, S21, S28AMassBal Adult mass balance (imbalance < balanced flight) S16Amasses Adult masses or clusters S12Amate events Adult mate events (male polygyny; female polyandry) S15Amate solic Adult mate solicitation S15Amate stat Adult mating status (with: male virgins < non-virgin
males)S15
Amate success Adult mating success S20Amating Adult mating S12Amel Adult melanism S04AMF Adult mating frequency S09, S16AMGT Adult mate ‘guarding’ time S16Amigr Adult migration S10Amim Adult mimicry S20AMLm Adult mate location mode (male; seek or wait;
patrol < perch)S25
Amobility Adult mobility S18AMR Adult mating resources S06AMS Adult mating success S09, S25AMSE Adults, mass confusion & startle effect S12ANE Adult nectar feeding S10, S12, S15, S16, S18ANtincop Adult night in copula S16Anuptgifts Adult nuptial transfers (gifts) S16AOI Adult ovigeny index S06, S18Aöprod Adult oöcyte production/fertilisation S09AOR Adult oviposition rate S06Aovipos n Adult egg laying events S18Aoviptime Adult oviposition time (time available
for egg laying)S16
Aphys lifespan Adult physiological lifespan S20
40 Supplementary
Supplementary 41
SYMBOL DEFINITIONSUPPLEMENTARY FIGURES IN WHICH THEY APPEAR
Apmt Adult pre-mating time S09Apred Adults, predation of S12, S16, S18, S25, S28Apred risk Adult predation risk S15, S25Apredr Adults, as predation resources S12Apredvigil Adult vigilance to predators S16Aprot Adult protandy S09, S14Aprotoz Adults, protozoan infections S12Arefract period Adult refractory period S15Areproductive success Adult reproductive success S20Arest Adult rest (stationary either feeding, resting, inert) S18Aretmig Adults, return migration S12ARI Adult reproductive investment (male spermatophores
and female fecundity and egg size)S08
ARsuccess Adult reproductive success S16, S18AS Adult size S05, S06, S07, S09, S11AS (WE) Adult size (wing expanse) S20Asemelp (Adult) semelparity S18ASET Adult stress experience total S06ASI:RI Adult soma investment relative to reproductive
investmentS18
Asigna Adult signa development S15Asperm replen Adult sperm replenishment S15Asphrag trans Adult sphragis transfer S15ASs Adult size variation S09ATaFthres Adult ambient temperature threshold for flight S16ATb Adult body temperature S11, S21ATDcap Adult territorial defence of sites (holding capacity) S25ATE Adult thermal efficiency (wings in variable postures) S21ATFO Adult tree fall out (drop from masses) S12AThM Adult thorax musculature S25Atotmate time Adult total mating time S15ATR Adult resources (total, thorax, abdomen) S06, S15ATTD Adults tree trunk disposition S12AVTMD Adult vertical tree mass disposition S12AWE Adult wing expanse S12, S25AWL Adult wing loading S12AWT Adult weight or mass S13, S16, S18AWT(wet) Adult weight (wet weight) S12b (superscript) Mimic (butterfly species) S20BaM Bask [rest] mode (side/closed, dorsal/open; wc < wo) S21BE Bare earth (scuffs) S22BR Birth rate S10C Concrete seat base S22CSB Concrete seat base and remains S22DG Dead and dry (brown) grass S22DPiii,p Diapause stage (3rd instar, pupal) S11Dpstage Diapause stage/phase attainment S07DR Death rate S10E and E Egg S02, S05, S06, S07, S09ECL Environmental critical period length S10EPS Environmental period of critical severity S10EDT Egg development time S05, S06EL+W Egg lipid and water S06
Continued
42 Supplementary
SYMBOL DEFINITIONSUPPLEMENTARY FIGURES IN WHICH THEY APPEAR
Em Egg mortality S05, S06EN Egg number S05, S06, S07, S09EP+E Egg protein and energy S06ER Egg resources S05, S06ES Egg size S05, S06, S07, S09ES/AS Negative allometry of egg size on adult size (b<1) S06ESmod Egg structural modifications (for resource retention
and resistance to ambient conditionsS05
f (superscript) Female S04, S06, S08, S09, S11, S13, S14, S15, S16, S17, S19, S20, S24, S26
FAR Flight activity range S11G/E interaction Genotype/environmental interactions S03Hab cond Habitat conditions S10HE
t Egg hibernation time S05HP Host plant S06, S07, S08, S10, S13, S18,
S25, S29HPavail Host plant availability S10HPdispersion Larval host plant distribution
(concentration < dispersion)S25
HPpal Host plant palatability S13HPQL Host plant quality S06, S07, S08, S18HPQN Host plant quantity S07, S08, S18HPspp Host plant species S07, S08HSl Hibernation stage (larva) S07i [focal individual],
j ..... kIn subscripts refer to different individuals S14
IAdac Individual adaptations to abiotic conditions S10IAdfr Individual adaptations to maintain food reserves S10IAdprd Individual adaptations versus predation S10Iautox Individual autotoxicity costs S13IDP Individual diapause S10IDT Individual development time S14IDVc Individual continuous development S10IEu Individual energy use (cf., with continuous
development)S10
IFR Individual food reserves (somatic maintenance) S10IFR pre-emptive Individual pre-emptive food reserve build up S10Im Individual mortality S13IMat Individual maturation (behaviour, life history and
morphology)S10
IMR Individual mating reserves S10Ipred/para Individual predation/parasitisation (female, male) S14IRS Individual reproductive success S10IS Individual size S13L and L Larva (larvae, larval) S02, S06, S07, S08, S09, S10,
S11, S12, S13, S14, S18, S29, S30, S31
L abiotic vulnerability Larval vulnerability to abiotic conditions S31LACT Larval activity S08LAD Larval approximate digestibility of food = (LIG-LFrass)/
LIG*100)S08
Lapos Larval aposematism (linked to chemical defence) S07, S13
Supplementary 43
SYMBOL DEFINITIONSUPPLEMENTARY FIGURES IN WHICH THEY APPEAR
Lappar Larval conspicuousness/apparency S07, S08, S13, S29, S30, S31LBFI Larval behaviour to improve access to food quality
intakeS08
LBG Larval biomass gained S07, S08LBPA Larval behavioural adjustments for avoiding predators
(night feeding, concealed feeding)S08
Lchdef Larval chemical defence S13Lcompet Larval competition (intra group) S13Lcryp Larval crypsis (matching of environmental object) S07Ld Larval density S08, S12, S13, S18Ldefence Larval defences (spines, wriggling, chemical emissions,
aposematism, threat, etc.)S18, S31
Ldesic Larval desiccation S13LDT Larval development time [to pupation] S06, S07, S08, S09, S13, S18,
S30, S31LDT seasonal constraints Larval development time [seasonal time constraints] S31LDT total Larval development time (total instars) S11LDT,DP Larval development time to diapause S07LEA Larval enemy activity S30LECD = (LBG/LIG-
LFrass)*100Larval efficiency of conversion of digested food S08
Lexp Larval exposure to predators S08, S13LFCD Larval failure to complete seasonal development S30Lfeed Larval feeding (herbivory) S10, S12Lfeedef Larval feeding efficiency S13Lfeedt /Lfeedtime Larval feeding time during daily cycle (day superior to
night)S07, S31
Lfortrl Larval foraging trails (distances travelled) S13LFrass Larval frass production S08LG Live grass S22LGR Larval growth rate S07, S08, S09, S13, S14, S18,
S30,LGreg Larval aggregation and gregariousness S07, S13, S29, S31LGS Length of growing season S07, S08Lh
FC Larval (hatchling) feeding capacity S06Lh
HCS Larval (hatchling) head capsule size S06Lhide Larval hiding/concealment S07, S31Lh
m Larval (hatchling) mortality S06Lh
N Larval (hatchling) number S06Lh
S Larval (hatchling) size S06Lh
starve Larval (hatchling) starvation S06LIG Larval ingested food S08Liii,iv
DT autumn Larval development time (3rd/4th instar) during autumn S11Liii-v freeze avoid Larval freeze avoidance (cryoprotectants) S11Limdef Larval immune defences S13Linfect Larval infections (diseases) S13LIVpred Larval predation (by invertebrates) S08Lm Larval mortality S07, S08, S13, S18, S31Lm autumn frost Larval mortality (from autumn frost) S11Lmass Larval mass (when gregarious or size if single) S29, S31LMetab Larval metabolism (assimilated food metabolised) S08, S31Lmltdef Larval multiple defence arsenal S13LnHPs Larval novel food supply (new host plant source) S13
Continued
44 Supplementary
SYMBOL DEFINITIONSUPPLEMENTARY FIGURES IN WHICH THEY APPEAR
Lnutstr Larval nutritional stress S08Lobsc Larval concealment (hidden from view) S13Lpalat Larval palatability S13Lpara Larval parasitism S08, S13Lpbdef Larval physical and behavioural defences S13LPDE Larval predator dilution effect S13LpEI Larval probability of enforced inactivity S30LPPC Larval processing of plant chemicals (nutrients,
allelochemicals)S30
Lpred Larval predation S13, S31Lpred /Lpara Larval parasitism and predation S18Lpred/para Larval predation and parasitism S30LR Larval resources (nitrogen and water) S08, S13LRavail Larval resource availability S07LRCR Larval relative consumption rate (mgfood/mgbiomass/
day; LIG.d-1)S08
LS Larval size S07, S08, S09, S13, S29, S30Lspines Larval spines/dense hairs S07Lstarve Larval starvation S07LSTI Larval susceptibility to infections S08LTanight Larval night time microclimate temperatures (night
colder than day)S31
LTb Larval body temperature (regulation; day superior to night)
S30, S31
Lth Larval basking (behavioural thermoregulation) S30, S31Lthp Larval opportunities for thermoregulation S30LTRBeh Larval thermoregulation behaviour S13Lvpred Larval predation (by vertebrates) S08LW Larval mass (weight) S18Lweb Larval web formation S07, S13, S31M Adult mate location S02M Molehills S22m (superscript) Male S04, S09, S12, S14, S15, S16,
S17, S20, S24, S25, S26mc Migratory culling of infected individuals S12me Migratory escape from infections S12MigD Migration distance (adults) S12mim phen Mimic phenotype S20Mimic Guild ( n spp ) Guild of mimicking species S20N Adult nectar S02N Numbers (changes in population size
DN; + positive; - negative)S20
NS Natural selection S04P and P Pupa (pupal) S02, S09, S30PAL Predator avoidance learning S13PCS Predator contact sampling S20PDT Pupal development time S09PH Photoperiod (photophase) S08, S11PHD Photoperiod changes (decreases, increases) S08pm Post meridian (afternoon) S17Ppt Precipitation S05Pred Predation S11Pred visibility,psychology Predator visibility and psychology S20
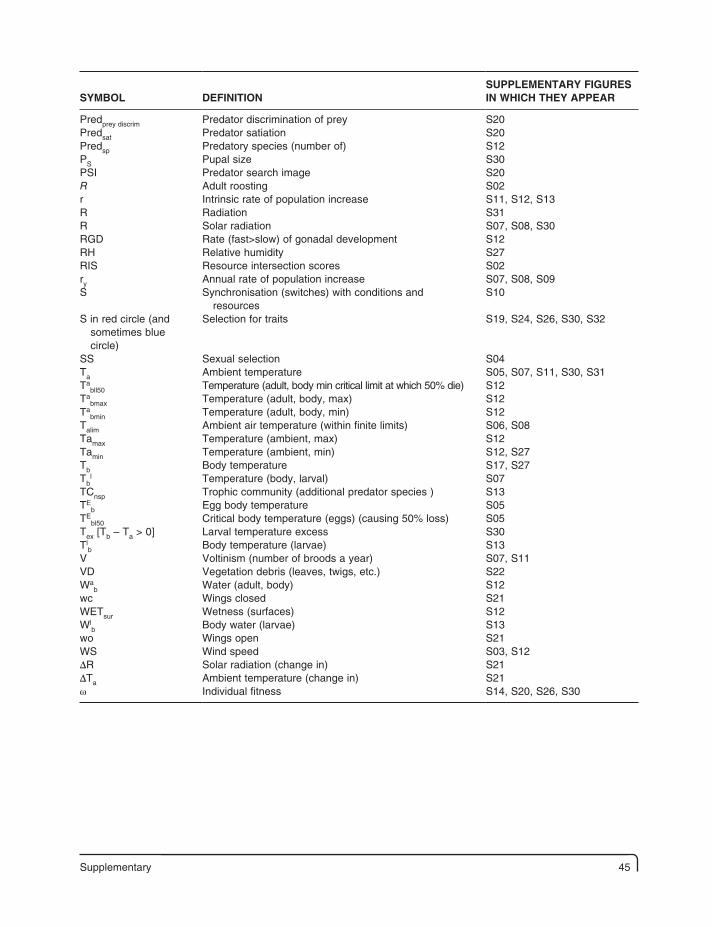
Supplementary 45
SYMBOL DEFINITIONSUPPLEMENTARY FIGURES IN WHICH THEY APPEAR
Predprey discrim Predator discrimination of prey S20Predsat Predator satiation S20Predsp Predatory species (number of) S12PS Pupal size S30PSI Predator search image S20R Adult roosting S02r Intrinsic rate of population increase S11, S12, S13R Radiation S31R Solar radiation S07, S08, S30RGD Rate (fast>slow) of gonadal development S12RH Relative humidity S27RIS Resource intersection scores S02ry Annual rate of population increase S07, S08, S09S Synchronisation (switches) with conditions and
resourcesS10
S in red circle (and sometimes blue circle)
Selection for traits S19, S24, S26, S30, S32
SS Sexual selection S04Ta Ambient temperature S05, S07, S11, S30, S31Ta
bll50 Temperature (adult, body min critical limit at which 50% die) S12Ta
bmax Temperature (adult, body, max) S12Ta
bmin Temperature (adult, body, min) S12Talim Ambient air temperature (within finite limits) S06, S08Tamax Temperature (ambient, max) S12Tamin Temperature (ambient, min) S12, S27Tb Body temperature S17, S27Tb
l Temperature (body, larval) S07TCnsp Trophic community (additional predator species ) S13TE
b Egg body temperature S05TE
bl50 Critical body temperature (eggs) (causing 50% loss) S05Tex [Tb – Ta > 0] Larval temperature excess S30Tl
b Body temperature (larvae) S13V Voltinism (number of broods a year) S07, S11VD Vegetation debris (leaves, twigs, etc.) S22Wa
b Water (adult, body) S12wc Wings closed S21WETsur Wetness (surfaces) S12Wl
b Body water (larvae) S13wo Wings open S21WS Wind speed S03, S12ΔR Solar radiation (change in) S21ΔTa Ambient temperature (change in) S21ω Individual fitness S14, S20, S26, S30