Embed Size (px)
Citation preview

Supplementary appendixThis appendix formed part of the original submission and has been peer reviewed. We post it as supplied by the authors.
Supplement to: Dehghan M, Mente A, Zhang X, et al, on behalf of the Prospective Urban Rural Epidemiology (PURE) study investigators. Associations of fats and carbohydrate intake with cardiovascular disease and mortality in 18 countries from five continents (PURE): a prospective cohort study. Lancet 2017; published online Aug 29. http://dx.doi.org/10.1016/S0140-6736(17)32252-3.

1
Supplementary Appendix
This appendix has been provided by the authors to give readers additional information about their work.
Supplement to: Associations of fats and carbohydrate intake with cardiovascular disease and total mortality in
18 countries from 5 continents (PURE): a prospective cohort study

2
Table of Contents
Funding/Support Page 3
PURE Project Office Staff, National Coordinators, Investigators, and Key Staff: Page 4
Supplementary Methods
PURE Study Design Page 6
Collection of demographics, and risk factors Page 6
Prospective follow-up for cardiovascular events and total mortality Page 7
Event Definitions Page 8
Supplementary Dietary assessment method Page 18
Supplementary Figures
Figure S1. Flow chart for current analysis Page 19
Figure S2. Associations between nutrients and MI and stroke Page 20
Figure S3. Association between nutrients and CVD mortality Page 21
and non-CVD total mortality
Supplementary Tables
Table S1. Number of PURE participants and duration of follow up by country Page 22
Table S2. PURE food frequency questionnaire validation studies Page 23
Table S3: Association between % energy by carbohydrate Page 24
and clinical outcomes
Table S4: Association between % energy by total fat Page 25
and clinical outcomes
Table S5: Association between % energy by total protein Page 26
and clinical outcomes
Table S6: Association between % energy by saturated Page 27
fats and clinical outcomes
Table S7: Association between % energy by monounsaturated Page 28
fats and clinical outcomes
Table S8: Association between % energy by polyunsaturated Page 29
fats and clinical outcomes
Table S9: Five top food contributors of nutrients by country Page 30
Table S10: Nutrient intake reported by previous cohort studies Page 33
Table S11: Percent energy by carbohydrate intake by region Page 33
Table S12: Association between nutrients with total mortality Page 34
adjusted for various index of SES
References list page 35

3
Funding/Support:
Dr S Yusuf is supported by the Mary W Burke endowed chair of the Heart and Stroke Foundation of Ontario.
The PURE Study is an investigator-initiated study that is funded by the Population Health Research Institute, the
Canadian Institutes of Health Research, Heart and Stroke Foundation of Ontario, Support from CIHR’s Strategy for
Patient Oriented Research, through the Ontario SPOR Support Unit, as well as the Ontario Ministry of Health and
Long-Term Care and through unrestricted grants from several pharmaceutical companies [with major contributions
from Astra Zeneca (Canada), Sanofi-Aventis (France and Canada), Boehringer Ingelheim (Germany & Canada),
Servier, and GSK], and additional contributions from Novartis and King Pharma and from various national or local
organizations in participating countries.
These include: Argentina: Fundacion ECLA; Bangladesh: Independent University, Bangladesh and Mitra and
Associates; Brazil: Unilever Health Institute, Brazil; Canada: Public Health Agency of Canada and Champlain
Cardiovascular Disease Prevention Network; Chile: Universidad de la Frontera; China: National Center for
Cardiovascular Diseases; Colombia: Colciencias, Grant number:6566-04-18062; India: Indian Council of Medical
Research; Malaysia: Ministry of Science, Technology and Innovation of Malaysia Grant Nbr 100 - IRDC /
BIOTEK 16/6/21 (13/2007), Grant Number 07-05-IFN-BPH 010, Ministry of Higher Education of Malaysia Grant
Nbr 600 - RMI/LRGS/5/3 (2/2011), Universiti Teknologi MARA, Universiti Kebangsaan Malaysia (UKM-Hejim-
Komuniti-15-2010); occupied Palestinian territory: the United Nations Relief and Works Agency for Palestine
Refugees in the Near East (UNRWA), occupied Palestinian territory; International Development Research Centre
(IDRC), Canada; Philippines: Philippine Council for Health Research & Development (PCHRD); Poland: Polish
Ministry of Science and Higher Education grant Nr 290/W-PURE/2008/0, Wroclaw Medical University; Saudi
Arabia: The Deanship of Scientific Research at King Saud University, Riyadh, Saudi Arabia (Research group
number: RG -1436-013); South Africa: The North-West University, SANPAD (SA and Netherlands Programme for
Alternative Development), National Research Foundation, Medical Research Council of SA, The SA Sugar
Association (SASA), Faculty of Community and Health Sciences (UWC); Sweden: Grants from the Swedish
state under the Agreement concerning research and education of doctors; the Swedish Heart and Lung Foundation;
the Swedish Research Council; the Swedish Council for Health, Working Life and Welfare, King Gustaf V:s and
Queen Victoria Freemasons Foundation, AFA Insurance, Swedish Council for Working Life and Social Research,
Swedish Research Council for Environment, Agricultural Sciences and Spatial Planning, Grant from the Swedish
State under (LäkarUtbildningsAvtalet) Agreement, Grant from the Västra Götaland Region (FOUU); TURKEY:
Metabolic Syndrome Society, Astra Zeneca, Turkey, Sanofi Aventis, Turkey; UAE: Sheikh Hamdan Bin Rashid Al
Maktoum Award For Medical Sciences and Dubai Health Authority, Dubai UAE.
Role of Sponsor: The funders and sponsors had no role in the design and conduct of the study; in the collection,
analysis, and interpretation of the data; in the preparation, review, or approval of the manuscript; or in the decision
to submit the manuscript for publication.

4
PURE Project Office Staff, National Coordinators, Investigators, and Key Staff:
Project office (Population Health Research Institute, Hamilton Health Sciences and McMaster University,
Hamilton, Canada): S Yusuf* (Principal Investigator).
S Rangarajan (Project Manager); K K Teo, C K Chow, M O’Donnell, A Mente, D Leong, A Smyth, P Joseph, A
Merchant, S Islam (Statistician), M Zhang (Statistician), W Hu (Statistician), C Ramasundarahettige (Statistician), G
Wong (Statistician), S I Bangdiwala, L Dyal, A Casanova, M Dehghan (Nutrition Epidemiologist), G Lewis, A
Aliberti, A Arshad, A Reyes, A Zaki, B Lewis, B Zhang, D Agapay, D Hari, E Milazzo, E Ramezani, F Hussain, F
Shifaly, G McAlpine, I Kay, J Lindeman, J Rimac, J Swallow, L Heldman, M(a) Mushtaha, M(o) Mushtaha, M
Trottier, M Riggi, N Aoucheva, N Kandy, P Mackie, R Solano, S Chin, S Ramacham, S Shahrook, S Trottier, T
Tongana, W ElSheikh, Y Iyengar.
Core Laboratories: M McQueen, K Hall, J Keys (Hamilton), X Wang (Beijing, China), J Keneth, A Devanath
(Bangalore, India).
Argentina: R Diaz*; A Orlandini, B Linetsky, S Toscanelli, G Casaccia, JM Maini Cuneo; Bangladesh: O
Rahman*, R Yusuf, AK Azad, KA Rabbani, HM Cherry, A Mannan, I Hassan, AT Talukdar, RB Tooheen, MU
Khan, M Sintaha, T Choudhury, R Haque, S Parvin; Brazil: A Avezum*, GB Oliveira, CS Marcilio, AC Mattos;
Canada: K Teo*, S Yusuf*, J Dejesus, D Agapay, T Tongana, R Solano, I Kay, S Trottier, J Rimac, W Elsheikh, L
Heldman, E Ramezani, G Dagenais, P Poirier, G Turbide, D Auger, A LeBlanc De Bluts, MC Proulx, M Cayer, N
Bonneville, S Lear, D Gasevic, E Corber, V de Jong, I Vukmirovich, A Wielgosz, G Fodor, A Pipe, A Shane;
CHILE: F Lanas*, P Seron, S Martinez, A Valdebenito, M Oliveros; CHINA: Li Wei*, Liu Lisheng*, Chen
Chunming, Wang Xingyu, Zhao Wenhua, Zhang Hongye, JiaXuan, Hu Bo, Sun Yi, Bo Jian, Zhao Xiuwen, Chang
Xiaohong, Chen Tao, Chen Hui, Chang Xiaohong, Deng Qing, Cheng Xiaoru, Deng Qing, He Xinye, Hu Bo,
JiaXuan, Li Jian, Li Juan,Liu Xu, Ren Bing, Sun Yi, Wang Wei, Wang Yang, Yang Jun, Zhai Yi, Zhang Hongye,
Zhao Xiuwen,Zhu Manlu, Lu Fanghong, Wu Jianfang, Li Yindong, Hou Yan, Zhang Liangqing, Guo Baoxia, Liao
Xiaoyang, Zhang Shiying, BianRongwen, TianXiuzhen, Li Dong, Chen Di, Wu Jianguo, Xiao Yize, Liu Tianlu,
Zhang Peng, Dong Changlin, Li Ning, Ma Xiaolan, Yang Yuqing, Lei Rensheng, Fu Minfan, He Jing, Liu Yu, Xing
Xiaojie, Zhou Qiang, ; Colombia: P Lopez-Jaramillo*, PA Camacho Lopez, R Garcia, LJA Jurado, D Gómez-
Arbeláez, JF Arguello, R Dueñas, S Silva, LP Pradilla, F Ramirez, DI Molina, C Cure-Cure, M Perez, E Hernandez,
E Arcos, S Fernandez, C Narvaez, J Paez, A Sotomayor, H Garcia, G Sanchez, T David, A Rico; India: P Mony *,
M Vaz*, A V Bharathi, S Swaminathan, K Shankar AV Kurpad, KG Jayachitra, N Kumar, HAL Hospital, V
Mohan, M Deepa, K Parthiban, M Anitha, S Hemavathy, T Rahulashankiruthiyayan, D Anitha, K Sridevi, R Gupta,
RB Panwar, I Mohan, P Rastogi, S Rastogi, R Bhargava, R Kumar, J S Thakur, B Patro, PVM Lakshmi, R Mahajan,
P Chaudary, V Raman Kutty, K Vijayakumar, K Ajayan, G Rajasree, AR Renjini, A Deepu, B Sandhya, S Asha, HS
Soumya; Iran: R Kelishadi*, A Bahonar, N Mohammadifard, H Heidari; Malaysia: K Yusoff*, TST Ismail, KK
Ng, A Devi, NM Nasir, MM Yasin, M Miskan, EA Rahman, MKM Arsad, F Ariffin, SA Razak, FA Majid, NA

5
Bakar, MY Yacob, N Zainon, R Salleh, MKA Ramli, NA Halim, SR Norlizan, NM Ghazali, MN Arshad, R Razali,
S Ali, HR Othman, CWJCW Hafar, A Pit, N Danuri, F Basir, SNA Zahari, H Abdullah, MA Arippin, NA Zakaria, I
Noorhassim, MJ Hasni, MT Azmi, MI Zaleha, KY Hazdi, AR Rizam, W Sazman, A Azman; OCCUPIED
PALESTINIAN TERRITORY: R Khatib*, U Khammash, A Khatib, R Giacaman; PAKISTAN: R Iqbal*, A
Afridi, R Khawaja, A Raza, K Kazmi; PHILIPPINES: A Dans*, HU Co, JT Sanchez, L Pudol, C Zamora-Pudol,
LAM Palileo-Villanueva, MR Aquino, C Abaquin, SL Pudol, ML Cabral; Poland: W Zatonski*, A Szuba, K
Zatonska, R Ilow#, M Ferus, B Regulska-Ilow, D Różańska, M Wolyniec; SAUDI ARABIA: KF AlHabib*, A
Hersi, T Kashour, H Alfaleh, M Alshamiri, HB Altaradi, O Alnobani, A Bafart, N Alkamel, M Ali, M
Abdulrahman, R Nouri; South Africa: A Kruger*, H H Voster, A E Schutte, E Wentzel-Viljoen, FC Eloff, H de
Ridder, H Moss, J Potgieter, AA Roux, M Watson, G de Wet, A Olckers, JC Jerling, M Pieters, T Hoekstra, T
Puoane, E Igumbor, L Tsolekile, D Sanders, P Naidoo, N Steyn, N Peer, B Mayosi, B Rayner, V Lambert, N Levitt,
T Kolbe-Alexander, L Ntyintyane, G Hughes, R Swart, J Fourie, M Muzigaba, S Xapa, N Gobile , K Ndayi, B Jwili,
K Ndibaza, B Egbujie; SWEDEN: A Rosengren*, K Bengtsson Boström, A Gustavsson, M Andreasson, M
Snällman, L Wirdemann ; TANZANIA: K Yeates*, J Sleeth, K Kilonzo; TURKEY: A Oguz*, N Imeryuz, Y
Altuntas, S Gulec, A Temizhan, K Karsidag, KBT Calik, AAK Akalin, OT Caklili, MV Keskinler, AN Erbakan;
UNITED ARAB EMIRATES: AM Yusufali*, W Almahmeed, H Swidan, EA Darwish, ARA Hashemi, N Al-
Khaja, JM Muscat-Baron, SH Ahmed, TM Mamdouh, WM Darwish, MHS Abdelmotagali, SA Omer Awed, GA
Movahedi, F Hussain, H Al Shaibani, RIM Gharabou, DF Youssef, AZS Nawati, ZAR Abu Salah, RFE Abdalla,
SM Al Shuwaihi, MA Al Omairi, OD Cadigal; R.S. Alejandrino; Zimbabwe: J Chifamba*, L Gwaunza, G Terera,
C Mahachi, P Murambiwa, T Machiweni, R Mapanga.
*National Coordinator # Deceased
6
Supplementary Methods: The Prospective Urban Rural Epidemiology Study (PURE Study) Design The Prospective Urban Rural Epidemiology Study (PURE Study) enrolled 186,790 individuals between 35 and 70 years of age from low, middle and high-income countries (Figure S1). The study includes population samples from 639 communities from 24 countries from 5 continents representing a broad range of economic and social circumstances (1). PURE includes countries in four income strata based on World Bank classification in 2006: five low-income countries (Bangladesh, India, Pakistan, Tanzania, and Zimbabwe), eleven middle-income countries (Argentina, Brazil, Chile, China, Colombia, Iran, Malaysia, Occupied Palestine Territory, Poland, South Africa, and Turkey), and four high-income countries (Canada, Saudi Arabia, Sweden, and United Arab Emirates). The study is coordinated by the Population Health Research Institute, Hamilton Health Sciences and McMaster University, Canada.
Supplementary Methods: Collection of Demographics, Risk Factors and Outcome Events
CVD risk factors (smoking, history of hypertension, diabetes, psychosocial factors and alcohol consumption, diet, use of tobacco, physical activity) are recorded using standardized questions.
Urban and rural
In urban areas, communities from low-, middle- and high-income areas were selected based on known information of the geographical area such as a set of contiguous postal codes or groups of streets to obtain some representative population of each income area. Rural communities were villages at least 50 km from the cities. Many of these communities were remote with few health facilities.
Household wealth
Information on indicators of housing characteristics (e.g., type of windows and flooring, water and sanitation facilities) and assets (e.g., ownership of home, car, computer, and mobile phone) were weighted and combined with weights derived from a principal component analysis procedure. The resulting variable was standardized to a mean of 0 and standard deviation of 1 and using this index the household population was divided into thirds from poorest to richest.
Blood pressure measurements
Two BP readings are taken in the right arm in the sitting position and after a minimum of 5 minutes of rest by trained personnel with an Omron automatic digital blood pressure monitor (Omron HEM-757), using the mean of the 2 BP measures.
Hypertension SBP >140, DBP >100, or diagnosed hypertension or medications of hypertension Non-cholesterol INTERHEART Risk Score (IHRS)
Includes age, sex, smoking, diabetes (self-report or fasting glucose <7.0 mmol/L), high BP (measured BP >140/>90 or self-report), family history, waist to hip ratio, psychosocial factors, diet, and physical activity. The IHRS is calculated for each individual using a validated method (19).
Physical activity
One-week recall of physical activity (PA) and sitting time were assessed using the long-form International Physical Activity Questionnaire, with high PA defined as metabolic equivalent task (MET) score ⩾ 3000, moderate as MET score 600–3000 and low as MET score o600 MET-minutes per week (2)

7
Supplementary Methods: Prospective Follow-up for Cardiovascular Events and Total mortality History of disease was collected at baseline from every participant with standardized questionnaires. Follow-up was initiated in all sites by 2008 and completed by March, 2017. Up to three attempts were made to interview all households to document events. Information on specific events (death, myocardial infarction, stroke, heart failure, cancer, hospitalizations, new diabetes, injury, tuberculosis, human immunodeficiency viral infections, malaria, pneumonia, asthma, chronic obstructive pulmonary disease) were obtained from participants or their family members. This information was adjudicated centrally in each country by trained physicians using standardized definitions. Because the PURE study involves urban and rural areas from middle- and low-income countries, supporting documents to confirm cause of death and/or event varied in degrees of completion and availability. In most of middle- and low-income countries there was no central system of death or event registration. Therefore, information was obtained about prior medical illness and medically certified cause of death where available, and, second, best available information was captured from reliable sources in those instances where medical information was not available in order to be able to arrive at a probable diagnosis or cause of death. Event documentation was based on information from death certificates (available in 100% of deaths), medical records (MI: 49.4%, stroke 80.8% and heart failure: 76.2%), household interviews and other sources. Verbal Autopsies were also used to ascertain cause of death in addition to medical records which were reviewed by a health professional. This approach has been used in several studies conducted in middle- and low-income countries. To ensure a standard approach and accuracy for classification of events across all countries and over time, the first 100 CVD events (deaths, MI, strokes, heart failure or cancers) for China and India, and 50 cases for other countries were adjudicated both locally and also by the adjudication chair, and if necessary further training was provided. Thereafter, every year, 50 cases for China and India and 25 cases for each of the remaining countries were adjudicated as above.

8
Supplementary Methods: Event Definitions FATAL EVENTS
Cardiovascular Death – Definitions 01.00 DEATH DUE TO CARDIOVASCULAR EVENTS 01.10 Sudden unexpected Cardiovascular Death (SCVD) Without evidence of other cause of death, death that occurred suddenly and unexpectedly (examples: witnessed collapse, persons resuscitated from cardiac arrest who later died) or persons seen alive less than 12 hours prior to discovery of death (example persons found dead in his/her bed).
SCVD is either definite, probable or possible according to the following characteristics:
PURE Adjudication Code
Event Type
Acceptable ICD-10 codes
01.11: Definite One of the following in persons with: known cardiovascular disease, or diabetes with an additional risk factor such as
hypertension, smoking, dyslipidemia, micro albuminuria, serum creatinine 50% above upper limit of normal, or
3 of the above risk factors, or 2 of the above risk factors in men aged 60 and more and
women aged 65 and more
No ICD-10 Code
01.12: Probable One of the following in persons with: diabetes, or 2 of the above risk factors in men aged less than 60 and in
women less than 65, or one of the above risk factor in men aged 60 and more and
in women aged 65 and more, or typical of chest pain or sudden severe dyspnea of less
than 20-minute duration preceding the event
01.13: Possible In persons without risk factor
For SCVD, the patient was well or had a stable CVD (example stable angina) when last seen alive. The event of a sudden death occurring during the hospitalization of MI is considered a fatal MI and not sudden death.

9
01.30 Fatal Myocardial Infarction Symptoms of Myocardial Infarction: Typical symptoms or suggestive symptoms of MI according to physician are characterized by severe anterior chest pain as tightness, crushing, burning, lasting at least 20 minutes, occurring at rest, or on exertion, that may radiate to the arms or neck or jaw and may be associated with dyspnea, diaphoresis and nausea. However, death associated with nausea and vomiting with or without chest pain not due to another cause may be considered as possible MI if ECG and cardiac markers are not done. These symptoms may have occurred the last month before death. Fatal myocardial infarction is either definite, probable or possible according to the following characteristics:
PURE Adjudication
Code
Event Type Acceptable ICD-10 codes
01.31: Definite 1. Autopsy demonstrating fresh myocardial infarction and/or recent coronary occlusion, or
2. ECG showing new and definite sign of MI (Minnesota code 1-1-1) or 3. Symptoms typical or atypical or inadequately described but attributed to
cardiac origin lasting at least 20 minutes and by troponin or cardiac enzymes (CKMB, CK, SGOT, SLDH) above center laboratory ULN
4. ECG with new ischemic changes (new ST elevation/depression or T wave inversion ≥ 2 mm) and by troponin or cardiac enzymes (CKMB, CK, SGOT, SLDH) above center laboratory ULN
I21- I22 01.32: Probable
1. ECG with sign of probable MI (Minnesota code 1-2-1), or 2. Typical symptoms lasting at least 20 minutes considered of cardiac
origin, with only new ST-T changes (new ST elevation/depression or T wave inversion ≥ 1 but < 2mm) without documented increased cardiac markers or enzyme as in PURE definition 1.31 (above), or
3. Increased cardiac enzymes as in PURE definition 1.31 (above) showing a typical pattern of MI as above without symptoms or significant ECG changes
01.33: Possible 1. ECG with sign of possible MI (Minnesota code 1-3-1) or 2. Typical symptoms or symptoms suggestive of MI according to the
physician lasting at least 20 minutes without documented ECG or cardiac marker.
The Minnesota codes for MI is taken from Rose and Blackburn and published in their book “Evaluation Methods of Cardiovascular Disease WHO 1969”.
Definite MI is Q/R ratio ≥1/3 and Q duration ≥ 0.03 second in one of the following leads: I, II, V2, 3, 4, 5, 6. (code 1-1-1)
Probable MI is Q/R ratio ≥1/3 and Q duration between 0.02 and 0.03 second in one of the following leads: I, II, V2, 3, 4, 5, 6. (code 1-2-1)
Possible MI is Q/R ratio between 1/5 and 1/3 and Q duration between 0.02 and 0.03 second in one of the following leads: I, II, V2, 3, 4, 5, 6. (code 1-3-1)
10
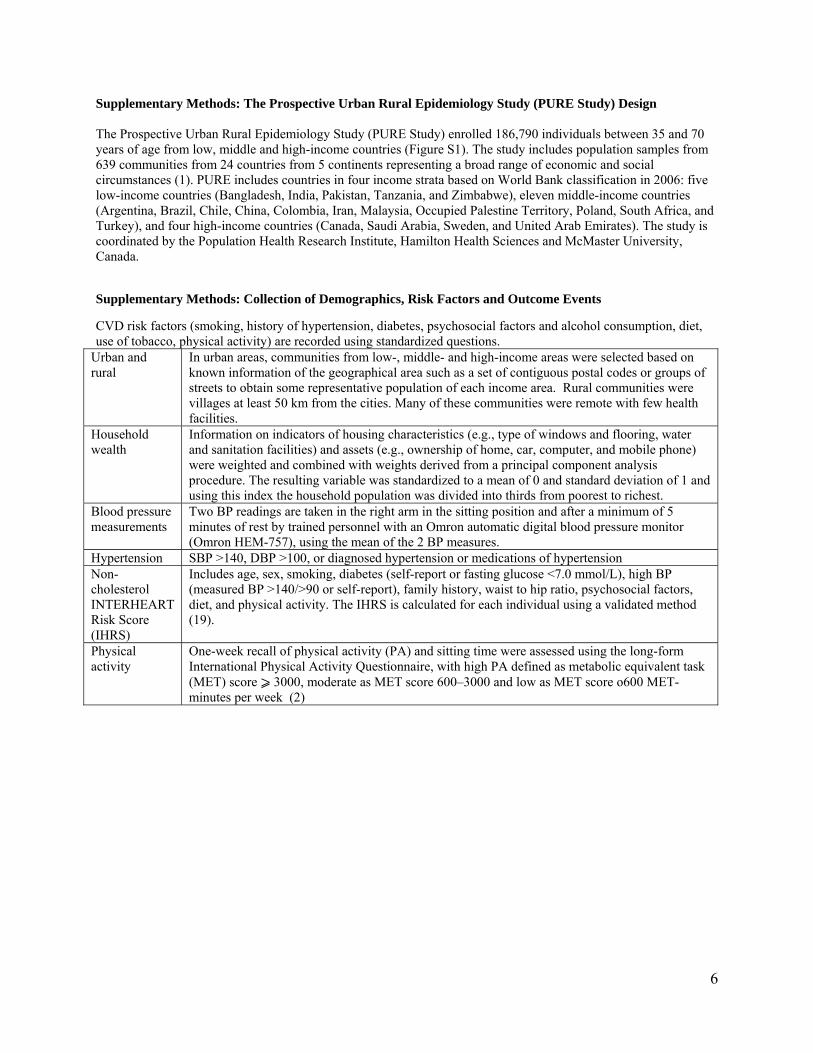
01.40 Fatal Stroke Fatal stroke is either definite or possible according to the following characteristics:
PURE Adjudication
Code
Event Type Acceptable ICD-10 codes
01.41: Definite Stroke death is defined as death within 30 days from an acute focal neurological deficit diagnosed by a physician and thought to be of vascular origin (without other cause such as brain tumor) with signs and symptoms lasting >= 24 hrs. Stroke death is also considered if death occurred within 24 hrs. of onset of persisting signs and symptoms, or if there is evidence of a recent stroke on autopsy. N.B.
In a subject with a stroke <= 30 days: If death occurred with a pneumonia due to possible aspiration, death will be considered to be due to stroke.
In a subject with a stroke > 30 days: If death occurred with a pneumonia due to possible aspiration, the adjudicator will make a decision according to his/her clinical judgment if death is related to stroke or not.
Subarachnoid hemorrhage death manifested by sudden onset headache with/without focal signs and imaging (CT or MRI) evidence of bleeding primarily in the subarachnoid space is considered a fatal stroke in absence of trauma or brain tumor or malformation
Subdural hematoma death is not considered as a stroke death and may be related to previous trauma or other cause.
I60- I64, I69
01.43: Possible Death in a participant with a history of sudden onset of focal neurological deficit of one or more limbs, loss of vision or slurred speech lasting about 24 hours.
11
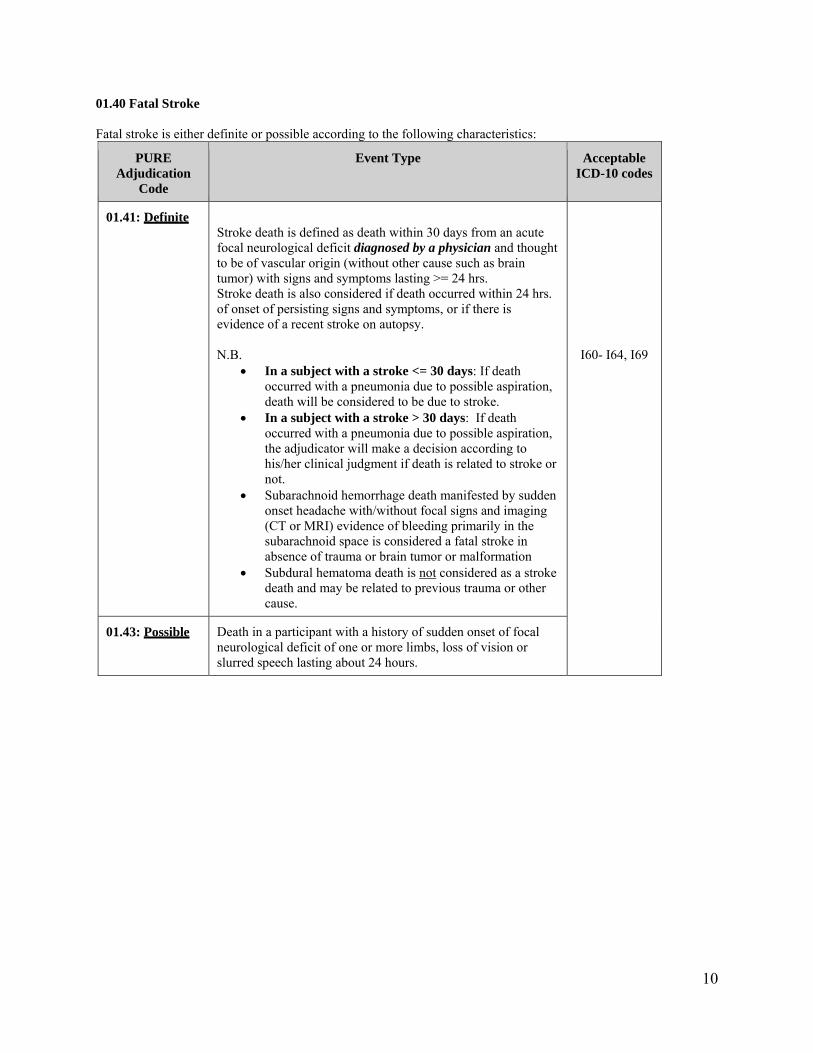
01.50 Fatal Congestive Heart Failure Fatal congestive heart failure is either definite or possible according to the following characteristics:
PURE Adjudication
Code
Event Type Acceptable ICD-10 codes
01.51: Definite The diagnosis of congestive heart failure may be an autopsy finding in absence of other cause or requires signs (rales, increased jugular venous pressure or ankle edema) or symptoms (nocturnal paroxysmal dyspnea, dyspnea at rest or ankle edema) of congestive heart failure and one or both of the following:
radiological signs of pulmonary congestion, treatment of heart failure with diuretics
If sudden death occurred in a patient with chronic severe heart failure, it should be adjudicated as fatal congestive heart failure.
I50
01.52: Probable Progressive shortness of breath on lying down or at night, improving on sitting up AND any of the following signs or symptoms: swelling of feet, distension of abdomen, progressive cough in a person with known hypertension or a history of previous MI/angina or other heart disease
01.53: Possible Progressive shortness of breath on lying down or at night, improving on sitting up AND any of the following signs or symptoms: swelling of feet, distension of abdomen, progressive cough

12
01.60 Death Due to Other Cardiovascular Deaths (other causes [1.10 to 1.50 above] having been excluded)
PURE Adjudication
Code
Event Type Acceptable ICD-10 codes
01.61 Arterial rupture of aneurysm I71- I72
01.62 Pulmonary embolism NOTE: Death associated with pulmonary embolism occurring within 2 weeks after a fracture such as hip, femur should attributed to death due to injury. Refer to Injury, Section 6.0
I26
01.63 Arrhythmic death (A-V block, sustained ventricular tachycardia in absence of other causes)
I44- I45, I47- I49
01.64 Death after invasive cardiovascular intervention: a perioperative death extending to 30 days after coronary or arterial surgical revascularization and to 7 days after a coronary or arterial percutaneous dilatation (angioplasty) with or without a stent or an invasive diagnostic procedure.
I97
01.65 Congenital heart disease Q20-Q28
01.66 Heart valve disease (including rheumatic heart disease) I01, I05- I09, I34- I37
01.67 Endocarditis I33, I38
01.68 Myocarditis I40
01.69 Tamponade (pericarditis) I30, I31, I32
01.70 Other cardiovascular events (Excluding 1.61 to 1.69 above) Valid ICD-10 codes would include the following: I11, I12, I13, I23, I24, I25, I27, I28, I42, I51, I52, I65-I68, I73, I74, I96, I98, I99 (Refer to ICD-10 Listing for associated definitions for each code)
Any valid ‘I’ (Cardiovascular) ICD-10 code
that can be classified as underlying Code, not
specified above

13
NON-FATAL EVENTS
Cardiovascular Events – Definitions 10.00 NON-FATAL CARDIOVASCULAR EVENTS 10.10 Non-Periprocedural Myocardial Infarction (MI) MI is considered either definite, probable or possible according to the following characteristics:
PURE Adjudication Code
Event Type
Acceptable ICD-10 codes
10.11: Definite 5. ECG showing new and definite sign of MI (Minnesota code 1-1-1) or
6. Symptoms typical or atypical or inadequately described but attributed to cardiac origin lasting at least 20 minutes and by troponin or cardiac enzymes (CKMB, CK, SGOT, SLDH) above center laboratory ULN
7. ECG with new ischemic changes (new ST elevation/depression or T wave inversion ≥ 2 mm) and by troponin or cardiac enzymes (CKMB, CK, SGOT, SLDH) above center laboratory ULN
Please note that increased markers may occur in trauma (CK, AST, myoglobin and CK MB to a lesser degree); renal insufficiency, heart failure, pulmonary embolism…. (troponin), cardioversion (all)
I21-I22
10.12: Probable 4. ECG with new and probable sign of MI (Minnesota code 1-2-1), or
5. Typical symptoms lasting at least 20 minutes considered of cardiac origin, with only new ST-T changes (new ST elevation/depression or T wave inversion ≥ 1 but < 2mm) without documented increased cardiac markers as in PURE definition 10.11 (above), or
6. Increased cardiac enzymes showing a typical pattern of MI as above without symptoms or significant ECG changes.
10.13: Possible 1. ECG with new and possible sign of MI (Minnesota code 1-3-1), or
2. Typical symptoms lasting 20 minutes and more considered to be of cardiac origin without documented ECG or cardiac marker.

14
10.20 Periprocedural Myocardial Infarction
PURE Adjudication Code
Event Type Acceptable ICD-10 codes
10.21: Definite 1. ECG showing new and definite sign of MI (Minnesota code 1-1-1), or
2. Increased cardiac markers within 48 hours of procedure: percutaneous coronary intervention: CKMB should
be ≥ 5 X ULN or troponin ≥ 5 X above lower level of necrosis OR > 20% increase in cardiac markers if elevated at the beginning of the procedure in a patient with symptoms suggestive of myocardial ischemia
Coronary surgery: Increased cardiac markers CKMB should be ≥ 10X ULN or troponin ≥ 10X above lower limit of necrosis.
I21-I22
The Minnesota codes for MI is taken from Rose and Blackburn and published in their book “Evaluation Methods of Cardiovascular Disease WHO 1969”.
Definite MI is Q/R ratio ≥1/3 and Q duration ≥ 0.03 second in one of the following leads: I, II, V2, 3, 4, 5, 6. (code 1-1-1)
Probable MI is Q/R ratio ≥1/3 and Q duration between 0.02 and 0.03 second in one of the following leads: I, II, V2, 3, 4, 5, 6. (code 1-2-1)
Possible MI is Q/R ratio between 1/5 and 1/3 and Q duration between 0.02 and 0.03 second in one of the following leads: I, II, V2, 3, 4, 5, 6. (code 1-3-1)

15
10.30 Stroke/Transient Ischemic Attack (TIA)
PURE Adjudication Code
Event Type Acceptable ICD-10 codes
10.31: Definite Stroke is defined as an acute focal neurological deficit diagnosed by a physician and thought to be of vascular origin (without other case such as brain tumor) with signs and symptoms lasting >= 24 hrs. N.B.
Subarachnoid hemorrhage manifested by sudden onset headache with/without focal signs and imaging (CT or MRI or lumbar puncture) showing evidence of bleeding primarily in the subarachnoid space is considered a stroke in absence of trauma or brain tumor or malformation
Subdural hematoma is not considered as a stroke and
may be related to previous trauma or other cause.
I60-I64, I69
10.33: Possible Stroke is possible if there is a history of sudden onset of focal neurological deficit of one or more limbs, loss of vision or slurred speech lasting about 24 hours or more
10.34: TIA The diagnosis of TIA requires the presence of acute focal neurological deficit thought to be of vascular origin with signs and symptoms lasting less than 24 hours
G45
10.40 Congestive Heart Failure
PURE Adjudication Code
Event Type Acceptable ICD-10 codes
10.41: Definite The diagnosis of congestive heart failure requires signs (rales, increased jugular venous pressure or ankle edema) or symptoms (nocturnal paroxysmal dyspnea, dyspnea at rest or ankle edema) of congestive heart failure and one or both of the following:
radiological signs of pulmonary congestion, Treatment of heart failure with diuretics.
I50 10.42: Probable Progressive shortness of breath on lying down or at night,
improving on sitting up AND any of the following signs or symptoms: swelling of feet, distension of abdomen, progressive cough in a person with known hypertension or a history of previous MI/angina or other heart disease
10.43: Possible
Congestive heart failure is considered possible when there is progressive shortness of breath on lying down or at night, improving on sitting up AND any of the following signs or symptoms: swelling of feet, distension of abdomen, progressive cough

16
10.50 Effort Angina with documented Ischemia
PURE Adjudication Code
Event Type Acceptable ICD-10 codes
10.51: Definite Stress test with ECG with new ST depression >1 mm or positive imaging (ECHO, Scan) compatible with ischemia
I20
10.52: Probable Typical effort angina (i.e. Squeezing, pressure or burning type pain touching the sternum occurring on exertion and relieved by rest or nitroglycerin)
10.60 Unstable Angina
PURE Adjudication Code
Event Type Acceptable ICD-10 codes
10.61: Definite 1. Hospitalization for typical symptoms with new ECG changes (T wave inversion < 2mm) OR
2. Coronary revascularization within one week of admission, and treated as unstable angina.
I20 10.62: Probable 1. Hospitalization for typical symptoms lasting at least 10
but less than 20 minutes without ECG or cardiac enzyme elevation
10.63: Possible Not hospitalized for typical symptoms of angina occurring at rest and treated as unstable angina: rest, anti-platelets, nitrates, beta blockers and/or calcium channel blockers.

17
10.80 Other Non-Fatal Cardiovascular Events
PURE Adjudication Code
Event Type Acceptable ICD-10 codes
10.81 Rheumatic Heart Disease I01, I05-I09
10.82 Other valvular heart diseases (excluding Rheumatic Heart Disease)
I34-I37
10.83 Pericarditis I30, I31, I32
10.84 Endocarditis I33, I38
10.85 Myocarditis I40
10.86 Congenital heart disease Q20-Q28
10.87 Atrial fibrillation/flutter Atrial Fibrillation and Flutter are due to an abnormal cardiac rhythm at the atrial level, and the diagnosis is made on the electrocardiographic (ECG) tracing or monitor.
I48
10.88 Peripheral artery disease (lower limb iliac to popliteal and carotid)
I73
10.90 Pulmonary embolism I26
10.91 Other cardiac or arterial diseases: Specific details should be provided on the corresponding Adjudication Form
Any ‘I’ (Cardiovascular) ICD-10 code not classified above

18
Dietary assessment method:
Participants’ food intake was measured using country specific food frequency questionnaire. The number of food items in the FFQs varied from 95-250 items. Participants were asked “during the past year, on average, how often have you consumed the following foods or drinks” and the list of food items was given. For almost all countries, FFQs had the same format and frequencies of consumption ranging from never to more than 6 times/day. Seasonal variation of fruit and vegetable consumption was captured by most FFQs. To compute daily nutrient intake, country-specific food databases listing nutrient values for each food item listed in the FFQ were constructed. Since the tools were designed for use in an international study, a food composition database containing nutrient estimates was developed allowing comparisons among the PURE countries (3). Briefly, the nutrient database was constructed based on the United States Department of Agriculture (USDA) food composition database and was modified appropriately with reference to the country’s food composition tables. For seven out of 18 countries (Canada, China, India, Malaysia, South Africa, Sweden, and Turkey), country specific food composition tables were used to estimate daily energy and nutrient intake. The nutrient database has information on 43 macro and micro-nutrients. To compute the daily nutrient intake, the reported frequency of consumption for each food item was converted to daily intake and then was multiplied by the portion size. Daily food intake was converted to nutrient intake based on the food nutrient profile. All food items reported in the FFQs were used to develop main food groups. Daily intake of fruits and vegetables (excluding potatoes) was estimated based on all types consumed (raw, cooked, dried, and canned). Starchy foods included all types of bread, rice, porridge, cereal, and potatoes. Meats included all types of red meat, fish, sea-foods, and poultry. Processed foods included all types of packaged and formulated foods and beverages that contained food additives, artificial flavorings or other chemical ingredients. Mixed dishes were disaggregated into their constituent food groups, and a proportional weight was assigned to each component part. Each component was then included in the corresponding food group.

19
Figure S1. Flow chart of current analysis
Baseline Adult
(N=158,934)
Baseline FFQ
(N=148,723)
In both Adult and FFQ
(N=146,682)
N=146,646
N=143,934
N=142,704
N=135,335
Exclude participants with missing age or sex (n=36)
Exclude participants with energy <500 or >5000 (n=2,712)
Exclude participants without follow‐up data (n=1,230)
Exclude participants with baseline CHD or stroke (n=7,369)

20
Figure S2. Association between estimated %energy by nutrients and myocardial infarction and stroke (Adjusted for age, sex, education, waist hip ratio, smoking, physical activity, urban/rural, diabetes, regions, and energy intake n=135,335)

21
Figure S3. Association between estimated %energy by nutrients and CVD mortality and non-CVD mortality (Adjusted for age, sex, education, waist hip ratio, smoking, physical activity, urban/rural, diabetes, centres, regions, and energy intake n=135,335)

22
Table S1: Number of PURE participants and duration of follow up by country
Low-income countries
No. of participants at
the baseline
No. Of Pariticiapnts with valid FFQ and at least one follow up visit
Duration of follow up
Median (IQR) Bangladesh 2,936 2,837 7·4 (7·3-7·6) India 29,298 26,284 9·9 (8·6-11·7) Pakistan 2,399 2,228 5·2 (5·1-5·5) Zimbabwe 1,264 1,163 9·0 (7·4-9·3)
Total 35,897 32,512 Middle-income countries
Argentina 7,535 7,328 7·8 (6·5-9·2) Brazil 6,081 6,030 3·7 (3·2-7·3) Chile 3,583 3,520 8·6 (6·0-8·9) China 47,700 45,567 8·1 (4·7-9·8) Colombia 7,541 6,840 5·7 (3·3-8·1) Iran 6,013 5,486 6·9 ( 4·8-7·3) Malaysia 15,829 10,340 6·3 (3·4-7·4) Palestine 1,671 1,548 3·2 (3·1-3·2) Poland 2,020 2,007 7·2 (7·0-9·0) South Africa 4,700 3,699 6·7 (4·7-10·1) Turkey 4,234 3,928 6·2 (5·9-7·5)
Total 106,907 96,293 High-income countries Canada 10,462 9,691 6·8 (6·1-8·9) Sweden 4,153 4,088 8·9 (6·7-9·4) United Arab Emirates 1,499 1,350 5·8 (4·4-7·3)
Total 16,114 15,129 Total from all regions 158,918 143,934 7·36 (5·3-9·3)

23
Table S2: PURE Food frequency questionnaire validation studies
Country Validated Reference dietary method Reference Argentina Yes Multiple dietary recalls Dehghan et al. PLoS One· 2012;7(5):e37958 Brazil Yes Multiple dietary recalls Under preparation Canada Yes Multiple dietary recalls Kelemen L et al. J Am Diet Assoc. 2003
103(9):1178-84 Chile Yes Multiple dietary recalls Dehghan et al. Public Health Nutr. 2013;16
(10):1782-8. China Yes Multiple dietary recalls Zhao WH et al. Biomedical and environmental
sciences. 2010; 23(suppl.), 1-38. Colombia Yes Multiple dietary recalls Dehghan et al. J Nutr Educ Behav.
2012;44(6):609-13. Iran Yes Multiple dietary recalls Under preparation India Yes Multiple dietary recalls Iqbal R et al. Public Health Nutr. 2009;
12(1):12-18 Bharati A et al. Asia Pac J Clin Nutr 2008; 14(1):178-185. Mahajan R et al. The National Medical Journal of India vol. 26, no. 5, 2013
Malaysia Yes Multiple dietary recalls Book chapter Palestine Yes Multiple dietary recalls Under preparation Poland Yes Multiple dietary recalls Dehghan et al. J Hum Nutr Diet. 2012;
25(3):225-32 Sweden Yes Khani B et al. J Nutr. 2004, 134:1541-1545 South Africa Yes Multiple dietary recalls MacIntyre UE et al. Public health nutr. 2000;
4(1), 63-71 Turkey Yes Multiple dietary recalls Gunes eat al. J Pak Med Assoc. 2015;
65(7):756-63. UAE Yes Multiple dietary recalls Dehghan et al. Nutr J. 2005;4:18 Kuwait/UAE Yes Multiple dietary recalls Dehghan et al. Saudi Med J 2009; Vol30(1) Zimbabwe No FFQ development Development of FFQ Merchant et al. Nutr J.
2005;4:37

24
Table S3: Association between %energy by carbohydrate and clinical outcomes HR (95%CI) Q1 Q2 Q3 Q4 Q5 P for trend
Median (IQR) 46·4 (42·6, 49·0) 54·6 (52·9, 56·2) 60·8 (59·3, 62·3) 67·7 (65·7, 69·7) 77·2 (74·4, 80·7) Total mortality Model 1: Adjust for age and sex
1 0·98 (0·89-1·08) 0·90 (0·81-1·00) 1·09 (0·98-1·21) 1·36 (1·21-1·52) <0·0001
Fully adjusted model with WHR
1 1·07(0·96-1·20) 1·06(0·94-1·19) 1·17(1·03-1·32) 1·28(1·12-1·46) 0·0001
Fully adjusted model without WHR
1 1·04(0·94-1·16) 1·00(0·89-1·12) 1·12(0·99-1·26) 1·21(1·06-1·37) 0·0019
Major CVD Model 1: Adjust for age and sex
1 0·98 (0·89-1·08) 0·93 (0·84-1·04) 1·01 (0·90-1·13) 0·96 (0·85-1·08) 0·68
Fully adjusted model with WHR
1 1·0(0·90-1·12) 1·02(0·91-1·14) 1·08(0·96-1·22) 1·01(0·88-1·15) 0·6165
Fully adjusted model without WHR
1 1·00(0·90-1·11) 0·98(0·88-1·10) 1·05(0·93-1·18) 0·96(0·84-1·09) 0·78
MI Model 1: Adjust for age and sex
1 0·94(0·82-1·08) 0·85(0·73-0·99) 0·93(0·79-1·09) 0·86(0·72-1·04) 0·14
Fully adjusted model with WHR
1 0·93(0·80-1·09) 0·92(0·78-1·09) 0·99(0·83-1·18) 0·90(0·73-1·10) 0·40
Fully adjusted model without WHR
1 0·95(0·82-1·10) 0·90(0·76-1·05) 0·97(0·82-1·16) 0·85(0·70-1·03) 0·18
Stroke Model 1: Adjust for age and sex
1 1·00(0·85-1·18) 0·99(0·84-1·17) 1·09(0·92-1·29) 1·01(0·85-1·20) 0·70
Fully adjusted model with WHR
1 1·03(0·86-1·22) 1·09(0·91-1·31) 1·21(1·01-1·45) 1·11(0·92-1·35) 0·10
Fully adjusted model without WHR
1 1·00(0·84-1·18) 1·04(0·87-1·24) 1·14(0·96-1·36) 1·05(0·87-1·26) 0·38
CVD mortality Model 1: Adjust for age and sex
1 1·07 (0·91-1·27) 0·83 (0·69-1·00) 0·93 (0·77-1·13) 1·09 (0·89-1·34) 0·82
Fully adjusted model with WHR
1 1·18(0·97-1·43) 1·02(0·83-1·26) 1·11(0·88-1·38) 1·13(0·89-1·44) 0·50
Fully adjusted model without WHR
1 1·12(0·94-1·34) 0·93(0·76-1·13) 1·01(0·82-1·25) 1·02(0·81-1·28) 0·79
Non-CVD mortality Model 1: Adjust for age and sex
1 0·92(0·81-1·05) 0·95(0·84-1·09) 1·18(1·03-1·35) 1·49(1·30-1·72) <0·0001
Fully adjusted model with WHR
1 1·0(0·87-1·15) 1·09(0·94-1·27) 1·22(1·05-1·42) 1·36(1·16-1·60) <0·0001
Fully adjusted model without WHR
1 0·98(0·85-1·12) 1·04(0·90-1·20) 1·18(1·01-1·36) 1·30(1·11-1·52) <0·0001
Full model adjusted for age, sex, education, smoking, physical activity, diabetes, urban/rural, and energy intake. Center was also included as random effect and frailty models were used.

25
Table S4: Association between %energy by total fat and clinical outcomes
HR (95%CI) Q1 Q2 Q3 Q4 Q5 P for trend
Median (IQR) 10·6 (8·1, 12·6) 18·0 (16·3, 19·7) 24·2 (22·8, 25·5) 29·1 (27·9, 30·3) 35·3 (33·3, 38·3)
Total mortality Model 1: Adjust for age and sex
1 0·81(0·74-0·87) 0·66(0·60-0·72) 0·64(0·58-0·71) 0·64(0·57-0·71) <0·0001
Fully adjusted model with WHR
1 0·90(0·82-0·98) 0·81(0·73-0·90) 0·80(0·71-0·90) 0·77(0·67-0·87) <0·0001
Fully adjusted model without WHR
1 0·90(0·82-0·98) 0·83(0·75-0·91) 0·82(0·73-0·92) 0·80(0·71-0·90) 0·0002
Major CVD Model 1: Adjust for age and sex
1 0·98(0·90-1·07) 0·96(0·87-1·06) 0·93(0·84-1·05) 0·97(0·86-1·09) 0·50
Fully adjusted model with WHR
1 1·01(0·92-1·11) 1·01(0·90-1·13) 0·95(0·84-1·07) 0·95(0·83-1·08) 0·3284
Fully adjusted model without WHR
1 1·01(0·92-1·11) 1·02(0·91-1·14) 0·97(0·86-1·09) 0·97(0·86-1·10) 0·56
MI Model 1: Adjust for age and sex
1 1·00(0·85-1·16) 1·02(0·86-1·20) 0·96(0·80-1·14) 1·11(0·93-1·33) 0·33
Fully adjusted model with WHR
1 1·02(0·87-1·20) 1·08(0·90-1·29) 0·97(0·80-1·18) 1·12(0·92-1·37) 0·40
Fully adjusted model without WHR
1 1·05(0·89-1·23) 1·12(0·94-1·33) 1·03(0·85-1·24) 1·16(0·96-1·42) 0·21
Stroke Model 1: Adjust for age and sex
1 1·02(0·91-1·15) 0·90(0·78-1·04) 0·98(0·84-1·15) 0·92(0·77-1·10) 0·34
Fully adjusted model with WHR
1 1·05(0·93-1·19) 0·91(0·78-1·06) 0·95(0·79-1·13) 0·82(0·68-1·00) 0·05
Fully adjusted model without WHR
1 1·04(0·92-1·18) 0·92(0·79-1·07) 0·96(0·81-1·14) 0·86(0·71-1·04) 0·12
CVD mortality Model 1: Adjust for age and sex
1 0·80(0·68-0·95) 0·74(0·62-0·89) 0·75(0·62-0·90) 0·83(0·68-1·01) 0·08
Fully adjusted model with WHR
1 0·89(0·74-1·06) 0·92(0·75-1·12) 0·88(0·70-1·10) 0·92(0·72-1·16) 0·50
Fully adjusted model without WHR
1 0·87(0·73-1·04) 0·93(0·77-1·13) 0·91(0·74-1·12) 0·96(0·77-1·20) 0·88
Non-CVD mortality Model 1: Adjust for age and sex
1 0·81(0·74-0·89) 0·64(0·57-0·72) 0·61(0·54-0·69) 0·57(0·49-0·65) <0·0001
Fully adjusted model with WHR
1 0·91(0·82-1·01) 0·78(0·69-0·89) 0·78(0·67-0·90) 0·70(0·60-0·82) <0·0001
Fully adjusted model without WHR
1 0·91(0·82-1·00) 0·80(0·71-0·91) 0·80(0·69-0·92) 0·73(0·63-0·85) <0·0001
Full model adjusted for age, sex, education, smoking, physical activity, diabetes, urban/rural, and energy intake. Center was also included as random effect and frailty models were used.

26
Table S5: Association between %energy by total protein and clinical outcomes HR (95%CI) Q1 Q2 Q3 Q4 Q5 P for trend
Median (IQR) 10·8 (9·9, 11·5) 13·1 (12·6, 13·6) 15·0 (14·5, 15·5) 16·9 (16·4, 17·4) 19·7 (18·8, 21·4)
Total mortality Model 1: Adjust for age and sex
1 0·94(0·87-1·02) 0·81(0·74-0·90) 0·74(0·66-0·82) 0·78(0·70-0·88) <0·0001
Fully adjusted model with WHR
1 1·05(0·96-1·15) 0·92(0·82-1·03) 0·85(0·75-0·96) 0·88(0·77-1·00) 0·0030
Fully adjusted model with without WHR
1 1·06(0·97-1·16) 0·93(0·83-1·03) 0·90(0·80-1·01) 0·91(0·81-1·03) 0·0199
Major CVD Model 1: Adjust for age and sex
1 1·03(0·93-1·13) 1·08(0·97-1·20) 1·08(0·97-1·21) 0·99(0·88-1·12) 0·85
Fully adjusted model with WHR
1 1·02(0·91-1·13) 1·08(0·96-1·22) 1·09(0·97-1·24) 0·96(0·84-1·10) 0·86
Fully adjusted model with without WHR
1 1·05(0·94-1·16) 1·10(0·98-1·24) 1·13(1·00-1·28) 1·00(0·88-1·14) 0·74
MI Model 1: Adjust for age and sex
1 1·02(0·89-1·16) 1·03(0·87-1·20) 1·11(0·94-1·32) 1·08(0·90-1·30) 0·25
Fully adjusted model with WHR
1 1·04(0·89-1·20) 1·01(0·85-1·20) 1·11(0·92-1·33) 1·02(0·83-1·24) 0·67
Fully adjusted model with without WHR
1 1·07(0·93-1·24) 1·06(0·90-1·26) 1·16(0·97-1·39) 1·07(0·88-1·30) 0·36
Stroke Model 1: Adjust for age and sex
1 1·05(0·91-1·22) 1·17(1·00-1·38) 1·14(0·97-1·35) 0·96(0·80-1·14) 0·82
Fully adjusted model with WHR
1 1·01(0·86-1·19) 1·14(0·96-1·36) 1·11(0·92-1·33) 0·90(0·74-1·09) 0·47
Fully adjusted model with without WHR
1 1·02(0·87-1·20) 1·15(0·97-1·36) 1·14(0·95-1·36) 0·93(0·76-1·13) 0·77
CVD mortality Model 1: Adjust for age and sex
1 1·03(0·90-1·19) 0·85(0·71-1·02) 0·84(0·69-1·03) 0·86(0·69-1·06) 0·0501
Fully adjusted model with WHR
1 1·09(0·93-1·29) 0·89(0·73-1·10) 0·92(0·74-1·16) 0·90(0·71-1·15) 0·26
Fully adjusted model with without WHR
1 1·14(0·97-1·34) 0·95(0·77-1·16) 1·01(0·81-1·26) 0·98(0·78-1·24) 0·64
Non-CVD mortality Model 1: Adjust for age and sex
1 0·91(0·82-1·00) 0·81(0·71-0·91) 0·69(0·61-0·79) 0·76(0·66-0·87) <0·0001
Fully adjusted model with WHR
1 1·02(0·91-1·15) 0·92(0·80-1·05) 0·79(0·68-0·93) 0·85(0·73-0·99) 0·0022
Fully adjusted model with without WHR
1 1·03(0·92-1·15) 0·91(0·80-1·04) 0·83(0·72-0·96) 0·87(0·75-1·01) 0·0087
Full model adjusted for age, sex, education, smoking, physical activity, diabetes, urban/rural, and energy intake. Center was also included as random effect and frailty models were used.

27
Table S6: Association between %energy by saturated fats and clinical outcomes
HR (95%CI) Q1 Q2 Q3 Q4 Q5 P for trend
Median (IQR) 2·8 (2·0, 3·4) 4·9 (4·4, 5·5) 7·1 (6·5, 7·7) 9·5 (8·9, 10·2) 13·2 (11·9, 15·1) Total mortality Model 1: Adjust for age and sex
1 0·87(0·80-0·94) 0·74(0·67-0·80) 0·68(0·61-0·75) 0·72(0·64-0·81) <0·0001
Fully adjusted model with WHR
1 0·96(0·88-1·05) 0·92(0·83-1·02) 0·85(0·75-0·95) 0·86(0·76-0·99) 0·0088
Fully adjusted model without WHR
1 0·96(0·88-1·05) 0·93(0·84-1·02) 0·87(0·78-0·97) 0·89(0·78-1·02) 0·0277
Major CVD Model 1: Adjust for age and sex
1 1·09(1·00-1·20) 1·01(0·91-1·12) 1·01(0·91-1·13) 0·94(0·83-1·08) 0·36
Fully adjusted model with WHR
1 1·13(1·02-1·25) 1·06(0·95-1·18) 1·03(0·91-1·17) 0·95(0·83-1·10) 0·49
Fully adjusted model without WHR
1 1·13(1·03-1·25) 1·07(0·96-1·19) 1·06(0·94-1·20) 0·98(0·85-1·12) 0·80
MI Model 1: Adjust for age and sex
1 1·22(1·05-1·43) 1·12(0·95-1·32) 1·08(0·90-1·29) 1·13(0·92-1·37) 0·53
Fully adjusted model with WHR
1 1·28(1·08-1·51) 1·20(1·00-1·44) 1·16(0·95-1·41) 1·17(0·94-1·45) 0·40
Fully adjusted model without WHR
1 1·31(1·12-1·54) 1·23(1·03-1·46) 1·21(1·00-1·46) 1·22(0·99-1·51) 0·16
Stroke Model 1: Adjust for age and sex
1 1·08(0·96-1·22) 1·00(0·87-1·15) 0·98(0·84-1·15) 0·84(0·69-1·02) 0·16
Fully adjusted model with WHR
1 1·10(0·97-1·25) 1·01(0·87-1·17) 0·93(0·78-1·11) 0·79(0·64-0·98) 0·0498
Fully adjusted model without WHR
1 1·09(0·96-1·24) 1·01(0·87-1·17) 0·96(0·81-1·14) 0·80(0·65-0·99) 0·08
CVD mortality Model 1: Adjust for age and sex
1 0·95(0·81-1·11) 0·78(0·66-0·93) 0·85(0·71-1·02) 0·75(0·61-0·94) 0·0064
Fully adjusted model with WHR
1 1·04(0·87-1·24) 0·95(0·78-1·17) 0·99(0·79-1·23) 0·83(0·65-1·07) 0·20
Fully adjusted model without WHR
1 1·05(0·89-1·24) 0·97(0·80-1·17) 1·03(0·84-1·27) 0·88(0·69-1·12) 0·43
Non-CVD mortality Model 1: Adjust for age and sex
1 0·84(0·77-0·93) 0·73(0·65-0·81) 0·62(0·55-0·70) 0·70(0·60-0·81) <0·0001
Fully adjusted model with WHR
1 0·94(0·84-1·04) 0·91(0·81-1·03) 0·78(0·68-0·91) 0·86(0·73-1·01) 0·0108
Fully adjusted model without WHR
1 0·94(0·85-1·04) 0·92(0·82-1·03) 0·81(0·71-0·93) 0·89(0·76-1·04) 0·0255
Full model adjusted for age, sex, education, smoking, physical activity, diabetes, urban/rural, and energy intake. Center was also included as random effect and frailty models were used.

28
Table S7: Association between %energy by monounsaturated fats and clinical outcomes HR (95%CI) Q1 Q2 Q3 Q4 Q5 P for trend
Median (IQR) 3·4 (2·4, 4·0) 5·4 (5·0, 5·9) 7·3 (6·8, 7·8) 9·5 (8·9, 10·1) 12·5 (11·5, 13·8)
Total mortality Model 1: Adjust for age and sex
1 0·90(0·84-0·97) 0·77(0·70-0·83) 0·67(0·60-0·74) 0·67(0·60-0·75) <0·0001
Fully adjusted model with WHR
1 1·02(0·93-1·11) 0·91(0·82-1·00) 0·81(0·72-0·91) 0·81(0·71-0·92) <0·0001
Fully adjusted model without WHR
1 1·01(0·93-1·10) 0·92(0·83-1·01) 0·82(0·73-0·92) 0·82(0·73-0·93) 0·0002
Major CVD Model 1: Adjust for age and sex
1 1·03(0·94-1·13) 1·06(0·96-1·17) 0·99(0·88-1·10) 0·97(0·86-1·10) 0·61
Fully adjusted model with WHR
1 1·04(0·94-1·15) 1·06(0·95-1·18) 1·02(0·90-1·15) 0·95(0·84-1·09) 0·54
Fully adjusted model without WHR
1 1·05(0·96-1·16) 1·08(0·97-1·20) 1·03(0·92-1·16) 0·98(0·86-1·11) 0·77
MI Model 1: Adjust for age and sex
1 1·10(0·95-1·26) 1·12(0·96-1·30) 0·99(0·83-1·18) 1·09(0·91-1·31) 0·62
Fully adjusted model with WHR
1 1·09(0·93-1·28) 1·13(0·95-1·34) 1·04(0·86-1·25) 1·12(0·92-1·38) 0·40
Fully adjusted model without WHR
1 1·14(0·98-1·33) 1·17(0·99-1·38) 1·07(0·89-1·28) 1·15(0·95-1·40) 0·31
Stroke Model 1: Adjust for age and sex
1 1·03(0·91-1·18) 1·03(0·90-1·19) 0·99(0·85-1·16) 0·93(0·78-1·11) 0·47
Fully adjusted model with WHR
1 1·03(0·90-1·18) 1·00(0·86-1·16) 0·99(0·83-1·17) 0·85(0·70-1·03) 0·10
Fully adjusted model without WHR
1 1·03(0·90-1·18) 1·01(0·87-1·17) 0·99(0·84-1·17) 0·88(0·73-1·06) 0·22
CVD mortality Model 1: Adjust for age and sex
1 0·98(0·85-1·14) 0·89(0·76-1·05) 0·83(0·69-0·99) 0·75(0·61-0·92) 0·0037
Fully adjusted model with WHR
1 1·07(0·90-1·26) 0·98(0·81-1·18) 0·90(0·73-1·12) 0·85(0·66-1·09) 0·10
Fully adjusted model without WHR
1 1·06(0·91-1·25) 1·00(0·84-1·20) 0·95(0·78-1·17) 0·88(0·70-1·11) 0·25
Non-CVD mortality Model 1: Adjust for age and sex
1 0·87(0·79-0·96) 0·70(0·63-0·78) 0·61(0·54-0·70) 0·63(0·55-0·73) <0·0001
Fully adjusted model with WHR
1 1·0(0·90-1·11) 0·86(0·76-0·97) 0·77(0·67-0·89) 0·79(0·68-0·93) 0·0003
Fully adjusted model without WHR
1 0·99(0·90-1·10) 0·87(0·77-0·97) 0·78(0·68-0·90) 0·81(0·70-0·94) 0·0005
Full model adjusted for age, sex, education, waist hip ratio, smoking, physical activity, diabetes, urban/rural, and energy intake. Center was also included as random effect and frailty models were used.

29
Table S8: Association between %energy by polyunsaturated fats and clinical outcomes
HR (95%CI) Q1 Q2 Q3 Q4 Q5 P for trend
Median (IQR) 2·1 (1·6, 2·5) 3·3 (3·1, 3·6) 4·4 (4·1, 4·7) 5·7 (5·4, 6·2) 8·5 (7·5, 10·4)
Total mortality Model 1: Adjust for age and sex
1 0·83(0·76-0·90) 0·75(0·69-0·82) 0·72(0·66-0·79) 0·64(0·59-0·71) <0·0001
Fully adjusted model with WHR
1 0·92(0·84-1·01) 0·87(0·79-0·96) 0·85(0·77-0·94) 0·80(0·71-0·89) <0·0001
Fully adjusted model with without WHR
1 0·90(0·83-0·98) 0·86(0·78-0·94) 0·85(0·77-0·93) 0·82(0·74-0·91) 0·0001
Major CVD Model 1: Adjust for age and sex
1 0·98(0·89-1·08) 0·97(0·88-1·08) 0·96(0·86-1·06) 0·98(0·88-1·08) 0·56
Fully adjusted model with WHR
1 1·01(0·91-1·11) 0·99(0·89-1·10) 0·97(0·87-1·09) 1·01(0·90-1·14) 0·94
Fully adjusted model without WHR
1 1·01(0·92-1·12) 1·01(0·91-1·12) 0·99(0·89-1·10) 1·05(0·94-1·17) 0·61
MI Model 1: Adjust for age and sex
1 0·99(0·85-1·16) 0·99(0·85-1·17) 0·95(0·80-1·11) 1·06(0·90-1·24) 0·65
Fully adjusted model with WHR
1 1·02(0·86-1·21) 1·05(0·88-1·25) 0·98(0·82-1·17) 1·12(0·93-1·34) 0·40
Fully adjusted model without WHR
1 1·03(0·88-1·22) 1·04(0·88-1·23) 0·98(0·83-1·17) 1·16(0·97-1·38) 0·19
Stroke Model 1: Adjust for age and sex
1 0·94(0·83-1·07) 0·95(0·82-1·09) 0·95(0·83-1·10) 0·93(0·80-1·08) 0·41
Fully adjusted model with WHR
1 0·96(0·84-1·09) 0·94(0·81-1·08) 0·95(0·81-1·11) 0·92(0·78-1·09) 0·30
Fully adjusted model without WHR
1 0·96(0·84-1·09) 0·96(0·83-1·11) 0·97(0·83-1·12) 0·94(0·80-1·11) 0·52
CVD mortality Model 1: Adjust for age and sex
1 0·87(0·74-1·03) 0·81(0·68-0·97) 0·73(0·62-0·88) 0·83(0·70-0·98) 0·01
Fully adjusted model with WHR
1 0·99(0·82-1·19) 0·88(0·72-1·07) 0·81(0·67-0·99) 0·94(0·76-1·15) 0·20
Fully adjusted model without WHR
1 0·98(0·83-1·17) 0·91(0·76-1·09) 0·87(0·72-1·05) 1·02(0·84-1·24) 0·70
Non-CVD mortality Model 1: Adjust for age and sex
1 0·81(0·74-0·90) 0·73(0·65-0·81) 0·72(0·65-0·80) 0·58(0·52-0·66) <0·0001
Fully adjusted model with WHR
1 0·90(0·80-1·0) 0·86(0·76-0·96) 0·88(0·78-0·99) 0·75(0·65-0·86) 0.0002
Fully adjusted model without WHR
1 0·87(0·79-0·97) 0·84(0·75-0·94) 0·86(0·76-0·96) 0·76(0·67-0·86) 0·0001
Full model adjusted for age, sex, education, waist hip ratio, smoking, physical activity, diabetes, urban/rural, and energy intake. Center was also included as random effect and frailty models were used.

30
Table S9 Five top food contributors of nutrients by country Country Carbohydrates Protein Total fat Saturated fat Monounsaturated fat Polyunsaturated fat
Argentina White bread, Factura
Bizocho, Bread with Chicharron, White rice, soft drink
Beef, steak, Beef stew, Chicken with and without skin, White bread
Beef steak, Red meat stew, Butter, Factura, Bizocho, Butter
Beef steak, Butter, Beef stew, Fresh cheese, Hard cheese
Beef steak, Butter, Red meat stew , Bizocho/ Bread with Chicharron, Factura
Mayonnaise, White bread, Bread with Chicharron, Cracker
Bangladesh White rice, Beans, Lentils,
Jau, Banana White rice, Beans, Lentils, Dried fish, Whole milk, Shrimp
White rice, Eggs, Whole milk, Shingara, Peanuts
Whole milk, Sambosa, Eggs, White rice, Paratha,
White rice, Eggs, Whole milk, Peanuts, Cookies
White rice, Sambosa, Peanuts, Eggs, Dried Shutki
Brazil White rice, Whole wheat
bread, Beans, Banana, White bread
Red meat, Meat stew, Chicken without skin, Whole Milk, White rice
Red Meat, Whole Milk, Margarines, Chicken with skin, Biscuits
Red meat, Whole Milk, Butter, Low fat milk, Margarine
Red meat, Margarines, Whole milk, Meat stew, Chicken with skin
Margarines, Fried fish, Chicken with skin, Biscuits, Whole milk
Canada White bread, Whole wheat
cereal, Boiled rice, Banana, Soft drink
Roasted Chicken, Milk (1% & 2%fat), Steak, Baked Fish
Milk (1%& 2%fat), Roasted Chicken, Meat stew, Steak
Milk (1%& 2%fat), Cheese, Steak, Meat stew
Meat stew, Roasted Chicken, Milk (2%fat), Baked Fish, Steak
Roasted Chicken, Baked Fish, Tofu, Meat stew, Fried Chicken
Chile White bread, Rice, Potatoes,
Cereals, Pasta White bread , Red meat, Chicken without skin, Bean
Margarines, Earthen with cow meat, Avocado, sausages, white bread
Margarine, Sausages , Earthen with cow meat, Yogurt, whole milk
Margarine, Avocado , Sausages, Earthen with cow meat, white bread
White bread , Margarine Mayonnaise, Avocado, cooked cereal
China Rice, Wheat Flour, Millet,
Cake, Vegetables
Pork ( muscle), Wheat Flour, Rice, Chicken Eggs, Fish
Pork meat (Fat and muscle), Chicken Eggs, Sunflower seed, Whole milk, Fried flour
Pork meat (Fat and muscle), Chicken Eggs, Whole milk Pork( muscle), Fried flour
Pork meat (fat and muscle), Eggs, Peanut, Whole milk, Sunflower seeds
Sunflower seed, Walnut, Peanut, Fried Tofu, Fried flour
Colombia Cereal, White rice, White
bread, Aguadepanela
Sancocho soup
Red meat, Cereal, Chicken without skin, Chicken with skin, Fried fish
Whole milk,
Fried Eggs, platano, Red meat, Egg potato caldo soup, Chicken with skin
Whole milk, Cheese, Egg potato caldo soup, Red meat, Eggs
Eggs , Red meat, Whole milk, Chicken with skin, Avocado
Fried platano, Cereal, Eggs, Chicken with skin, White bread
Iran White bread, Rice, Whole
wheat bread, Cubed sugar, Sabzipolo
Minced meat with fat, Yogurt, Chicken without skin, Lamb low fat, White bread
Kotlet, Feta cheese, Olive oil, Minced, meat with fat, Walnut
Feta cheese, Yogurt, Lamb with fat, Abgoosht, Minced meat with fat
Olive oil, Kotlet,, Minced meat with fat, Abgoosht, Lamb with fat
Walnut, Kotlet, Mayonnaise, Sabzipolo, Koko Sabzi

31
Table S9 Five top food contributors of nutrients by country Country Carbohydrates Protein Total fat Saturated fat Monounsaturated fat Polyunsaturated fat
Palestine Occupied Territory
White bread, Hummus, White rice, Whole Wheat Bread, Soft drink
Chicken with and without skin, Hummus, White bread, Red meat
Zaatar Manakeesh,
Olive oil, Chicken, Hummus, Ice cream
White cheese, Yogurt, Ice cream, Arabic sweet, Chocolate
Zaatar Manakeesh,
Olive oil, Chicken without skin, Zaatar, Chicken with skin
Hummus, Tabooleh, Fried fish, Zaatar, Seeds (sunflower, watermelon)
Pakistan
Chapatti (with or without oil), Tea, Lassi, Cake
Tea, Lassi, Biryani Chapatti (with or without oil), Biryani
Chicken curry Tea, ,Mutton/beef curry, Lassi, Biryani
Mutton/beef curry, Tea, Biryani, Lassi Yogurt/Raita
Cake rusk , Lassi Chicken curry Mutton/beef curry, Tea,
Chicken curry, Biscuits, Paratha Chapatti (with oil), Cake rusk
Malaysia (UiTM)
Cooked rice, Fried rice, Cokodok, pisang, Nasi lemak, Sugar
Fried fish, Chicken in soy sauce, Fried Chicken, Cooked rice, Fried rice
Fish sambal, Fried chicken, Noodle, Curry, Fried rice
Fish curry, Fried eggs, Fried chicken, Fried rice, Condensed milk
Fried chicken, Noodle, yong tau fu, Fried eggs, Fried fish, Nugget
Fried fish, Soybean curd, Fish curry, Fried chicken, Noodle, yong tau fu
Malaysia (UKM)
White rice, Glutinous rice, Fried rice, Roti canai, Fried wheat flour
Fried chicken,
Fried fish, Noodles, yong tau foo, Tomyan, Lemon grass soup, Fried rice
Fried chicken, Fried rice, Noodles, yong tau foo, Noodle, Curry, Fried fish
Noodles, yong tau foo, Fish curry,
Fried rice, Fried chicken, Eggs (Fried, boiled)
Eggs (Fried, boiled), Avacado, Fried chicken, Noodles, yong tau foo, Tomyan, Lemon grass soup
Soybean curd, Noodles, yong tau foo, Fried fish, Fish curry, Fried chicken
United Arab Emirates
White rice, Fresh dates, Khubz (white), Samek maglee, Fruit Juice
Grilled Fish, Samek maglee, Fish curry/Saloona, Chicken without skin, Red meat
Samek maglee,
Grilled fish, Vegetable marag, Peanut, Fish curry/Saloona
Samek maglee, Whole milk, Red meat, Arabic sweet, Fried fish
Cashew nut, Peanut,
Olives, Samek maglee, Grilled fish
Samek maglee,
Vegetable marag,
Grilled Fish, Walnut, Peanut
Zimbabwe
Sadza made from maize, Mealie, Sweet potato, Sugar cane, Mango
Sadza made from maize, Fish soup, Mealie, Chicken with skin, caterpillar
Sadza, made from maize, Red meat, meat stew , Peanut butter, Avocado
Red meat, Meat stew, Sadza made from maize, Margarine, Avocado
Red meat, Meat stew, Avocado, Peanut butter, Sadza made from maize
Peanut butter, Nuts, Sadza made from maize, Avocado, Margarine
India: Bangalore Urban
Plain rice, Ragi ball, Chapatti, Tea, Sambar
Plain rice, Sambar, Coffee, Tea, Chapatti
Potato Bajji, Coffee, Tea, Sambar, Mixture
Coffee, Tea, Curds, Plain milk, Coconut chutney
Coffee, Tea, Potato Bajji, Nuts, Sambar
Potato Bajji,, Sambar, Mixture, Rasam, Dosa

32
Table S9 Five top food contributors of nutrients by country Country Carbohydrates Protein Total fat Saturated fat Monounsaturated fat Polyunsaturated fat
India: Bangalore Rural
Ragi Ball (mixed with rice), Plain rice, Sugarcane, Lime rice, Idli
Ragi Ball (mixed with rice), Plain rice, Tea, Groundnut Chutney, Plain thur dhal Sambar
Groundnut Chutney, Tea, Ragi Ball (mixed with rice), Mixture (Khara Bondi), Nuts
Tea, Buttermilk, Milk, Coffee, Ragi Ball (mixed with rice)
Groundnut Chutney, Nuts, Tea, Ragi Ball (mixed with rice), Mixture (Khara Bondi)
Mixture (Khara Bondi),Tamarind Rasam, Groundnut Chutney, Uppma,
Ragi Ball (mixed with rice)
India: Trivandrum Rice, Puttu
(Rice/Wheat/Rava), Tea, Dosa, Banana
Rice, Fish curry, Tea, Puttu (Rice/Wheat/Rava), Fish fry
Fish curry, Tea, Fish fry, Puttu (Rice/Wheat/Rava), Ladies finger (cooked)
Puttu (Rice/Wheat/Rava), Fish curry, Tea, Drumstick, Aviyal
Nuts, Tea, Tomato curry, Fish fried, Fish curry
Fish fied, Ladies finger (cooked), Tomato curry, Dosa, Vada
India: Chennai Urban Plain rice (parboiled),
Idly, Chapatti, Plain dosa Plain rice (parboiled), Coffee, Tea, Chapatti
Plain dosa, Coffee, Tea, Curds, Uppma
Coffee, Tea, Curds, Coconut chutney, Plain dosa
Plain dosa, Coffee, Tea, Pongal, Uppma
Plain dosa, Uppma, Lime rice, Chapatti, Pongal
India: Chennai Rural Rice (parboiled),
Idly, Rice cooked, Dosai, Coffee
Rice (parboiled), Idly, Coffee, Chicken curry, Dosai
Dosai, Upma, Coffee, Egg omelette, Potato chips
Dosai, Coffee, Egg omelette, Mutton curry, Sambar with vegetables
Dosai, Egg omelette, Coffee, Nuts, Sambar with vegetables
Upma, Potato chips, Dosai, Nuts, Rice (parboiled)
India: Chandigarh Urban Chapatti with or without
ghee, Tea, Namkeen Dalia, Vegetable Pulao
Chapatti with or without ghee, Tea, Milk, Rajmah
Tea, Chapatti with or without ghee, Milk, Paneer gravy
Tea, Chapatti with ghee, Milk, Curd, Paneer gravy
Tea, Chapatti with ghee, Milk, Paneer gravy, Curd
Chapatti with or without ghee, Kofta curry, Saboot mong, Plain paranth
India: Chandigarh Rural Chapatti with ghee,
Chapatti (dry), Tea, Makki roti, Kheer
Chapatti with ghee, Tea, Chapatti (dry), Milk, Dhal with husk
Tea, Chapatti with ghee, Milk, Malpua, Lassi namkeen
Tea, Chapatti with ghee, Milk, Lassi namkeen, Dhal with husk
Tea, Chapatti with ghee, Milk, Lassi namkeen, Malpua
Malpua, Chapatti with ghee, Sweet mathi, Puri, Namkeen matthi

33
Table S10 Nutrient intake reported by previous cohort studies
Table S11 Percent energy by carbohydrate intake by region
<50%E >50 to <60%E 60 to 70%E >70% Overall (n= 135,335 ) 23,242 (17·2) 40,844 (30·2) 38,299 (28·3) 32,950 (24·4) China (n=42,152) 2,326 (5·5) 7,279 (17·3) 14,605 (34·7) 17,942 (42·6) S Asia (n=29,560) 2,265 (7·7) 7,982 (27·0) 9,510 (32·2) 9,803 (33·2) Europe/North America (n= 14,916) 5,916 (39·7) 6,352 (42·6) 2,420 (16·2) 228 (1·5) South America (n=22,626 ) 5,764 (25·5) 7,016 (31·0) 6,562 (29·0) 3,284 (14·5) Middle East (n= 11,485) 3,368 (29·3) 6,026 (52·5) 1,983 (17·3) 108 (0·9) South East Asia (n=10,038) 3,043 (30·3) 4,847 (48·3) 1,881 (18·7) 267 (2·7) Africa (n= 4,558) 560 (12·3) 1,342 (29·4) 1,338 (29·4) 1,318 (28·9)
Q1 Q3 Q5 Health Professional Follow up study (4) %E by SFA 6.8 10.3 14.2 %E by Carbohydrates 55.6 47.7 41.4 %E by protein 18.2 18.4 18.8 Total energy 1878 1986 2068 The Nurses’ Health Study (4) %E by SFA 8.0 11.9 17.9 %E by Carbohydrates 53.6 45.8 34.7 %E by protein 18.1 18.6 19.4 Total energy 1380 1467 1631 EPIC study NL (5) %E by SFA 11.2 15.6 20.8 %E by Carbohydrates 47.7 43.3 39.0 %E by protein 17.4 16.6 15.9 Total energy NA NA NA

34
Table S12 Association between nutrients (%E) with total mortality adjusted for various index of SES
HR (95%CI) Q1 Q2 Q3 Q4 Q5 P for trend
Median (IQR) 46·4 (42·6, 49·0) 54·6 (52·9, 56·2) 60·8 (59·3, 62·3) 67·7 (65·7, 69·7) 77·2 (74·4, 80·7) %E by carbohydrate 1. Fully adjusted model with household income
1 1·06(0·95-1·18) 1·01(0·90-1·15) 1·12(0·99-1·27) 1·26(1·10-1·44) <0·0001
2.Fully adjusted model with household wealth
1 1·04(0·94-1·15) 1·00(0·90-1·12) 1·13(1·00-1·27) 1·27(1·12-1·44) <0·0001
3.Fully adjusted model with education
1 1·07(0·96-1·20) 1·06(0·94-1·19) 1·17(1·03-1·32) 1·28(1·12-1·46) <0·0001
4. Fully adjusted model with country income level
1 1·04(0·94-1·16) 1·00(0·89-1·12) 1·14(1·01-1·28) 1·29(1·14-1·46) <0·0001
%E by saturated fatty acid
Median (IQR) 2·8 (2·0, 3·4) 4·9 (4·4, 5·5) 7·1 (6·5, 7·7) 9·5 (8·9, 10·2) 13·2 (11·9, 15·1)
1.Fully adjusted model with household income
1 0·96(0·88-1·05) 0·92(0·83-1·02) 0·86(0·76-0·99) 0·89(0·77-1·01) <0·0001
2.Fully adjusted model with household wealth
1 0·95(0·87-1·03) 0·89(0·81-0·98) 0·84(0·75-0·94) 0·84(0·73-0·96) <0·0001
3.Fully adjusted model with education
1 0·96(0·88-1·05) 0·92(0·83-1·02) 0·85(0·75-0·95) 0·86(0·76-0·99) <0·0001
4.Fully adjusted model with economic level of the country
1 0·92(0·84-1·00) 0·90(0·78-0·95) 0·80(0·72-0·90) 0·81(0·72-0·93) <0·0001
Model 1: Full model adjusted for age, sex, household income, waist hip ratio, smoking, physical activity, diabetes, urban/rural, and energy intake. Center was also included as random effect and frailty models were used. Model 2: Full model adjusted for age, sex, household wealth, waist hip ratio, smoking, physical activity, diabetes, urban/rural, and energy intake. Center was also included as random effect and frailty models were used. Model 3: Full model adjusted for age, sex, education, waist hip ratio, smoking, physical activity, diabetes, urban/rural, and energy intake. Center was also included as random effect and frailty models were used.
Model 4: Full model adjusted for age, sex, economic level of the country, waist hip ratio, smoking, physical activity, diabetes, urban/rural, and energy intake. Center was also included as random effect and frailty models were used.

35
References
1. Corsi DJ, Subramanian SV, Chow CK, McKee M, Chifamba J, Dagenais G, et al. Prospective Urban Rural Epidemiology (PURE) study: Baseline characteristics of the household sample and comparative analyses with national data in 17 countries. Am Heart J 2013 Oct;166(4):636-46.
2. Craig CL, Marshall AL, Sjostrom M, Bauman AE, Booth ML, Ainsworth BE, et al. International physical activity questionnaire: 12-country reliability and validity. Med Sci Sports Exerc 2003 Aug;35(8):1381-95.
3. Merchant AT, Dehghan M, Chifamba J, Terera G, Yusuf S. Nutrient estimation from an FFQ developed for a Black Zimbabwean population. Nutr J 2005;4:37.
4. Wang DD, Li Y, Chiuve SE, Stampfer MJ, Manson JE, Rimm EB, et al. Association of Specific Dietary Fats With Total and Cause-Specific Total mortality. JAMA Intern Med 2016 Aug 1;176(8):1134-45.
5. Praagman J, de Jonge EA, Kiefte-de Jong JC, Beulens JW, Sluijs I, Schoufour JD, et al. Dietary Saturated Fatty Acids and Coronary Heart Disease Risk in a Dutch Middle-Aged and Elderly Population. Arterioscler Thromb Vasc Biol 2016 Sep;36(9):2011-8.