Embed Size (px)
Citation preview
1
SUPPLEMENTARY APPENDIX
An approach to personalized cell therapy in chronic complete paraplegia: The Puerta de Hierro
phase I/II clinical trial
JESÚS VAQUERO, MERCEDES ZURITA, MIGUEL A RICO, CELIA BONILLA, CONCEPCION
AGUAYO, JESÚS MONTILLA, SALVADOR BUSTAMANTE, JOAQUIN CARBALLIDO,
ESPERANZA MARIN, FRANCISCO MARTINEZ, AVELINO PARAJON, CECILIA FERNANDEZ &
LAURA DE REINA, for the Neurological Cell Therapy Group*
Neurosurgery Service, Department of Surgery (J.V., A.P., C.F., L.R.); Neurological Cell Therapy Unit (J.V., M.Z., C.B., M.A.R., C.A.); Rehabilitation Service (J.M.); Urology Service (S.B., J.C.); and Clinical Neurophysiology Service (E.M., F.M.). Hospital Puerta de Hierro-Majadahonda and Autonomous University, Madrid, Spain. Address reprint requests to Dr. Jesús Vaquero, at Hospital Puerta de Hierro-Majadahonda, Joaquin Rodrigo, 2. 28222-Majadahonda, Madrid, Spain, or to [email protected].

2
SUPPLEMENTARY APPENDIX ___________________________________________________________________
List of Investigators 3
Preclinical Experience 4
Clinical Overview 6
Supplementary Information on the Clinical Trial 8
Selection and Exclusion Criteria 8
Clinical Explorations 9
Data of Enrolled Patients 10
Clinical and Demographic Data 11
Patients Flow Chart 12
Information Gathering 12
Statistical Analysis 13
Data about the Cell Therapy Medicament 13
Culture of MSCs 15
Formulation and Packaging 16
Phenotypic Characterization of MSCs 16
Summary of Treatment 17
Surgical Planning 18
Results: Supplementary Data, Tables and Figures 24
Adverse Events 24
ASIA Scores 26
IANR-SCIFRS Scale 38
FIM and Barthel Scales 57
Visual Analog Scale (VAS) 58
Penn and modified Ashworth Scales 59
Geffner Scale 61
NBD Scale 62
Supplementary Clinical Observations 66
Neurophysiological Studies 67
Urodynamic Studies 72
Neuroimage Studies 75
Supplementary Conclusions of the Study 80
Supplementary Appendix References 83
________________________________________________

3
List of Investigators
The Neurological Cell Therapy Group (NCTG)
This study is a result of the utilization of human and material resources of Hospital Puerta
de Hierro-Majadahonda. This hospital belongs to the Spanish Public Health System and is
characterized by high technology and advances in the field of organ transplantation
research. The following researchers are part of the NCTG:
Service of Neurosurgery and Neurological Cell Therapy Unit: Jesús Vaquero, Mercedes Zurita, Celia Bonilla, Miguel A. Rico, Concepción Aguayo, Alicia Rodríguez, Paula Martínez, Marta V. Fernández, Avelino Parajón, Cecilia Fernández, Laura de Reina, Carlos Cotua, Juan M. Revuelta, Saab Anwar, Sofía Santiño, Alicia Madrid, and Montaña Mariscal. Service of Clinical Neurophysiology: Esperanza Marín, Francisco Martínez, Luis F. López-Pájaro, Alberto Pérez de Vargas, Edwin E. Ebrat, Marta Vaquero, Dolores Canales, and Flor Domingo. Service of Urology: Salvador Bustamante, Joaquin Carballido, David Vazquez, Javier Saenz, and Rosario Serrano. Service of Radiology: Gertrudis Saucedo. Service of Rehabilitation: Jesús Montilla, Noemi Tapiador, Marta Sevilla, and C. Morejón. Service of Hematology: Rafael Cabrera, Carmen Regidor, Guiomar Bautista, and Jose Luis Bueno. Service of Anesthesiology: Inmaculada Mourelle, Elena Navarro, Manuel Arcas, Carmen Sánchez, and Paula Rey. Service of Psychiatry: Luis Martínez, Pedro García, and María Martín. Service of Nuclear Medicine: Jorge Mucientes, and Begoña Rodríguez. Collaborators from External Rehabilitation Centres: Eduardo Pol, Natacha León, Jose M. García, Mónica García, Joan Romero, Ricardo Fenollar, Bartolomé Puerta, Noelia Zagalaz, Luis Baños, Tania Martínez, and Irune Lekuona.

4
Preclinical experience
This clinical trial emerges as the need to move to human clinic our preclinical studies
conducted in the last 20 years, at the Hospital Universitario Puerta de Hierro-
Majadahonda. In the late 90s some authors began to obtain experimental evidence that it
was possible to obtain functional recovery in the acute phase after a traumatic spinal cord
injury (SCI), by intralesional transplantation of mesenchymal stromal cells (MSCs)
obtained from bone marrow stroma 1, 2. These cells in culture are isolated from the
mononuclear fraction of all bone marrow cells and represent a population of
undifferentiated cells which do not express progenitor hematopoietic markers themselves,
such as CD14, CD19, CD34, CD45, or CD79, but do show positivity to CD73, CD90,
CD105 and CD106 3, 4.
We now know that bone marrow MSCs has a significant immunomodulatory effect and
express low antigen expression of major histocompatibility complex class II, so they have
low antigenicity, which is one of its main advantages when planning to use in cell therapy
protocols. In addition to this, characteristically have a high expression of growth factors,
cytokines and extracellular matrix molecules (fibronectin, laminin, collagen and
proteoglycans) which, under normal conditions, contribute to the formation and function of
marrow stromal microenvironment inducing regulatory signals, not only for the own MSCs,
but also to hematopoietic stem cells.
The line of research that has led to raise the present study was initiated by our group by
2000, when studies of Woodbury et al 5 and other researchers demonstrated that MSCs
from bone marrow may experience a phenomenon of transdifferentiation in vitro if the
culture medium is treated with various chemicals, resulting in cells with adult neural
aspect. Diverse authors question even now this transdifferentiation because
transformation of MSCs into cells with neuronal appearance could be a result of
nonspecific morphological alterations of the cell cytoskeleton, the truth is that there
evidence, both in vitro and in vivo, that really is possible transformation of the MSCs in
nerve cells, both neurons and glial cells, thus being able to regenerate nerve tissue
previously damaged as a result of a traumatic experimental injury. These observations
have been confirmed over the years by our own research group and described in our
previous publications 6-12.
The main preclinical studies of spinal cord regeneration with bone marrow MSCs were
performed in experimental models of paraplegia in rodents. The marking of MSCs by a
gene transfection, prior to transplantation, proved, in some of these experiences, that the
source of neurons and glial cells in the regenerated tissue has its origin in the
transplanted stem cells 6. These observations have been confirmed by our group in
experimental models of traumatic or hemorrhagic brain injury 10-12.

5
Coinciding with studies that suggested the possibility of a transformation of bone marrow
MSCs in nerve cells, observations were published in favor of intralesional transplantation
of these cells can recover functional deficits after incomplete spinal cord injuries 1, 2, 13-15,
and in 2004 we showed for the first time that this form of cell therapy may also be useful if
applied to SCI with complete and chronically established paraplegia 6.
According to research conducted by our group in animal models, the administration of
MSCs in chronically established paraplegia is followed in rodents by clear signs of
neurological recovery, reaching one year almost total motor recovery by more than 60% of
cases, which is associated with signs of spinal cord regeneration at the level of previously
injured area 7. After confirming that intralesional transplantation of MSCs achieved motor
recovery of paraplegic animals, we considered whether it could also be effective the
administration of these cells systemically, especially considering some publications
pointing that intravenous MSCs can reverse functional deficits in rats subjected to
traumatic brain injury 16.
As a first step, we marked the MSCs with bisbenzimide or indium-111, and conducted
studies to check the distribution of labeled cells following systemic administration. Our
results showed that after intravenous administration, the labeled MSCs colonized high
perfusion organs, such as the spleen, liver or kidney, but significantly did not reach the
area of SCI. These studies allowed us to contribute to the literature the usefulness of
isotopic labeling with Indium-111 to study the distribution of MSCs after administration in
cell therapy procedures, and led us to the conclusion that systemic administration of
MSCs does not allow these cells to arrive in significant numbers to areas of traumatic SCI,
at least in a phase of SCI chronically established 17. In a subsequent study we confirmed
the obvious superiority of the local administration of MSCs against systemic administration
18.
The good results obtained in rodents were reproduced in adult pigs "minipig" with a
chronically established paraplegia 19, 20, allowing us to assume that this technique can be
equally useful in humans and we took the necessary proof of concept to obtain from the
Spanish Agency for Medicines and Health Products (AEMPS) the authorization to perform
in our country the first clinical study of cell therapy focused on the treatment of chronically
established traumatic paraplegia. In parallel, our research team designed the first human
cell therapy medicament authorized in Spain, as a medicament for clinical investigation,
indicated for the treatment of traumatic SCI (medicament NC1, PEI No. 12-141,
authorized by resolution of the AEMPS dated 02/22/2013).

6
Clinical Overview
As a result of the experience provided to literature by our own research group and by
other researchers, in recent years it has begun implementing various techniques of cell
therapy in patients with traumatic SCI, and early clinical trials have confirmed the absence
of significant side effects 21-23. A preliminary clinical study of paraplegic patients
undergoing intralesional transplantation of mononuclear bone marrow cells was already
published in 2008, indicating clear recovery in sensitivity, motility and sphincter control
one year after the procedure 24.
However, in the present state of this research, are not clear the advantages of using
exclusively adult MSCs for these transplants, as many groups have done in preclinical
experimental studies 1, 2, 6, 7, 9, 18, 25-28 or use, as was done in most of the first clinical
experiments in humans, a mixture of MSCs and other bone marrow mononuclear cells 22,
23, 29. The advantage of either one of the two options have been discussed extensively in
recent publications from our own research group 9, 12.
Given that the MSCs represent less than 0.01% of bone marrow cells, their use in cell
therapy protocols requires manipulate these cells in high-biosafety rooms (cleanrooms) to
expand the cells and obtain a sufficient number before making the transplant, which
involves some technical complexity, and possibly this is the main argument for the use of
total bone marrow stem cells, including hematopoietic stem cell fraction. However, MSCs
has the advantage of achieving high specificity for their transdifferentiation within host
tissue, its ease of expansion, considering the efficacy of transplantation appears to be
dose-dependent, and finally, its low antigenicity, which may allow, at least theoretically,
the use of allogeneic MSCs in human clinical practice.
In any case, there are still evident unknown about the mechanisms by which this type of
cell therapy achieved neurological recovery, both in experimental animals and in the few
patients who has been treated so far. In experimental studies carried out, it is noteworthy
that the functional recovery of paraplegic animals after MSCs transplantation starts before
tissue regeneration occurs to allow the passage of ascending and descending axons 6, 7, 9,
20. Therefore, it is obvious that after transplantation must exists various repair processes,
including the release of neurotrophic factors by the transplanted stem cells 30, or the
activation of endogenous mechanisms of the spinal cord, able to partially restore
neurological functions previously abolished, as has been confirmed by our group in
experimental models of brain damage 10, 31.
Moreover, considering the experimental results by our group, suggesting the advisability
of transplanting enough cells, our efforts must be aimed at achieving the highest possible
survival of MSCss, once transplanted, and suggest that administration of repeated doses
of MSCs could be beneficial. In this regard, various studies show that stem cells derived

7
from bone marrow can reach areas of centromedular traumatic injury after being
deposited in the subarachnoid space 25-27, 32, 33, an observation that must be taken into
account when to apply these techniques in patients, and has been considered in the
design of the present study.
From the point of view of the moment of the clinical application of MSCs after SCI, we
have seen the desirability of stem cell implants are performed lazily about the time of
injury because in the weeks following spinal cord trauma can be spontaneous recovery
that could be erroneously interpreted as a result of cell therapy. On the other hand,
administration of autologous MSCs is a procedure that does not raise the desirability or
necessity of immunosuppression, which has great advantages, considering the frequent
urinary tract infections presented by patients with established SCI 12, 21, 34-38.
Regarding to the administration of bone marrow stromal cells into the subarachnoid
space, is a strategy proposed by different research groups, after finding in animal models
the superiority of this pathway to systemic administration, and after checking in several
preclinical studies that injected cells reach the area of SCI and can be effective in
achieving functional recovery in paraplegic animals, particularly rats, rabbits and dogs 32,
39-41. The experience of our group in a model of chronic paraplegia in adult minipigs19,
allowed to confirm these observations, showing that MSCs infused into subarachnoid
space reach the SCI area at 48 hours after administration, being able to achieve
functional improvement in adult pigs with complete and chronically established paraplegia
9, 42.
From the point of view of social interest, regardless of medical and scientific significance
of achieving a possible useful therapy for patients with supposedly irreversible
neurological disability, we note that one of the main objectives of this study focuses on
power to know if new cell therapy techniques, specifically the use of MSCs, can provide
an improved quality of life of patients with chronically established paraplegia.
At present, cell therapy is configured as a therapeutic promise, still subject to many
uncertainties, with significant confusion due to the disparity of protocols, selection of
subjects, cell type, dose, and routes of administration used.
On the other hand, the prospect of achieving cell therapy medicaments using allogeneic
cells to the treatment of SCI, obviously is a legitimate objective by pharmaceutical
companies, but we believe unacceptable any kind of cell therapy requiring
immunosuppression, due to repeated urinary infections that often suffer these patients.
Preclinical experience of our own research group suggests that, at least in the the nervous
system, should not be considered, unless specific situations, the use of allogeneic cells
and that in any case it is crucial to pay attention to morphology of SCI, in order to make
personalized treatments, and to numerous technical details, among which should be

8
highlighted those related to cell suspension medium, caliber of the injection needle, rate of
cell administration in the injured tissue, or to achieve a high concentration of cells in the
smallest possible volume, in order not to produce an added damage to spinal cord. These
considerations lead us to raise the need for these new techniques, at least in its current
stage of clinical investigation, will be applied only in reference centers, under strict ethical
and methodological control, and always by groups with proven preclinical experience.
Supplementary Information on the Clinical Trial
This was a prospective clinical trial. There were no controls because there was no
expectation of change in this patient population. The main objective was to evaluate
safety. The secondary objective was to assess the potential efficacy by means of clinical
scales and urodynamic, neurophysiological and neuroimaging studies.
Selection and Exclusion Criteria
Selection criteria: Patients of both sexes aged between 18 and 60 years, suffering chronic and
complete paraplegia (ASIA A) due to traumatic SCI at dorsal (thoracic) región. For the purpose of this study, it has been considered chronically established injury when there is no functional recovery after a minimum follow-up period of 6 months following the SCI.
Possibility to study, by Magnetic Resonance Image (MRI), the characteristics of SCI,
and without images suggesting spinal cord section. Possibility of follow-up after treatment and to fulfill a protocol of physical therapy
during the follow up period. Hematological parameters and creatinine, SGOT and SGPT, within the normal
range according to laboratory standards, accepting, however, slight deviations which are considered not significant in the context of the treatment to be performed.
Written informed consent, in accordance with good clinical practice guidelines and
local legislation, obtained before any study procedure. Absence in the genetic study of abnormalities that might pose a potential risk in the
process of cell expansion.
Exclusion criteria:
Pregnancy and lactation Systemic disease representing an additional risk to treatment. Patients with questions about his possible cooperation in rehabilitation treatments,
or negative report in psychological evaluation.

9
Neuroimaging data of spinal cord section. Current neoplastic disease or in the previous five years (diagnosed or treated). Patients treated with hematopoietic growth factors or requiring maintained
anticoagulation. Neurodegenerative disease. History of substance abuse, psychiatric illness or allergy to protein products used in
the process of cell expansion. Positive serology to HIV or syphilis. Active Hepatitis B or Hepatitis C. If in the opinion of the investigator were findings on physical examination, abnormal
results of laboratory tests, or other medical, social or psychosocial factors that may negatively influence the study.
Clinical explorations Psychiatric evaluation, to ensure no prior psychopathology in patients and they do
not overestimate the potential therapeutic efficacy. Clinical assessment in all patients before starting cell therapy, with study of ASIA
scale 43, in different subsections: (ASIA grade or level), motor score (MS) and
sensitivity scores (Pin Prick Score, or PPS, and Light Touch Score, or LTS). The
sum of scores in MS, PPS and LTS and sensitivity is the total ASIA score.
IANR-SCIFRS Scale44, from the "International Association of Neurorestoratology"
that values the specific functional deficit of SCI.
Scales of functional independence (FIM 45 and Barthel 46)
Visual Analog Scale (VAS) 47 for assessment of neuropathic pain.
Penn Scale48 and the modified Ashworth Scale49, to assess spasms and spasticity,
respectively.
Scale of Geffner 24, to study bladder function.
The presence of somatosensory evoked potentials (SSEPs) and motor evoked
potentials (MEPs) elicited by magnetic stimulation over the scalp, and
electromyographic (EMG) recording of potentials in infralesional muscles were
assessed. SSEPs were studied with a Medelec Synergy 10-channel equipment
(v.14.0, Viasys Healthcare, London, UK). For the study of MEPs induced by
transcranial magnetic stimulation, we used a Rapid2 Magdstim equipment
(Whitland, Wales, UK). EMG recordings were made with Medelec-SYNERGY-10
equipment.

10
Urodynamic studies, using Solar Luna equipment (Medical Measurement Systems
Inc., Dover, NH, USA) were performed, in order to objective assessment of
therapeutic efficacy in urinary function. Maximum bladder capacity at filling, detrusor
pressure and bladder compliance were assessed.
Neuroimage studies (MRI) were performed in order to confirm inclusion criteria, knowing the characteristics of the lesion and plan a personalized treatment for each patient, within the parameters defined in the clinical trial protocol. MRI was also used to evaluate possible morphological changes of spinal cord after treatment. We used a 1.5T imager (XR Intera Achieva 1.5T, Philips Healthcare, Madrid, Spain). Lesions were studied on T1- and T2-weighted images and on MR-myelography images using turbo-spin-echo sequences.
Data of Enrolled Patients
In order to collecting possible evidence of clinically significant effectiveness, we included
in this study patients with longstanding complete paraplegia. With an average of chronicity
of nearly 14 years, and the established dogma that a paraplegic patient can not achieve
any functional improvement, we considered that any sign of improvement after cell
therapy could be of great clinical significance.
The characteristics of the treated patients were as follows:
12 patients with complete paraplegia (ASIA A) chronically established. 9 men / 3 women. Age at start of treatment: between 25 and 58 years (mean ± SD: 40.5 ± 8.75 years). Chronicity of the lesion (years from the time of injury until the start of treatment):
between 3.17 and 26.75 years (mean ± SD: 13.86 ± 9.36 years). Level of injury: All patients with SCI, morphologically identifiable at dorsal level.

11
Clinical and demographic data
Clinical data are provided in the following Table:
Supplementary Table 1. Clinical Data of Patients ______________________________________________________________________
Patient Sex Age Level Instrumentation Years after SCI
______________________________________________________________________
01 M 37 D7-D8 No 4.04
02 M 25 D10-D11 Yes 3.17
03 M 55 D7-D8 No 26.75
04 M 41 D11-D12 Yes 3.20
06 F 38 D11-D12 Yes 13.77
08 F 58 D6-D7 No 17.63
11 M 36 D4 Yes 4.44
13 M 41 D3 No 23.82
14 M 43 D7-D8 Yes 25.87
15 F 36 D6-D7 No 13.83
16 M 36 D4-D5 No 7.00
17 M 40 D4 No 22.79
Supplementary Table 1. Main clinical and demographic data of the patients
enrolled in the present clinical trial.
12
Patients Flow Chart
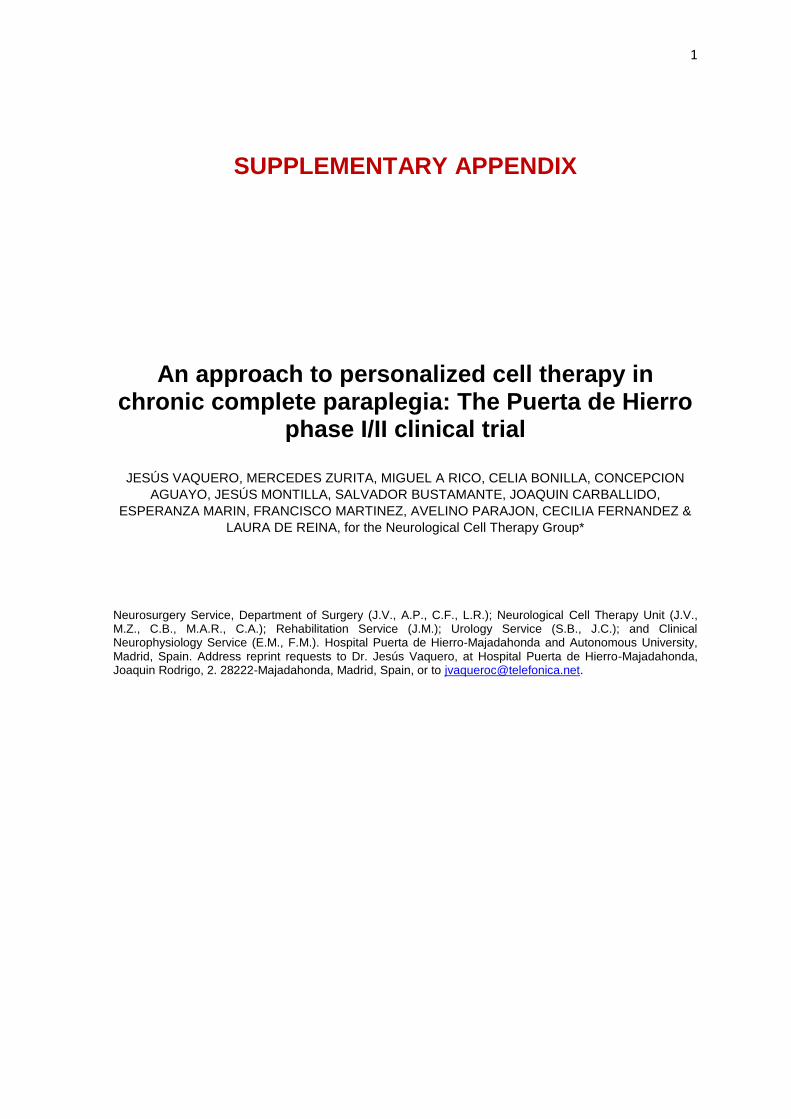
Figure S1. Flow chart of the patients.
Information Gathering
In order to collect possible adverse events and efficacy data have been established in the
study 4 sources of information:
Weekly collection of information through contact of researchers with patients by E-mail, telephone or direct interviews.
Gathering information through regular contact with physioterapists.
Collection of detailed and comprehensive information via the main follow-up visits, at 3, 6, 9 and 12 month after the start of the treatment.
Video recordings of patients in follow-up visits from the administration of cell therapy. In these recordings patients related the changes noted after the start of treatment.

13
Statistical Analysis
The data collected throughout the course of the study have undergone statistical analysis
to assess possible changes in the functional status of patients, compared with baseline
and at different times of evolution (3, 6, 9 and 12 months after the first administration of
cells). Statistical analyses were performed using SPSS software (v. 21.0, IBM, Armonk,
NY, USA) and Prism software (v. 5.04, GraphPad Software, San Diego, CA, USA). The
nonparametric Wilcoxon matched-pairs signed rank test was used to study the existence
of statistically significant differences between scores in clinical scales and urodynamic
parameters, at different time points. Hypothesis testing between categorical variables
were obtained with Cochran's Q test. Finally, when significant results were found, effect
sizes were computed using the G*Power software (v. 3.1.9.2, Statistical Power Analysis
Software, Düsseldorf, Germany). Correlations between obtained data were studied using
Spearman’s rank correlation procedure. Differences were considered significant if p< 0.05.
Data about the Cell Therapy Medicament NC1 is a cell therapy medicament, developed after preclinical studies by our group and
currently approved as a medicament under clinical investigation by the AEMPS (PEI No.
12-141). The medicament consists of autologous MSCs and autologous plasma as its
excipient. Previous to NC1 preparation, a sample of peripheral blood was retrieved from
each patient for genomic studies in order to rule out chromosomal abnormalities that could
discourage cell expansion, and to obtain a genetic fingerprint (KaryoNIM Stem Cells and
KaryoNIM STR test, respectively, NIMGenetics, Madrid, Spain).
The genetic studies included: 1) Analysis of the cellular genome by techniques Array CGH
to ensure that the starting cells are genetically stable and the expansion process produces
no genetic modification. 2) Analysis of genetic fingerprinting (STR, Short Tandem Repeat)
with the aim of having no cross contamination with other cells in the manufacturing
process.
Analysis of genetic fingerprint (STR)
The genetic fingerprint analysis was done by the external laboratory NIMGenetics, with a
panel of 20 markers + amelogenin (see table at the end of the text). The panel was
amplified by multiplex PCR using the PCR kits PlusTM AmpFlSTR® Identifiler
Amplification Kit and / or PCR ™ NGM AmpFlSTR® Amplification Kit. The analysis by
capillary electrophoresis of the amplified products was performed on an ABI automated
sequencer 3100 - Avant.
For the analysis of the profiles obtained, Gene Mapper software v 3.2.1 ID was used.

14
PANEL OF MARKERS
D3S1358 D5S818 D16S539
VWA D1S1656 D2S1338
D8S1179 D2S441 D19S433
D21S11 D10S1248 D7S820
D18S51 D12S391 CSF1PO
THO1 D22S1045 D13S317
FGA Amelogenina TPOX
Array CGH KaryoNIM STEM
The analysis of possible genetic abnormality was performed by the external laboratory
NIMGenetics using a platform CGH Array (KaryoNIM STEM) designed by the same
laboratory (NIMGenetics) and optimized for use in cell therapy projects. This platform
consists of 60,000 probes distributed throughout the genome with a probe designed each
60Kb and enables efficient detection of amplifications and deletions over 200Kb and
analyse in detail 407 genes related to genomic instability and abnormal proliferation
according with the Cancer Gene Census list. It has an enrichment probes designed
specifically for the detection of 395 cancer-related genes, included in the Cancer Gene
Census list (genes for which have been described causal mutations involved in cancer)
with an average of 5 probes per gene. The platform includes 15 specific probes for
detecting each of the 23 oncogenes commonly used in clinical diagnosis (see table at the
end of the text). In addition, there are probes designed specifically for the detection of six
genes associated with stem cells. The minimum degree of mosaicism detected by array
CGH is 20% -30%. The scanning process allows the use of arrays 8x60k with a resolution
of 2 microns.
Regions of oncohematologic interest analyzed by Array-CGH platform
REGION ANALYZED ASSOCIATED TUMOR
TRISOMY / MONOSOMY ALL TYPES OF TUMORS
Del 5q, 7q, 11q, 13q, 20q LEUKEMIA / LYMPHOMA
1p/1q, 19p/19q REGION GLIOMA
AR PROSTATE CANCER
ATM CHRONIC LYMPHOCYTIC LEUKEMIA , LYMPHOMA
AURKA BREAST CANCER , COLON , BRAIN , BLADDER, ENDOMETRIUM
CCND1 BREAST CANCER, LYMPHOMA, MELANOMA
CDKN2A/CDKN2B GLIOMA, MENINGIOMA, ESOPHAGEAL CANCER, STOMACH CANCER
CSF1R/EGR1 MYELODYSPLASIA
EGFR LUNG CANCER
ERBB2 BREAST CANCER , ESOPHAGUS
LPL PROSTATE CANCER
MDM2 SOFT TISSUE SARCOMA , LYMPHOMA
CMYC BREAST CANCER, LUNG, ESOPHAGUS
NMYC NEUROBLASTOMA
PTEN GLIOMA
RREB1 MELANOMA
TOP2A BREAST CANCER
TP53 SOLID TUMORS , LEUKEMIAS, LYMPHOMAS
ZNF217 BREAST CANCER, ESOPHAGUS

15
For obtaining the excipient, as a first step in the preparation of the NC1, we start with the
removal of 500 cc of peripheral blood from each patient. In our cleanroom, blood was
centrifuged at 900g for 8 minutes to obtain the plasma fraction, which is aliquoted in 15 ml
tubes and stored at -80 ° C until the medicament formulation.
Culture of MSCs
Approximately two weeks later, 50 ml of bone marrow was aspirated under aseptic
conditions from the iliac bones of each patient, immediately anticoagulated by a 5 ml
solution composed by 100 IU/ml sodium heparin Chiesi (Chiesi España, L’Hospitalet de
Llobregat, Spain) and 104 IU / 104 µg penicillin-streptomycin (BioWhittaker-Lonza, Madrid,
Spain) and sent to our cleanroom for culture and expansion under good manufacturing
practice (GMP).
Mononuclear cells (MNC) were separated by density gradient, using an automated cell-
processing system (SEPAX, BioSafe, Madrid, Spain). Then, they were plated at a density
of 16 x 104 to 20 x 104 cells / cm2, in 175 cm2 flasks on Alpha-Minimum Essential Medium
(MEM) with Earle's Balanced Salt Solution (BSS), and supplemented with 20% australian
prion-free fetal bovine serum (FBS) (Lonza, Berviers, Belgium, Lot Number: 9SB006), 200
mM L-glutamine (BioWhittaker-Lonza), and 104 IU / 104 µg penicillin-streptomycin
(BioWhittaker-Lonza).
The cultures were maintained at 37ºC in a humedified 5% CO2 atmosphera for 3 days,
after which nonadherent cells were removed by replacing the medium. When the cultures
approached confluence (90-100%), adherent cells were detached by treatment with
trypsin/ethylenediamine tetraacetic acid (EDTA) solution (BioWhittaker-Lonza).
Neutralization of trypsin and subsequent washing was performed with Alpha-MEM
medium supplemented with 10% FBS and 2 mM L-glutamine, centrifuging at 1250 rpm for
10 minutes.
After study of viability, cells were cultured to obtain the required number according to the
plan previously made for each patient. Cells were replated at a density of 3000-5000 cells
/ cm2 in factory farming of 4 floors with free-antibiotic Alpha-MEM medium supplemented
with 10% FBS and 2 mM L-glutamine, and the culture was maintained renewing the
medium every 3-4 days until a confluence of 90-100%. Once the culture reached
confluency, it was prepared to obtain the bulk of MSCs. At this time, MSCs were detached
with trypsin/EDTA and washed with Hank’s BSS medium (BioWhittaker-Lonza)
supplemented with 5% albumin (20% albumin Grifols, Barcelona, Spain). After it, MSCs
were resuspended with the previously obtained autologous plasma in order to remove
traces of the washing medium.
16
After cell counting, MSCs for the second dose were separated and then cryopreserved, at
a concentration of 2.2 x 10⁶ cells / ml in a FBS solution, in dimethylsulphoxide (DMSO)
(Miltenyi Biotec, Madrid, Spain). For it, we used a liquid nitrogen-free controlled rate
freezer (EF 600, Grant-Asymptote, Cambridge, UK). Finally, the MSCs for surgical
administration were formulated, according to the number scheduled for each patient, after
a new centrifugation at 1250 rpm for 10 minutes.
To prepare the second dose, cryopreserved MSCs were thawed in a thermostatic bath at
37 ° C, washed with antibiotic-free Alpha-MEM medium supplemented with 10% FBS and
2 mM L-glutamine, and centrifuged at 1250 rpm for 10 minutes. After it, a cell count was
performed and MSCs were plated at a concentration of 10,000-15,000 MSCs / cm2 in 175
cm2 culture flasks with antibiotic-free Alpha-MEM medium supplemented with 10% FBS
and 2 mM L-glutamine, in order to reach a confluence of 90-100% over a period of 4-5
days, and then we proceeded in the same way as with the first MSCs dose.
Formulation and Packaging
After obtaining the MSCs for surgical or second dose administration, they were
resuspended in the autologous plasma at a cell concentration of 100,000 cells / microliter.
After formulation, the cell therapy medicament was packaged in sterile and endotoxins-
free 1 ml-Hamilton microsyringes, with a 20G needle. Subsequently the needle is
removed and a sterile luer plug nut was placed on the end of each preloaded syringes.
Microsyringes with the medicament were placed inside a sterile metal box, which is also
double bagged before being transported to the operating room for cell transplantation.
Phenotypic characterization of MSCs
For phenotypic characterization of MSCs, monoclonal antibodies conjugated with different
fluorochromes (Fluorescein (FITC) / Phycoerythrin (PE) / Alexa-647 (AL-647) which
combine a number of both positive and negative MSCs membrane markers, were used.
Positive markers used were CD105 FITC (R&D Systems, Minneapolis, USA); CD90 AL-
647 (AbD Serotec, Oxford, OX5 1GE, UK); HLA Class I FITC (Cytognos, Salamanca,
Spain); CD73 PE (BD Bioscience, New Jersey, USA) and CD166 PE (R&D Systems).
Negative markers used were CD34 PE (BD Bioscience); HLA class II PE (Cytognos);
CD80 AL-647 (AbD Serotec); CD45 FITC (Cytognos) and CD31 FITC (Cytognos).
Furthermore, suitable isotopic controls for FITC, PE (Cytognos) and AL-647 (AbD
Serotec) respectively, were used as controls for specificity of the monoclonal antibodies.
The labeled cells were acquired with a flow cytometer FC500 MPL Cytomics (Beckman
Coulter, California, USA) using the MXP software (Beckman Coulter). Nonviable cells

17
were discarded using the labeling reagent LIVE&DEAD (Invitrogen, California, USA), and
he collected data analyzed with the CXP analysis software, version 2.1 (Beckman
Coulter).
Criteria for the administration of MSCs in our present clinical trial included a viability
greater than 95%, absence of microbial contamination (bacteria, fungus, virus, or
mycoplasma), expression of CD105, CD90, HLA I, CD73 and CD166 for more than 90%
of cells, and absence of CD34, CD80, HLA II, CD45 and CD31 (expression of each less
than 5%), as assessed by flow cytometry.
Figure S2. Phenotypic characterization of the MSCs in our cell therapy medicament. MSCs showed expression of CD105, CD90, HLA I, CD73 and CD166 for more than 90%, and showed absence of CD34, CD80, HLA II, CD45 and CD31 expression (less than 5% for each).
Summary of Treatment
Treatment consisted in intralesional and into adjacent tissue administration, by surgical
approach, of a variable dose of cells according to the study protocol. The administration is
controlled by microinjection and the number of cells to be administered and the volume of
each injection is calculated from the images provided by MRI. After 3 months
postoperatively, additional 30 x 106 cells were administered by lumbar puncture into the
subarachnoid space. All patients have been followed for one year after the time of
surgery, collecting efficacy variables prior to treatment (baseline study) and months 3, 6, 9
and 12 after surgery. Neurophysiological studies were performed prior to treatment
(baseline study) and 6 and 12 months after surgery. MRI and urodynamic studies were
done prior to initiation of treatment (baseline study) and 12 months after surgery.

18
Surgical Planning
One of the main features of this study was planning an individual treatment for each
patient, taking into account the number of cells to be administered (between 100 x 106 and
230 x 106 cells in the course of surgery, according to the clinical trial protocol and the
morphological characteristics of the SCI observed in neuroimaging study). In a recent
publication we called attention to the scant importance given in the literature to something
as crucial as is the morphological study of SCI 51, an opinion supported by a recently
published clinical trial 38.
In our series, surgical planning was done according to MRI data and the treatment
guidelines approved for our protocol. According to the characteristics of the lesion, the first
administration of cells, by surgery, was a intrathecal dose that ranged between 100 x 106
and 230 x 106 cells (mean of 165 x 106) considering as such both intramedullary
administration and into perilesional subarachnoid space, of which 30 x 106 cells were
always administered in the subarachnoid space. According to the study protocol, all
patients also received 30 x 106 cells at 3 months of surgery for lumbar puncture. As a
result, the total dose of cells administered varied between 130 x 106 and 260 x 106 (mean
± SD: 202.5 x 10⁶ ± 46.73 x 10⁶). In the following Supplementary Figures we show some
details of surgical planning in our patients. This planning was performed studying the
characteristics of SCI in MRI images, and trying to deliver high doses of cells in tolerable
volumes according to the different zones of lesión and to preclinical experience gained in
our model of paraplegic minipig 20.
Figure S3. Patient 01: Male, 37 years. SCI at D7-D8 level. Over 4 years of
chronicity. Administration, in surgery, of a total of 100 x 106 MSCs.

19
Figure S4. Patient 02: 25 year old male. SCI at D10-D11 level. Over 3 years of
chronicity. Administration, in surgery, of a total of 100 x 106 MSCs
Figure S5. Patient 03: 55 year old male. D7-D8 injury level. More than 26 years of chronicity. 150 x 106 MSCs in surgery.

20
Figure S6. Patient 04: Male, 41 years. SCI at D11-D12 level. Over 3 years of chronicity.
Administration, in surgery, of 150 x 106 MSCs.
Figure S7. Patient 06: 38 year old woman. Lesion at D11-D12 level. More than 13 years of chronicity. Administration, in surgery, of 150 x 106 MSCs.
21
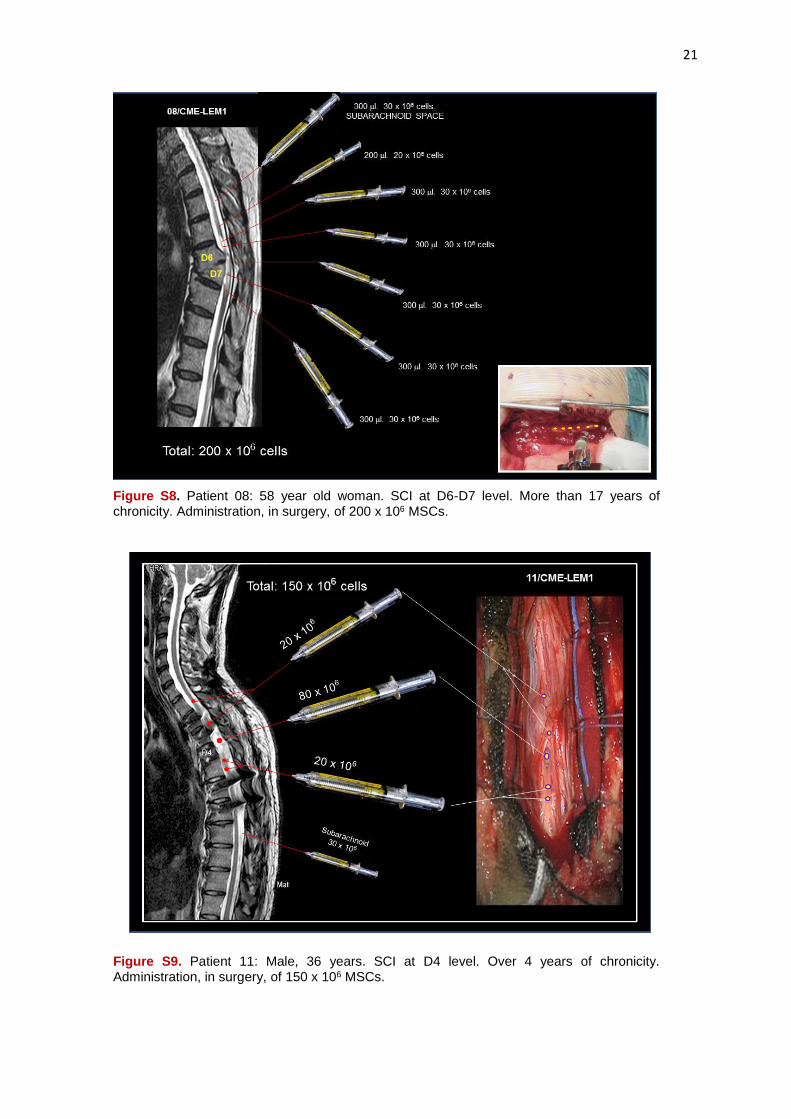
Figure S8. Patient 08: 58 year old woman. SCI at D6-D7 level. More than 17 years of chronicity. Administration, in surgery, of 200 x 106 MSCs.
Figure S9. Patient 11: Male, 36 years. SCI at D4 level. Over 4 years of chronicity. Administration, in surgery, of 150 x 106 MSCs.
22
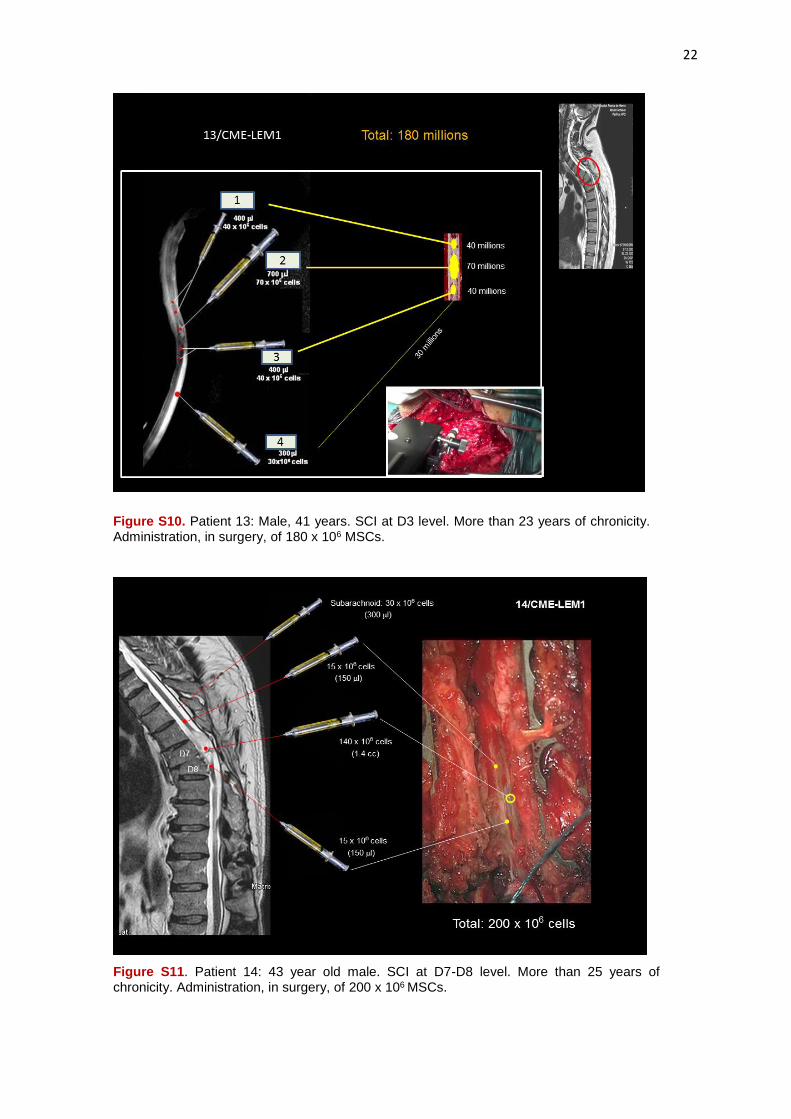
Figure S10. Patient 13: Male, 41 years. SCI at D3 level. More than 23 years of chronicity. Administration, in surgery, of 180 x 106 MSCs.
Figure S11. Patient 14: 43 year old male. SCI at D7-D8 level. More than 25 years of chronicity. Administration, in surgery, of 200 x 106 MSCs.

23
Figure S12. Patient 15: Woman, 36 years. SCI at D6-D7 level. More than 13 years of chronicity. Administration, in surgery, of 230 x 106 MSCs.
Figure S13. Patient 16: Male, 36 years. SCI at D4-D5 level. More than 7 years of chronicity. Administration, in surgery, of 230 x 106 MSCs.

24
Figure S14. Patient 17: Male, 40 years. SCI at D4 level. Asymptomatic syringomyelia in the cervical spinal cord. More than 22 years of chronicity. Administration, in surgery, of 230 x 106 MSCs.
Results: Supplementary Data, Tables and Figures
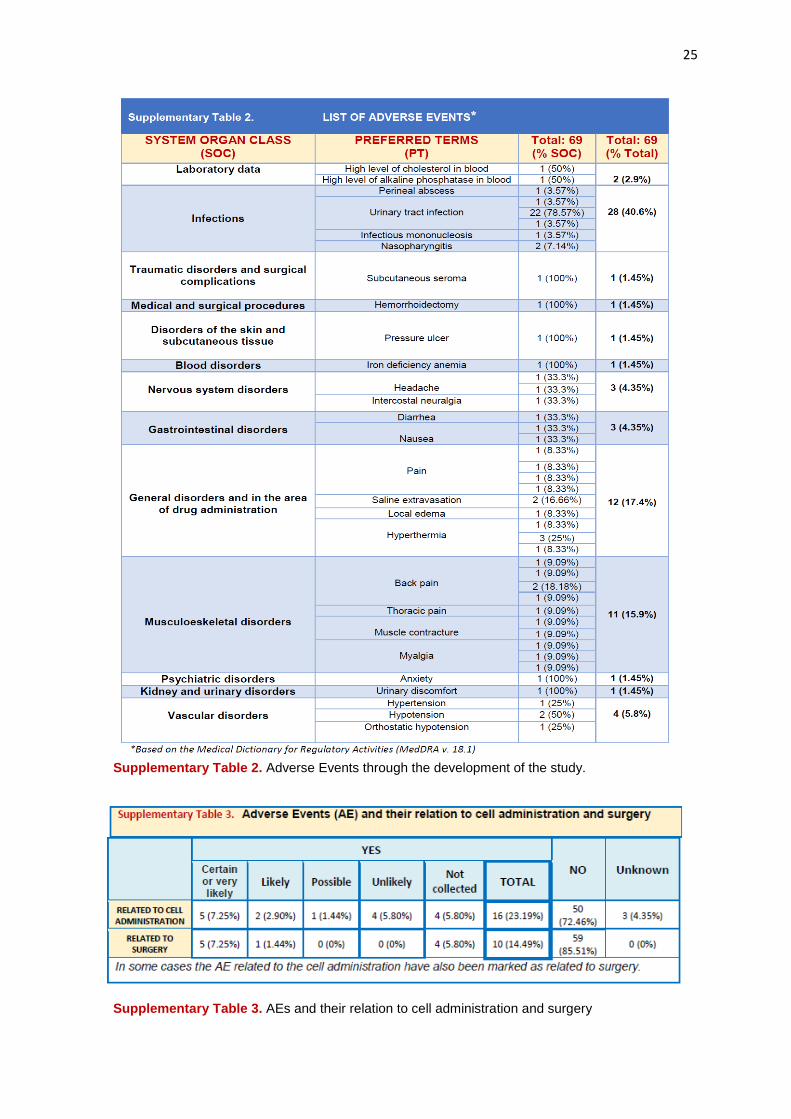
Adverse Events A total of 69 adverse events (AEs) were collected in the present study, but only 22 of them
(31.8%) were related to treatment and they were considered of minor (79.1%) or
moderate (20.9%) intensity. Generally, they consisted in postoperative pain, transient
hyperthermia or subcutaneous collection in the area of surgical wound. The following
Supplementary Tables show the list of Adverse Events, and their intensity.
25
Supplementary Table 2. Adverse Events through the development of the study.
Supplementary Table 3. AEs and their relation to cell administration and surgery
26
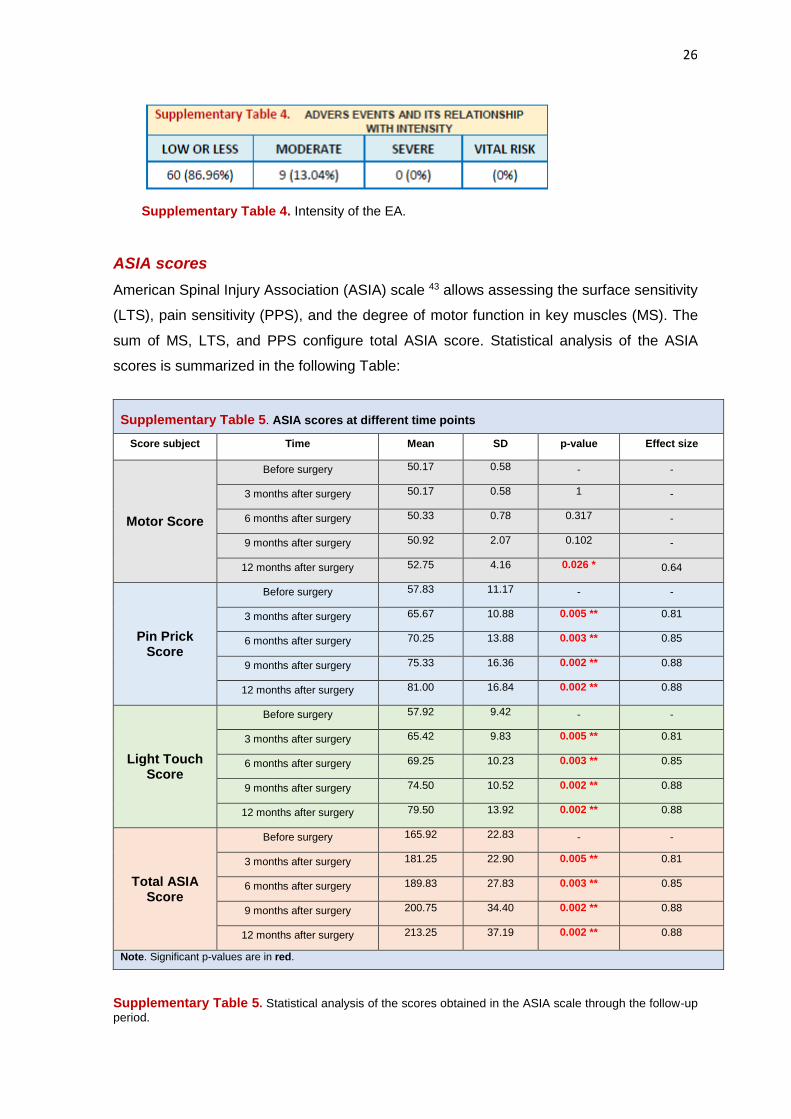
Supplementary Table 4. Intensity of the EA.
ASIA scores
American Spinal Injury Association (ASIA) scale 43 allows assessing the surface sensitivity
(LTS), pain sensitivity (PPS), and the degree of motor function in key muscles (MS). The
sum of MS, LTS, and PPS configure total ASIA score. Statistical analysis of the ASIA
scores is summarized in the following Table:
Supplementary Table 5. ASIA scores at different time points
Score subject Time Mean SD p-value Effect size
Motor Score
Before surgery 50.17 0.58 - -
3 months after surgery 50.17 0.58 1 -
6 months after surgery 50.33 0.78 0.317 -
9 months after surgery 50.92 2.07 0.102 -
12 months after surgery 52.75 4.16 0.026 * 0.64
Pin Prick Score
Before surgery 57.83 11.17 - -
3 months after surgery 65.67 10.88 0.005 ** 0.81
6 months after surgery 70.25 13.88 0.003 ** 0.85
9 months after surgery 75.33 16.36 0.002 ** 0.88
12 months after surgery 81.00 16.84 0.002 ** 0.88
Light Touch Score
Before surgery 57.92 9.42 - -
3 months after surgery 65.42 9.83 0.005 ** 0.81
6 months after surgery 69.25 10.23 0.003 ** 0.85
9 months after surgery 74.50 10.52 0.002 ** 0.88
12 months after surgery 79.50 13.92 0.002 ** 0.88
Total ASIA Score
Before surgery 165.92 22.83 - -
3 months after surgery 181.25 22.90 0.005 ** 0.81
6 months after surgery 189.83 27.83 0.003 ** 0.85
9 months after surgery 200.75 34.40 0.002 ** 0.88
12 months after surgery 213.25 37.19 0.002 ** 0.88
Note. Significant p-values are in red.
Supplementary Table 5. Statistical analysis of the scores obtained in the ASIA scale through the follow-up
period.

27
The recovery of sensitivity in our patients has been a surprisingly consistent finding after
cell therapy. It has been variable from one patient to another and can be seen even in the
first week after surgery. Analysis along the follow up showed that the improvement is
gradual over time, both as regards the LTS as PPS.
The accompanying Supplementary Tables and Figures show progression, in terms of
recovery of sensitivity, of the patients in our series, at 3, 6, 9 and 12 months of follow-up
after surgery.
Figure S15. Gradual recovery of LTS observed at 3, 6, 9 and 12
months after surgery, with statistically significant differences from
baseline (p: 0.005, 0.003, 0.002, and 0.002, respectively. Effect size
was 0.81, 0.85, 0.88 and 0.88, respectively).
Figure S16. Progressive changes in PPS at 3, 6, 9 and 12 months, with
statistically significant differences from baseline (p: 0.005, 0.003, 0.002,
and 0.002, respectively. Effect size was 0.81, 0.85, 0.88 and 0.88,
respectively.

28
Figure S17. Gradual recovery over time, with regard to LTS (green) and PPS (red) in the patients of the
series. In most patients recovery is clear from the first 3 months after cell therapy.
Figure S18. Graph showing the progressive recovery of sensitivity in the patients of the series, grouping LTS and PPS scores.

29
Figure S19. Dermatomes showing some degree of sensitivity along the follow up period, in patients 01, 02, 03 and 04. Red, dermatomes showing some degree of recovered sensitivity. Yellow, sensitivity preserved prior to cell therapy. Blank, complete anesthesia. Patient 04 changed to ASIA B at month 6.

30
Figure S20. Dermatomes showing some degree of sensitivity along the follow up period, in patients 06, 08, 11 and 13. Red, dermatomes showing some degree of recovered sensitivity. Yellow, sensitivity preserved prior to cell therapy. Blank, complete anesthesia. Patient 06 changed to ASIA C at month 12. Patient 08 changed to ASIA B at month 3.
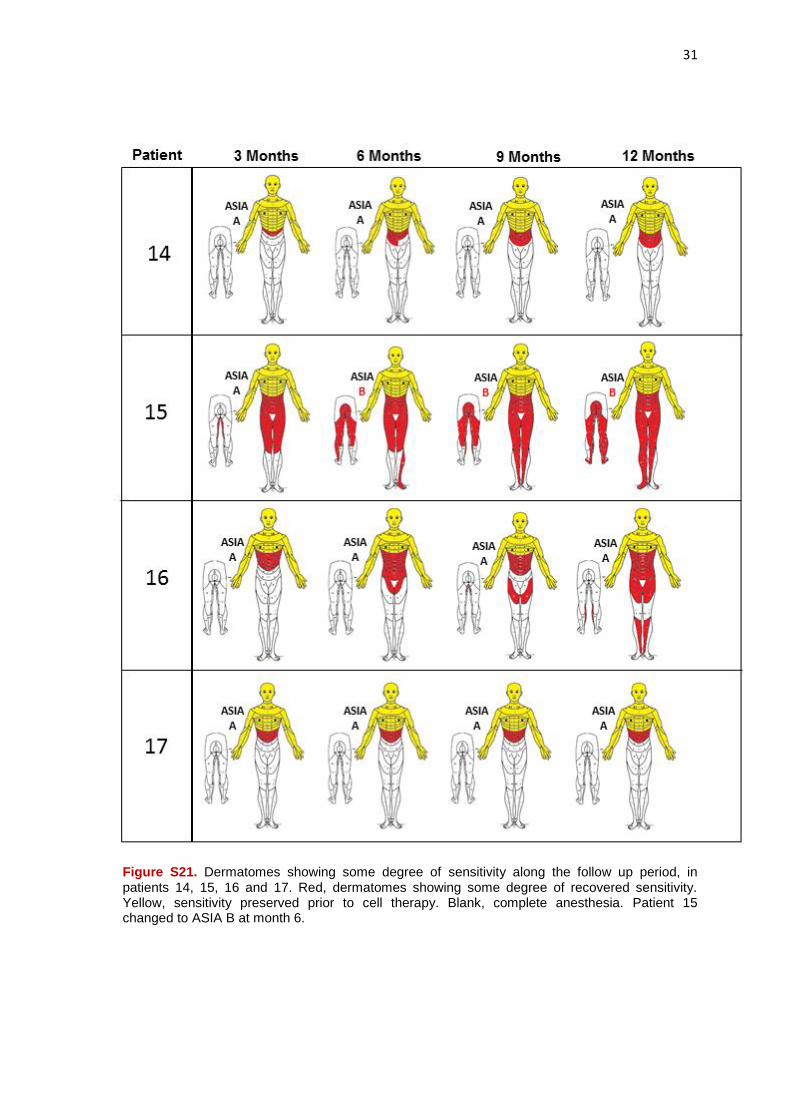
31
Figure S21. Dermatomes showing some degree of sensitivity along the follow up period, in patients 14, 15, 16 and 17. Red, dermatomes showing some degree of recovered sensitivity. Yellow, sensitivity preserved prior to cell therapy. Blank, complete anesthesia. Patient 15 changed to ASIA B at month 6.

32
Figure S22. Number of infralesional dermatomes showing some degree of recovered sensitivity along the follow-up (p: 0.002, at 12 months of follow-up).
With regard to motor recovery valued in ASIA scale, our study started from a situation of
total absence of lower limbs motion in all cases, except for patient 06 with a D11-D12
level, who maintained some motor activity in hip flexor muscles. The accompanying
graphs show, throughout the study, the recovery of MS in our patients:
Figure S23. MS evolution in our series, with no statistically significant differences
from baseline at 3, 6 and 9 months. However, at 12 months, significant difference is
detected with respect to baseline (p: 0.026, effect size: 0.64).
MS recovery in ASIA assessment, athough discrete, is an extremely important finding,
considering its clinical significance in the context of patients in the series (complete and

33
chronic paraplegia). The patient 06 (D11-D12 level), presented in the baseline study a MS
of 52, improving to a MS of 57 at 9 months, and ending the study, at 12 months of follow-
up, with a MS of 64. He changed from ASIA A to ASIA C. The patient 04 (SCI at D11-D12
level) showed a MS of 56 in the assessment at 12 months, and completed the study as
ASIA B. The patient 08 (D6-D7 level) happened to have a MS of 52 at 9 months, and 54
at 12 months, also ending the monitoring period as ASIA B. The patient 13 (D3 level)
recovered one point in evaluating MS at 12 months. The patients 14 and 15 recovered
four points in MS, the first one (D7-D8 level) at the end of the monitoring period, and the
second (level D6-D7) improved two points at month 6, and reached 4 points of motor
recovery at the month 12. This patient also completed the study as ASIA B, reaching this
level of valuation from the visit of 6 months.
The following Supplementary Table shows the evolution of patients in terms of its
classification in the ASIA grade, appreciating that over the 12 month follow-up after cell
therapy, over 30% of the patients change their situation of complete paraplegia (ASIA A)
to a situation of incomplete paraplegia (ASIA B or even ASIA C).
Supplementary Table 6. This table shows the changes in ASIA A (complete SCI) to ASIA B
or C (incomplete SCI), during the follow-up period of 12 months after surgery (p: 0.029).

34
100,00%91,70%
75,00% 75,00%66,70%
8,30%
25,00% 25,00%
25,00%
8,30%
0,00%
10,00%
20,00%
30,00%
40,00%
50,00%
60,00%
70,00%
80,00%
90,00%
100,00%
Basal 3 meses 6 meses 9 meses 12 meses
C
B
A
Figure S24. Graph showing the evolution of patients in ASIA grade. At the end of follow-up only 66.70 % of patients remained as ASIA A (complete paraplegia).
Given the characteristics of the ASIA assessment, it seems logical that MS changes have
some correlation with the level of neurological damage, so that in patients with low injury
level it is easier to get improvement of MS in lower limbs. When we tried to correlate SCI
level with MS improvement after 12 months of follow-up, MS improvement was associated
with a lower level of SCI, although no statistical significance was found.
In any case, the experience gained from this study leads us to consider that, without
neglecting the value of the ASIA scale to assess the possible functional recovery of
paraplegic patients undergoing cell therapy techniques, we need new assessment scales
to interpret motor recovery of our patients. Throughout our study we observed that cell
therapy allows motor recovery in patients with complete, chronically established
paraplegia, but usually, as will be described in section of neurophysiological studies,
patients show a pattern of motor recovery gradually descending, appreciating at a
relatively early stage (usually after 6 months of therapy) motor recovery in the abdominal
wall muscles (rectus abdominis) which are not measured in the ASIA scale. Some motor
activity may result later in hip flexors (iliopsoas), which are the highest muscles that are
valued as "key" in the assessment of lower limb motion in ASIA scale. Almost
simultaneously, but usually from 9 months of therapy, we can see some motor recovery,
generally with EMG confirmation, in gastrocnemius, quadriceps, and other infralesional
muscles. However, an important observation is that, contrary to what you might assume,
have found no correlation in our series between MS improvement in ASIA scale and
chronicity of the lesion or patient age. In fact, the best results of motor recovery were

35
obtained in patient 08 (58-year-old) who had a severe SCI at D6-D7 level, and over 17
years of chronicity.
On the other hand, despite possible limitations, total ASIA score can be considered as a
useful tool to determine whether cell therapy is an effective treatment in patients with SCI.
It represents the sum of PPS, LTS and MS, and according to this variable, we have seen
in our patients a clear and progressive improvement in their functional status during the
follow-up period, and without a stabilization of improvement, after one year from the
surgery, such as it is shown in the following Supplementary Figures.
To
tal A
SIA
evo
luti
on
0 3 6 9 12160
180
200
220
240
Months
Figure S25. Graph showing the progressive total ASIA increase in
patients of the series. The improvement was not stabilized at the end of
follow-up.
Figure S26. Progressive total ASIA improvement with statistically significant differences from baseline, during the study. At 3, 6, 9 and 12 months, a p-value of 0.005, 0.003, 0.002 and 0.002, with an effect size of 0.81, 0.85, 0.88 and 0.88, respectively, was obtained.

36
Figure S27. Total ASIA points recovered throughout the study per each patient.
According to this scale, all patients showed functional recovery (between 17 and 108
points, with an average of 47.33; sd : 30.45, and with an increased score for all patients,
of 568 points). It stresses the gradual recovery of patients 08 and 15, both with injury
level at D6-D7 and chronicity of over 17 and 13 years respectively.
37
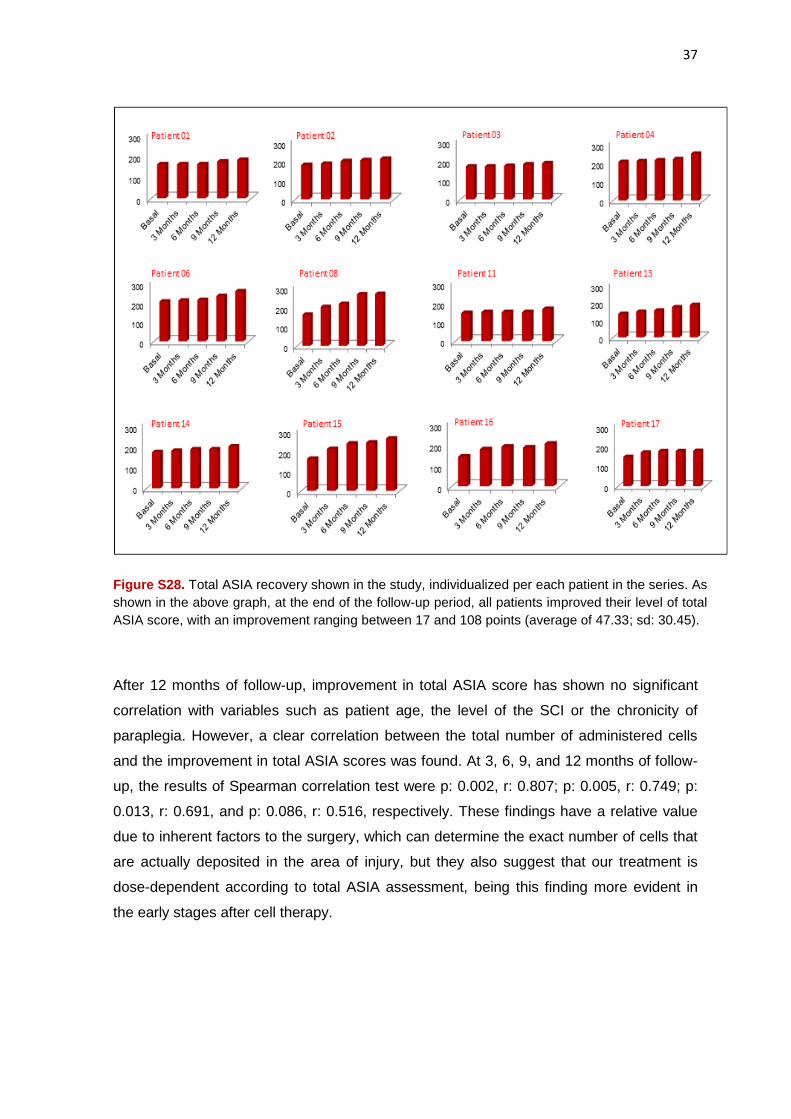
Figure S28. Total ASIA recovery shown in the study, individualized per each patient in the series. As
shown in the above graph, at the end of the follow-up period, all patients improved their level of total
ASIA score, with an improvement ranging between 17 and 108 points (average of 47.33; sd: 30.45).
After 12 months of follow-up, improvement in total ASIA score has shown no significant
correlation with variables such as patient age, the level of the SCI or the chronicity of
paraplegia. However, a clear correlation between the total number of administered cells
and the improvement in total ASIA scores was found. At 3, 6, 9, and 12 months of follow-
up, the results of Spearman correlation test were p: 0.002, r: 0.807; p: 0.005, r: 0.749; p:
0.013, r: 0.691, and p: 0.086, r: 0.516, respectively. These findings have a relative value
due to inherent factors to the surgery, which can determine the exact number of cells that
are actually deposited in the area of injury, but they also suggest that our treatment is
dose-dependent according to total ASIA assessment, being this finding more evident in
the early stages after cell therapy.

38
Figure S29. Spearman correlation study, showing a dose-dependent efficacy in terms of total
number of administered cells and improvement in total ASIA scores.
IANR-SCIFRS Scale
The IANR-SCIFRS Scale44 is useful for assessing functional recovery of patients after cell
therapy. This scale assesses spinal cord function by means of a questionnaire with 9
sections, valuing the degree of movement of upper limbs, lower limb movement,
movement of the trunk, general movement, sphincter control, muscle tone, sweating, skin
condition and pain. There is also a final section, which only applies to men, and refers to
sexual function. Each of the sections of the scale has one to three subsections which are
scored from 0 to 3, measuring with 0 the highest degree of disability and 3 being the score
that a normal individual would give. The sum of global rating scale provides information on
the functional recovery of the patient over time. It also provides analysis of the various
sections and subsections identifiying how issues such improvement occurs. A score of 48
would be the one corresponding to an individual without any SCI, a score between 34 and
47 indicate a slight degree of disability (practically independent patient), a value between
39
17 and 33 indicate a moderate degree of disability (in need of any help), and a global
value of the scale between 0 and 16 indicate a severe degree of disability (major impact
on their activities of daily living). The various sections and subsections of the ANR-
SCIFRS Scale are:
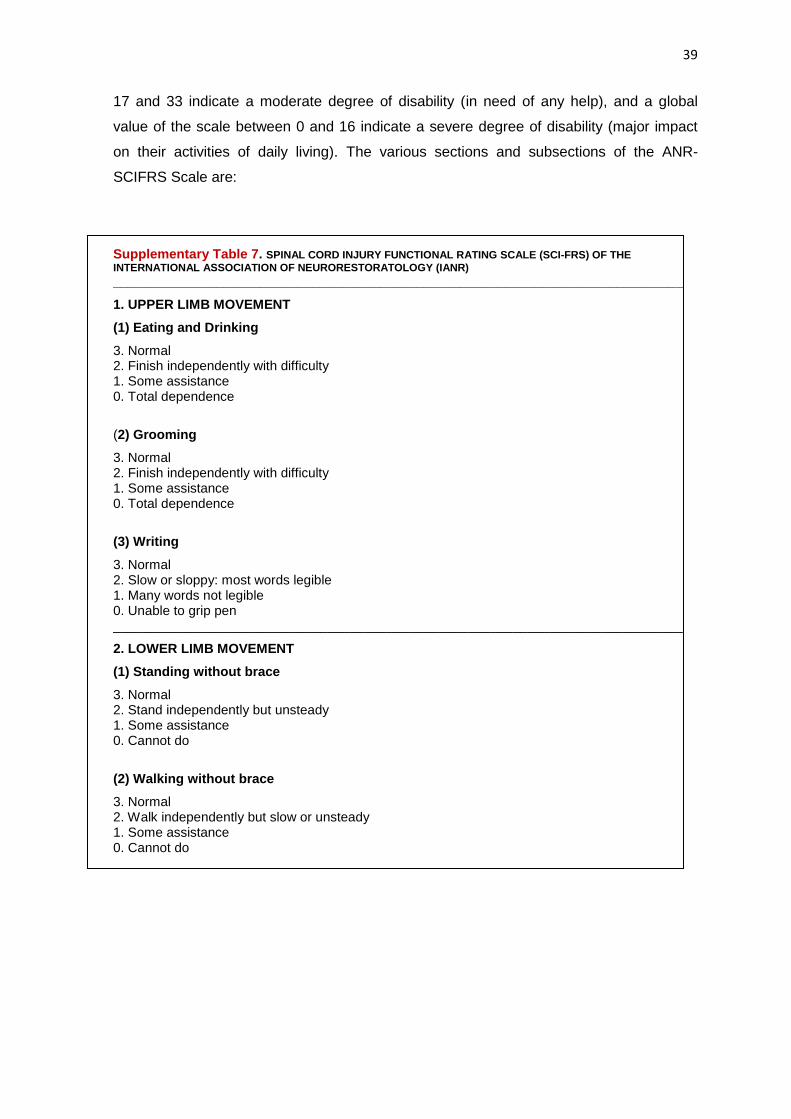
Supplementary Table 7. SPINAL CORD INJURY FUNCTIONAL RATING SCALE (SCI-FRS) OF THE
INTERNATIONAL ASSOCIATION OF NEURORESTORATOLOGY (IANR)
_____________________________________________________________________________
1. UPPER LIMB MOVEMENT
(1) Eating and Drinking
3. Normal 2. Finish independently with difficulty 1. Some assistance 0. Total dependence
(2) Grooming
3. Normal 2. Finish independently with difficulty 1. Some assistance 0. Total dependence
(3) Writing
3. Normal 2. Slow or sloppy: most words legible 1. Many words not legible 0. Unable to grip pen _____________________________________________________________________________
2. LOWER LIMB MOVEMENT
(1) Standing without brace
3. Normal 2. Stand independently but unsteady 1. Some assistance 0. Cannot do
(2) Walking without brace
3. Normal 2. Walk independently but slow or unsteady 1. Some assistance 0. Cannot do

40
3. TRUNK MOVEMENT
(1) Sitting
3. Normal 2. Stable when still, but unstable when moving 1. Unstable when still 0. Cannot do
(2) Turning body over
3. Normal 2. Finish independently with difficulty 1. Some assistance 0. Total dependence _______________________________________________________________________________
4. GENERAL MOVEMENT
(1) Transfers: bed to chair/wheelchair
3. Normal 2. Finish independently with difficulty 1. Some assistance 0. Total dependence
(2) Bathing
3. Normal 2. Finish independently with difficulty 1. Some assistance 0. Total dependence
(3) Dressing
3. Normal 2. Finish independently with difficulty 1. Some assistance 0. Total dependence
5. SPHINCTER CONTROL
(1) Bladder Control
3. Normal 2. Reflex voiding with partial sensation or control 1. Reflex voiding without sensation or control 0. Total incontinence or urethral catheterization /cystostomy needed
(2) Bowel Control
3. Normal 2. Partial control with sensation 1. Partial control without sensation or no control with partial sensation 0. Total incontinence
6. MUSCULAR TENSION (refers to the amount of tension or resistance to movement in a muscle) 3. Normal 2. Slight increase/decrease or mild spasm 1. Large increase/decrease or significant spasm 0. Extreme stiffness or spasticity

41
7. SWEATING 3. Normal 2. Slight decrease 1. Significant decrease 0. Absent sweating _____________________________________________________________________________
8. SKIN CONDITION
3. Normal 2. Partial breakdown 1. Significant breakdown, often associated with edema 0. Enduring bedsore or skin damage, severe edema. _____________________________________________________________________________
9. PAIN 3. No pain 2. Mild pain, ordinary pain killer effective 1. Severe pain, narcotics required 0. Extreme pain, uncontrolled _____________________________________________________________________________
SEXUAL FUNCTION (Rate for males only; do not include in overall score)
3. Normal 2. Can achieve erection and sexual penetration, but problems with sensation or ejaculation 1. Can achieve erection, but no sexual penetration, sensation or ejaculation 0. Unable to achieve erection
Functional Rating Score:
The maximum possible score is 48; the lowest possible score is 0.
48: Normal functioning across all categories 34-47: Slight degree of functional handicap (mostly independent) 17-33: Medium degree of functional handicap (some dependency indicated) 0-16: Severe degree of functional handicap (significant impact on daily life)
_________________________________________________________
Before the treatment, the mean global score of IANR-SCIFRS scale in our patients was,
29.92, sd: 2.64 points, and at the end end of the study it turned into 37.92, sd: 2.23 points,
which translates a clear efficacy of cell therapy.

42
Statistical analysis of the IANR-SCIFRS scores in the main sections and subsections
showing clinical improvement is summarized in the following Table:
Supplementary Table 8. Scores in the sections of the IANR-SCIFRS scale showing improvement
Score subject Time Mean SD p-value Effect size
IANR-SCIFRS
OVERALL
SCORE
Before surgery 29.92 2.64
3 months after surgery 34.33 1.97 0.003 ** 0.85
6 months after surgery 36.08 2.39 0.002 ** 0.89
9 months after surgery 36.75 2.42 0.002 ** 0.89
12 months after surgery 37.92 2.23 0.002 ** 0.89
LOWER LIMB
MOVEMENT
Before surgery 0.00 0.00
3 months after surgery 0.16 0.57 1.00 ---
6 months after surgery 0.33 0.65 0.173 ---
9 months after surgery 0.33 0.65 0.173 ---
12 months after surgery 0.50 0.67 0.038 * 0.59
TRUNK
MOVEMENT
Before surgery 4.33 0.99
3 months after surgery 5.17 0.84 0.023 * 0.66
6 months after surgery 5.50 0.80 0.010 ** 0.74
9 months after surgery 5.75 0.62 0.007 ** 0.78
12 months after surgery 5.75 0.62 0.007 ** 0.78
SPHINCTER
CONTROL
Before surgery 0.00 0.00
3 months after surgery 1.42 1.44 0.017 * 0.69
6 months after surgery 2.00 1.76 0.011 * 0.74
9 months after surgery 2.25 1.71 0.007 ** 0.77
12 months after surgery 2.92 1.44 0.003 ** 0.85
BLADDER
CONTROL
Before surgery 0.00 0.00
3 months after surgery 1.08 1.14 0.011 * 0.73
6 months after surgery 1.25 1.14 0.011 * 0.73
9 months after surgery 1.25 1.14 0.011 * 0.73
12 months after surgery 1.67 0.89 0.003 ** 0.86
BOWEL
CONTROL
Before surgery 0.00 0.00
3 months after surgery 0.33 0.65 0.102 -
6 months after surgery 0.75 0.75 0.014 * 0.71
9 months after surgery 1.00 0.85 0.010 ** 0.75
12 months after surgery 1.25 0.75 0.004 ** 0.83

43
MUSCULAR
TENSION
Before surgery 1.33 0.99
3 months after surgery 1.92 0.52 0.038 * 0.60
6 months after surgery 2.17 0.58 0.008 ** 0.76
9 months after surgery 2.25 0.62 0.009 ** 0.75
12 months after surgery 2.33 0.65 0.006 ** 0.80
PAIN
Before surgery 2.00 0.95
3 months after surgery 2.25 0.97 0.180 -
6 months after surgery 2.42 0.90 0.059 -
9 months after surgery 2.42 0.90 0.059 -
12 months after surgery 2.58 0.79 0.038 * 0.60
SEXUAL
FUNCTION
Before surgery 1.11 0.78
3 months after surgery 1.56 0.73 0.046 * 0.58
6 months after surgery 1.67 0.71 0.025 * 0.65
9 months after surgery 1.67 0.71 0.025 * 0.65
12 months after surgery 1.67 0.71 0.025 * 0.65
Note. Significant p-values are in red.
Supplementary Table 8. Statistical analysis of the IANR-SCIFRS scale scores.
79 10
1212
53 2
0123456789
101112
Basal 3 months 6 months 9 months 12 months
Nu
mb
er
of
pat
ien
ts
IANR-SCIFRS functional rating score
Slight handicap Medium handicap
Figure S30. Graph showing the evolution in the functional rating score of the patients (p < 0.001).

44
Figure S31. Immediate and gradual improvement after surgery in the overall
scores of the IANR-SCIFRS scale, with clear statistically significant difference,
compared to baseline values at 3 months (p: 0.003, effect size: 0.85), 6 months (p:
0.002, effect size: 0.89), 9 months (p: 0.002, effect size: 0.89) and 12 months (p:
0.002, effect size: 0.89).
According to this scale, our analysis shows that all patients improved neurological
disability after cell therapy. While before treatment all patients showed a "moderate
degree of functional disability" (scale range between 17 and 33 points) at the end of the
monitoring period (12 months after surgery) all s patients howed a "slight degree of
disability" (range between 34 and 47 points), which translates a clear improvement in
quality of life. In the next Supplementary Figures the gradual improvement in overall score
of SCIFRS IANR-scale, individualized for each of our patients can be seen.

45
Figure S32. Progressive improvement in the global IANR-SCIFRS scores of patients.The improvement over baseline was observed early, reaching clear statistical significance in the overall analysis of the series with an effect size > 0.8 in all time points. Analysing all the cases, the improvement obtained in the scale ranged between 3 to 26 points (mean 8.83, sd: 6.37).

46
Figure S33. The above graph shows the progressive improvement throughout the study (scores in SCIFRS IANR-scale) individualized for each patient in the series. The study starts from a baseline value that is represented as 0. It is noted that all patients show improvement at the end of the monitoring period, ranging between 3 and 26 points (mean of 8.83, sd: 6.37). Stand out patient 08 (which also showed the highest recovery in total ASIA score) and patients 17 and 15. These three patients received a total of 230 x 106, 260 x 106 and 260 x 106 cells, and had a SCI chronicity of more than 17, 22 and 13 years, respectively.

47
Figure S34. Graph showing the progressive increase in scores on the IANR-SCIFRS scale throughout the follow-up of patients. It is appreciated that the improvement has not stabilized at the end of follow-up.
On the other hand, when the overall improvement achieved in IANR-SCIFRS scale is
compared with the global improvement achieved by total ASIA scores, a great parallelism
of both scales can be seen, with rapid functional improvement of patients on both scales.
Moreover, there is a clear correlation between the improvement obtained in the overall
scores of IANR-SCIFRS scale and the number of cells administered, supporting the
effectiveness of cell therapy treatment as a dose-dependent effect. Nevertheless, our
analysis does not allow correlation between overall improvement in IANR-SCIFRS scale
and variables as level of SCI, age, or chronicity of paraplegia.
Figure S35. Improvement in the evolution of our patients using total ASIA scores and scores of global IANR-SCIFRS scale, suggesting the convergent validity of both scales.
48
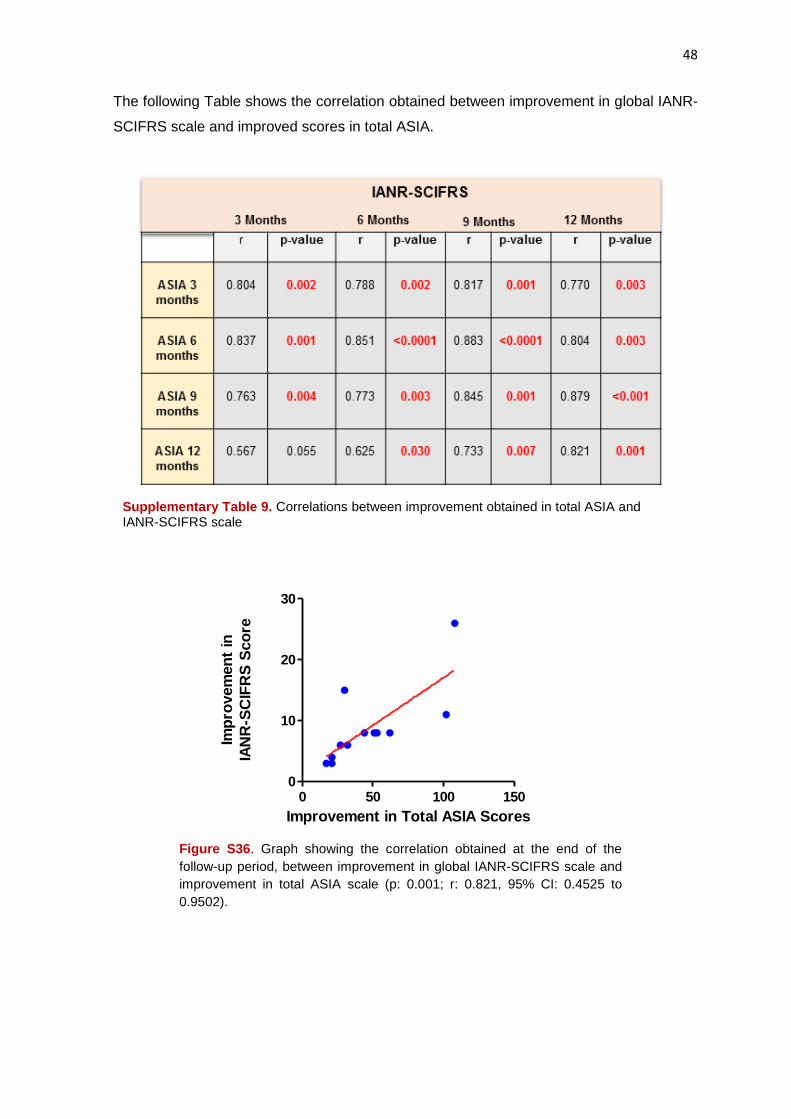
The following Table shows the correlation obtained between improvement in global IANR-
SCIFRS scale and improved scores in total ASIA.
Supplementary Table 9. Correlations between improvement obtained in total ASIA and IANR-SCIFRS scale
Improvement in Total ASIA Scores
Imp
rovem
en
t in
IAN
R-S
CIF
RS
Sco
re
0 50 100 1500
10
20
30
Figure S36. Graph showing the correlation obtained at the end of the
follow-up period, between improvement in global IANR-SCIFRS scale and
improvement in total ASIA scale (p: 0.001; r: 0.821, 95% CI: 0.4525 to
0.9502).
49
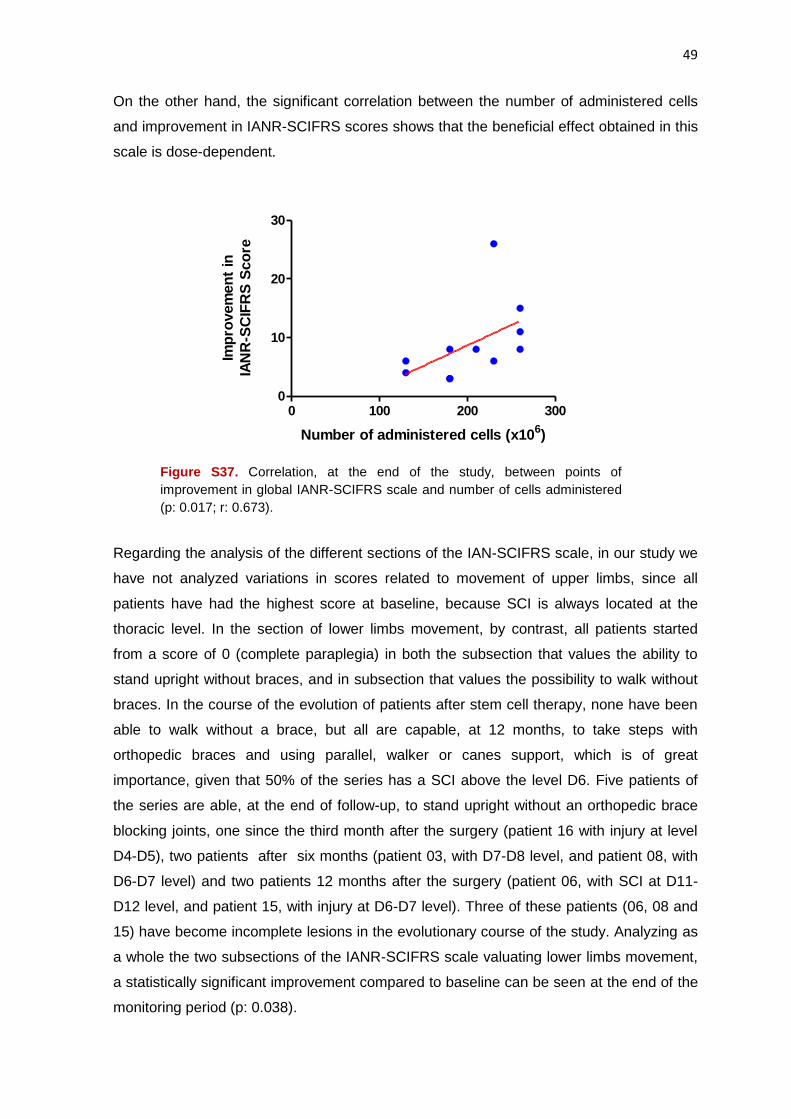
On the other hand, the significant correlation between the number of administered cells
and improvement in IANR-SCIFRS scores shows that the beneficial effect obtained in this
scale is dose-dependent.
Number of administered cells (x10
6)
Imp
rovem
en
t in
IAN
R-S
CIF
RS
Sco
re
0 100 200 3000
10
20
30
Figure S37. Correlation, at the end of the study, between points of
improvement in global IANR-SCIFRS scale and number of cells administered
(p: 0.017; r: 0.673).
Regarding the analysis of the different sections of the IAN-SCIFRS scale, in our study we
have not analyzed variations in scores related to movement of upper limbs, since all
patients have had the highest score at baseline, because SCI is always located at the
thoracic level. In the section of lower limbs movement, by contrast, all patients started
from a score of 0 (complete paraplegia) in both the subsection that values the ability to
stand upright without braces, and in subsection that values the possibility to walk without
braces. In the course of the evolution of patients after stem cell therapy, none have been
able to walk without a brace, but all are capable, at 12 months, to take steps with
orthopedic braces and using parallel, walker or canes support, which is of great
importance, given that 50% of the series has a SCI above the level D6. Five patients of
the series are able, at the end of follow-up, to stand upright without an orthopedic brace
blocking joints, one since the third month after the surgery (patient 16 with injury at level
D4-D5), two patients after six months (patient 03, with D7-D8 level, and patient 08, with
D6-D7 level) and two patients 12 months after the surgery (patient 06, with SCI at D11-
D12 level, and patient 15, with injury at D6-D7 level). Three of these patients (06, 08 and
15) have become incomplete lesions in the evolutionary course of the study. Analyzing as
a whole the two subsections of the IANR-SCIFRS scale valuating lower limbs movement,
a statistically significant improvement compared to baseline can be seen at the end of the
monitoring period (p: 0.038).

50
Figure S38. Evolution of scores in Lower Limb Movement. The comparison with baseline
shows statistically significant improvement (p: 0.038; effect size: 0.59) at the expense of
the “Standing without Brace” subsection.
In the section of the scale IANR-SCIFRS that values Trunk Movement, improvement is
detected at a very early stage, compared to baseline, in patients with disturbance. In the
first 3 months after surgery, patients reported having more trunk control and stability,
which is clearly detected by the physiotherapists controling their rehabilitation.
Figure S39. Evolution, along the follow-up period, of the scores for the section Trunk Movement.
Statistical analysis shows clear improvements with respect to baseline, at 3 months (p: 0.023 with
effect size: 0.66), 6 months (p: 0.010 with effect size: 0.74), 9 months (p: 0.007 with effect size:
0.78) and 12 months (p: 0.007, with effect size: 0.78).
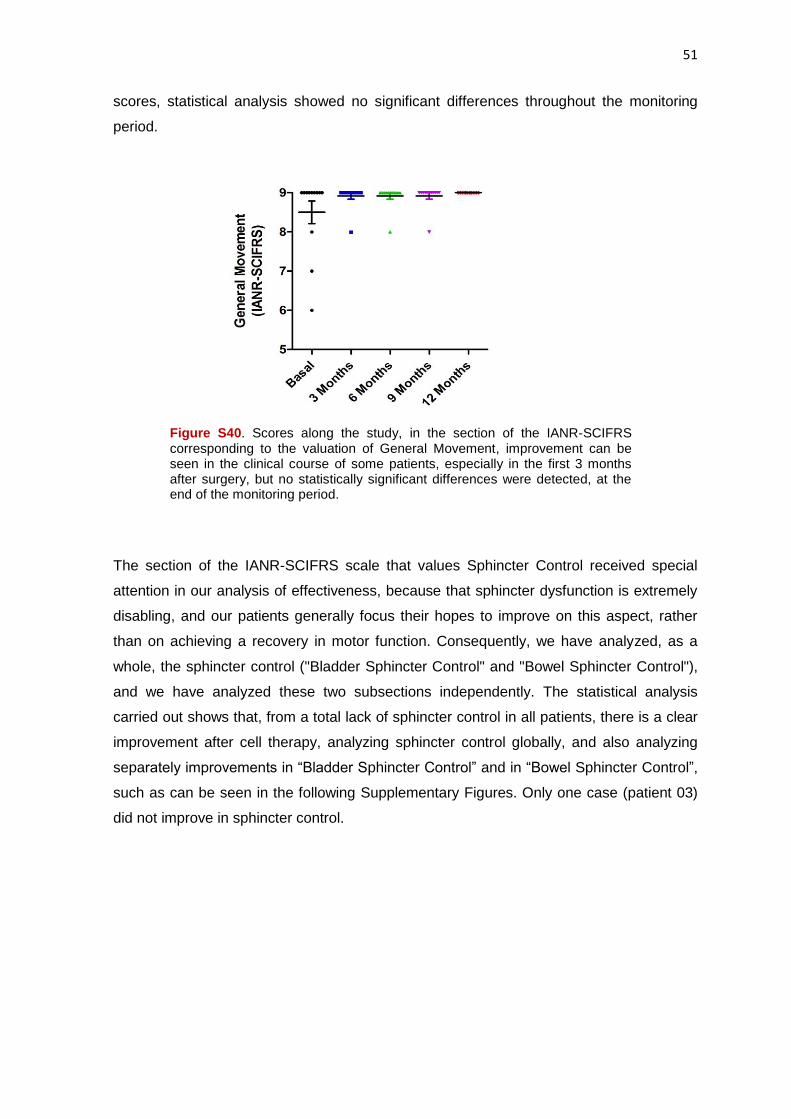
General Movement section of the IAN-SCIFRS scale consists of three subsections scoring
mainly transfers and the difficulty for patients to dress themselves. All patients except two
(patients 08 and 15) scored the maximum in this section in the baseline valuation. At the
end of follow-up, all the cases had reached the highest score, which also reflected a clear
improvement, but considering the number of patients in the series and the baseline
51
scores, statistical analysis showed no significant differences throughout the monitoring
period.
Figure S40. Scores along the study, in the section of the IANR-SCIFRS corresponding to the valuation of General Movement, improvement can be seen in the clinical course of some patients, especially in the first 3 months after surgery, but no statistically significant differences were detected, at the end of the monitoring period.
The section of the IANR-SCIFRS scale that values Sphincter Control received special
attention in our analysis of effectiveness, because that sphincter dysfunction is extremely
disabling, and our patients generally focus their hopes to improve on this aspect, rather
than on achieving a recovery in motor function. Consequently, we have analyzed, as a
whole, the sphincter control ("Bladder Sphincter Control" and "Bowel Sphincter Control"),
and we have analyzed these two subsections independently. The statistical analysis
carried out shows that, from a total lack of sphincter control in all patients, there is a clear
improvement after cell therapy, analyzing sphincter control globally, and also analyzing
separately improvements in “Bladder Sphincter Control” and in “Bowel Sphincter Control”,
such as can be seen in the following Supplementary Figures. Only one case (patient 03)
did not improve in sphincter control.

52
Figure S41. Scores in the Sphincter Control of IANR-SCIFRS scale, throughout
the study. Compared with baseline, there is a clear improvement, which is
progressive along the follow-up of patients with a p-value: 0.017 at 3 months after
surgery, with an effect size: 0.69; p: 0.011 at 6 months, with an effect size: 0.74; p:
0.007 at 9 months, with an effect size: 0.77, and ending at 12 months with a p:
0.003, and an effect size: 0.85.
Figure S42. Scores corresponding to subsection Bladder Sphincter Control of IANR-
SCIFRS scale. Compared with baseline, a clear improvement was seen with a p-
value: 0.011 in the analysis at 3, 6 and 9 months (effect size: 0.73), and ending at 12
months with a p-value: 0.003, and an effect size: 0.86.
53
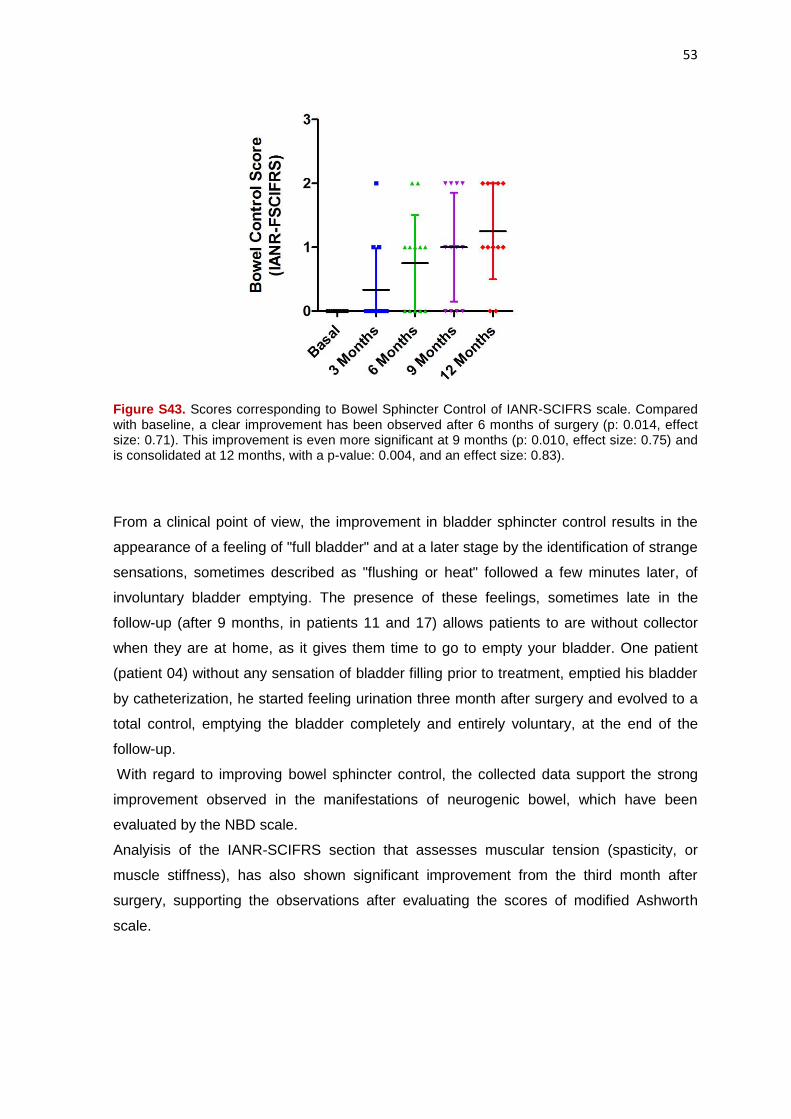
Figure S43. Scores corresponding to Bowel Sphincter Control of IANR-SCIFRS scale. Compared with baseline, a clear improvement has been observed after 6 months of surgery (p: 0.014, effect size: 0.71). This improvement is even more significant at 9 months (p: 0.010, effect size: 0.75) and is consolidated at 12 months, with a p-value: 0.004, and an effect size: 0.83).
From a clinical point of view, the improvement in bladder sphincter control results in the
appearance of a feeling of "full bladder" and at a later stage by the identification of strange
sensations, sometimes described as "flushing or heat" followed a few minutes later, of
involuntary bladder emptying. The presence of these feelings, sometimes late in the
follow-up (after 9 months, in patients 11 and 17) allows patients to are without collector
when they are at home, as it gives them time to go to empty your bladder. One patient
(patient 04) without any sensation of bladder filling prior to treatment, emptied his bladder
by catheterization, he started feeling urination three month after surgery and evolved to a
total control, emptying the bladder completely and entirely voluntary, at the end of the
follow-up.
With regard to improving bowel sphincter control, the collected data support the strong
improvement observed in the manifestations of neurogenic bowel, which have been
evaluated by the NBD scale.
Analyisis of the IANR-SCIFRS section that assesses muscular tension (spasticity, or
muscle stiffness), has also shown significant improvement from the third month after
surgery, supporting the observations after evaluating the scores of modified Ashworth
scale.

54
Figure S44. Scores in the section valuating Muscular Tension on IANR-SCIFRS
scale. A clear improvement during the study is appreciated, with p: 0.038 at 3 months,
but reaching clear statistical significance in the following months, with p: 0.008 at 6
months, p: 0.009 at 9 months, and a p-vaue of 0.006, with an effect size of 0.80, in the
analysis done at 12 months after surgery.
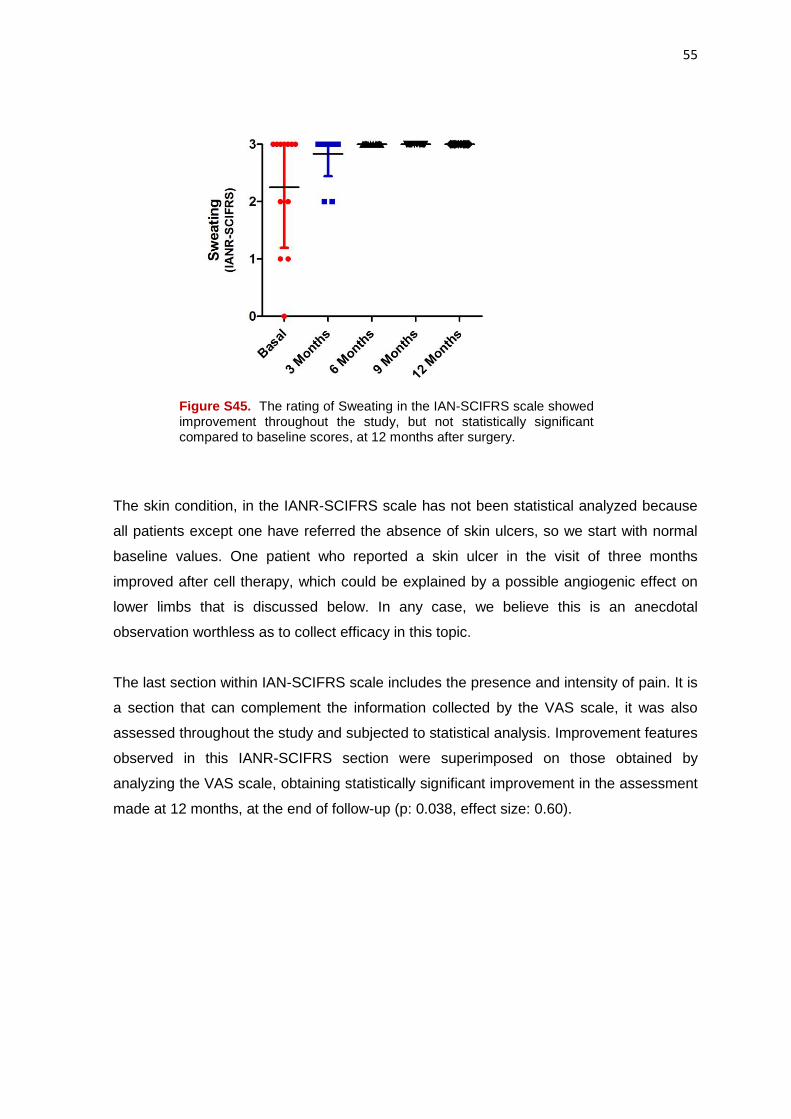
Sweating analysis within the IAN-SCIFRS scale has not allowed us to objectify significant
improvements above baseline values, although we assume that it is a fact difficult to be
evaluated by patients, since it is not uncommon for a patient to tell us that they have no
alteration in the sweating before treatment and during the third month visit, we realise that
the patient made a mistake, because after the cell therapy, has become a sweat and
recognizes that gave us as sweating "normal" what it really was a decreased sweating, to
which he was accustomed and considered as normal.
55
Figure S45. The rating of Sweating in the IAN-SCIFRS scale showed improvement throughout the study, but not statistically significant compared to baseline scores, at 12 months after surgery.
The skin condition, in the IANR-SCIFRS scale has not been statistical analyzed because
all patients except one have referred the absence of skin ulcers, so we start with normal
baseline values. One patient who reported a skin ulcer in the visit of three months
improved after cell therapy, which could be explained by a possible angiogenic effect on
lower limbs that is discussed below. In any case, we believe this is an anecdotal
observation worthless as to collect efficacy in this topic.
The last section within IAN-SCIFRS scale includes the presence and intensity of pain. It is
a section that can complement the information collected by the VAS scale, it was also
assessed throughout the study and subjected to statistical analysis. Improvement features
observed in this IANR-SCIFRS section were superimposed on those obtained by
analyzing the VAS scale, obtaining statistically significant improvement in the assessment
made at 12 months, at the end of follow-up (p: 0.038, effect size: 0.60).

56
Figure S46. Graph showing progressive improvement in the section valuating Pain
of the IANR-SCIFRS scale. At 3 months a difference in comparation with the
baseline can be seen, but without statistical significance. At 6 and 9 months scores
remain without statistical significance compared with baseline (p: 0.059), but at the
end of the follow-up, statistical significance can be seen (p: 0.038, effect size:
0.60).
In the IANR-SCIFRS scale, a final section related to sexual function, that rate
independently, is contemplated. It applies only to men, and has also been subject of
evaluation and statistical analysis throughout the study. Our analysis showed a
progressive improvement, reaching statistical significant difference compared to baseline
at 3 months after surgery. This improvements generally consisted of an increase in
number and duration of erections, increased sensitivity, and even recovery of ejaculations,
previously lost. One patient (patient 14, with SCI at D7-D8 level) reported involuntary loss
of sperm that he had not had since the time of the SCI, more than 25 years ago.
The following graph shows the scores in sexual function in men of the series.

57
Figure S47. Scores in Sexual Function of the IAN-SCIFRS scale, collected
throughout the study. Compared with baseline, a significant improvement at 3
months after surgery can be seen (p: 0.046, effect size: 0.58). It reached a p-
value of 0.025 at 6 months (effect size: 0.65) that is maintained during the
follow-up of patients.
In short, our analysis showed a significant and progressive improvement in most of
sections and subsections of the IANR-SCIFRS scale, which indicates an obvious benefit
of treatment.
FIM and Barthel Scales
FIM 45 and Barthel 46 scales are generally used as a measure of functional independence.
In Barthel scale we found no significant differences between the baseline score in these
scales and scores collected at 3, 6, 9 and 12 months of follow up. However, in FIM Scale,
significant improvement with moderate effect size was found from 6 months in overall
score and sphincter control sections. Although this finding supports the sphincter
improvement obtained in other clinical scales, we think that FIM and Barthel scales are of
limited value for the evaluation of our patients, because these scales value the adaptation
to the disability rather than the disability itself, and usually paraplegic patients are highly
adapted to its disability after many years of SCI.

58
Supplementary Table 10. SCORES IN THE MAIN SECTIONS OF THE FIM SCALE, AT DIFFERENT TIME POINTS
Score subject Time Mean SD p-value Effect size
FIM OVERALL
SCORE
Before surgery 116.75 0.75
3 months after surgery 117.08 1.31 0.102 -
6 months after surgery 117.42 1.56 0.039 0.59
9 months after surgery 117.58 1.68 0.039 0.59
12 months after surgery 117.92 1.88 0.026 0.64
SPHINCTER
CONTROL
Before surgery 12.00 0.00
3 months after surgery 12.33 0.65 0.102 -
6 months after surgery 12.58 0.78 0.038 0.47
9 months after surgery 12.58 0.78 0.038 0.47
12 months after surgery 12.83 0.94 0.023 0.66
Note: Significant p-values are red.
Supplementary Table 10. Scores in the main Sections of the FIM Scales, at 3, 6, 9 and 12 months after surgery.
Visual Analog Scale (VAS)
The VAS 47 is an analog scale to measure, subjectively by the patient, pain intensity in a
range of 0 to 10. Despite its obvious limitations, it is generally used to assess the intensity
of neuropathic pain. One of the main concerns in the design of our study was the risk that
surgery or cellular administration could somehow increase the neuropathic pain of
patients with a chronically established paraplegia, especially considering that a transient
increase neuropathic pain has been described after cell therapy in some previous
publications. Although in our series, only 7 of the 12 patients (58%) had significant
neuropathic pain, we have paid special care to evaluate this possibility as it could
represent a limitation of treatment, but in any case we were able to see an increase, albeit
transient, of neuropathic pain, or onset of neuropathic pain in patients who did not have it
previously.
The Supplementary Figure below shows the assessment of neuropathic pain throughout
the study. A tendency to decrease in neuropathic pain after treatment can be seen,
reaching statistical significance at the end of follow-up. This downward trend of
neuropathic pain is confirmed by the analysis of the pain in the IANR-SCIFRS scale.
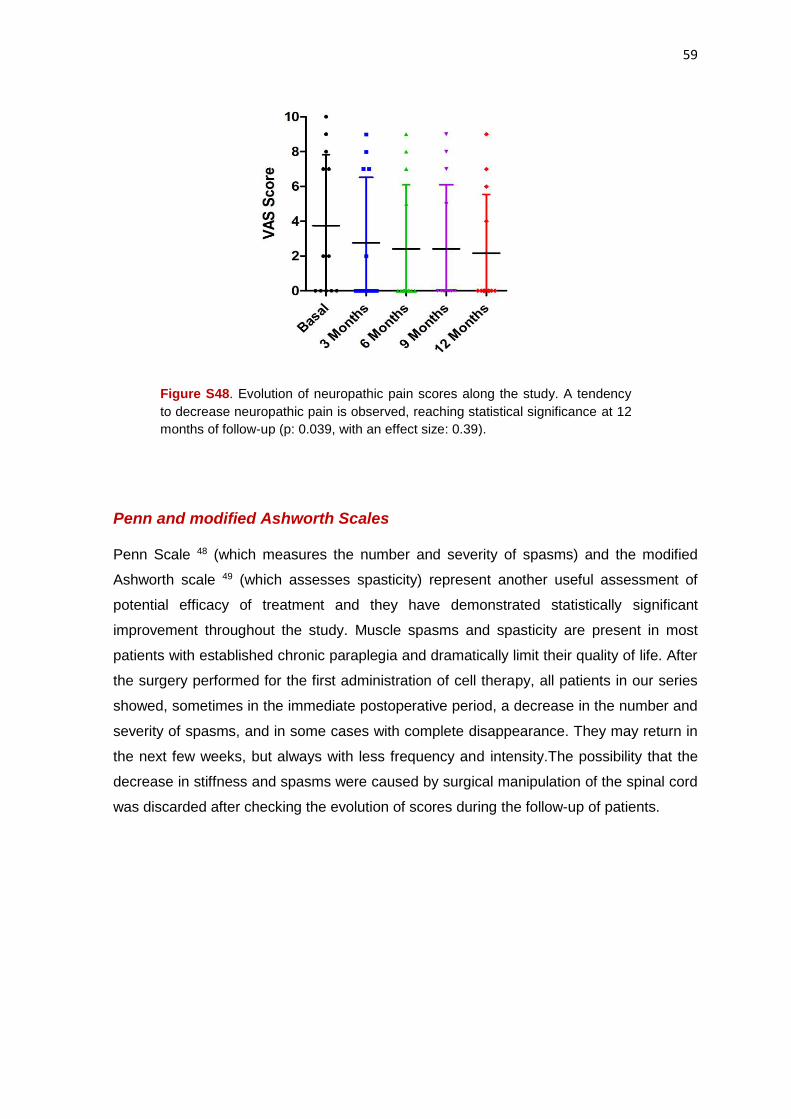
59
Figure S48. Evolution of neuropathic pain scores along the study. A tendency
to decrease neuropathic pain is observed, reaching statistical significance at 12
months of follow-up (p: 0.039, with an effect size: 0.39).
Penn and modified Ashworth Scales Penn Scale 48 (which measures the number and severity of spasms) and the modified
Ashworth scale 49 (which assesses spasticity) represent another useful assessment of
potential efficacy of treatment and they have demonstrated statistically significant
improvement throughout the study. Muscle spasms and spasticity are present in most
patients with established chronic paraplegia and dramatically limit their quality of life. After
the surgery performed for the first administration of cell therapy, all patients in our series
showed, sometimes in the immediate postoperative period, a decrease in the number and
severity of spasms, and in some cases with complete disappearance. They may return in
the next few weeks, but always with less frequency and intensity.The possibility that the
decrease in stiffness and spasms were caused by surgical manipulation of the spinal cord
was discarded after checking the evolution of scores during the follow-up of patients.

60
Figure S49. Evolution of scores on the Penn scale, throughout the study. Compared with baseline, statistically significant difference was seen at 3 months (p: 0.014, effect size: 0.71), 6 months (p: 0.009, effect size: 0.75), 9 months (p: 0.010, effect size: 0.75) and 12 months of follow-up (p: 0.010, effect size: 0.74).
Figure S50. Scores on the Ashworth scale throughout the study. A gradual
reduction of spasticity, with clear statistical significance can be seen. Values of p
were 0.017 at 3 months, with an effect size: 0.69, and p: 0.003, with an effect size:
0.74, at 6, 9 and 12 months of follow-up.
In short, there is an obvious action of cell therapy improving spasticity and the number
and intensity of the spasms of patients. However, we have not been able to establish
correlation between degree of improvement and number of cells administered. The benefit
of cell therapy in reduction of spasticity is reflected consistently in the periodic reports we
have received from the patients themselves and physiotherapists responsible for their
rehabilitation. The Supplementary Table below shows a summary of the statistical
analysis in regard to the scales of Penn and Ashworth.

61
Supplementary Table 11. SCORES IN PENN AND ASHWORTH SCALES AT DIFFERENT TIME POINTS
Score subject Time Mean SD p-value Effect size
PENN SCALE
Before surgery 2.58 1.08
3 months after surgery 1.83 1.03 0.014 0.71
6 months after surgery 1.50 1.09 0.009 0.75
9 months after surgery 1.58 1.00 0.010 0.75
12 months after surgery 1.42 0.90 0.010 0.74
ASHWORTH
SCALE
Before surgery 2.04 1.30
3 months after surgery 1.38 0.77 0.017 0.69
6 months after surgery 0.88 0.74 0.003 0.85
9 months after surgery 0.88 0.74 0.003 0.85
12 months after surgery 0.71 0.81 0.003 0.85
Note: Significant p-values are red.
Supplementary Table 11. Analysis of the Scores in the Penn and Ashworth scales at 3, 6, 9 and 12 months after surgery.
Geffner Scale
Given the importance of any improvement in sphincter control, we also used another scale
for evaluation of bladder function, in order to obtain further information on the data
provided by the analysis of the IANR-SCIFRS scale.
Geffner scale values through 0-6 points bladder function, with 0 being complete absence
of control and 6 normal urinary control and was applied in a pioneer study that showed the
usefulness of cell therapy to improve quality of life in patients with SCI 24. In our series, the
application of this scale has allowed us to confirm the effectiveness of treatment. The
following Supplementary Table and Figure show the scores in this scale along the
evolution of our patients.
Supplementary Table 12. SCORES IN GEFFNER SCALE AT THE DIFFERENT TIME POINTS
Score subject Time Mean SD p-value Effect size
GEFFNER
SCALE
Before surgery 0.92 1.38
3 months after surgery 1.92 1.83 0.109 -
6 months after surgery 2.25 1.87 0.063 -
9 months after surgery 2.25 1.87 0.063 -
12 months after surgery 2.75 1.55 0.023 0.66
Note. Significant p-values are red.
Supplementary Table 12. Analysis of the scores in the Geffner Scale.

62
Figure S51. Scores on the scale of Geffner, measuring bladder function, along
the course of the study. Improvement was seen as early as 3 months of evolution
(p: 0.109) which is progressive, stabilized between 6 and 9 months (p: 0.063) and
reached statistical significance at 12 months after surgery (p: 0.023, with a effect
size: 0.66).
NBD Scale
In patients with SCI and chronically established paraplegia, lack of bowel control is a
major cause of disability for its personal and social significance. Although generally it is
considered that the need for permanent or intermittent urinary catheterization is between
the main problems of paraplegic patients, the reality is that manifestations of neurogenic
bowel are much more disabling.
The assessment throughout our study of the manifestations of neurogenic bowel was
made by NBD (Neurogenic Bowel Dysfunction) scale 20. This scale consists of 10 sections
in which different scores are given to aspects such as the frequency with which deposition
is done, time needed for each bowel movement, discomfort during defecation, need for
measures to facilitate this, fecal or gas incontinence, etc.
It was a surprising and almost constant the information from patients about that after
surgery bowel movement was improved, so that they noticed peristalsis, and defecation
was clearly modified in terms of frequency and time they needed, going even to defecate
daily and within minutes, without need of laxatives. As the improvement observed with the
IANR-SCIFRS scale, improvement is immediate and very strong in the first 3 months after
surgery, it is progressive in time and is described as extremely rewarding in almost all
periodic reports from our patients and their videotaped statements.
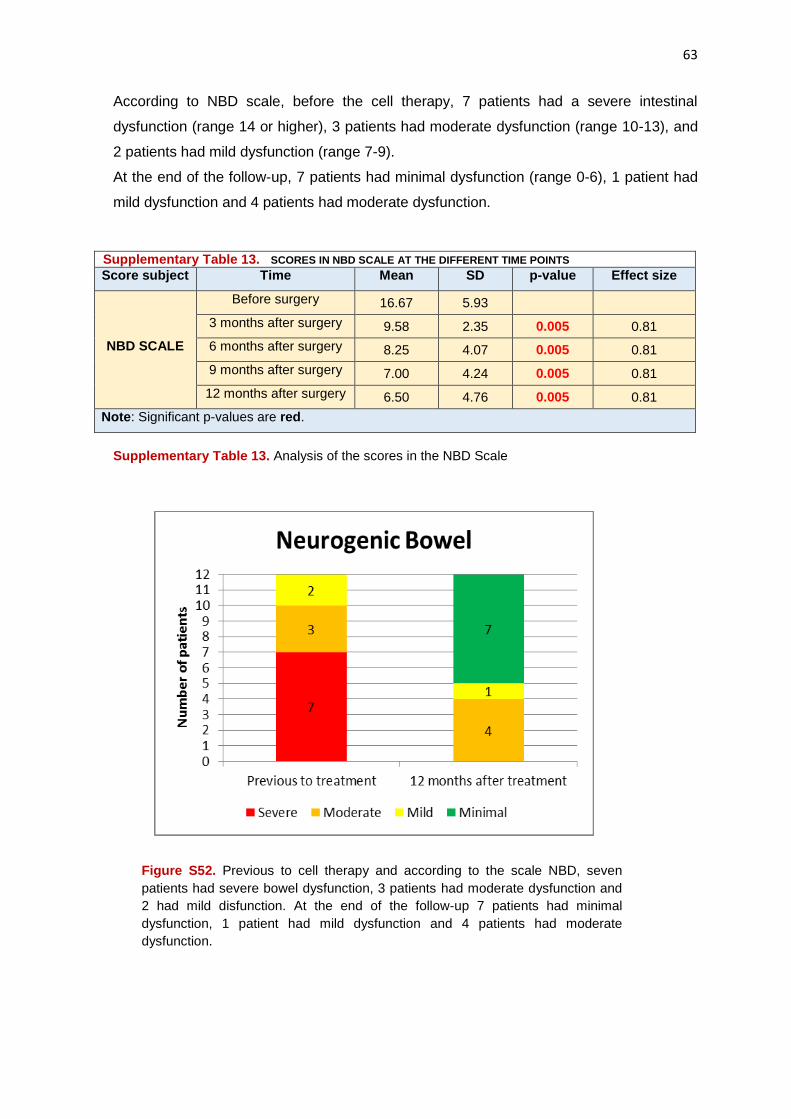
63
According to NBD scale, before the cell therapy, 7 patients had a severe intestinal
dysfunction (range 14 or higher), 3 patients had moderate dysfunction (range 10-13), and
2 patients had mild dysfunction (range 7-9).
At the end of the follow-up, 7 patients had minimal dysfunction (range 0-6), 1 patient had
mild dysfunction and 4 patients had moderate dysfunction.
Supplementary Table 13. SCORES IN NBD SCALE AT THE DIFFERENT TIME POINTS
Score subject Time Mean SD p-value Effect size
NBD SCALE
Before surgery 16.67 5.93
3 months after surgery 9.58 2.35 0.005 0.81
6 months after surgery 8.25 4.07 0.005 0.81
9 months after surgery 7.00 4.24 0.005 0.81
12 months after surgery 6.50 4.76 0.005 0.81
Note: Significant p-values are red.
Supplementary Table 13. Analysis of the scores in the NBD Scale
Figure S52. Previous to cell therapy and according to the scale NBD, seven
patients had severe bowel dysfunction, 3 patients had moderate dysfunction and
2 had mild disfunction. At the end of the follow-up 7 patients had minimal
dysfunction, 1 patient had mild dysfunction and 4 patients had moderate
dysfunction.

64
Figure S53. A progressive decline in disability-related neurogenic bowel can be
seen, according to NBD scale. At 3 months after surgery there is already a
difference, with clear statistical significance compared to baseline scores (p:
0.005, effect size: 0.81). This significant improvement remains in the analysis at
6, 9 and 12 months after surgery.
Figure S54. Graph showing, individually for each of our patients, the improvement
achieved in the NBD scale. Only in 2 patients (patients 02 and 03) both with
moderate dysfunction previously to treatment, showed no improvement in
neurogenic bowel dysfunction.
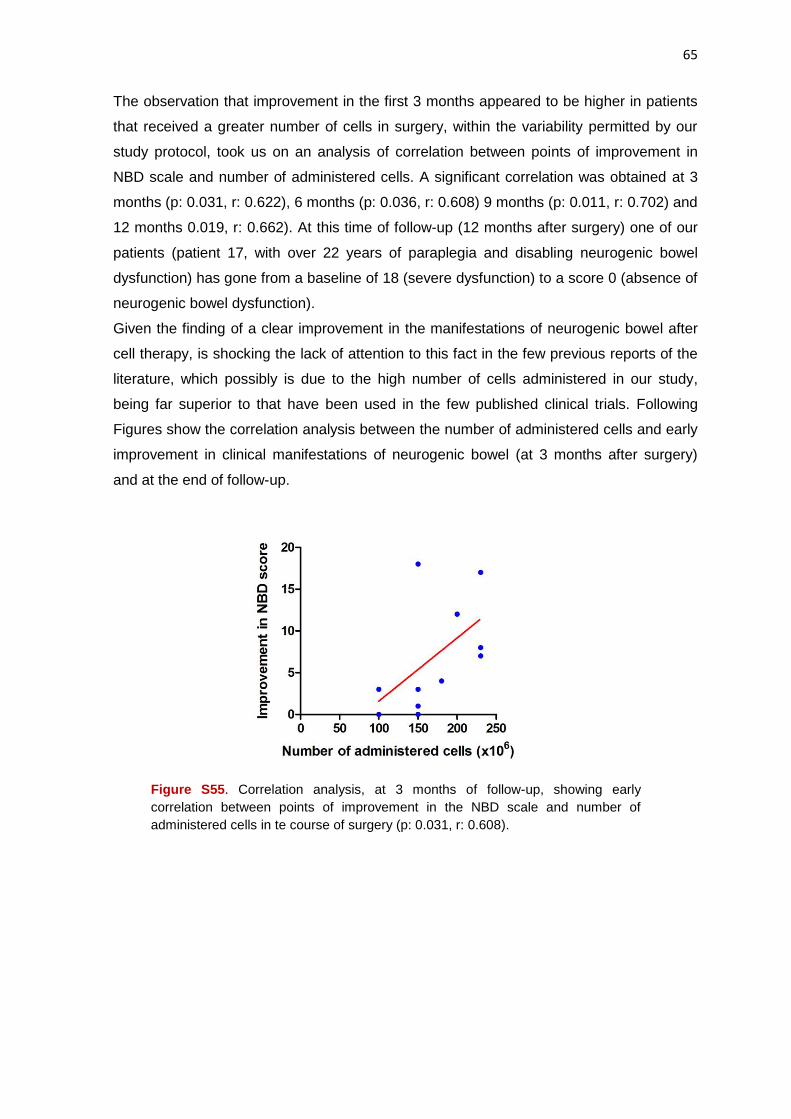
65
The observation that improvement in the first 3 months appeared to be higher in patients
that received a greater number of cells in surgery, within the variability permitted by our
study protocol, took us on an analysis of correlation between points of improvement in
NBD scale and number of administered cells. A significant correlation was obtained at 3
months (p: 0.031, r: 0.622), 6 months (p: 0.036, r: 0.608) 9 months (p: 0.011, r: 0.702) and
12 months 0.019, r: 0.662). At this time of follow-up (12 months after surgery) one of our
patients (patient 17, with over 22 years of paraplegia and disabling neurogenic bowel
dysfunction) has gone from a baseline of 18 (severe dysfunction) to a score 0 (absence of
neurogenic bowel dysfunction).
Given the finding of a clear improvement in the manifestations of neurogenic bowel after
cell therapy, is shocking the lack of attention to this fact in the few previous reports of the
literature, which possibly is due to the high number of cells administered in our study,
being far superior to that have been used in the few published clinical trials. Following
Figures show the correlation analysis between the number of administered cells and early
improvement in clinical manifestations of neurogenic bowel (at 3 months after surgery)
and at the end of follow-up.
Figure S55. Correlation analysis, at 3 months of follow-up, showing early
correlation between points of improvement in the NBD scale and number of
administered cells in te course of surgery (p: 0.031, r: 0.608).
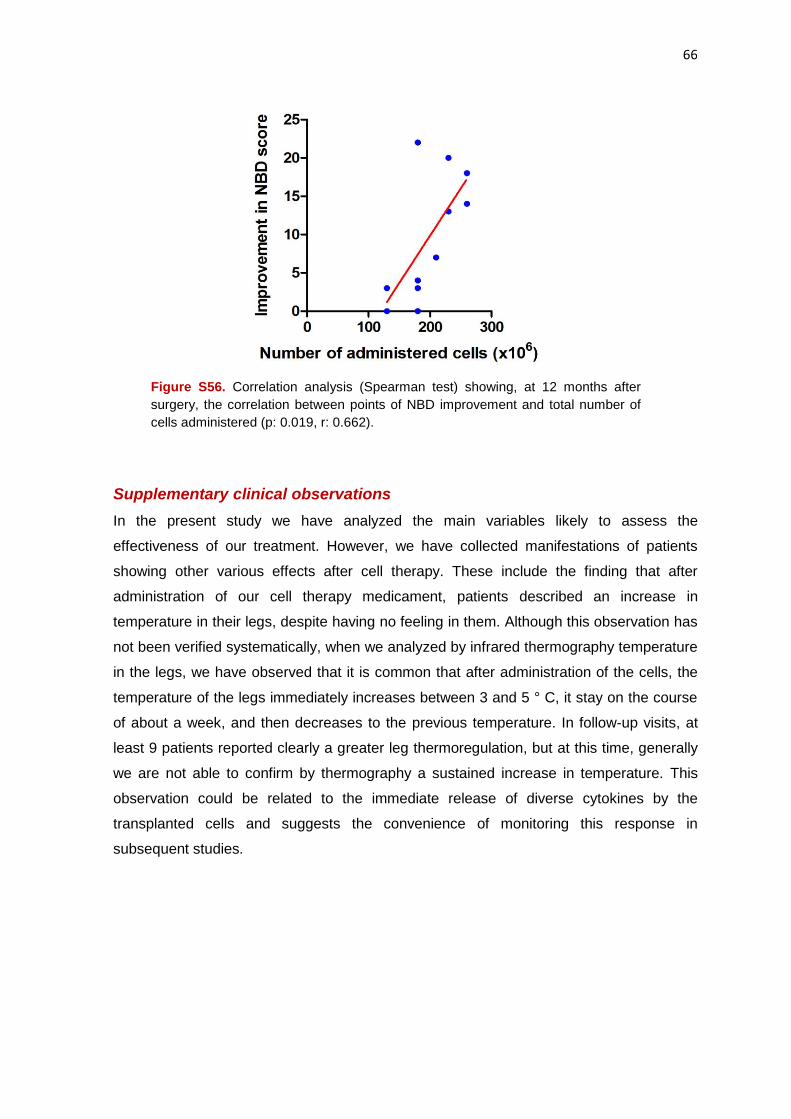
66
Figure S56. Correlation analysis (Spearman test) showing, at 12 months after
surgery, the correlation between points of NBD improvement and total number of
cells administered (p: 0.019, r: 0.662).
Supplementary clinical observations
In the present study we have analyzed the main variables likely to assess the
effectiveness of our treatment. However, we have collected manifestations of patients
showing other various effects after cell therapy. These include the finding that after
administration of our cell therapy medicament, patients described an increase in
temperature in their legs, despite having no feeling in them. Although this observation has
not been verified systematically, when we analyzed by infrared thermography temperature
in the legs, we have observed that it is common that after administration of the cells, the
temperature of the legs immediately increases between 3 and 5 ° C, it stay on the course
of about a week, and then decreases to the previous temperature. In follow-up visits, at
least 9 patients reported clearly a greater leg thermoregulation, but at this time, generally
we are not able to confirm by thermography a sustained increase in temperature. This
observation could be related to the immediate release of diverse cytokines by the
transplanted cells and suggests the convenience of monitoring this response in
subsequent studies.
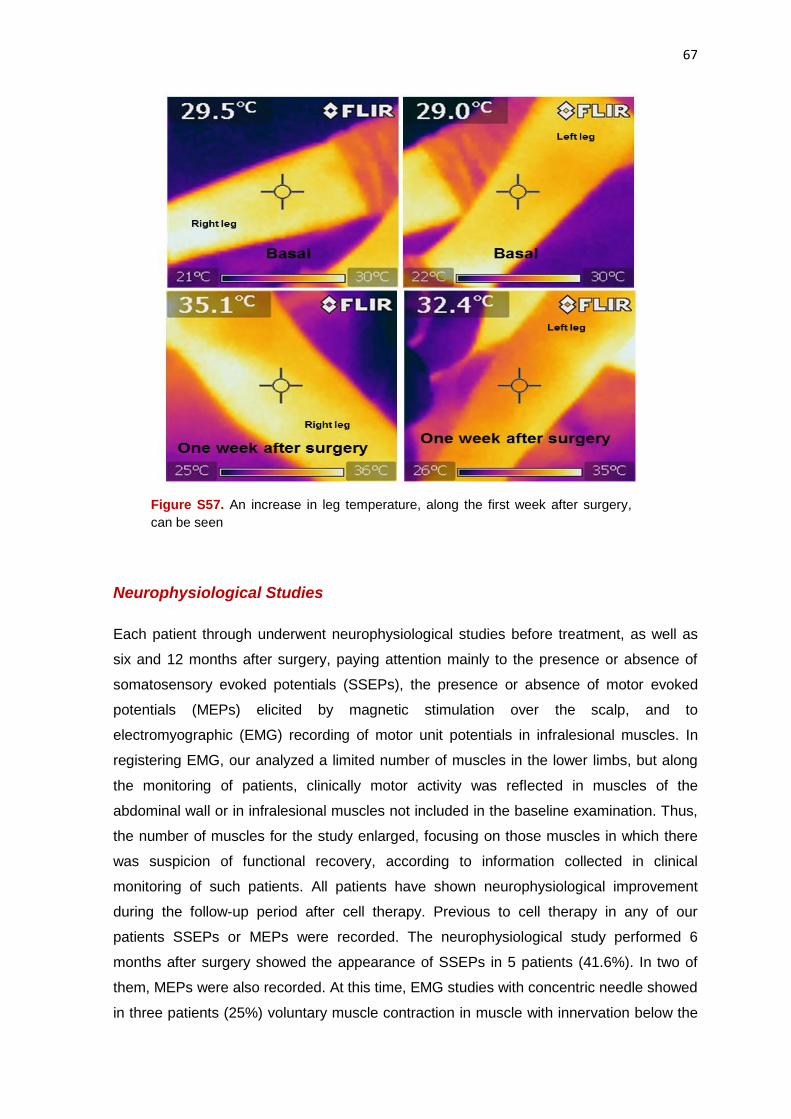
67
Figure S57. An increase in leg temperature, along the first week after surgery,
can be seen
Neurophysiological Studies
Each patient through underwent neurophysiological studies before treatment, as well as
six and 12 months after surgery, paying attention mainly to the presence or absence of
somatosensory evoked potentials (SSEPs), the presence or absence of motor evoked
potentials (MEPs) elicited by magnetic stimulation over the scalp, and to
electromyographic (EMG) recording of motor unit potentials in infralesional muscles. In
registering EMG, our analyzed a limited number of muscles in the lower limbs, but along
the monitoring of patients, clinically motor activity was reflected in muscles of the
abdominal wall or in infralesional muscles not included in the baseline examination. Thus,
the number of muscles for the study enlarged, focusing on those muscles in which there
was suspicion of functional recovery, according to information collected in clinical
monitoring of such patients. All patients have shown neurophysiological improvement
during the follow-up period after cell therapy. Previous to cell therapy in any of our
patients SSEPs or MEPs were recorded. The neurophysiological study performed 6
months after surgery showed the appearance of SSEPs in 5 patients (41.6%). In two of
them, MEPs were also recorded. At this time, EMG studies with concentric needle showed
in three patients (25%) voluntary muscle contraction in muscle with innervation below the
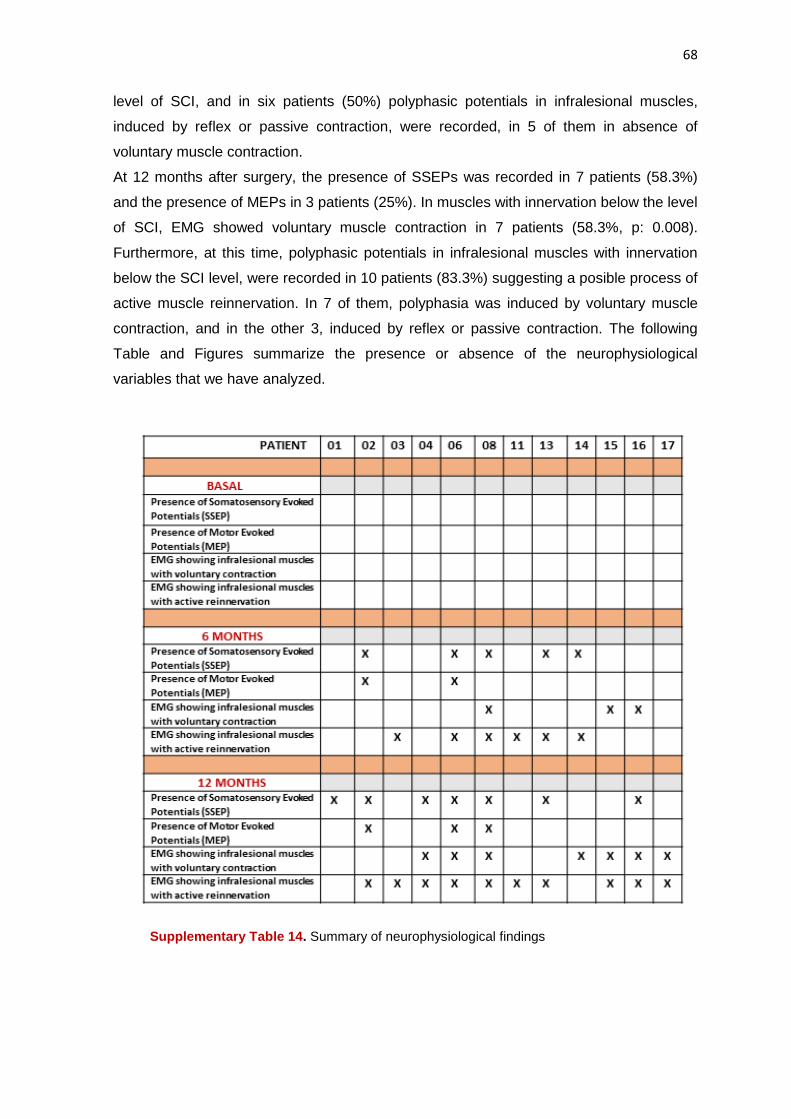
68
level of SCI, and in six patients (50%) polyphasic potentials in infralesional muscles,
induced by reflex or passive contraction, were recorded, in 5 of them in absence of
voluntary muscle contraction.
At 12 months after surgery, the presence of SSEPs was recorded in 7 patients (58.3%)
and the presence of MEPs in 3 patients (25%). In muscles with innervation below the level
of SCI, EMG showed voluntary muscle contraction in 7 patients (58.3%, p: 0.008).
Furthermore, at this time, polyphasic potentials in infralesional muscles with innervation
below the SCI level, were recorded in 10 patients (83.3%) suggesting a posible process of
active muscle reinnervation. In 7 of them, polyphasia was induced by voluntary muscle
contraction, and in the other 3, induced by reflex or passive contraction. The following
Table and Figures summarize the presence or absence of the neurophysiological
variables that we have analyzed.
Supplementary Table 14. Summary of neurophysiological findings
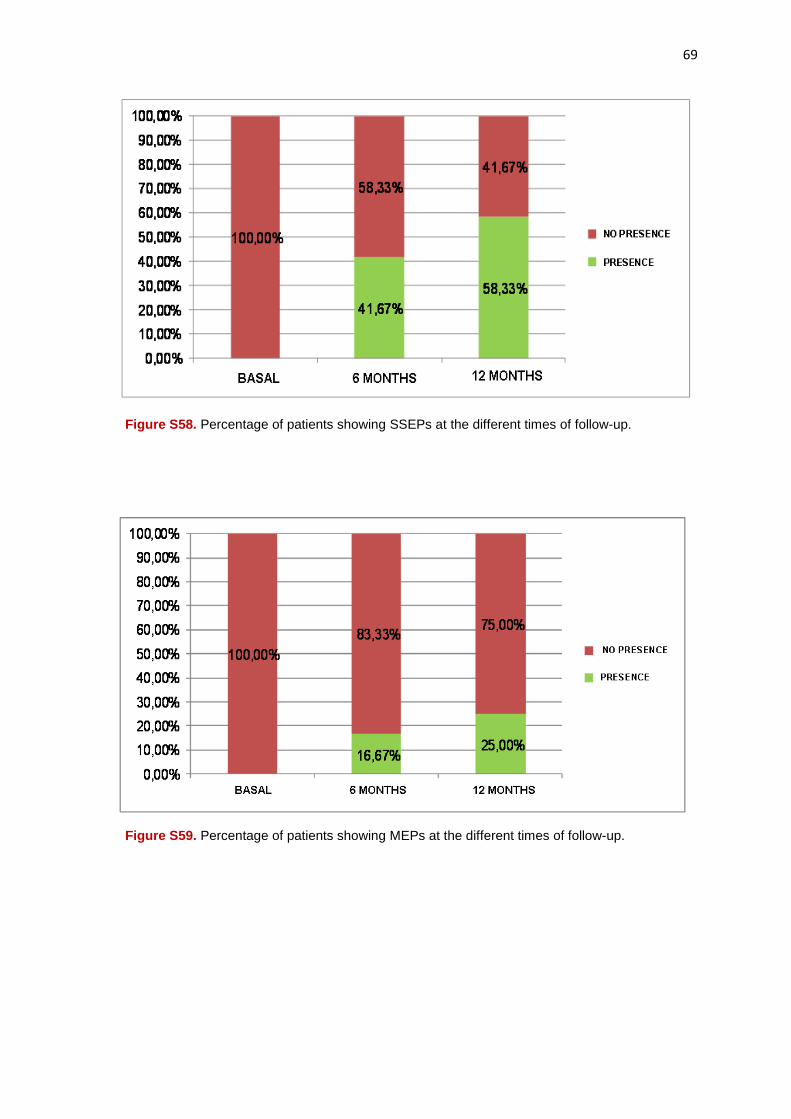
69
Figure S58. Percentage of patients showing SSEPs at the different times of follow-up.
Figure S59. Percentage of patients showing MEPs at the different times of follow-up.

70
Figure S60. Percentage of patients showing, throughout the study, EMG findings of voluntary muscle contraction in muscles below the SCI level.
Figure S61. Percentage of patients showing, throughout the study, EMG findings of active muscle reinnervation, in muscles below the level of SCI
In short, the neurophysiological records objectively demonstrated that the treatment
implemented allows the regeneration or activation of nonfunctionating nerve pathways,
which results in a recurrence of previously nonexistent evoked potentials and clear
infralesional muscle reinnervation, at previously unthinkable distances, considering the
level of SCI and the characteristic of a complete and chronic paraplegia. The following
Supplementary Figure shows an example corresponding to our patient 08. This is a 58
year-old woman with complete paraplegia (ASIA A) since 1996, and a SCI at D6-D7 level.
After surgery, she gradually experienced a spectacular recovery of sensitivity, reaching
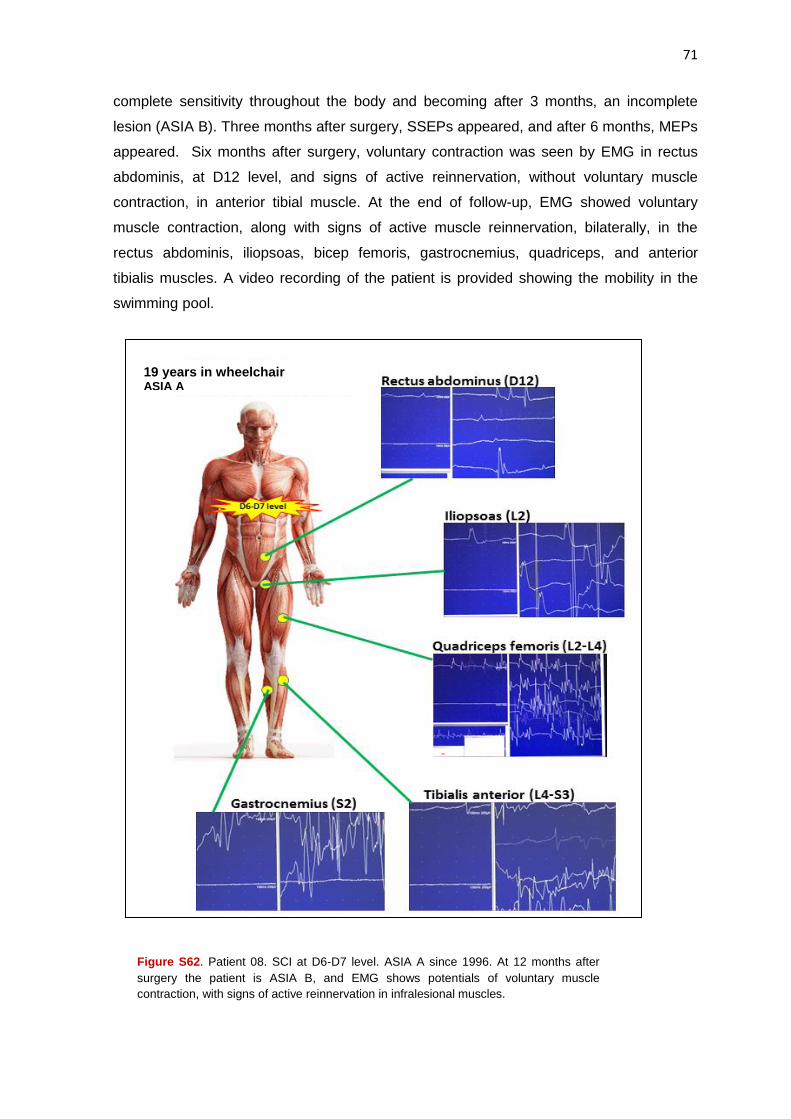
71
complete sensitivity throughout the body and becoming after 3 months, an incomplete
lesion (ASIA B). Three months after surgery, SSEPs appeared, and after 6 months, MEPs
appeared. Six months after surgery, voluntary contraction was seen by EMG in rectus
abdominis, at D12 level, and signs of active reinnervation, without voluntary muscle
contraction, in anterior tibial muscle. At the end of follow-up, EMG showed voluntary
muscle contraction, along with signs of active muscle reinnervation, bilaterally, in the
rectus abdominis, iliopsoas, bicep femoris, gastrocnemius, quadriceps, and anterior
tibialis muscles. A video recording of the patient is provided showing the mobility in the
swimming pool.
Figure S62. Patient 08. SCI at D6-D7 level. ASIA A since 1996. At 12 months after
surgery the patient is ASIA B, and EMG shows potentials of voluntary muscle
contraction, with signs of active reinnervation in infralesional muscles.
19 years in wheelchair ASIA A

72
Urodynamic Studies
Being neurogenic bladder one of the biggest problems associated with SCI, with important
personal and social implications, we paid special attention to an objective analysis, by
urodynamic testing, of a possible improvement after cell therapy. In all cases, a baseline
study before starting the treatment, and a final study 12 months after surgery was
performed. All urodynamic studies were made in the absence of urinary tract infection. In
the baseline examination flowmetry could not be obtained nor could a pressure-flow test in
any patient be performed due to absence of voluntary urination.
Analyzing all patients and according to the urodynamic study, in 10 patients (83%)
improvement was observed 12 months after surgery, compared with data collected before
cell therapy. This improvement consisted in the possibility of voluntary micturition in
flowmetry (3 patients) or in pressure/flow test in (4 patients), increase in bladder capacity
filling (8 patients), decrease in detrusor pressure at bladder filling (9 patients), or increase
in bladder compliance (10 patients). Urodynamic data are summarized in the following
Supplementary Table, in which it is reflected that only 2 patients of the series (patients 03
and 08) showed absence of urodynamic improvement.
Supplementary Table 15. SUMMARY OF URODYNAMIC STUDIES
Supplementary Table 15. Summary of Urodynamic findings
In the following Supplementary Table, a summary of the statistical analyses can be seen:
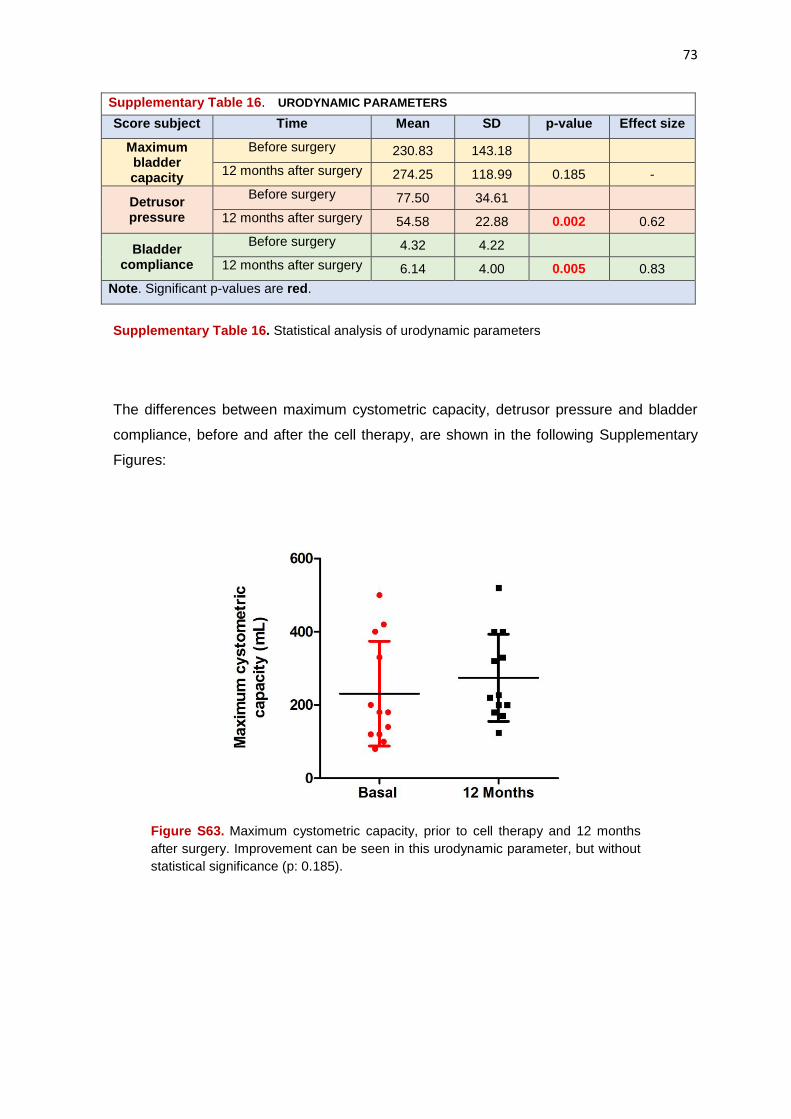
73
Supplementary Table 16. URODYNAMIC PARAMETERS
Score subject Time Mean SD p-value Effect size
Maximum bladder capacity
Before surgery 230.83 143.18
12 months after surgery 274.25 118.99 0.185 -
Detrusor pressure
Before surgery 77.50 34.61
12 months after surgery 54.58 22.88 0.002 0.62
Bladder compliance
Before surgery 4.32 4.22
12 months after surgery 6.14 4.00 0.005 0.83
Note. Significant p-values are red.
Supplementary Table 16. Statistical analysis of urodynamic parameters
The differences between maximum cystometric capacity, detrusor pressure and bladder
compliance, before and after the cell therapy, are shown in the following Supplementary
Figures:
Figure S63. Maximum cystometric capacity, prior to cell therapy and 12 months
after surgery. Improvement can be seen in this urodynamic parameter, but without
statistical significance (p: 0.185).
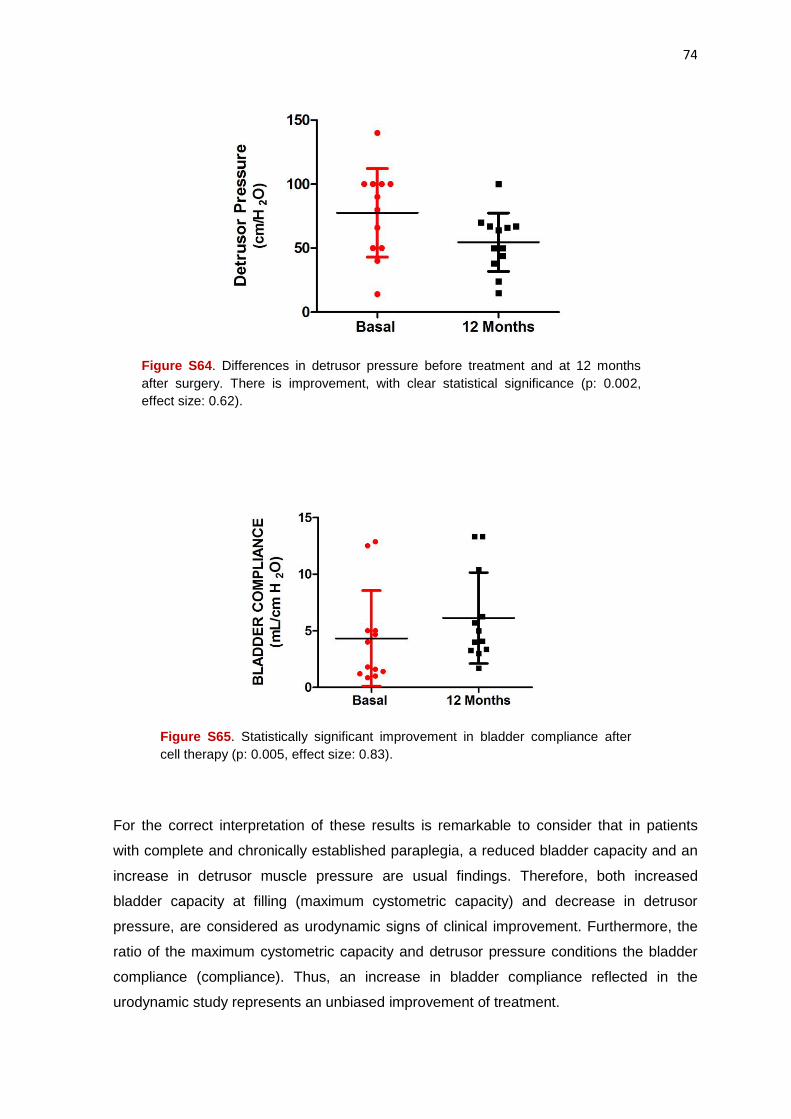
74
Figure S64. Differences in detrusor pressure before treatment and at 12 months
after surgery. There is improvement, with clear statistical significance (p: 0.002,
effect size: 0.62).
Figure S65. Statistically significant improvement in bladder compliance after
cell therapy (p: 0.005, effect size: 0.83).
For the correct interpretation of these results is remarkable to consider that in patients
with complete and chronically established paraplegia, a reduced bladder capacity and an
increase in detrusor muscle pressure are usual findings. Therefore, both increased
bladder capacity at filling (maximum cystometric capacity) and decrease in detrusor
pressure, are considered as urodynamic signs of clinical improvement. Furthermore, the
ratio of the maximum cystometric capacity and detrusor pressure conditions the bladder
compliance (compliance). Thus, an increase in bladder compliance reflected in the
urodynamic study represents an unbiased improvement of treatment.

75
In any case, improvement in bladder compliance showed no correlation with the number
of cells administered or with improvements obtained in total ASIA or in overall score of
IANR-SCIFRS scale.
Neuroimage Studies
Modifications of Magnetic Resonance Imaging (MRI) are difficult to interpret because
many patients have spinal fixation devices originating artefacts and because sagittal
images are not exactly superimposable in different studies. Generally, in the areas of SCI,
variable degree of spinal cord atrophy and hiperyntense images in phase T2 of MRI and in
MR-myelography are observed. These images are often interpreted as intramedullary
cysts, but at surgery generally are a mixture of cysts, gliosis and myelomalacia. In these
areas the administration of cells is easy without swelling can be appreciate in the injured
spinal tissue after administration.
Although artefacts are not an impediment to assess, prior to surgery, the area and extent
of SCI and make a planning of cell number and volume to be injected into injured tissue, a
reliable analysis of lesion volume for comparison purposes is difficult. Therefore, we have
chosen mainly performs qualitative analysis of the neuroimage changes found in our
patients comparing the baseline studies and the studies conducted 12 months after cell
therapy.
Nonetheless, the approximate volume of intramedullary hyperintense lesions, according to
measurements taken from the MR-myelography images ranged between 0.1 cc and 6.1
cc., with a mean of 2.2 cc (sd: 2.05) cc. At the end of follow-up, the approximate volume of
lesions ranged between 0 cc and 6.1 cc, with a mean ± standard deviation of 1.00 cc (sd:
2.03) and a p-value: 0.015. The measurements were made using the software associated
with the RM 1.5 T equipment (Philips Intera Achieva XR, v. 263.9 Philips Healthcare,
Madrid, Spain), and myelographic effect was achieved with sequences of "turbo spin-
echo".
In any case, after analyzing by neuroimage possible changes in the spinal cord
morphology at the end of the period of follow-up, we found no images suggesting
worsening, within the limitations described above, existing primarily changes in the signal
of the spinal cord tissue, whose interpretation may be subject to discussion. In 2 cases in
our series we have not detected significant changes with regard to the basal
characteristics of the SCI (patients 02 and 13) or we detected minor changes that may be
related to the different cutting planes or surgical artefacts.
The main changes found can be summarized in the existence of a reduction of supossed
cysts and a decrease or disappearance of hyperintense lesions, suggesting the
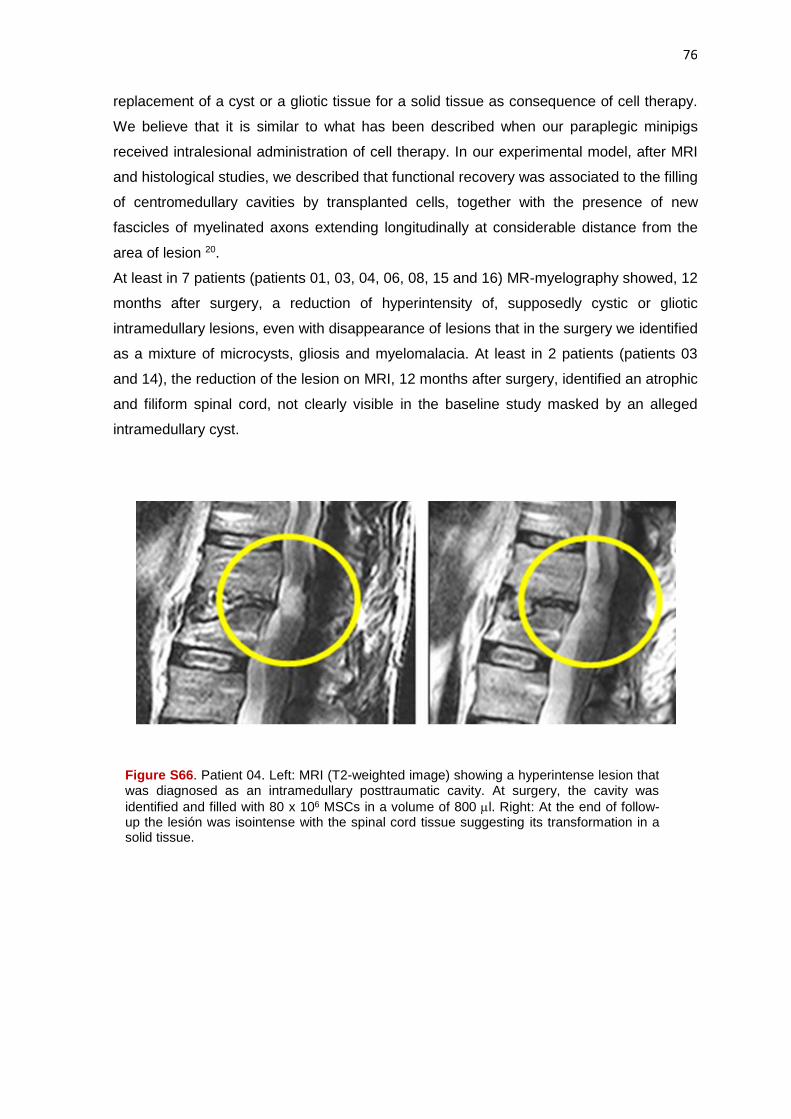
76
replacement of a cyst or a gliotic tissue for a solid tissue as consequence of cell therapy.
We believe that it is similar to what has been described when our paraplegic minipigs
received intralesional administration of cell therapy. In our experimental model, after MRI
and histological studies, we described that functional recovery was associated to the filling
of centromedullary cavities by transplanted cells, together with the presence of new
fascicles of myelinated axons extending longitudinally at considerable distance from the
area of lesion 20.
At least in 7 patients (patients 01, 03, 04, 06, 08, 15 and 16) MR-myelography showed, 12
months after surgery, a reduction of hyperintensity of, supposedly cystic or gliotic
intramedullary lesions, even with disappearance of lesions that in the surgery we identified
as a mixture of microcysts, gliosis and myelomalacia. At least in 2 patients (patients 03
and 14), the reduction of the lesion on MRI, 12 months after surgery, identified an atrophic
and filiform spinal cord, not clearly visible in the baseline study masked by an alleged
intramedullary cyst.
Figure S66. Patient 04. Left: MRI (T2-weighted image) showing a hyperintense lesion that was diagnosed as an intramedullary posttraumatic cavity. At surgery, the cavity was
identified and filled with 80 x 106 MSCs in a volume of 800 l. Right: At the end of follow-up the lesión was isointense with the spinal cord tissue suggesting its transformation in a solid tissue.

77
Figure S67. Patient 15. A: MRI (T1) previously to cell therapy (on the left) without good
identification of the spinal cord in the zone of lesion, at D6-D7 level. On the right, one year after
surgery. At this time, spinal of cord can be identified in the zone of injury (arrows). B: MRI (T2)
showing, previous to cell therapy, the hyperintense aspect of the lesion zone (on the left) that
disappeared after 12 months (on the right). At surgery, the lesion was identified as a gliotic and
cystic tissue, that received, according to the surgical planning, a total of 150 x 106 MSCs in a total
volume of 1.5 cc. In C: MRI-myelography showing the lesion (on the left) that disappeared at the
end of the follow-up (on the right). This patient received at surgery a total of 230 x 106 MSCs (150
x 106 cells in the posttraumatic lesion, a total of 50 x 106 in the edges of the lesion zone, on spinal
cord of healthy appearance, and 30 x 106 MSCs in the perilesional subarachnoid space).
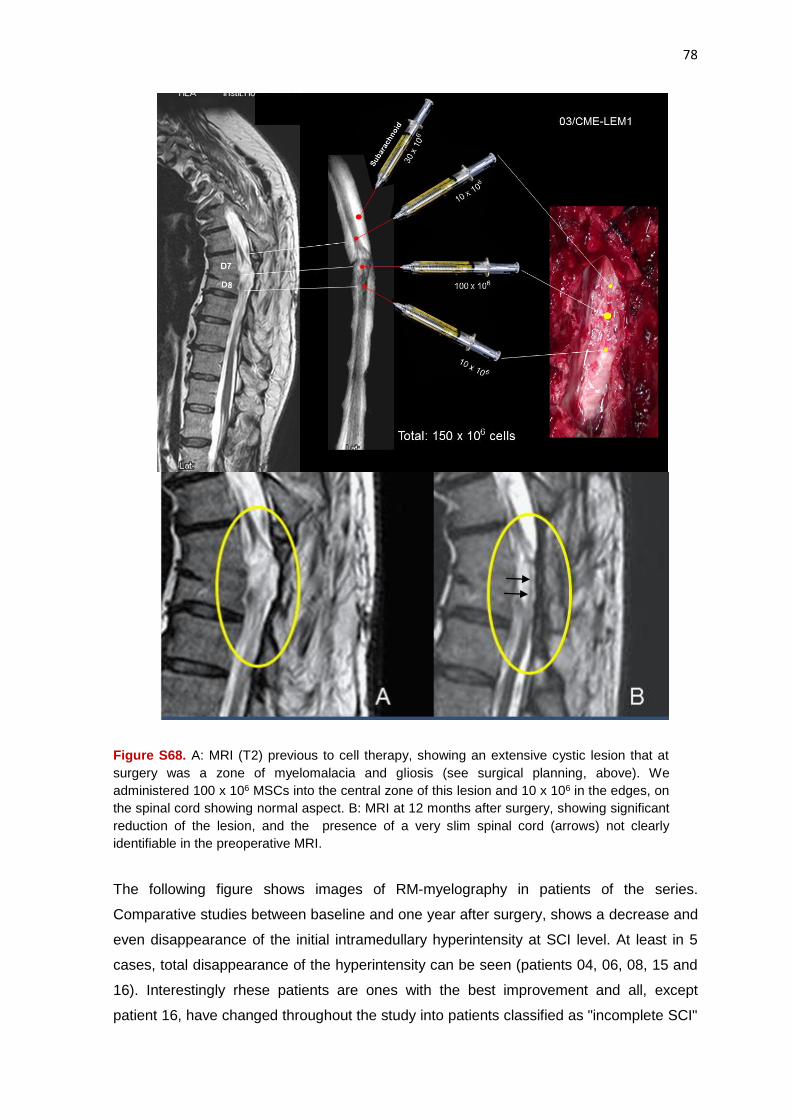
78
Figure S68. A: MRI (T2) previous to cell therapy, showing an extensive cystic lesion that at
surgery was a zone of myelomalacia and gliosis (see surgical planning, above). We
administered 100 x 106 MSCs into the central zone of this lesion and 10 x 106 in the edges, on
the spinal cord showing normal aspect. B: MRI at 12 months after surgery, showing significant
reduction of the lesion, and the presence of a very slim spinal cord (arrows) not clearly
identifiable in the preoperative MRI.
The following figure shows images of RM-myelography in patients of the series.
Comparative studies between baseline and one year after surgery, shows a decrease and
even disappearance of the initial intramedullary hyperintensity at SCI level. At least in 5
cases, total disappearance of the hyperintensity can be seen (patients 04, 06, 08, 15 and
16). Interestingly rhese patients are ones with the best improvement and all, except
patient 16, have changed throughout the study into patients classified as "incomplete SCI"

79
(ASIA B or C), suggesting that the attenuation of hyperintense lesion could be considered
a significant variable of efficacy in our study.
Figure S69. MR-myelography images in four patients in the study. Above: Arrows show hyperintense lesions in the spinal cord (possible gliosis or cysts) prior to cell therapy. Below: Arrows show the disappearance of these hyperintense lesions 12 months after cell therapy. (A and E: Patient 06; B and F: Patient 08; C and G: Patient 15; D and H: Patient 16). These patients received in the hyperintense zone between 70 and 150 x 106 cells (mean of 108 x 106, sd: 39 x 106) and all, except patient 16, had changed their classification to “incomplete” lesion, according to the ASIA scale

80
Lesio
n v
olu
me (
cc)
Basal 12 Months0
2
4
6
8
Figure S70. Statistically significant difference (p: 0.015) between the lesion volume
before treatment and 12 months after surgery. Approximate lesion volume was
calculated based on the areas of hyperintensity observed in MR-myelography.
Supplementary Conclusions of the Study
This Clinical Trial faithfully reproduces the preclinical experience with cell therapy using
autologous MSCs in our model of chronic paraplegic minipig19, 20, 42. Over the past 15
years, systematic work in the laboratory and in the experimental surgery operating room
has allowed us to lay the groundwork to conduct the first clinical trial authorized in Spain
for the use of cell therapy in paraplegic patients. During this period of time there has been
an increase in number of publications related to cell therapy which suggests its usefulness
in SCI. We have attended to the description of clinical protocols and techniques that even
showing signs of therapeutic efficacy, in our opinion these studies suffer from important
methodological flaws. A remarkably small number of cells injected, inadequate cell
suspension medium, unacceptable volumes used for intralesional administration, the use
of injection needle gauges incompatible with cell survival, and mainly the lack of studies
evaluating the morphological characteristics of SCI, highly variable in the reality of clinical
practice, are details that translate the lack of preclinical experience, determine suboptimal
results and contribute to decrease the effectiveness of cell therapy in SCI.
Within our clinical research program for neurological disability, this first clinical trial was
presented as a study of biosafety, and intentionally our goal was to obtain efficacy in
patients with longstanding complete SCI, what was obviously a challenge against the
established dogma of the irreversibility of neurological dysfunction in these patients. There
is no clinical study so far that has applied cell therapy to paraplegic patients with an
average of approximately 14 years from their neurological lesion (4 patients over 20 years
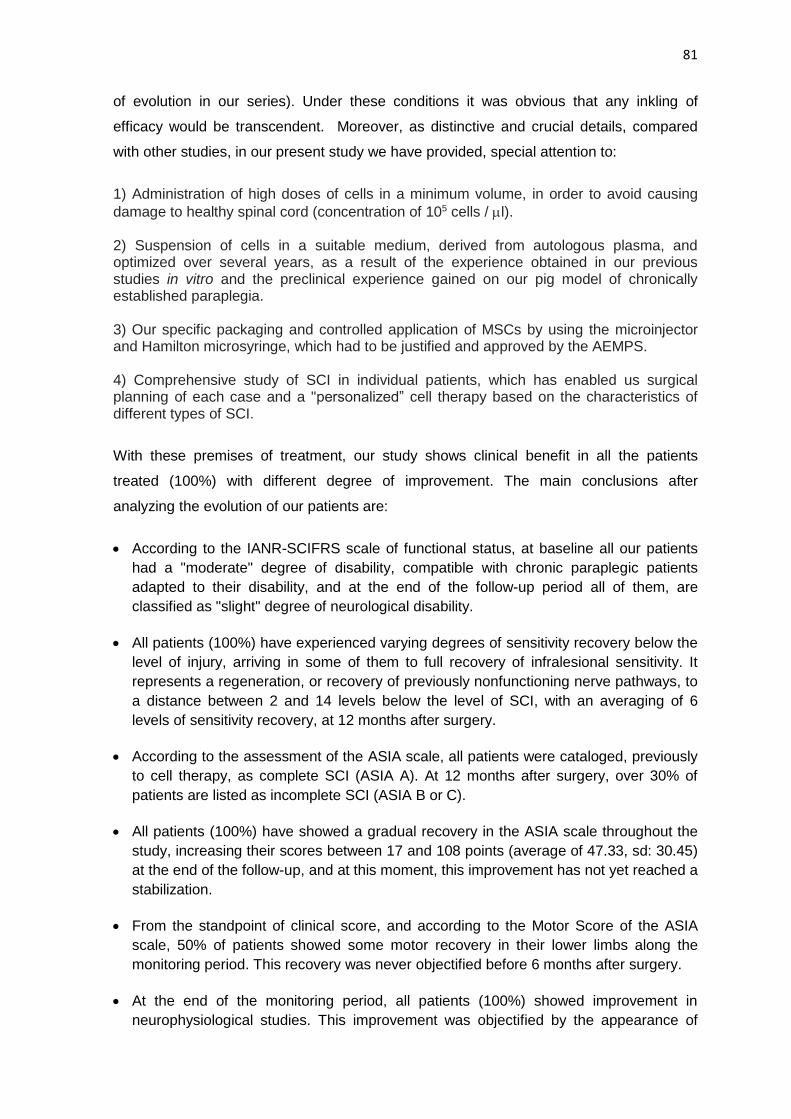
81
of evolution in our series). Under these conditions it was obvious that any inkling of
efficacy would be transcendent. Moreover, as distinctive and crucial details, compared
with other studies, in our present study we have provided, special attention to:
1) Administration of high doses of cells in a minimum volume, in order to avoid causing
damage to healthy spinal cord (concentration of 105 cells / l). 2) Suspension of cells in a suitable medium, derived from autologous plasma, and optimized over several years, as a result of the experience obtained in our previous studies in vitro and the preclinical experience gained on our pig model of chronically established paraplegia. 3) Our specific packaging and controlled application of MSCs by using the microinjector and Hamilton microsyringe, which had to be justified and approved by the AEMPS. 4) Comprehensive study of SCI in individual patients, which has enabled us surgical planning of each case and a "personalized” cell therapy based on the characteristics of different types of SCI.
With these premises of treatment, our study shows clinical benefit in all the patients
treated (100%) with different degree of improvement. The main conclusions after
analyzing the evolution of our patients are:
According to the IANR-SCIFRS scale of functional status, at baseline all our patients
had a "moderate" degree of disability, compatible with chronic paraplegic patients
adapted to their disability, and at the end of the follow-up period all of them, are
classified as "slight" degree of neurological disability.
All patients (100%) have experienced varying degrees of sensitivity recovery below the
level of injury, arriving in some of them to full recovery of infralesional sensitivity. It
represents a regeneration, or recovery of previously nonfunctioning nerve pathways, to
a distance between 2 and 14 levels below the level of SCI, with an averaging of 6
levels of sensitivity recovery, at 12 months after surgery.
According to the assessment of the ASIA scale, all patients were cataloged, previously
to cell therapy, as complete SCI (ASIA A). At 12 months after surgery, over 30% of
patients are listed as incomplete SCI (ASIA B or C).
All patients (100%) have showed a gradual recovery in the ASIA scale throughout the
study, increasing their scores between 17 and 108 points (average of 47.33, sd: 30.45)
at the end of the follow-up, and at this moment, this improvement has not yet reached a
stabilization.
From the standpoint of clinical score, and according to the Motor Score of the ASIA
scale, 50% of patients showed some motor recovery in their lower limbs along the
monitoring period. This recovery was never objectified before 6 months after surgery.
At the end of the monitoring period, all patients (100%) showed improvement in
neurophysiological studies. This improvement was objectified by the appearance of

82
evoked potentials (58%), and / or EMG studies showing voluntary muscle contraction
(58%). Furthermore, 10 patients (over 80% of cases), at 12 months after surgery,
showed polyphasic potentials in infralesional muscles, suggesting a process of active
reinnervation.
On our patients with SCI level upper to D7, the pattern of motor recovery shows that
the rectus abdominis is the first muscle in which potentials of voluntary muscle
contraction are recorded, followed by the hip flexors and other muscles of the lower
limbs. Thus, ASIA clinical scale for the motor assessment should consider other key
muscles in the assessment of motor recovery of paraplegic patients undergoing cell
therapy.
At the end of the follow-up, all the patients were are able to stand and take steps with
the help of braces and walkers or with the canes support. The possibility of achieving in
the future a walk without bracing can not be ruled out, in view of the gradual
improvement of clinical and neurophysiological parameters. This outcome will require a
long-term monitoring of our patients.
Throughout the monitoring period, all patients (100%) improve, with varying degrees, in
spasms and spasticity.
Over 90% of patients show, although in varying degrees, progressive and significant
recovery of bladder control after treatment, with one patient who had recovered
complete control of the bladder sphincter, and urinary catheter was withdrawn.
Over 90% of patients experienced a marked and significant improvement of the
symptoms attributed to the neurogenic bowel, this improvement becoming evident early
and be progressive over time. The number of cells administered show a clear
correlation to neurogenic bowel improvement, this may explain the elevated degree of
improvement in neurogenic bowel in our series, due to the higher number of cells used
in our protocol compared to other clinical trials of cell therapy applied to patients
suffering SCI.
Over 55% of male patients, during the follow up period experienced some improvement
in sexual function.
All patients showed improvement in neuropathic pain along the following up, but this improvement only reached statistical significance at the end of the monitoring period.
Over 80% of patients show improvement in urodynamic studies at the end of follow up
period, achieving a significant increase in bladder compliance (83.3%), a lower
pressure detrusor filling (75%) and an increase in maximum cystometric capacity
(66.6%).
From the point of view of imaging, none of patients showed deterioration after
treatment. In spite of the artefacts inherent to vertebral fixation devices, MRI showed,
12 months after cell therapy, a significant decrease in volume and hyperintensity of
intramedullary lesions in over 60% of the patients.
The overall efficacy obtained in this study is shown as dose-dependent in most of the
efficacy variables studied, mainly in ASIA, IANR-SCIFRS and NBD scales.

83
There is also a clear correlation between ASIA and IANR-SCIFRS scales, suggesting
that they can be equally applied to analyze the effectiveness of cell therapy.
Finally, we consider very important that the improvement observed in most of the
efficacy variables analyzed is progressive, without reaching a plateau in their evolution,
this will require long-term monitoring of patients in order to know how much
improvement can be achieved.
In view of these findings, we believe that:
1) Cell therapy with autologous expanded MSCs, obtained from bone marrow, is safe and
far superior to other techniques of cell therapy with morbidity risk or that require
immunosuppression, which we consider unacceptable in patients with SCI.
2) The approach of a personalized cell therapy based on SCI morphology, together with
careful selection of patients, suitable cell support, administration of large numbers of cells
in a small volume and a careful surgical technique when cell transplantation is performed,
determines the results obtained in our study, which are better than those previously
described in the few clinical trials of cell already therapy applied to SCI.
3) Our cell therapy medicament (NC1) shows clear evidence of therapeutic efficacy in
patients with complete and chronically established paraplegia, irrespective of length of
chronicity since SCI, and it achieves a significant benefit in the quality of life of these
patients.
4) Given the complexity of these new techniques of cell therapy, and the multiple factors
that influence their efficacy, we estimate that, in the current state of our knowledge, it
should only be applied by consolidated research groups, with extensive experience in cell
therapy and proving sufficient preclinical training.
Supplementary Appendix References
1. Chopp M, Zhang XH, Li Y, et al. Spinal cord injury in rat: treatment with bone marrow stromal cell transplantation. Neuroreport 2000;11:3001-5.
2. Hofstetter CP, Schwarz EJ, Hess D, et al. Marrow stromal cells form guiding strands in the
injured spinal cord and promote recovery. Proc Natl Acad Sci USA 2002;99:2199-204. 3. Horwitz EM, Le Blanc K, Dominici M, et al. Clarification of the nomenclature for MSC: The
International Society for Cellular Therapy position statement. Cytotherapy 2005;7:393-5. 4. Dominici M, Le Blanc K, Mueller I, et al. Minimal criteria for defining multipotent mesenchymal
stromal cells. The International Society for Cellular Therapy position statement. Cytotherapy 2006;8:315-7.
5. Woodbury D, Schwar EJ, Prockop DJ, Black IB. Adult rat and human bone marrow stromal cells
differentiate into neurons. J Neurosci Res 2000;61:364-70. 6. Zurita M, Vaquero J. Functional recovery in chronic paraplegia after bone marrow stromal cells
transplantation. Neuroreport 2004;15:1105-8.

84
7. Zurita M, Vaquero J. Bone marrow stromal cells can achieve cure of chronic paraplegic rats: Functional and morphological outcome one year after transplantation. Neurosci Lett 2006;402:51-6.
8. Zurita M., Vaquero J, Oya S, Miguel M. Schwann cells induce neuronal differentiation of bone
marrow stromal cells. Neuroreport 2005;16:505-8. 9. Vaquero J, Zurita M. Bone marrow stromal cells for spinal cord repair: A challenge for
contemporary neurobiology. Histol Histopathol 2009;24:107-16. 10. Bonilla C, Zurita M, Otero L, Aguayo C, Vaquero J. Delayed intralesional transplantation of bone
marrow stromal cells increases endogenous neurogenesis and promotes functional improvement after severe traumatic brain injury. Brain Inj 2009;23:760-9.
11. Otero L, Zurita M, Bonilla C, et al. Late transplantation of allogeneic bone marrow stromal cells
improves neurological deficits subsequent to intracerebral hemorrhage. Cytotherapy 2011;13:562-71.
12. Vaquero J, Zurita M. Functional recovery after severe central nervous system trauma: Current
perspectives for cell therapy with bone marrow stromal cells. Progr Neurobiol 2011;93:341-9. 13. Chopp M, Li Y. Treatment of neural injury with marrow stromal cells. Lancet Neurol 2002;1:92-
100. 14. Lee J, Kuroda S, Shichinohe H, et al. Migration and differentiation of nuclear fluorescence-
labeled bone marrow stromal cells after transplantation into cerebral infarct and spinal cord injury in mice. Neuropathology 2003;23:169-80.
15. Ankeny DP, Mc Tigue DM, Jakeman LB. Bone marrow transplants provide tissue protection and
directional guidance for axons after contusive spinal cord injury in rats. Exp Neurol 2004;190: 17-31.
16. Mahmood A, Lu D, Wang L, Li Y, Lu M, Chopp M. Treatment of traumatic brain injury in female
rats with intravenous administration of bone marrow stromal cells. Neurosurgery 2001;49:1196-203.
17. De Haro J, Zurita M, Ayllón L, Vaquero J. Detection of 111In-oxine-labeled bone marrow stromal
cells after intravenous or intralesional administration in chronic paraplegic rats. Neurosci Lett 2005;377:7-11.
18. Vaquero J, Zurita M, Oya S, Santos M. Cell therapy using bone marrow stromal cells in chronic
paraplegic rats: systemic or local administration? Neurosci Lett 2006;398:129-34. 19. Zurita M, Aguayo C, Bonilla C, et al. The pig model of chronic paraplegia: A challenge for
experimental studies in spinal cord injury. Progr Neurobiol 2012;97:288-303. 20. Zurita M, Vaquero J, Bonilla C, et al. Functional recovery of chronic paraplegic pigs after
autologous transplantation of bone marrow stromal cells. Transplantation 2008;86:845-53. 21. Park JH, Kim DY, Sung I, et al. Long-term results of spinal cord injury therapy using
mesenchymal stem cells derived from bone marrow in humans. Neurosurgery 2012;70:1238-47. 22. Syková E, Homola A, Mazanec R, et al. Autologous bone marrow transplantation in patients with
subacute and chronic spinal cord injury. Cell Transplant 2006;15:675-87. 23. Yoon SH, Shim YS, Park YH, et al. Complete spinal cord injury treatment using autologous bone
marrow cell transplantation and bone marrow stimulation with granulocyte macrophage-colony stimulating factor: Phase I/II clinical trial. Stem Cells 2007;25:2066-73.
24. Geffner LF, Santacruz P, Izurieta M, et al. Administration of autologous bone marrow stem cells
into spinal cord injury patients via multiple routes is safe and improves their quality of life: Comprehensive case studies. Cell Transplant 2008;17:1277-93.

85
25. Ohta M, Suzuki Y, Noda T, et al. Bone marrow stromal cells infused into the cerebrospinal fluid
promote functional recovery of the injured rat spinal cord with reduced cavity formation. Exp Neurol 2004;187:266-78.
26. Bakshi A, Barshinger AL, Swanger SA, et al. Lumbar puncture delivery of bone marrow stromal
cells in spinal cord contusion: a novel method for minimally invasive cell transplantation. J Neurotrauma 2006;23:55-65.
27. Himes BT, Neuhuber B, Coleman C, et al. Recovery of function following grafting of human bone
marrow-derived stromal cells into the injured spinal cord. Neurorehabil Neural Repair 2006;20:278-96.
28. Parr AM, Tator CH, Keating A. Bone marrow-derived mesenchymal stromal cells for the repair of
central nervous system injury. Bone Marrow Transplant 2007;40:609-19. 29. Deda H, Inci MC, Kürekçi AE, et al. Treatment of chronic spinal cord injured patients with
autologous bone marrow-derived hematopoietic stem cell transplantation: 1-year follow-up. Cytotherapy 2008;10:565-74.
30. Chen Q, Long Y, Yuan X, et al. Protective effects of bone marrow stromal cell transplantation in
injured rodent brain: Synthesis of neurotrophic factors. J Neurosci Res 2005;80:611-9. 31. Otero L, Zurita M, Bonilla C, et al. Allogeneic bone marrow stromal cell transplantation after
cerebral hemorrhage achieves cell transdifferentiation and modulates endogenous neurogenesis. Cytotherapy 2012;14:34-44.
32. Satake K, Lou J, Lenke LG. Migration of mesenchymal stem cells through cerebrospinal fluid into
injured spinal cord tissue. Spine 2004;29:1971-9. 33. Bakshi A, Hunter C, Swanger S, Lepore A, Fischer I. Minimally invasive delivery of stem cells for
spinal cord injury: advantages of the lumbar puncture technique. J Neurosurg Spine 2004;1:330-7.
34. Pal R, Venkataramana NK, Bansai A, et al. Ex vivo-expanded autologous bone marrow-derived
mesenchymal stromal cells in human spinal cord injury/paraplegia: a pilot clinical study. Cytotherapy 2009;11:897-911.
35. Saito F, Nakatani T, Iwase M, et al. Spinal cord injury treatment with intrathecal autologous bone
marrow stromal cell transplantation: The first clinical trial case report. J Trauma 2008;64:53-9. 36. Saito F, Nakatani T, Iwase M, et al. Administration of cultured autologous bone marrow stromal
cells into cerebrospinal fluid in spinal injury patients: a pilot study. Restor Neurol Neurosci 2012;30:127-36.
37. Jiang PC, Xiong WP, Wang G, et al. A clinical trial report of autologous bone marrow-derived
mesenchymal stem cell transplantation in patients with spinal cord injury. Exp Ther Med 2013;6:140-6.
38. Mendonça MVP, Larocca TF, Souza BS, et al. Safety and neurological assessments after
autologous transplantation of bone marrow mesenchymal stem cells in subjects with chronic spinal cord injury. Stem Cell Research & Therapy 2014;5:126.
39. Li W, Jiang X, Fu X, et al. Bone marrow stromal cells can be delivered to the site of traumatic
brain injury via intrathecal transplantation in rabbits. Neurosci Lett 2008;434:160-4. 40. Li H, When Y, Luo Y, et al. Transplantation of bone marrow mesenchymal stem cells into spinal
cord injury: a comparison of delivery different times. Zhongguo Xiu Fu Chong Jian Wai Ke Za Zhi 2010;24:180-4 (In Chinese)
86
41. Nishida H, Nakayama M, Tanaka H, et al. Evaluation of transplantation of autologous bone marrow stromal cells into the cerebrospinal fluid for treatment of chronic spinal cord injury in dogs. Am J Vet Res 2011;72:1118-23.
42. Zurita M, Aguayo C, Bonilla C, Rodriguez A, Vaquero J. Perilesional intrathecal administration of
autologous bone marrow stromal cells achieves functional improvement in pigs with chronic paraplegia. Cytotherapy 2013;15:1218-27.
43. Kirshblum SC, Burns SP, Biering-Sorensen F, et al. International standards for neurological
classification of spinal cord injury (revised 2011) J Spinal Cord Med 2011;34:535-46. 44. International Association of Neurorestoratology. Spinal cord injury functional rating scale.
Zhongguo Xiu Fu Chong Jian Wai Ke Za Zhi 2008;22:1021-3. 45. Research Foundation State University of New York. Guide for use of the Uniform data set for
Rehabilitation. New York, 1991. University of New York. 46. Mahoney F, Barthel D. Functional evaluation: The Barthel Index. Md Med J 1965;14:61-65. 47. Woodforde JM, Merskey H. Some relationship between subjective measures of pain. J
Psychosom Res 1972;16:173-8. 48. Penn RD, Savoy SM, Corcos D, et al. Intrathecal baclofen for severe spinal spasticity. N Engl J
Med 1989;320:1517-21. 49. Bohannon RW, Smith MB. Interrater reliability of a modified Ashworth scale of muscle spasticity.
Phys Ter 1987;67:206-7. 50. Krogh K, Christensen P, Sabroe S, Laurberg S. Neurogenic bowel dysfunction score. Spinal
Cord 2006;44:625-31. 51. Vaquero J, Zurita M. Cell transplantation in paraplegic patients: the importance of properly
assessing the spinal cord morphology. Clin Transplant 2013;27:968-71.