Embed Size (px)
Citation preview

The crown-of-thorns starfish genome as a guide for biocontrol of this coral
reef pest
Supplementary Notes
1. Background information on the crown-of-thorns starfish……………………………………..............2
2. Genome and transcriptome sequencing, assembly and annotation………………………………….8
3. Comparison of GBR and OKI genomes…………………………………………………………………………….13
4. Phylogenomic and population genomic analyses………….………………………………………………..21
5. Protein domain analyses…………………………………………………………………………………………………23
6. Tissue gene expression analyses……………………………………………………………..........................26
7. Exoproteome analyses……………………………………………………..…………………………………………….32
8. Identification and analysis of ependymin-related genes……………………..………………………….62
9. Identification and analysis of GPCRs…………………………………………………….…………………………69
10. References……………………………………………………………………………………………………………………75
WWW.NATURE.COM/NATURE | 1
SUPPLEMENTARY INFORMATIONdoi:10.1038/nature22033

1. Background information on the crown-of-thorns starfish
The crown-of-thorns starfish (COTS), Acanthaster planci, is a corallivore predator asteroid
echinoderm (Class Asteroidea, Order Valvitida) and part of the native biodiversity of coral
reef ecosystems throughout the Indo-Pacific. When population densities are low their
predation rate has little noticeable impact on coral cover (Pratchett et al. 2014). However,
the species exhibits dramatic fluctuations in population density with outbreak populations
numbering hundreds of thousands to several millions with densities of >150,000 COTS km2
(Kayal et al. 2012). Outbreak events typically lead to a significant loss of scleractinian coral
cover, as well as changes to overall coral reef biodiversity (Porter 1972, Bouchon 1985,
Pratchett 2010). COTS outbreaks were reported 82 times prior to 1990 across the Indo-
Pacific but since then have been noted at least 246 times and in the most severe cases more
than 96% of coral cover can be consumed (Moran 1986, Birkeland and Lucas 1990, Pratchett
et al. 2014).
Outbreaks of COTS continue to occur across the Indo-Pacific; from the coast of South Africa
to the Gulf of California and are accentuating the degradation of coral reefs due to the
accumulative effects of other regional and global stressors (Adjeroud et al. 2009; Barham et
al. 1973; Cameron et al. 1991; Pearson 1981; Schleyer and Celliers 2003). Whereas
numerous stressors have been identified as drivers of coral cover loss throughout their
geographical range, COTS have been responsible for far more loss of coral in many areas of
the Indo-Pacific than attributed to any other cause with the exception of the sweeping
indiscriminate destructive high energy impacts of cyclones (Osborne et al. 2011, Sweatman
et al. 2011; De’ath et al. 2012, Kayal et al. 2012; Riegl et al. 2013, Gouezo et al. 2015, Mori
et al. 2015). The effects of COTS outbreaks can result in a dramatic decrease of live coral
cover ranging from 37% to over 99% (De’ath et al. 2012; Yasuda et al. 2009; Riegl et al.
2013; Hock et al. 2014). Recently it has been shown that coral reefs with high densities of
COTS are potentially more susceptible to climate change and storm activity (Baird et al.
2013). Recovery from COTS outbreak events require between 10-20 years such that
repetitive occurrences lead to decreased resilience of coral reefs, and mitigation strategies
WWW.NATURE.COM/NATURE | 2
SUPPLEMENTARY INFORMATIONRESEARCHdoi:10.1038/nature22033

are increasingly considered necessary to control this species when in pest phase (Connell et
al. 2015).
Most starfish are carnivores and can occupy the top trophic level in benthic communities.
Several species are classified as keystone predators as they are consumers that have a
disproportionately large effect on benthic communities and ecosystems and COTS are no
exception (Menge and Freidenburg 2001; Menge and Sanford 2013; Pratchett 2010; Rilov
and Shiel 2011). Several biological attributes predispose COTS to warrant their keystone
species status (Stump 1990, Lawrence 2013). COTS are corallivores with a virtually unlimited
supply of pasture-like coral fields on extensive expansions of reef flats upon which to graze
and reefs that have high coral cover are particularly rich feeding grounds. The feeding mode
of COTS, via external digestion of coral flesh, includes extrusion of their stomach (under
neuroendocrine control) with a surface area up to 10-fold greater than other coral reef
starfish such as Linckia and Culcita (Semmens et al. 2013). With the ability to consume up to
7 to 10 m2 of coral flesh per year, the assimilation of nutritious coral flesh is highly efficient
with rapid somatic growth and gonadal development (Birkeland and Lucas 1990, Pratchett
et al. 2014). The tube feet are major organs of respiration in starfish but are significantly
covered by the extruded stomach during feeding (Yamaguchi 1975). To partially counteract
this COTS are covered with extensive respiratory papilla on their dorsal surface which allows
high oxygen consumption during feeding and digesting (Farmanfarmaian 1966, Cole and
Burggren 1981). Predation on adult COTS is minimized as they are adorned with numerous
sharp articulated calcareous spines overlaid by epidermal tissue coated with toxin-laden
mucus and puncture wounds from these spines results in envenomation of toxins, such as
plancitoxins, with diverse biological activities including death (Shiomi et al. 2004, Dong et al.
2011, Savitri et al. 2011). In addition, spinal glands can release saponins into the immediate
water column which can transverse fish gills causing haemorrhagic activity, respiratory
distress and death (Yasumoto et al. 1964, Hostettmann and Marston 1995). Furthermore, a
tendency to form large aggregations provides considerable barriers to many more
persistent predators. COTS are also able to combat a degree of predation with an ability
common to the echinoderm phyla, and one which they retain throughout life, which is to
regenerate their tissue when lost via a predatory attack, or indeed culling by slicing animals
in half, i.e. these events do not necessarily result in death (Messmer et al. 2013).
WWW.NATURE.COM/NATURE | 3
SUPPLEMENTARY INFORMATIONRESEARCHdoi:10.1038/nature22033

COTS have extreme fecundity, with disproportionate increases with increasing size; a 30 cm
diameter female is capable of carrying 15 million eggs whereas a 50 cm one can release 120
million (Conand 1984; Kettle and Lucas 1987). With fecundity tightly scaled to body size,
large COTS are remarkably prolific as well as having the highest recorded external
fertilization rates reported for marine invertebrates (Benzie et al. 1994). This dioecious
species forms particularly pronounced pre-spawning aggregations with synchronous
spawning often observed. Aggregations can result in the synchronized release of billions of
gametes, and if coupled to high successful fertilization, can result in a next generation
settlement recruitment of many millions of individuals (Babcock et al. 1994). Moreover, the
eggs themselves are toxic as are the larvae containing pronounced levels of saponins that
deter many coral reef fish predators (Yamaguchi 1973, 1977; Lucas et al. 1979; Gladstone
1992). With a highly elastic planktonic phase, being as short as 9-12 days or as long as many
months, larval dispersal can result in highly localised recruitment, or wide dispersal across
open oceans that populate distance reefs (Yamaguchi 1977, Timmers et al. 2012, Nakamura
et al. 2014). In short, COTS possess biological traits with all the prerequisites bestowing it as
an outbreak species. Extreme population fluctuations, and hence outbreaks, are part and
parcel of this species. Outbreaks will occur and the challenge is to identify potential control
points that can mitigate them when they inevitably do take place.
It is generally accepted that outbreaks of COTS are one of the few disturbances on coral
reefs that is amenable to pest control management by direct intervention (Tables S1.1 and
S1.2). Integrated pest control deploys a variety of actions to ensure favourable ecological
and economic consequences (Babendreier 2007). The use of either chemical or biological
control has proven successful against a variety of terrestrial pests over large areas (Van
Lenteren 1988). Pest control targets specific life stages of the animal and in COTS this could
include the 10-40 day larval phase, the 6-month coralline algae feeding juvenile stage and
the 1-7 year coral eating adult phase, including pre-spawning aggregations (Birkeland and
Lucas 1990). Of these, the only one readily amenable to pest control has been upon adults
(Fraser et al. 2000). For COTS, control approaches can be broadly classified as mechanical,
including hand-picking, lethal injection and barriers (Rivera-Posada and Pratchett 2012).
Physical removal of individual adults and disposal by burial ashore managed to remove
WWW.NATURE.COM/NATURE | 4
SUPPLEMENTARY INFORMATIONRESEARCHdoi:10.1038/nature22033

220,000 COTS in 1957 during an outbreak on the Miyako Islands, Japan (Table S1.1; Moran
1986). However, the majority of control measures have been through chemical control,
which was first used against starfish in 1936 (Galtsoff and Loosanoff 1939). For over half a
century the primary method against COTS was through lethal injection with a range of
chemical substances with at least 100 reported mitigation programs culling approximately
16 million COTS (Table S1.1; Rivera-Posada and Pratchett 2012). Although lethal injection
has been in use for over 50 years the only advances have been in the efficiency of the toxic
substance used, which has included sodium bisulfate, sodium hypochlorite, ammonia,
ammonium hydroxide, acetic acid, formaldehyde and copper sulfate (Table S1.2; Birkeland
and Lucas 1990; Pratchett et al. 2014). Many of these substances have unintentional
detrimental impacts due to their generalised toxicity on the immediate environment. These
chemicals were administered in solution through hypodermic syringe injections requiring
multiple injections to kill an adult. Advances of this approach have been extremely limited
and restricted to an efficiency improvement; previously multiple injections were required to
kill an animal whereas single shot methods have been developed to include ox bile and lime
juice as the toxic agents (Rivera-Posada et al. 2014; Moutardier et al. 2015).
For pest control management there is a strong case to examine other potentially more
effective avenues and in particular to preferentially discover species-specific vulnerabilities
to develop a more efficient and large scale control technology against COTS. For example,
identification of insect neuropeptide receptors and their guanine nucleotide-binding (G)
protein-coupled receptor (GPCR) signalling systems is leading to the development of new
generation species-specific pest control (Caers et al. 2012, Cohen 2014, Audsley and Down
2015). For equivalent approaches to be developed against COTS there is the requirement for
a thorough knowledge of its genome. In order to gain insight into possible genetic
mechanisms involved in rapid and recent population expansion, we sequenced, annotated,
and compared the genomes of two individual COTS specimens, one from the Great Barrier
Reef (‘GBR’) and the other from OKInawa (‘OKI’).
1.1 Control program and methods
For more than 50 years mitigation efforts have been used to limit or prevent the impact of
mass population influx of COTS onto coral reefs (Birkeland and Lucas 1990). The ultimate
WWW.NATURE.COM/NATURE | 5
SUPPLEMENTARY INFORMATIONRESEARCHdoi:10.1038/nature22033

objective of these control programs has been to prevent coral mortality from going beyond
acceptable limits. Over 120 culling efforts have been reported since 1957 with over 17.6
million starfish being eliminated (Table S1.1). The methods applied to cull COTS has been,
and remains, limited to either physical removal or injection with a solution of a toxic
chemical by divers. These established methods all involve the treatment of each individual
starfish. The tendency for COTS to be concealed during daylight hours and reinfest through
immigration from neighbouring areas requires systematic and repeated sweeps over each
area being controlled. Such efforts are very labour intensive, and potentially exorbitantly
expensive, and by their very nature limited to local scales.
Manual collection followed by disposal ashore is the most common technique used in the
Pacific. Chopping up starfish in situ has also been deployed but the animal must be
quartered, at a minimum, through the central disc and nerves to prevent regeneration
(Messmer et al. 2013). An important operational parameter for efficiency is time and as
handling and chopping a starfish into pieces it is not optimal. Air injection of COTS has been
trialled, with the resultant floating starfish collected from the surface but maximal
harvesting rates are only 21 starfish per hour (Kenchington and Pearson 1981). Both these
methods entail a high risk of injury as handling exposes the operator to puncture wounds
from the numerous toxic spines of COTS (Lee et al. 2013). The use of lethal injections, with
an extension arm attached to syringe reservoirs, improves protection to the operator and
this approach is being increasing used in culling programs (Rivera-Posada and Pratchett
2012). Whereas culling efficiency is approximately 38 COTS per hour through physical
removal, it increases to 132 COTS per hour when lethal injection is used (Kenchington and
Pearson 1981). A wide variation of toxic chemicals have been either tested or deployed in
culling programs (Table S1.2). Toxicity action ranges from compounds which disrupt of acid-
base metabolism, from very low to very high pKas (i.e. 1.9 for sodium bisulphate to 9.25 for
ammonia), to heavy metal poisoning (i.e. copper), to fixatives (i.e. formalin), to detergents
(i.e. bile salts). Some of these compounds require high concentrations and multiple
injections, decreasing culling rate efficiency. Others may induce autotomy and not outright
death. Recent gall (ox bile), for culling programs on the Great Barrier Reef, with a detergent
reaction, has proven lethal with a single injection and a resultant improvement of culling
efficiency to +211 COTS per hour (Rivera-Posada et al. 2014). Although there have been
WWW.NATURE.COM/NATURE | 6
SUPPLEMENTARY INFORMATIONRESEARCHdoi:10.1038/nature22033

marginal improvements in efficiencies, all of these methods require treatment of COTS one-
by-one such that it must plateau, although further improvements may be made through the
use of autonomous vehicles (Takemura et al. 2015). Nevertheless, there are clearly benefits
to be made if genomic technologies can be developed with integrated pest management
strategies to improve culling efficiency.
Additional Supplementary Tables
Table S1.1. History of COTS control programs, numbers culled and method deployed*
* Original references are quoted in the major reviews of Randall 1972, Cheney 1973, Endean and
Chesher 1973, Yamaguchi 1986, Zann and Weaver 1988, Birkeland and Lucas 1990 and Rivera-
Posada and Pratchett 2012.
Table S1.2. Chemicals used for lethal injection in COTS control programs
WWW.NATURE.COM/NATURE | 7
SUPPLEMENTARY INFORMATIONRESEARCHdoi:10.1038/nature22033

2. Genome and transcriptome sequencing, assembly and annotation
2.1 Genome sequencing and assembly
Sequencing statistics, genome size estimates, assembly, heterozygosity estimates, gene
model, and transcriptome results for the GBR and OKI genomes are summarized in
Extended Data Table 1 and Fig. S2.1.
Paired-end assemblies yielded 17,868 and 17,265 contigs with N50s of 54,939 and 54,788
bp for GBR and OKI, respectively (Extended Data Table 1), and mate-pair sequencing data
(Boetzer et al. 2011) resulted in final assemblies of 383.5 and 383.8 Mb into 3274 and 1765
scaffolds with N50s of 917 and 1,521 kb for GBR and OKI genomes respectively (Extended
Data Table 1). Both genomes have a GC content of 41.3%.
A comparison of the COTS genomes with other marine invertebrate deuterostome genomes
suggests that they are relatively high quality (Table S2.1). This may be because of the low
heterozygosity within each genome; 0.88 and 0.92% within GBR and OKI genomes
(Extended Data Table 1).
2.2 Genome size estimation
k-mer analysis (Chapman et al. 2011) of raw reads indicated GBR genome size of 441 Mb
and 421 Mb for OKI (Table S2.1); (ii) flow cytometry estimates for the OKI genome were 480
Mb; and (iii) scaffolded assemblies for both GBR and OKI equaled 384 Mb (Extended Data
Fig. 2). k-mer based genome size estimates (Chikhi & Medvedev 2014) determined the
optimal k-mer length for subsequent analysis was 17 (Extended Data Fig. 2).
2.3 Transcriptome sequencing and assembly
A summary of the tissue transcriptomes generated from GBR and OKI used in this study are
shown in Table S2.2 and histograms of Tuxedo genome-guided transcript expression are
shown in Fig. S2.2.
WWW.NATURE.COM/NATURE | 8
SUPPLEMENTARY INFORMATIONRESEARCHdoi:10.1038/nature22033

2.4 Gene modelling and annotation
Gene models were predicted using Augustus and PASA, and final gene models were
evaluated in EVidence Modeler (EVM; Fig. S2.1; Haas et al. 2008). The weight (importance)
for each type of evidence in EVM are shown in Table S2.3. Based on this approach, we
predict 24,747 genes in GBR and 24,323 genes in OKI (Extended Data Table 1). The A. planci
genome can be found on NCBI as BioProject PRJDB3175 (Table S2.4).
Fig. S2.1. COTS Genome Assembly and Annotation Pipeline. This figure summarizes the methods
used to sequence (in blue), assemble (in black), and annotate (purple and orange) two A. planci
genomes, OKI (red) and GBR (green), in parallel.
WWW.NATURE.COM/NATURE | 9
SUPPLEMENTARY INFORMATIONRESEARCHdoi:10.1038/nature22033

Table S2.1. Marine invertebrate deuterostome genomes (adapted largely from Cameron et al. 2015)
Species Name, genome version phylum GenBank accession Length (Mb)
Scaffold number
Scaffold N50 (kb)
Contig number
Contig N50 (kb)
GC (%) Genes (#) Reference
Acanthaster planci (COTS), GBR-v1.0 Echinodermata - 383 3274 916 25012 35.7 41.31 24747 this report
Acanthaster planci (COTS), OKI-v1.0 Echinodermata - 383 1765 1521 24314 36.3 41.3 24323 this report
Patiria miniata, v1.0 Echinodermata GCA_000285935.1 811 60183 53 179756 9.4 40.2 29697 Cameron et al. (2015)
Strongylocentrotus purpuratus, v4.0 Echinodermata GCA_000002235.3 1032 31879 431 140454 17.6 38.3 31871 Cameron et al. (2015)
Lytechinus variegatus, v2.0 Echinodermata GCA_000239495.2 1061 322936 46 481804 9.7 36.4 28204 Cameron et al. (2015)
Saccoglossus kowalevskii, v1.1 Hemichordata - 758 7282 552 20913 89 38 34239 Simakov et al. (2015)
Ptychodera flava, v0.6 Hemichordata - 1229 218255 196 322077 7.6 37 34647 Simakov et al. (2015)
Ciona intestinalis, vKH Chordata GCA_000224145.2 115 1280 3102 6381 37 36.02 14983 Satou et al. (2008)
Ciona savignyi Chordata GCA_000149265.1 587 34009 601 74923 23 37.1 - Small et al. (2007)
Botryllus schlosseri Chordata GCA_000444245.1 580 120139 7 130124 7 40.6 - Voskoboynik et al. (2013)
Oikopleura dioica Chordata GCA_000209535.1 70 4196 22 6678 11 39.9 13505 Denoeud et al. (2010)
Branchiostoma floridae, v2.0 Chordata GCA_000003815.1 522 398 2587 41927 28 41.2 28627 Putnam et al. (2008)
WWW.NATURE.COM/NATURE | 10
doi:10.1038/nature22033 SUPPLEMENTARY INFORMATIONRESEARCH

Table S2.2. Summary of Acantasther planci transcriptomes
Trinity (de novo)
Tuxedo (Genome guided)
Source Tissue Genes (#)
Isoforms (#)
Contig N50
GC (%) Genes (#) Isoforms (#)
Aligned/paired reads (%)
GBR GBR GBR GBR GBR GBR
Testis* Podia* Spine*
Stomach* Body Wall*
(All GBR reads)
103915 96841 70975 91997 74119 93094
193591 153629
97780 154134 103046 153191
3440 3043 1949 3132 1774 3255
44.22 43.64 40.97 44.16 40.55 43.72
27819 23083 21105 23104 23833 29635
35469 30145 24780 29842 27789 52365
78.3 78.7 76.7 78.7 78.5 N/A
OKI OKI OKI OKI OKI OKI OKI OKI OKI OKI OKI
Testisº Podiaº Spineº
Mouthº Nerve-Female#1 Nerve-Female#2
Nerve-Male#1 Oocyte
Early Gastrula Middle Gastrula
(All OKI reads)
40482 85307
104055 25147 73842 67649 78054
164663 75552
147017 186200
35852 56760 64509 22322 53860 50909 56489
118728 49745 82413
110737
811 2642 2833
801 3006 3006 2352 1425 2306 2772 2853
42.32 42.94 43.16 38.47 43.41 43.32 43.15 41.80 43.29 43.38 43.11
18857 22215 24289 13065 21244 22211 25124 51470 21244 29068 33036
22387 28768 31576 13681 27173 26848 31221 55967 27173 36306 69261
73.2 74.1 73.2 72.7 66.4 65.5 65.0 62.6 64.0 63.1 N/A
OKI/GBR Total 259329 147429 3171 43.44 N/A N/A N/A
WWW.NATURE.COM/NATURE | 11
doi:10.1038/nature22033 SUPPLEMENTARY INFORMATIONRESEARCH

Fig. S2.2. Histograms of tissue RNA transcript abundance. Histograms of Tuxedo genome-
guided transcript expression. For each tissue sampled in either OKI or GBR, the overall
expression level (fpkm) for all transcripts of each tissue/sample type are plotted by
frequency. Overall, expression level histograms for similar tissue types confirm a general
overlap of expression patterns between OKI and GBR.
Table S2.3. Specific EVM weights assigned to transcript evidence used for EVM gene
prediction
Evidence type Description EVM weight *
TRANSCRIPT ABINITIO_PREDICTION ABINITIO_PREDICTION ABINITIO_PREDICTION OTHER_PREDICTION
PASA assembled transcripts from combined tissue transcriptomes Augustus SNAP GeneMarkES TransDecoder peptides predicted from PASA assembled transcripts
8 10
5 1 1
*least (1) to most (10) important
Additional Supplementary Tables
Table S2.4. Details on A. Planci NCBI BioProject PRJDB3175.
0.0
0.2
0.4
0.6
-7.5 -5.0 -2.5 0.0 2.5 5.0
log10(fpkm)
de
nsity
condition
X01_podia
X02_spine
X03_testis
X04_nerve_f1
X05_nerve_f2
X06_nerve_m1
X07_eg
X08_mg
X09_oocyte
X10_moucl
genes
0.0
0.2
0.4
-7.5 -5.0 -2.5 0.0 2.5 5.0
log10(fpkm)
de
nsity
condition
A_Body_wall
A_Gonad
A_Podia
A_Spine
A_Stomach
genes
Supplemental Figure 3.1: Histograms of RNA transcript expression level.
OKI
GBR
WWW.NATURE.COM/NATURE | 12
SUPPLEMENTARY INFORMATIONRESEARCHdoi:10.1038/nature22033

3. Comparison of GBR and OKI genomes
The final assembly and annotation of OKI and GBR genomes do not support either
cryptic speciation or marked genetic divergence between these two individuals,
despite being separated by 5000 km. This is based on single-nucleotide
polymorphism (SNP) analysis, gene model liftOver and whole genome alignment,
which all confirm that the two genomes share a high degree of conservation in both
the overall nucleotide sequence, and gene structure and organization.
3.1 Estimation of intra-genome heterozygosity
Overall genome heterozygosity was estimated by SNP analysis. 3,359,642 and
3,425,577 SNPs were identified in the GBR and OKI genomes, respectively, equating
to a SNP rate of 0.88% and 0.92% (Extended Data Fig. 2; Extended Data Table 1).
3.2 Estimates of inter-genome heterozygosity
OKI and GBR COTS genomic assemblies were aligned using by reciprocal BLASTN+
(Camacho et al. 2009) and found to be 98.8% identical, for either scaffolds longer
than 10 kb, or alignments with bit-scores over 10,000 (Extended Data Fig. 2; Fig.
S3.1). A 1.4% SNP rate was detected by mapping OKI reads to the GBR genome, and
vice versa, which is consistent with heterozygosity rate as measured by BLASTN+
alignments (Extended Data Table 1). Further, of these SNPs, approximately 64% are
common to both genomes (Fig. S3.2). A histogram of the number of SNPs per a
sliding 100 bp window, taken at 50 bp increments along the respective mapping
alignments, was generated (Fig. S3.2). Both COTS genomes show a geometric
distribution of SNPs, which suggests that COTS SNPs are caused by recombination
and not by random mutation (e.g. as would be the case if Poisson distribution were
observed) consistent with low overall genomic heterozygosity (Simakov et al. 2015).
WWW.NATURE.COM/NATURE | 13
SUPPLEMENTARY INFORMATIONRESEARCHdoi:10.1038/nature22033
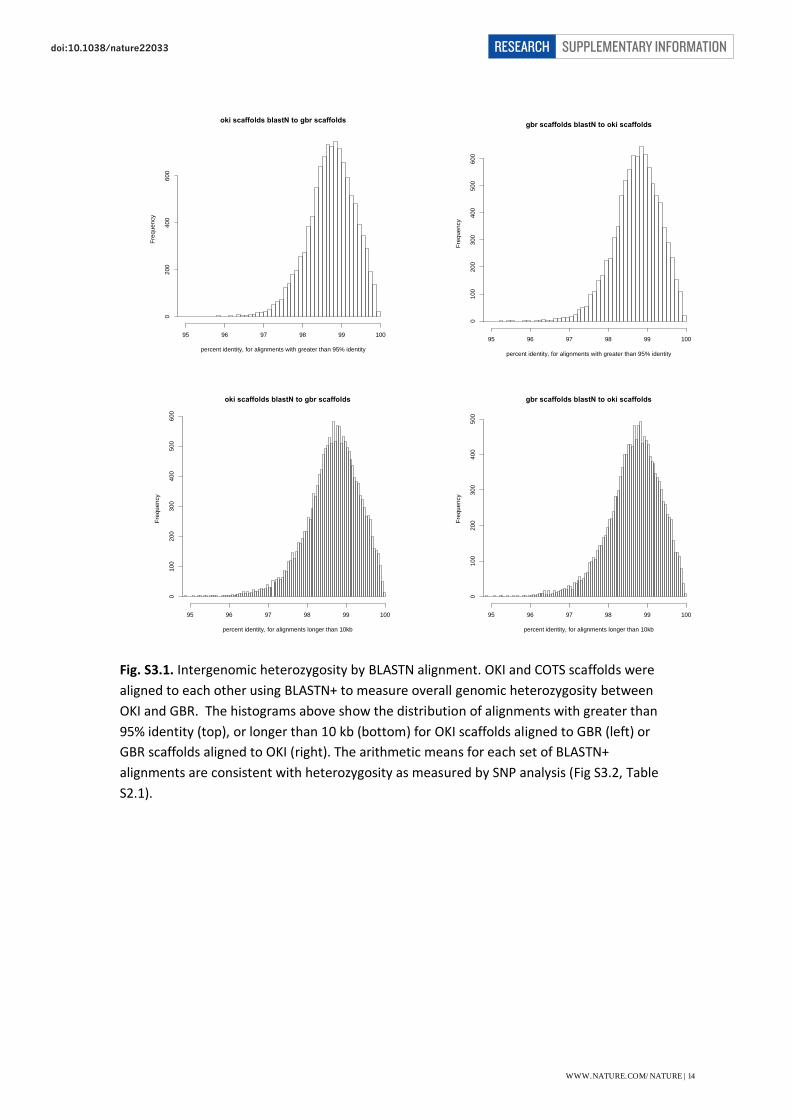
Fig. S3.1. Intergenomic heterozygosity by BLASTN alignment. OKI and COTS scaffolds were
aligned to each other using BLASTN+ to measure overall genomic heterozygosity between
OKI and GBR. The histograms above show the distribution of alignments with greater than
95% identity (top), or longer than 10 kb (bottom) for OKI scaffolds aligned to GBR (left) or
GBR scaffolds aligned to OKI (right). The arithmetic means for each set of BLASTN+
alignments are consistent with heterozygosity as measured by SNP analysis (Fig S3.2, Table
S2.1).
Supplemental Figure 4.1: Inter-genomic heterozygosity by blastN alignment
oki scaffolds blastN to gbr scaffolds
percent identity, for alignments with greater than 95% identity
Fre
qu
en
cy
95 96 97 98 99 100
02
00
40
06
00
oki scaffolds blastN to gbr scaffolds
percent identity, for alignments longer than 10kb
Fre
qu
en
cy
95 96 97 98 99 100
01
00
20
03
00
40
05
00
60
0
gbr scaffolds blastN to oki scaffolds
percent identity, for alignments with greater than 95% identity
Fre
qu
en
cy
95 96 97 98 99 100
01
00
200
30
04
00
50
06
00
gbr scaffolds blastN to oki scaffolds
percent identity, for alignments longer than 10kb
Fre
qu
en
cy
95 96 97 98 99 100
01
00
20
03
00
40
05
00
WWW.NATURE.COM/NATURE | 14
SUPPLEMENTARY INFORMATIONRESEARCHdoi:10.1038/nature22033

Fig. S3.2. SNP analysis. a, Venn diagrams of the counts of SNPs common to both genomes,
based on remapping of SNPs across OKI and GBR. b, Histograms of SNP count per 100 bp
SNP window for OKI, GBR, and GBR reads mapped to OKI. These histograms show the
number of SNPs found in a 100 bp window, taken at 50 bp increments along the respective
mapping alignments. A geometric distribution (blue) suggests that the SNP distribution is
caused by recombination and not random mutation, consistent with genomes containing
low heterozygosity (Simakov et al. 2015).
3.3 LiftOver analysis between GBR and OKI genomes
Coordinate Conversion (liftOver) from the UCSC Genome Browser Utilities (Kent et
al. 2002). Settings were optimised to procure the maximal number of significant
gene model matches between GBR and OKI genomes (Fig. S3.3, Table S3.1). We
noted that relaxing the Similarity score from 1 to 0.95 led to the most dramatic
increase in lifted over gene models (e.g. from ~7,000 to 15,000-20,000 gene models,
across all block coverage scores), while relaxing beyond 0.95 Similarity score, or
relaxing the Block coverage score resulted in a more cumulative increase in the
number of lifted over genes. Thus, at the genomic level, the differences in gene
models between OKI and GBR is mostly the result of point mutations or small
differences in similarity (e.g. <0.95% ID), but differences in intron order or gene
WWW.NATURE.COM/NATURE | 15
SUPPLEMENTARY INFORMATIONRESEARCHdoi:10.1038/nature22033

synteny are also present. Next, to develop a final list of lifted over genes, we
compared different settings, and find that a similarity score of 0.9 and a block
coverage of 0.75 recovers 100% of the gene models that were recovered using a
similarity score of 0.5 and a block coverage of 0.5; however, the former recovers
7,598 more gene models than the latter (Fig. S3.4).
Fig. S3.3. Optimisation of similarity and block coverage variables in liftOver analysis.
Thus, for the final liftOver gene model list, we used a similarity score of 0.9 and a
block coverage value of 0.75 for the genes lifted over from GBR to OKI genomes
(Table S3.1). This resulted in 22,820 gene model liftOvers, based on 20,551 unique
OKI genes, and 20,997 unique GBR gene models (Tables S3.1, S3.2). Additionally, we
performed an analysis of the reasons the GBR gene models that were not recovered
by these parameters (Fig. S3.5; Tables S3.3-S3.6).
0
5,000
10,000
15,000
20,000
25,000
1
0.9
5
0.9
0.8
5
0.8
0.7
5
1
0.9
5
0.9
0.8
5
0.8
0.7
5
1
0.9
5
0.9
0.8
5
0.8
0.7
5
1
0.9
5
0.9
0.8
5
0.8
0.7
5
1
0.9
5
0.9
0.8
5
0.8
0.7
5
1
0.9
5
0.9
0.8
5
0.8
0.7
5
1 0.95 0.9 0.85 0.8 0.75
Genes lifted from Gbr to Oki
Genes lifted from Oki to Gbr
Block coverage
Similarity
WWW.NATURE.COM/NATURE | 16
SUPPLEMENTARY INFORMATIONRESEARCHdoi:10.1038/nature22033
Fig. S3.4. Comparison and optimisation of liftOver settings.
WWW.NATURE.COM/NATURE | 17
SUPPLEMENTARY INFORMATIONRESEARCHdoi:10.1038/nature22033

Table S3.1. Comparison of liftOver parameters and number of matching GBR and OKI gene models.
minBlock, minimum ratio
of alignment blocks or exons
that must remap
minMatch, minimum
ratio of bases that
must remap
GBR models to OKI models
OKI models to GBR models
% GBR to OKI
% OKI to GBR
1 1 7,255 7,173 29.32% 29.49% 1 0.95 16,370 16,004 66.15% 65.80% 1 0.9 16,806 16,421 67.91% 67.51% 1 0.85 16,925 16,540 68.39% 68.00% 1 0.8 16,975 16,596 68.59% 68.23% 1 0.75 17,011 16,629 68.74% 68.37%
0.95 1 7,256 7,173 29.32% 29.49% 0.95 0.95 16,923 16,530 68.38% 67.96% 0.95 0.9 17,372 16,960 70.20% 69.73% 0.95 0.85 17,491 17,082 70.68% 70.23% 0.95 0.8 17,541 17,139 70.88% 70.46% 0.95 0.75 17,577 17,172 71.03% 70.60%
0.9 1 7,260 7,179 29.34% 29.52% 0.9 0.95 18,345 17,942 74.13% 73.77% 0.9 0.9 18,900 18,526 76.37% 76.17% 0.9 0.85 19,049 18,690 76.97% 76.84% 0.9 0.8 19,109 18,756 77.22% 77.11% 0.9 0.75 19,148 18,792 77.38% 77.26%
0.85 1 7,262 7,182 29.34% 29.53% 0.85 0.95 19,186 18,750 77.53% 77.09% 0.85 0.9 19,870 19,478 80.29% 80.08% 0.85 0.85 20,061 19,695 81.06% 80.97% 0.85 0.8 20,143 19,784 81.40% 81.34% 0.85 0.75 20,187 19,831 81.57% 81.53%
0.8 1 7,263 7,185 29.35% 29.54% 0.8 0.95 19,512 19,072 78.85% 78.41% 0.8 0.9 20,279 19,874 81.95% 81.71% 0.8 0.85 20,504 20,131 82.85% 82.77% 0.8 0.8 20,608 20,251 83.27% 83.26% 0.8 0.75 20,659 20,307 83.48% 83.49%
0.75 1 7,269 7,192 29.37% 29.57% 0.75 0.95 20,122 19,621 81.31% 80.67%
0.75 0.9 20,997 20,551 84.85% 84.49%
0.75 0.85 21,286 20,883 86.01% 85.86% 0.75 0.8 21,435 21,062 86.62% 86.59% 0.75 0.75 21,517 21,166 86.95% 87.02%
Boxed row designates the liftOver parameters used in this study.
WWW.NATURE.COM/NATURE | 18
SUPPLEMENTARY INFORMATIONRESEARCHdoi:10.1038/nature22033

Fig. S3.5. Flow diagram outlining the reasons for incomplete liftOver between GBR and OKI
genomes.
WWW.NATURE.COM/NATURE | 19
SUPPLEMENTARY INFORMATIONRESEARCHdoi:10.1038/nature22033

Additional Supplementary Tables
Table S3.2. List of GBR-OKI gene model matches using liftOver parameters.
Table S3.3. Total list of genes that did not liftOver.
Table S3.4. List of genes that did not liftOver because of boundary problems.
Table S3.5. List of genes that did not liftOver because partially deleted.
Table S3.6. List of genes that did not liftOver because completely deleted.
WWW.NATURE.COM/NATURE | 20
SUPPLEMENTARY INFORMATIONRESEARCHdoi:10.1038/nature22033

21
4. Phylogenomic and population genomic analyses
4.1 Phylogenomic analyses
Our bioinformatics pipeline retained only genes that were inferred to be orthologous
among the HaMStR model organisms core orthologue set and sampled from at least
15 of 28 taxa. This resulted in a final matrix of 427 orthologous groups (OGs) totalling
95,585 amino acids positions in length. After excluding Alicut/Aliscore-trimmed
alignments shorter than 50 amino acids in length, the average OG length was 224
amino acids and the longest was 531 amino acids. All OGs were sampled from at
least 15 taxa but some were sampled for as many as 25 taxa with an average of 17
taxa sampled per OG. Missing data in the complete dataset were 47.31%.
We analysed a concatenated supermatrix of 427 genes (95,585 amino acids), 45.16%
missing data) recovering a fully-resolved tree consistent with the growing consensus
of echinoderm phylogeny (Telford et al. 2014; O’Hara et al. 2014; Cannon et al.
2014; Reich et al. 2015). With exception of support for hemichordate monophyly
(bootstrap support, bs = 98%), we found maximal support for all phylum- and class-
level taxa as well as relationships among them. Each of the five major lineages of
Echinodermata was recovered monophyletic with Crinoidea sister to all other
echinoderms (Eleutherozoa). Within Eleutherozoa, we found strong support for
Echinoidea (Echinoidea + Holothuroidea) sister to Asterozoa (Ophiuroidea +
Asteroidea; bs= 100), consistent with other recent investigations that had more
limited sampling within Asteroidea (Telford et al. 2014; O’Hara et al. 2014; Cannon
et al. 2014; Reich et al. 2015). Taxon sampling, and annotations and characteristics
of each gene analysed are presented in Tables S4.1 and S4.2.
4.2 Population genomic analysis
Estimation of the historical effective population size was determined by MSMC
(Schiffelsand Durbin 2014). Time estimates can be significantly influenced by the
mutation rate and generation time. Using a generation time of three years, the
WWW.NATURE.COM/NATURE | 21
SUPPLEMENTARY INFORMATIONRESEARCHdoi:10.1038/nature22033

22
mutation rate was set from 0.5 x 10⁻⁸ to 1.5 x 10⁻⁸ and the effective population size
decline and recovery times were estimated (Table S4.3).
Table S4.3. MSMC estimated decline and recovery time with different mutation rates.
GBR OKI
mutation rate
recovery time (years ago)
decline time (years ago)
recovery time (years ago)
decline time (years ago)
5.00E-09 45,248 91,672 43,580 88,292
7.50E-09 30,166 61,115 29,053 58,862
1.00E-08 22,624 45,836 21,790 44,146
1.25E-08 18,099 36,669 17,432 35,317
1.50E-08 15,083 30,557 14,527 29,431
Additional Supplementary Tables
Table S4.1. Taxon sampling, data sources, and number of genes sampled per
taxon.
Table S4.2. Gene sampling and annotation.
WWW.NATURE.COM/NATURE | 22
SUPPLEMENTARY INFORMATIONRESEARCHdoi:10.1038/nature22033

23
5. Protein domain analyses
5.1 Protein domain annotations
In addition to the COTs, all protein domains were identified in the following
metazoan taxa: Mnemiopsis leidyi, Amphimedon queenslandica, Trichoplax
adhaerens, Nematostella vectensis, Lottia gigantea, Lingula anatina, Capitella teleta,
Caenorhabditis elegans, Drosophilia melanogaster, Branchiostoma floridae,
Ciona intestinalis, Danio rerio, Xenopus tropicalis, Homo sapiens, Saccoglossus
kowalevskii, Ptychodera flava, and Stronglyocentrotus purpuratus We downloaded
protein coding genes for all 18 species and used HMMER to annotate all known
protein domains based on the Pfam database (version 29.0) (Finn et al. 2015). If a
domain occurred multiple times in a protein sequence, it was counted only once
(Tables S5.1, S5.2).
Table S5.2. Pfam statistics.
Species Number of proteins
Proteins with Pfam annotation
Percent with Pfam annotation
Amphimedon queenslandica 40122 20466 51.0 Mnemiopsis leidyi 16559 9630 58.2
Trichoplax adhaerens 11520 9368 81.3 Nematostella vectensis 24773 17305 69.9 Acanthaster planci 24323 14254 58.6 Stronglyocentrotus purpuratus 28987 22587 77.9 Saccoglossus kowalevskii 34239 28286 82.6 Brachiostoma floridae 50817 39302 77.3 Ptychodera flava 34647 19793 57.1 Ciona intestinalis 16667 9453 56.7 Danio rerio 25642 23118 90.1 Xenopus tropicalis 18442 15417 83.6 Homo sapiens 20313 20092 98.9 Drosophila melanogaster 13918 10813 77.7
Caenorhabditis elegans 20447 13852 67.7
Capitella teleta 32175 20571 63.9 Lottia gigantea 23349 14450 61.9 Lingula anatina 47943 22623 47.2
We then iteratively conducted a fisher exact test using R (R development core team.
2008), comparing the number of counts in Pfam families found in species, to the
WWW.NATURE.COM/NATURE | 23
SUPPLEMENTARY INFORMATIONRESEARCHdoi:10.1038/nature22033

24
background, defined as the average of the counts in the remaining species (Table
S5.3).
5.2 Lineage-specific domain enrichment
To assess the differences in protein domains across metazoan genomes, we
examined protein domain (Pfam) expansion and contraction in each species, based
on the total number of unique genes that contained each Pfam domain. Heat maps
are ordered based on increasing lineage-specificity from basal metazoans,
protostomes, deuterostomes, ambulacrarian to echinoderms, with A. planci on the
far right. We used the scaled value for each individual Pfam domain as a proxy for
expansion, whereby any value greater than the mean was considered a domain
expansion, and any value less than the mean is a domain contraction. Using this
methodology, we find that certain taxa reveal dramatic, lineage specific domain
expansion events (Extended Data Fig. 3, Table S5.1). For instance, this is exemplified
in B. floridae and S. kowalevskii (Figure 5.1a). Further investigation of deuterostome
taxa reveals many ambulacrarian specific expansions (Figure 5.1b and Tables S5.4,
S5.5), as well some echinoderm- and A. planci-specific domain expansions (Extended
Data Fig. 3, Tables S5.6, S5.7).
Additional Supplementary Tables Table S5.1. Collation of Pfam domains in select metazoan genomes.
Table S5.3. Scaled analysis of gene expansion and contractions of metazoan Pfam
domains.
Table S5.4. Raw number of genes and scaled analysis of gene expansion and
contractions of deuterostome Pfam domains.
Table S5.5. Scaled analysis of gene expansion of deuterostome Pfam domains
showing expanded ambulacrarian domains.
Table S5.6. Raw number of genes and scaled analysis of gene expansion and
contractions of ambulacrarian Pfam domains.
WWW.NATURE.COM/NATURE | 24
SUPPLEMENTARY INFORMATIONRESEARCHdoi:10.1038/nature22033

25
Table S5.7. Raw number of genes and scaled analysis of gene expansion and
contractions of echinoderm Pfam domains.
WWW.NATURE.COM/NATURE | 25
SUPPLEMENTARY INFORMATIONRESEARCHdoi:10.1038/nature22033

26
6. Tissue gene expression analyses
6.1 Similarity of tissue transcriptomes
Seven and ten tissue transcriptomes were sequenced from GBR and OKI,
respectively (Tables S2.1, S2.3, and S6.1). Trimmed reads from all these
transcriptomes, except GBR “He-new” and GBR “new”, were mapped to the 24,747
and 24,323 gene models in GBR and OKI (Tables S2.1, S2.3).
Table S6.1. Transcriptome Statistics.
Tissue Total gene
models Number
expressed genes Percent
expressed genes
GBR
Body wall
24,747
17,030 69% Gonad 21,197 86% He-new 17,230 70% Podia 18,424 74%
Spine 16,330 66% Stomach 18,727 76%
new 16,323 66%
OKI
01 Podia
24,323
14,662 60% 02 Spine 17,868 73% 03 Testes 13,919 57% 04 Nerve f1 16,216 67%
05 Nerve f2 15,958 66% 06 Nerve m1 16,678 69% 07 eg 15,944 66%
08 mg 18,746 77%
09 oocyte 18,264 75% 10 mouth 10,268 42%
All tissue transcriptomes from GBR and OKI locations cluster closely together in
comparison to the oocyte transcriptome (Fig. S6.1). When the oocyte transcriptome
is removed, 51% of the variance lies along PC1, clearly distinguishing the OKI mouth,
GBR body wall, and GBR spine from the remaining 13 transcriptomes (Fig. S6.1). All
three radial nerve samples cluster tightly together. Based on these PCAs, there is no
evidence that the samples are segregating based on geographical location.
WWW.NATURE.COM/NATURE | 26
SUPPLEMENTARY INFORMATIONRESEARCHdoi:10.1038/nature22033

27
Fig. S6.1. Similarity of GBR and OKI tissue transcriptomes. Principal component analyses
using total FPKM values for gene models shared between GBR and OKI, including a, and
excluding b, oocyte tissue. Heat maps depict sample similarity based on Euclidean distance,
with red corresponding to a high degree of similarity. OKI transcriptomes, red dots; GBR
transcriptomes, blue dots.
Based on the PCAs of all 17 transcriptomes, we selected the following eight tissues
to characterise gene expression in COTS: male and female radial nerves, tube foot
(podia), spine, body wall, stomach, mouth and spent testes (Table S6.2). The
WWW.NATURE.COM/NATURE | 27
SUPPLEMENTARY INFORMATIONRESEARCHdoi:10.1038/nature22033

28
presented order of these tissues was derived from the Euclidean distance (Love et al.
2014) of these transcriptomes based on both expression (Fig. S6.2) and Pfam (Finn et
al. 2015) similarity (Fig. S6.3).
Table S6.2. Tissue transcriptomes used to characterise gene expression.
Source Tissue No. genes with
counts Median
count value No. genes >=
median % genes >=
median #Pfams >=
median
OKI Radial Nerve ♂ 16356 14 8299 51% 3283
OKI Radial Nerve ♀ 15374 11 7719 50% 3050
GBR Tube foot 16100 13 8445 52% 3364
OKI Spine 16805 16 8656 52% 3419
GBR Spent Testes 18417 17 9497 52% 3669
GBR Stomach 16408 17 8333 51% 3289
OKI Mouth 10667 19 5644 53% 2600
GBR Body-wall 15486 9 7547 49% 3003
Fig. S6.2. Transcriptome similarity of selected COTs tissues. a, Heat map showing the
Euclidean distance between COTS tissue transcriptomes based on the FPKM expression
values of the 22,820 liftOver gene models between OKI and GBR gene models and b,
corresponding PCA plot of the same data. Full FPKM values can be located in Table S6.3.
WWW.NATURE.COM/NATURE | 28
SUPPLEMENTARY INFORMATIONRESEARCHdoi:10.1038/nature22033

29
Fig. S6.3. Domain enrichment in tissue transcriptomes. a, Heat map showing the Euclidean
distance between COTS tissue transcriptomes based on similarity of expressed Pfam
domains. b, Heat map indicating the total domain expansion and contraction between each
tissue and c, Pfam domains that are enriched in the transcriptome of a single tissue or
closely related tissue transcriptome based on Euclidean distance. Table S6.4 and S6.5
contains the specific number of genes and Pfam domains descriptions for each of the two
heat maps (b and c) presented in the same order, respectively. Table S6.6 contains the
number of all Pfam domains for all tissues with the corresponding gene models.
6.2 Tissue-enriched gene expression
Further analyses rely on the identification of genes that are expressed in a tissue-
specific manner. Therefore, to achieve a list of genes that are differentially
expressed in each tissue, we identified all genes with an expression value (FPKM)
above the median for each respective tissue (Table S6.2). Median FPKM value was
calculated for each transcriptome after genes with zero counts were removed (Table
S6.2), and tissue-specific lists (Table S6.2) were defined by the genes with an FPKM
value above the median, resulting in approximately 50% of the total genes for all
tissues (Table S6.2). We determined the number of Pfam domains represented by
these lists of ‘expressed’ genes (Table S6.2), finding that each tissue is characterised
by a similar number of protein domains.
WWW.NATURE.COM/NATURE | 29
SUPPLEMENTARY INFORMATIONRESEARCHdoi:10.1038/nature22033

30
Using the median-FPKM value as a putative threshold for gene expression, we find
that each transcriptome is characterised by genes that are both enriched in specific
tissues and ubiquitously expressed across various tissue types (Fig. S6.4).
Fig. S6.4. Heat map indicating the expression profiles (FPKM value scaled by row) for all
liftOver genes across 8 tissue transcriptomes. Darker colours indicate higher expression.
Columns are ordered based on the Euclidean distance of tissue-specific transcriptomes, as
shown in Fig. S6.3. Scaled and unscaled FPKM values used to generate this heat map can be
viewed in full in Table S6.3
6.3 Tissue-enriched domain expansions
Using the lists of tissue-specific genes (Table S6.2), we performed Pfam enrichment
analyses to identify domains that are more prevalent in certain tissue-types (Fig.
S6.3). To supplement tissue similarity analyses based on expression profiles, we also
clustered the tissue-specific transcriptomes based on Pfam domain similarity using
WWW.NATURE.COM/NATURE | 30
SUPPLEMENTARY INFORMATIONRESEARCHdoi:10.1038/nature22033

31
Euclidean distance (Love et al. 2014) (Fig. S6.3a and Table S6.4). Euclidean distance
based on Pfam resulted in a similar dendrogram and clustering order as the analyses
based on expression values, providing further support for the patterns of tissue
similarity illustrated by gene expression data. Complete lists of protein domains and
corresponding gene model IDs can be found in Table S6.6.
Tissue-specific domain enrichment analyses were performed using the same
methods as the domain expansion analyses outlined in the Online Methods and
Supplementary Note 5. All tissues are both enriched and depleted in certain protein
domains (Fig. S6.3b and Table S6.4); the mouth exhibits the highest degree of
domain depletion, suggesting decreased transcriptome complexity with respect to
other tissues. This is supported by expression data, which indicates that that mouth
transcriptome has the lowest number of expressed genes. In addition, we identified
(i) all domains that are specific to an individual tissue and closest-clustering pairs
(Fig. S6.3c and Table S6.5), (ii) the genes that show the same number of genes per
domain across all tissues (Table S6.7) and (iii) the genes that are enriched in different
clustering blocks based on the Euclidean distance (Table S6.8).
Additional Supplementary Tables Table S6.3. FPKM values for OKI – GBR LiftOver gene models.
Table S6.4. Actual and scaled values for the number of genes expressed above the
median in each tissue for each Pfam domain.
Table S6.5. Actual and scaled values for the number of genes per tissue with each
Pfam, indicating tissue-specific domain expansions.
Table S6.6. The number of all Pfam domains for all tissues and corresponding gene
models.
Table S6.7. Pfam domains with the same number of genes in all tissues.
Table S6.8. Actual and scaled values for the number of genes per tissue with each
Pfam, indicating tissue-specific domain expansions.
WWW.NATURE.COM/NATURE | 31
SUPPLEMENTARY INFORMATIONRESEARCHdoi:10.1038/nature22033

32
7. Exoproteome Analyses
7.1 In silico secretome prediction
In silico prediction of secreted proteins from COTS (OKI) using three datasets (for
details see the Online Methods) predicts approximately 1,775 secreted proteins (Fig.
S7.1). To obtain the final list of secreted proteins without any transmembrane
prediction, all predicted transmembrane proteins were subtracted from the protein
list. In summary, 1,207 genes represent the final in silico secretome prediction. This
dataset was used to aid in the mass spectrometry analysis of seawater obtained
from COTS at aggregation and in the presence of giant triton (alarm).
Fig. S7.1. In silico secretome prediction. Pipeline of bioinformatic analysis of secreted
proteins. Venn diagram shows bioinformatics data of signal peptide prediction using three
methods.
WWW.NATURE.COM/NATURE | 32
SUPPLEMENTARY INFORMATIONRESEARCHdoi:10.1038/nature22033

33
7.2. Exoproteome purification and identification
Of the estimated 1,125 proteins identified forming the COTS protein secretome,
some may be released into the surrounding water as potential conspecific signalling
cues. COTS aggregation-conditioned seawater and COTS exposed to giant triton-
conditioned seawater were collected for exoproteome analysis by nano liquid
chromatography coupled with Triple Time-of-Flight mass spectrometry (nanoLC-
MS/MS), with the workflow shown in Fig. S7.2. See below for further description of
methods.
Fig. S7.2. Exoproteome extraction and analysis workflow. Proteins were extensively
fractionated followed by identification with high-accuracy nanoLC-Triple-TOF-MS.
WWW.NATURE.COM/NATURE | 33
SUPPLEMENTARY INFORMATIONRESEARCHdoi:10.1038/nature22033

34
7.3.1 In-solution trypsin digestion, fractionation and NanoHPLC-ESI-Triple Time-of-
Flight analysis
Reconstituted samples containing about 1 mg exoproteins in 100 µl extraction buffer
were reduced in 5 µl of 200 mM dithiothreitol (DTT) for 60 min at 37°C. Alkylation
was carried out in 20 µl of 200 mM of iodoacetamide (IAA) prepared in 25 mM of
NH4HCO3 for 60 min at room temperature. 20 µl of 200 mM DTT was then added and
the mixture incubated at room temperature for 30‐60 min. The urea concentration
was reduced with 775 µl MilliQ-H2O, and digestion was performed overnight with
trypsin (1:50 ratio) at 37°C. The reaction was stopped by adjusting the pH of the
solution to <3 by adding 10% formic acid. Tryptic peptides (50 μg) were fractionated
on a Biobasic SCX HPLC (2.1 x 150mm) column (Thermo Fisher Scientific, Waltham,
MA) using a PerkinElmer Series 200 HPLC system (Perkin-Elmer, Boston, MA) at a
flow rate of 0.2 ml/min. The mobile phases used were composed of (A) 2.5 mM
ammonium acetate in 25% acetonitrile, pH 4.5 and (B) 250 mM ammonium
acetate in 25% acetonitrile, pH 4.5. Seventeen fractions were collected using an 80
min gradient of 2% B for 5 min, 2-50% B for 40 min, 50–98% B for 5 min, and 98% B
for 10 min, 98-2% B for 5 min followed by 10 min at 2% B at a flow rate of 0.2
ml/min. The SCX fractions were dried in SpeedVac SC250EXP (Thermo Fisher
Scientific, Waltham, MA) at 40°C.
Dried fractions were resuspended in 0.1% v/v formic acid (25 μl) and analysed on a
Shimadzu Prominance Nano high pressure liquid chromatography system (Kyoto,
Japan) coupled to a Triple Time-Of-Flight 5600 mass spectrometer (Triple TOF-MS,
AB SCIEX, Concord, Canada) equipped with a nano electrospray ion source (ESI;
NanoLC-ESI-Triple-TOF-MS). Eight µl of each digested sample was injected onto a
C18 trap column (50 mm x 300 μm, Agilent Technologies, Sydney, Australia) at 30
µl/min. The samples were de-salted on the trap column for 5 min by flushing with
solvent A (0.1% aqueous formic acid) at 30 µl/min. The trap column was then placed
in-line with a 150 mm x 75 μm 300SBC18, 3.5 µm analytical nano HPLC column
(Agilent Technologies, Australia). Linear gradients of 1-40% solvent B [90/10
acetonitrile/0.1% formic acid (aq)] over 40 min at 300 nl/min flow rate, followed by a
steeper gradient from 40-80% solvent B in 10 min were used for peptide elution.
WWW.NATURE.COM/NATURE | 34
SUPPLEMENTARY INFORMATIONRESEARCHdoi:10.1038/nature22033

35
Solvent B was held at 80% for 5 min for washing the column and returned to 1%
solvent B for equilibration prior to the next sample injection. The ion spray voltage
was set to 2400V, declustering potential (DP) 100V, curtain gas flow 25, nebuliser gas
1 (GS1) 12 and interface heater at 150oC. The mass spectrometer acquired 500 ms
full scan TOF-MS data followed by 20 x 50 ms full scan product ion data in an
Information Dependant Acquisition (IDA) mode. Full scan TOFMS data were acquired
over the mass range 350-1800 and for product ion ms/ms 100-1800. Ions observed
in the TOF-MS scan exceeding a threshold of 100 counts and a charge state of +2 to
+5 were set to trigger the acquisition of product ion, ms/ms spectra of the resultant
20 most intense ions. Data were acquired and processed using Analyst TF 1.5.1
software (AB SCIEX, Concord, Canada).
7.3.2 Protein identification parameters
The PEAKS Studio used the following parameters: precursor ion mass tolerance, 0.1
Da; fragment ion mass tolerance, 0.1 Da; fully tryptic enzyme specificity with two
possible missed cleavage; monoisotopic precursor mass; a fixed modification of
cysteine carbamidomethylation; and variable modifications included methionine
oxidation, conversion of glutamine and glutamic acid to pyroglutamic acid,
acetylation of lysine and deamidation of asparagine. Proteins were grouped if they
were supported by the same peptides, and the number of high-confidence
supporting peptides that are uniquely mapped to the protein group was set to ≥1.
Although a minimum of two peptides was commonly used to consider protein
identifications statistically significant, identifications with one proteotypic peptide
was allowed due to the high homology of proteins derived from two genomes. The
protein confidence score (-10*lgP) was calculated based on confidence score of its
supporting peptides.
7.3.3 Validation of quantitative proteomics and data deposition
The results were validated sequentially with the charge of featured peptides
between 2 and 5, fold change ≥1 and detected in more than one sample of the
triplicate, while the FDR of protein was set to ≤1%, the number of unique peptides
and fold change of each protein were set to ≥1 and ≥2, respectively; peptide ratio
WWW.NATURE.COM/NATURE | 35
SUPPLEMENTARY INFORMATIONRESEARCHdoi:10.1038/nature22033

36
versus quality-score and ratio versus average-area (MS signal intensity) were set to
recommended values of 8, respectively. The quantitative patterns of grouped
secreted proteins in normalised log2(ratio) were presented, and proteins were
clustered using one minus Pearson correlation (Lin 1989. The mass spectrometry
proteomics data and protein database have been deposited to the
ProteomeXchange Consortium via the PRIDE (Cote et al. 2012; Vizcaino et al. 2014,
2016) partner repository with the dataset identifier PXD005409.
In total, there are 394 proteins identified from the exoproteome of COTS using the
combined databases of GBR and OKI (Fig. S7.3, Table S7.1). Of these, 108 are derived
from precursor protein sequences containing the hallmarks of a typical secreted
protein (Fig. S7.4, Table S7.2). A total of 71 were present in preparations derived
from aggregation, 14 within the alarm and 23 within both. Of those exoproteins
identified, several have putative or defined functions as described in COTS or other
species, including the plancitoxins, vitellogenin, ependymin, peroxidisin and
pentraxin. Plancitoxins were the most abundant proteins identified; these are known
to function as potent toxins, causing liver cells to undergo apoptosis (cellular death)
by entering the nucleus of the cell and then degrading DNA (Lee et al. 2014).
Another protein with high abundance was vitellogenin; this protein appears to be
produced in both female and male COTS, and is the major yolk protein in asteroids
(Alqaisi et al. 2016).
Fig. S7.3. Number of peptides detected in seawater samples specific to aggregated (244) and
triton-alarmed (77) COTS. 73 sequences were found to be common between conditions.
WWW.NATURE.COM/NATURE | 36
SUPPLEMENTARY INFORMATIONRESEARCHdoi:10.1038/nature22033

37
A disintegrin and metalloproteinase with thrombospondin motifs; oki.137.43; gbr.350.28 MMLSASLFLSFAAMALAGPPVPNHRFSKDELQRYFGVDSDDKAPEYEIVYPEYVTADTKRSMDRSSIT
ASHLDVYVDAFGETLHMTVEHDDSGIKPGLEAEYLTDEGIIKVPVQTDCIYSGKVVGEGDSLVSVTTC
VGLMAIAYHASGPTYIEPLDDEHAYKRDIGRGLPHVAYKNKPQNGASCPVRSPLCVEGDVKPSGTKYL
KLAFVGDALLHYLRGNSTLTALTTVFNAVKNILQLDSLAGKDLVPKLVHMIILTVRQPGFWISWNAYRY
LPSAAEWLDTKQYPPSDDRHWDNAAIFSGLPFVNGILGLAYVGVCDSKEAVSVSRFHSLDEATATAAH
EIGHNLGMCHDNQDNSCPSTGYVMAPYESEVKIEPIWSSCSRRYYNRFVDSNTCYNDS
Reprolysin family propeptide (PF01562); Reprolysin (PF01421)
Acid ceramidase; oki.24.59; gbr.394.7 MLVRVLAPLAVLVMVFAPSLGQDVYPYTDKVCRTDVQYPPADAKTKVPSFVLNLDMNPEDRWRPLMKN
KSAELKAMINDIIDLVGAFFKNKTKVVNLLDEVLGPLAYTLPQPYQAELIGIADASGVPLGQIVLYNI
FYEVFTVCTSIVAESPNGTLYHARNLDFGLFLGWDVKNQKWELTERLRPLVVNVDYQVQGKTVAKAVH
FAGYVGVLTGIKPGVVTMTMNERYNIDGGYIGILEWIMGKRSEQWMGFFMRETLLNATDTKAKVINAK
ILAPGYIILGGSKTGEGAVIVIDRKEPAYVEELDPKKGKWFLVETNYDPTEKPPFFDDRRTPALKCMT
NTTQKAVGLGPIYNVLSTKPNLNLLTTYTAMMQVNSGYLETYIRQCPQPCYPCPGVPHSWGIIACNSRF
KHVFNVEMTCEGCSGAVTRVLNKLGDKVAKFDVDLAQKKVVIESALSSDELLETLKKTGKETTYVGQE
N
NAAA-beta (PF15508); CBAH (PF02275); HMA (PF00403)
Hyalin-like; oki.8.102; gbr.4.107 MGSLILLIVAVLPSLVSSIVNDLSCEYRPTAGTGEYTFDTNVLNDGEFSFSFKVLTNSDVRIMLSPYAE
EDTAAYVITSFQRPGPIASRGSGSWHQGRHEGHVMAKRTLSSIGQNNLLTTIKRYDGSVLVSHSVADES
PFRESELRCMDHCMNGYWICFQSDTIKLGRAGDSAPYLEYQVPSGETFNPRYVGFATGSTNIGLFGDFR
FADECVSQGSGSELGGTTTKQPRDCRNVDCGDTTCAFGFKTDSNGCQTCDCKDSPCDPLSSCTETCKH
GHEKNEYQCETCTCTPGPCDDDPCQNGAYCYGIGSNDYGCYCMEGYSGKNCEEDVQEPSIKCPGNMNQ
TTDEGVGFASVTYPEVTATDNSGQEPSISCTPNTATLPVRSNLIQCVATDDSNNKASCSYTILITDEE
PPKLTCSDPINRPTDSGEPFATVDYDLPLVEDNYAASGVSSCDKDQDYKFPIGDTEVTCTALDLYGNE
GKCSFNVTVSDQEPPKFECPLPMLDETLDQGESFATVDYTLPDVTDNVDSDLTVSCTEGPGSQFPVGE
WTVTCSAIDKAGNSKECSFPVEVEDDQPPKLVCPDLISNTTDPGKAYATLQYSLPQAVDNADPKPAVS
CELGPGSKFWVKPNTVVCTATDKYGNSNTCDITVEIKDEELPKITCPEPMENVSVDTGKAYATVDYAP
SGVQDNEDRTPDVSCDGPKDSQFDIGESTVTCTVTDRSDNSASCSFTINVIDDEKPKIICPIPMPDVK
TDTGKRTATVDYGEATATDNADPNPEVTCDKGTNTEFGIGTTTVRCKAIDDAGNKKGCKFDVTVEDDE
EPTLECPESMDPPTDEGKSFATVEYPPPAVSDNVDASPKVTCSETTGSEFSFGPTTVECTAVDSSMNE
ATCNFTINVKDTEKPELDCPIVITEPVEEGKSYAIVEFSPNVFDNVDPEPQVSCTPPSGEEFDIGKTE
VTCTAVDDDGNFDSCDIEVLVEDNEGPIIKCQIPMPSSADPGSSSTFVNYNMPTATDNSGNVPTIECV
PPSGSEFTIGTKNVTCTATDSSGNSNQCSFGVIVKDTEAPTFDCPDDMAPSMDEGQSFATVSYKTPTA
EDNWDNDPRVTCTPRSATTFNAGKNTVTCTAIDTARNKKNCTFTIFVEDTEEPSITCPIDMDEPTEVG
VSYAVIDFETPKAFDNADPRPKVDCDRVADSQFDIGSTSVNCTARDNAGNEETCTFTIVINDEESPNI
TCPSRMDKVSVDWHQAYATVNYDPPTVRDNADLSPSVSCVKASGSEFGLGETMVTCTASDKYGNSKSC
KFPINVVDDEKPEITCPDRIDQPTDRDQDYATVIYPEFTVKDYVDDDLTVTCQKSSGSKFYIEDNHVT
CTARDDAGNEASCTFPVVVTDEQPPKLTCPVNMTKSLDEGKPYATIKYTKPTATDNVDPQPEVSCNVP
PDSEIYELGLFPVTCIAIDYAENANSCMFTVEVKDEEKPKITCPMNMAPSTDPGEKYATILYTEPIVV
DNFDPSPEVTCSVGQFEQFQVGSKTVTCTATDSSDNTNSCTFKVTVGDTEPPSMQCRVNNIYKFTDKG
KATATVDYALPDVSDNVDPSPSVSCNPSSNTQFSTGSTTITCTATDSANNVNDCQFSVIVT
Antistasin (PF02822); HYR (PF02494) x 16
Lectican/chondroitin sulfate proteoglycan (aggrecan/neurocan core protein-like); oki.91.45; gbr.124.31 MDMSAFEAIVFLVGLYASQAAVCPADWRQYGDICYFPITTSMSWEEANQACFAKEAQLALPRSQMEQD
AIWGMLQETVNGQFPERIWIACSDFEEEGNWRPCPLRDDGSNAYENWRGNQPDNNNGADCAAMIRSNG
GRWGDRPCRELNFAVCQLPAILMSVPTVCLLINTDGRPASACLVGHNLKEIPVTGVVECGMACRLEPR
CRSFNLVKQGRAGMLCQLKNVTWSEADEKSFMKTQENCYFFEL
Lectin_C (PF00059); PAN_1 (PF00024)
WWW.NATURE.COM/NATURE | 37
SUPPLEMENTARY INFORMATIONRESEARCHdoi:10.1038/nature22033

38
Alpha-L-fucosidase; oki.12.80; gbr.3.112 MTCITLLKIFVLMAFLESILAQGQPPYQPNWQSIDSRPLPGWYDDSKFGIFMHWGVYSVPSYGSEWFW
RYWASNVKSYVDFMKQNYPPDFTYADFAKEFRTELFNASHFAEIVEASGARYYVLTTKHHEGYTMWPS
RYSWNWNAMDVGPKRDLVGEIATAIRTLKTKVYFGLYHSLFAWYHPLYLQDEANNFQTRLYPQQISTP
MLHELVENYHPEIIWSDGFEKTTGPEYWNSTGFLAWLYNSSPVRDIVVVNDRWGEGTVCHHGGYYTCH
DRYNPGTLQNHKWENAMTVDKHSWGYRRNVKLADYLDAEELIASLAKTVSCGGNMLLNIGPTHDGRIV
PIFEERLRQIGAWLKVNGEAIYGSHPWKAQNDTKTQNIWYTSQMNGTTVEAVYAIILKWPTNNHVFLG
APISSKLTTVSMLGVEPPLKWEMGPKGVGMNVTMPTLNPVQIPCQWAWVLKLCNIL
Alpha_L_fucos (PF01120); Fucosidase_C (PF16757) Alpha-L-fucosidase; oki.11.195; gbr.81.217 MAGYATKLSVVALCIFFGAIHQCLGKRVKYDYEYDYEPNWPSLDSRPLPPWYDEAKIGIFMHWGVFSV
PSFGSEWFWWYWQGQPQAPYVEFMKENYRPGFTYADFASMFTAEFFDPNAFAEIIEASGAKYFVLTSK
HHEGFTNWPSKYSWNWNAMDVGPKRDLVGELATAIRTTAKDVHFGLYHSLFEWFNPLFLQDQKAGFKT
QAYVQDICLPELYEIVMSYKPDLLWSDGDWSATPDYWNSTEFLAWLYNSSPVKDTIVTNDRWGSGTLC
QHGGYYTCSDRYNPGTLQKHKWENAMTIDKKSWGYRREATLADYLSIDELVAILAQTISCGGNLLMNI
GPTHDGRIVPVFEERLRQMGAWLKVNGDAIYASKPWRVQNDTKTKDVWYTSKMEGSLLSVFAIVLDWP
VTNQLLLGAPIATNQTQINMLGYSIPLQWKQAPSGGGIVVTMPALNPAQLPCQWAWVIKMQTVQ
Alpha_L_fucos (PF01120); Fucosidase_C (PF16757) Alpha-L-fucosidase; oki.11.192, oki.11.193, oki.11.194, gbr.81.214, gbr.81.215, gbr.81.216 MFPQHVLVCCSLIAAVAGVQARNEPNWESLDARPLPSSYDEAKIGVFSHWGVYSVPSYGSEWFWWNWQ
ALCYPGYVKFMQKTRPSGFTYQDFAAEFKVELFDTEQFTDILQASGANYFVLTSNHHEGFTDWPSKYS
WNWNSMDVGPKRDLVGEVAAAVRSKTNLRFGLYHSQFEWFNPLYIQDLKHLFTTNDYVTKVYMPELME
LVETYRPELVWSDGSGEGVYQYWKSTEFLAWLYNDSPVKDSVVVNVRWGILCECNHGGYYTCQDRYNP
GVLQKHKFENAMTLDLSSLGYRRDATLKDIMDIDVLIATLAQTVSCGGNLLVNVGPTRDGRIVPIFEE
RLRQMGAWLKVNGEAIYSSKPWKAQKDVKTESVWYTSKQNETVTAVYVIVLDWPIDNDIILGSTMPTN
RTTVSVLGHEGALKWTRGPSGEGMTVTLPILNPTQMPCHWAWVLKIQNLK
Alpha_L_fucos (PF01120); Fucosidase_C (PF16757)
C-type lectin domain family (alpha-N-acetylgalactosamine-specific lectin); oki.105.24; gbr.330.8 MAFLRVVFAVFIVGLASDLVARCQAGCPTCPPTWTLHFGSCYRLFATPQTFDEAEKHCQQIAGSRKGH
LVSIHNKAENQFVYRMWTTAIVNYNYLWIGMDDRTKEGHFHWTDGSNVDYNAWGESQPDNHNNEDCVH
LRPQKTYADWNDIPCSHKYAYICKMSTTRVGHVTPHNLMVTYLNKPPFAVIEATYLH
Lectin_C (PF00059)
Angiotensin-converting enzyme-like; oki.25.24; gbr.112.9 MGLPRPSFALVALVLALVSLEGAGAKFSPTSAMLELEIIKEHSPSLLRNLCCEDRDQIYDCIIRAWGSI
GGGIHECCSYLRGEQITNEELAAAWLRELDYLSVETAYAGSNFNWNFQTNMTAQNSLYTKNSTMLIGD
FSLEMKNQARQFDTSMFQDPSIKRQFMLLLRGGYLNDRAKRENMTRIANEMENIYGKGTVCRENGECL
TLEPDLEDLMANKRDYDELLWAWKGWRDAVGRKIRPLYPQYVELKNEGARTNSYADESEVWQERYEMR
GDAFEEMLGDIYDAVKPMYQQLHAYVRRKLAERYGKDKVDTNGLIPAHLLGNMWGQQWNNIYDLVIPY
PDVPDLDVTQEMRRQGYTVHKMFKVAERFFKSLGMDPMPDSFWENSMLEKPKDREVVCHGSAHNFFKN
REVRIKMCTEITMEDLYTVHHEMGHCEYYLQYHRQPVVFSSGANPGFHEAVGDTIALSVVTQDYLHEI
GLLDKVSRNKEADINYLMKVALSKIAFLPFGLMIDKWRWGVFRGEIKPESYNEAWWKLREEYQGLKPP
VERTEEDFDPGAKYHIPSGTPYIRYFISFVIQFQFHRAMCEEKGHVGPLHLCNNYNSKRAGQKLRDML
SLGISVPWWEALEVLTGSEFIDPSAIQEYFAPLIEWLKEQNGDNVGWQKHL
Peptidase_M2 (PF01401)
Angiotensin-converting enzyme-like; oki.27.88; gbr.41.46 MSRVLSRMYLSLLLALISAKAGSSLQQARESDPITDQNEANEFLRHYTEQAQIIIYAGALASWGYYTN
VTAYNQQKDAHNQGLVLGTKPQTEPKSRVGKGPMSVIRPELKGTLIGDREVEASLVSAAFRQEAYQNA
SRFDVSGFDEDVKRQFQKIKDIGTAALEPSKVEEYNNVVNKMTDNYSAGTVCKEDQPTECLQLEPGLA
HIMATSTNWDELVWAWKGFRDAVGTPNKPLYKKFVKLANEAAVANGHADMGAYWRSDYESATIVDEAY
WWW.NATURE.COM/NATURE | 38
SUPPLEMENTARY INFORMATIONRESEARCHdoi:10.1038/nature22033

39
KIYDQILPLYQQLHAYVRRIMHKTHGSKVDVKGKIPSCLLGDMWGRFWGNIFGQVVPYPDRPNIDVTD
TMVAKNFTPRIMFELADDFFASLGLLRVNPAFWSNSMIVKPKDGRQVVCHPSAWDLGNGEDFRVKMCT
EVTMDFFQTIHHELGHTQYQMQYSDLPFPFRDGANGAFHEAVGEVMTLSISTPAHLSHPDIGLLEPGS
GTDEETDINFLLKTALNTIGTLPFSLALDQWRWDVFAGDISEDKWTERWWQLKHDLVGTEAPVSRTED
DFDPGAMYHIVVAYPFLGYYMRTIIQFQFQKALCDAAGHTGPLHRCDFYKSQEAGTKFANMLKLGCSK
PWPDAMEAITGQRAISADAINAYFEPLMTWLTETNRKNGEQIGWKAPGNGAILPNVSLVVLVLCLLVT
SRLL
Peptidase_M2 (PF01401) partial; Peptidase_M2 (PF01401)
Arylsulfatase G-like; oki.47.7; gbr.81.161 MQIFIVFLMFLTQTLWSNSILPCEAETVRDEGGVYAEKGQGAKPNFIILFVDDLGWGDLGANWNEDGL
PSDTPFLDELAAKGTRFTDFHAGASLCTPSRAALLTGRLGKRTGVVGNFNVQSCAGMPLNETTMAETF
NAAGYRTGMIGKWHLGIYGGFGPVHRGFDSYLGIPYSDDMGCVDNPGYNLPPCPPCNHSTGYGTLYDL
FLKILAKGTFPCNKMAAVPLIENTTIIEQPVDLAAVAGHYKKHASSFIKQSAQDGKPFLLYVAFTHVH
VPLLFNAKFAGTSARGPFGDTVRELDDTVAGIMEAVSQAGVENDTMVWFTSDNGPWAAKCLYAGSSGP
FLGLWQKTKGGGGSTAKMTIWEAGHREPTFAYWPGHIPAGRVSDSLLSALDIYPTIASIAGIPMPKYR
GYDGMDVKDVLFGGSIYERTLFHPNSMASGALGDIGAVRQGRYKAVYQIGSARPNCLGETSPPRHRNP
PLIFDIYKDPAEEQPLNQSSAEYKSALQDIEASLQAFLEDVKQDNTTVADYRQDPRCIPCCNPNQVDC
RCSG
Sulfatase (PF00884); Sulfatase_C (PF14707)
Arylsulfatase I-like; oki.82.31; gbr.36.19 MMMTTFRLMFPLTILLIFSVIVTEHPVLAKTKNNIRYEEPKSKMQPHIIIILADDLGWNDVSFHGSYQ
IPTPHLDELAYSGVLLSNYYVLPICTPTRSALMTGRYPIHTGMWHSVIIAAEPWGLGMDEVILPQLMK
QQGYHTHMVGKWHLGFFDEEHIPSQRGFDSYFGYYLGKGDYWTHYDTEPLFLYFAHQAVHSGNDAQHA
LQAPMQYYDRFPNITDHKRRMFAAMTAVMDESVGNVTRALKQAGLYDNSVIIFSTDNGGPAHGFDFNH
ANNYPLRGTKHSLWEGGVRGTAFVHSNLLTKPGRISHDLLHVSDWLPTIYNLAGGDSSKLKNLDGFDI
WPTLSRGVKSPRSEVLLNIDTISGVSALRIGDMKIMYGDIEHGKWSGWYKPEGLPPHYVPPPPPAGAFA
VHCPPKPSNASTNCDPFKAACLYNITNDPCEFYNLADWNQDVVASMTQRLNEYKTTMAPARNKPSDPDA
NPDLHGGYWVPWVKND
Sulfatase (PF00884)
Beta-D-xylosidase 2-like; oki.182.61; gbr.167.8 MAAKSRLLGLLSFICLLLSQTFHQSSESSEFPFQNYSLSWDERLDDLISRLQLDEIVLQLARGGVGPNG
PSPPIPRLGIGPYNWNTVCLRGDFNAGNATSYPQPLGLAATFSRSITGGVAIATSEEVRAKYNNFTQH
GIYDDHCGLSCLSPVVNIMRHPLWGRNQETFGEDPFLASEMARAFVRGLQEPSYAPGTEARYLRTSAG
CKFFGVHNGPEDYPSSRYTFNAGFGFKGYVVSDRNALEYVLLKHGYTETPLQTAVAGVKAGCNLEQSDS
AENVYTNLTEAVQMGVVSEDELKQLVRPLFYSRMRLGEFDPPGMNSYSRFNASDMVQCLQYRNLALAGA
IKSFVVLKNENNTLPVGTIQKLAIVGPFANSPWDLFGSFAPQTDPRFISTPWDGLRGLGQFQRLAPGC
NNPTCDQYNKTSIMDAVVGADFVIVCLGTALGKTLVLLLFNAGPLDILWADQSPGVHAIVECFFPAQA
TGAALKKLFTNADPGMPAGRLPFTWPASLEQVPAMSNYNMTNRTYRYFTGEPLYPFGYGLAFTQFNYT
NLTLGQTTIDPCDDLMVHVTMINTGKYDGYEVVQVYIKWHNASVPTPKIQLAAFDRFKATINNTVTFF
LKMPARVRAVFTDELVLEPGMFTVFAGGQQPGQKRQNYSLPWDKRLDDLISRLQLDDIVLQLARGGSG
PNGPSPPIPRLGIGPYNWNTECLRGDVGAGNATSFPQALGLAASFSISLVNSVAKATSEEVRAKYNNL
TKHGIHRDHGGLSCFSPVVNIMRHPLWGRNQETYGEDPYLTGEMAKAFVRGLQGLQGNFSRYLRTSAG
CKHFDVHSGPENYPSSRYTFDAKVSEHDMYMTYLPAFHECVKAGTYSVMCSYNSINGVPSCVNHKFLT
DILRSQFGFKGYIVSDQKAIEYVFLKHKYTHSPLQTAVAAVKAGCNLELCYSAKNVYTNLTDAVQMGL
VSEDELKQLVRPLFYTRMRLGEFDPPWMNPYARFVASEMVESFPHRNLALLSASKTFVLLKNEKNTLP
VGGIHTLAIIGPFADSPQDLFGSYAPQTDPKFISTPWQGLRSLGRTQRLAPGCNNPVCDQYNETAIMD
AVTGADLVIVCLGTGTKVEREGLDRRTMSLPGHQLQLLQNAVKYALGKPLVLLLFNAGPLDILWADQS
PGVHAIVECFFPAQATGAALKQLFTNAEPANPAARLPFTWPASLDQVPPMTNYSMMNRTYRYFFGEPL
YPFGYGLSFTQFSYTNLTLGRTTISPCDDLLVYVTLVNIGKYPGDETVQVYIKWHNASVPTPNIQLAA
FNRFKTTVKNTVTALLRVPARVRAVFTDELVLEPGVFILFAGGQQPGQKRQVGSSVLNTTFTVEGPVT
PLSHCPQ
Glyco_hydro_3 (PF00933); Glyco_hydro_3_C (PF01915) x 2; Fn3-like (PF14310); Glyco_hydro_3 (PF00933); Glyco_hydro_3_C (PF01915); Fn3-like (PF14310)
WWW.NATURE.COM/NATURE | 39
SUPPLEMENTARY INFORMATIONRESEARCHdoi:10.1038/nature22033

40
Beta-D-xylosidase 2-like; oki.116.42; gbr.227.11 MMMFLSQPVAVVGLFVLLVGAVPPLIGTQGKNFPFWNDSLPWDERLDDLLSRLTLDDVTLQMARGGSGP
NGPAPPIPRLGIGPYDWDTECLRGDVEAGNATSFPQALGLAATFSTQLLYDVAQATGVEVRAKHNNFT
KHGIYKTHGGLSCFSPVINIMRHPLWGRNQETYGEDPFLTGEMARAFVTGLQGNDPRYVLANAGCKHF
DAYAGPENYPQSRFSFNAEVSDRDLFMTFLPQFHECVKAGSYSIMCSYNSINGVPACANTRFLRDILR
DQFGFEGYVVSDELAVEFIRLAHRYTNTSLETAVACVKAGLNLELSNFKNVVYLHIAEAVEKQLLSAD
EVFALVRPLFYTRMRLGEFDPPARNPYTKLTVDDVVESERHRSLAVDAAVQSFVLLRNDGVLPLKSIN
KLAVVGPFGNNSEQLFGDYAPNSLPEYITTPLQGLASIAQSTRFAAGCNRSLCTEYNQSSVLQAVSGA
DFVIVCLGSGTSIESEGLDRRNLALPGHQLQLLQDAVKYAGGKPVVLLLFTAGPFDISWAVNSPDVPV
IVQCFLPAQATGVAIRNMFTNEQGANPAGRLPYTWPASMDQVPPMTNYTMVDRTYRYFSGTPLYQFGY
GLSYTVFQYKQLVLKPDRIMPCDNVTLTVTLANVGKYSGDEVVQVYIKWANATVPVPKIQLAAFERVS
IATGKMTSVTLSIPARVRAAYTDRLVLQPGSFGVFVGGHQPGRSVGGHPSSNVMTGSFHVDGPETDLA
KCPK
Glyco_hydro_3 (PF00933); Glyco_hydro_3_C (PF01915); Fn3-like (PF14310)
Beta-D-xylosidase 2-like; oki.182.63; gbr.167.5 MLTAKSLCISLHCVLLLHIITSTAAELPFRNVSLSWDERLNDLIPRLYLDEIASQMTRAGYKENGPTLP
IPRLGIGPYNWVTECLRGDVESGNATSYAMPIGLAASFSVDLLTAVGTATSIEVRAKYNNYTSHGIYK
DFGGLSCFSPVINIVRHPLWGRIQETYGEDPFISGELAKAYVAGLHGDHPRYVRTSSGCKHIFAYDGP
EDIPSPRFSFNSVVNDADMQMTYLPMFHECVKAGTFNLVCSYNSINGIPACASKKYLTDIVRNQWGFK
GYVSSDDGALEYLHSAHNYTKGPLDSTVAAIQAGCNLELTGFKTPVYTHLTQAVQLGLISIEEMTTLV
RPLFYTRMRLGEFDPPDMNPYTKLNVDEVVESAEHQELAVSVAVRTFVLLKHIGNVLPVGKIATLAVV
GPMADSPYDPFGDYPPGTLREYITTTREGLKSIASIVKYAGGCSSPRCTDYDPKEIISAVTDVDFVVV
CLGTGTSIESESRDRPNMDLPGSQLQLLQDAVKYADGRPVVLLLFNAGPLNITWADESPDVHAIVECX
XXXXXXXXXXXXFMTNGPEGNPAARLPYTWPASMEDVPPMTNYSFYNRSYRYFTGTPLYPFGYGLSYT
EFTYNRITVSNPLLKPCDDLHISVTLTNVGHYAGDEVIQVYVGWPDAAYPVPKLQLGAFLRVSTTPQN
EITNYVTIPARVRAVYNETLVLQPGKFMLYAGGQQPGQKRRVSSNVLITGFTVVGPATKLSECPP
Glyco_hydro_3 (PF00933); Glyco_hydro_3_C (PF01915); Fn3-like (PF14310)
Beta-D-xylosidase 2-like; oki.5.153; gbr.137.1 MVDKTCFLSPVVLILLSLACPQLVWLTEFPFQNATLPWEERLNDLVSRLELEDIILQLARGGAGPNGPA
PPIPRLGIGPYNWNTECLHGDAEAGNASTWPQVIGVAASFAADLAKSVASATSEEVRAKYNNFTRHGI
RRDHCGLTCFSPVANIMRHPLWGRNQETFGEDPFMTGEMVSSYVNGLQGLDGPVARYLRTGAGCKDFA
VFSGPEDYPASKYTFNSGATERDLYMTYLPAFHECIKAGAYSVMCGYNKIDSVPACLNQRFLKDILRT
EFGFKGYVVSEKSALEYAFLKDNYTQTALETAVAAVKAGCNLEQSDTPHNIYTNLTAAVQMKLVTVDE
LRELVRPLFYTRLRLGEFDPPSMNPWGRFNASEVVESLQHQNFALEGALQTFVMLKNENNTLPVGGVP
IIAIVGPFADSPQEILGSFAPQTDPKFISTPWGGLGGLGKVRRLAPGCNNPVCDQYNQTAIMEAVTGA
DLVIVCLGTGTQIENVGLDRRNMSLPGHQLLLLQQAVKYALGKPLVLLLFSGGPLDIGWADSNPGVHT
ILQCFFPGQATGGALKNLFTNSQFPVAAGPSGKLPFTWPASMDQVPPITNYNMTGRTYRYFTGDPLYP
FGYGLSFTSIKYINVSVGNTTINPCDDLMVYVALVNTGTVYAYESVQVYIKWHNASVPAPNIQLAAFT
RLRTTMDNPVTVYLRMPARVRAVFTDQLVLEPGMFTVYGGGQQPNQKRQAPSNVVNTTFTVQGPVTPL
SKCP
Glyco_hydro_3 (PF00933); Glyco_hydro_3_C (PF01915); Fn3-like (PF14310)
Beta-glucuronidase-like; oki.29.106; gbr.19.105 MWTFKAAVLGSYFMLMTSAMITDNSVFLNSQLPQIRIPPKPMLYPRESETREIKELNGLWKFRADDSP
SRNEGFSAKWYGYAMSIDISLDMQEVSKAVNIETPFVLSCFVCLFFFLKQTGPVIDMPVPSSFNDVTQ
DRTLRDFVGWVWYDREFFAPIGWRNPDVRVVLRFASAHYNTVVFWFVXQWTVFTGTPSPVTNGVDGLT
VTIVPSYPPGYFVQNVQFDFFNYAGIHRWVHLYTTPRVHISDITVTTDLEGSTGIMNYTVLVGGLTSH
SPAATVELKDPSEGGRVVASSKSLSGVFTVSDVKPWWPYTMSNNSAFLYTLQVCVRNGATSDVYRLPV
GFRTVSVNNKKLFINNKPFYFHGVNKHEDNDVRGKGLDLPLTIKDINLMKWMGANSLRTSHYPYAEEF
LDLCDQHGIVVIDESPGVGIKLESNMGPVSLAHHLEVMMEMYQRDKNRPSVVMWSVANEPDSTLPTAP
HYFGTVINFTRSLDPTRLVTFVLGGTSVEREKVAQWCDVLCLNTYFSWYSDSGHLELVEMQSNTSLWD
WHLKFNKTIIQSEYGADTIPGLHMDPPQMFTEDYQCDMMAGYHATFDILRHNFLTGELIWNFADFMTV
QSVTRVVGNKKGVFTRHRQPKAAAHLLRRRYLSLAEESKV
Glyco_hydro_2_N (PF02837); Glyco_hydro_2 (PF00703); Glyco_hydro_2_C (PF02836)
WWW.NATURE.COM/NATURE | 40
SUPPLEMENTARY INFORMATIONRESEARCHdoi:10.1038/nature22033

41
Conserved uncharacterized protein; oki.116.41; gbr.227.10 MIGPVVLFLAAAVAAFPGAADAAPPDPSMSVVRMLQANEVRVDEVAWTGLSDGQSLYGGSPCSCQGKE
CGCCQSVKIPALGINSKACANVTFLSEQIGAKLSLSIDGKVIFDQTVSVKNPEPICKNFKGRFQICGE
LYKLSVSPEEFEACARLQAKAYGRVIATVDLGCFKIPLKEDELALVESTDTVDEWLDLSPSVSANGPC
SCSHDQCQCCQRIKIKAIKINNNICIKVQFLSSNIGVSLSLTIDGKTVFTKTLSLKNPPPICEPLGVG
KVCISLYDLSLTKDALSGCGRLQAKLLGKTVATVKLGCFKIPLHLALYGRSPEVEGILHMGDLAEALA
GPVMGGELTADNFPLTIALEPYLTADDGEN
DUF4773 (PF15998) x 2
C-type lectin domain family (C-type lectin 2); oki.8.451; gbr.442.11 MNALTASLVLTALVTAVFAGCGPSCPEGYLNWEHDCYKLYDEAKNWAAAEQRCVADGAHLTSVHSAEE
DDFLNQLSQQGTAGNKHTWIGLNDHQAEGSYVWTDGSPTDYLNWHKGEPNNHGKGEHCMEINFFELDG
TWNDHFCDREHRFICKMPPIYD
Lectin_C (PF00059)
C-type lectin domain family (C-type lectin 2); oki.8.452; gbr.442.12 MNALASSLVLTAVVSTVFASCGPFLCPPGYTKWQTNCYKLFDEVKNWAAAEQRCVADGAHLASVHSAA
ENNFVNQMALQGTAGGQETWIGLNDLQTENSFVWTDGSPIDYTNWELDEPNDFYPGEDCSHLNHVASN
GEWNDFYCDQEFRFICKK
Lectin_C (PF00059)
Sialate O-acetylesterase-like; oki.22.70 MRSASFLHACVHILILFTQSRGQRSAPLNSGVLRTHGARHNGHLLNLIRLKFIPQLQNEFKEAFSLFD
KDGDGTITTKELGTVMRSLGQNPTEAELQDMINEVDADGNGTIDFPEFLTMMARKMKDTDSEEEIREA
FRVFDKDGNGFISAAELRHVMTNLGEKLTDEEVDEMIREADIDGDGQVNYEETCKLASYYSNYMVLQQ
QPHNAVVWGYSDIMATIEVKVGDKMYKASIETQFPSRVGVWKVKLDPMPAGGPYDIVVFCEDWRAVNTV
VLKDVMFGDVWICSGQSNMAFTVDQSFNGSKELNESINYPDIRLLAVKQVLSETPYNDLHGLYEPWSK
PSPETLGSKAATFTYFSALCWFFGRDLYDTLQYPIGLISTNWGGTPIEAWSSPDVLKTCGTRNRSVSK
TNDRLTGPVKGPSMPSSLWNSMIHPLLNFTIKGAIWYQGESNTMDPDPYKCLFKTMINDWREKWHQGT
EGSTDLHFPFGFMQLCTSNSPSSEIIGPFPTLRWHQTYDYGYVPNDVMQNVFMGVGIDLPDVKSPYGP
IHPRDKQDMGTRLSLAGRAIAYGQNVSYAGPYPTSFTVNTTTLTLVIEYSGGKANIRLVGKTGFEVCC
GGSPPCTYYDTWVPAKITGQPTTSSISLSYYCYNRDATAVRYLWRDMPCAFKDCPVYSVENNLPGPPFI
LNL
EF-hand_7 (PF13499) x 2; SASA/DUF303 (PF03629)
Carboxypeptidase Q; oki.38.68; gbr.63.59 MLSYYVIILLELCTPTTLQEVLLISLPSVSRSKPLLRRPDYDLQKIKQEIASYKDVANEIMAYIVNGSA
KGQVYNRLALFTDMFGNRLVGTKNLENSIDFMLNELQKDGLQNVHGEEVVVPHWVRGNESAVMLEPRRY
NLIMLGLGSSVGTPPEGITAEAIVVSSFDELKKRASEVPGKIVVFNQPWVNYGVSVAYRDFAAVNTAKL
GGVASLVRSIAAFSIHSPHTGWQALSIVKQLGLRPKRTMRMVMWTGEEVGGVGSLQYYQRHKANASNY
DLVLESDMGTFTPYGIEIRGSNETLEIVKGIVELLGPVNATTFRKGEDGLDVSYWEKDGVPGGSLLNH
NEHYFWFHHSDGDTMSVQDPHQMDLCAAVWTVVSYIVADLDNMLPRK
Peptidase_M28 (PF04389)
Lysosomal protective protein; oki.231.4; gbr.449.3 MQVMKMNGSPALAVLVCVFCVTSGQPAADEITSLPGVSGSLSSRQYSGYLRASGTIKLHYWFVESERD
PENDPLVLWMNGGPGCSSLDGYLSELGPYQVNDDGMTLRANKYSWNQVANVIFLEAPAGVGFSYSDDK
NYTTNDDETAENNYLALLDFFKKFPNMANKPFFITGESYGGIYVPTLSVRVMANASINFKGFAIGNGL
LDTYLNTETAVYYAYYHGIIGEDIWAKLQKYCCTNGSCSFVTPPNKQCSLALMETQDFTMNKGLNPYD
VTGDCAGGVPSDSFKERTRQVLSYFFEPPHPKQPLKNKVSGSLDSNNIIPCINTTAENNYLNRPEVRK
ALHIPDVVPKWKVCSVLDYHRVYNSMRAQFNALLPKHRGLVYNGDADIMCNFLGDQKFVASLKRTERG
ERRPWIYNQQVAGFVKDYDQVTFMTVKAAGHMVPSFKPGASLQMITNFLSNQPQ
Peptidase_S10 (PF00450)
WWW.NATURE.COM/NATURE | 41
SUPPLEMENTARY INFORMATIONRESEARCHdoi:10.1038/nature22033

42
Cathepsin D-like; oki.21.76; gbr.162.41 MKLVLLAVLLCAAVVRCSRIPLYKMRRTRRILSENELTWKPSKYSASPNGTVRIVDYMDAQYYGPITI
GTPPQKFNVIFDTGSSNLWVPASNCSLLDVACDLHNKYDWSKSSTYQPNGTRFSIQYGTGSCSGILDI
DTVQVGGDKALKQTFGAADHEPGITFIVAKFDGILGMGYPQISVDDVQPFFDTLMAQKSLDKDVFSFY
LDRKEGAAVGGELILGSSDPKYYTGDFHYVDVSKQGYWQFAMDGVQVVKDDKPLLSLCSGGCQAICDT
GTSLLVGPKAEVEKIQMAIGAAPLFEGEYLVECSKIPTMPNVTFTLNGKVFVLTPQDYVLKESEAGET
LCLSGFLGMDIPKPIGPLWILGDVFIGKYYTEFDRVNNRVGFATAIKGVDIKVHN
Asp (PF00026)
Cathepsin L-like; oki.117.13; gbr.131.13 MLRVAVFCVLAVAALGMPYTFNTELDGDWELFKKVHSKQYRAFNEEAHRRSIWEDNVKIIAKHNLEYD
LGNHTYRLGMNSYGDMTSQEFKDVMNGYKTRANPPKATVTFREPQNVKYPDTVDWREKGYVTPVKNQG
QCGSCWAFSATGSLEGQNFAKTGILPSLSEQNLVDCSYVEGDDGCNGGLMDDAFTYVKENNGIDKETC
YKYKAKDETKCKYNQTTGCVKGFCTGFVDIEAGSETDLLAACATKGPISVAIDASHSSFQLYREGVYN
EPQCSSRELDHGVLVVGYGVNSGEDYWLVKNSWGTDWGVDGYIMMSRNKNNQCGIATSASYPLV
Inhibitor_I29 (PF08246); Peptidase_C1 (PF00112)
Cathepsin L-like; oki.7.160; gbr.29.79 MFASTRILQTAFVLFVVCLSLGFLRATSDEVGKAGCGLHWEEWKEAHEKKYDSLTEEVDKRQVWEKNI
VVVREHNSKTGRSFDLAMNKFGDQTHAEMISQMKYPVDPIQIPITPLLNGIAEPPSSVDWRTKGYVTP
VRNQGACGGSVAYAAADTVASREAIHEAKPARVLSAQEINDCCAITHRACLPPIVLDKVFDCIHSIGG
LCMADSYHKSKNFTCNNGTCSPFAKVPNGGVQVATGDEKALAAAVAIEPILVGLDANHTSFFMYRSGI
YSEPNCKTKEPNHAMVLVGYGSQNGQDYWICKNSWDGIPNYLKGESLRKLATDLGRDGWDLGLVLGFT
VGELQIFKIDNKDNKREETRSMLAEYIERTAKGDVLGGLLGGLRAIGRNNLCIKLEKAAEDEGDFK
Inhibitor_I29 (PF08246); Peptidase_C1 (PF00112); Death (PF00531)
Cholinesterase-like; oki.186.13; gbr.181.14 MNLCVFTCLLALAGAAMAGPLIQTRNGRIEGVTETFKEDKYLKVDKEIDIYRGIPYAEPPVGHRRFQP
PVPVNSWSGTLNAARHGPACIQYFISFSGMDEDCLFLDVYRPHTVSKTAAVMVFIHGGAFFFGYGSMP
EYLGQPISAVGDVIYVAINYRLGPFGFLSTGDSAAPGNVGLLDQVLALKWVKDNIQRFGGDPDNITIF
GESAGGASVSFHLVSKHSRGLFKRAIMQSGTSTSFFAYQRSLDYAKNQAKEVGLKAGCPTGTTAEMIS
CLQALPARELRSVAYKVGLAYLPVVDGSFLHDKPENILAAGDFQKLDILIGTMQDEGSLVALVENLFS
FFASKAPPMSHDEFLKTYPGWIYNYGDVANNTAMKQAIETRYVSDSQAADPASDYLDNFIRIMTDYIW
IVPTEVTAQAHLREGNKVYMYQMTHTPTVSIFHIFFLGPKWVGAIHADDLPFVFGNAWIPKVFYKSTK
PLPEERMMSNTIMKYWTNFAKTGSPNDGVVPDWPEYNLDKKQYKDISVYFPTKSGGIRQDYVSFWTND
IPKLVTRSDVISDPTRGIEAFFEVFNLVEQCKAQFDENGLYIRQEKSDS
COesterase (PF00135) Complement C1q and tumor necrosis factor-related protein 9; oki.86.54; gbr.2181.1 MQLRFAISLSIALLLSLNLRAALTGPVPAMGNAWAKGENGEMRTLRNNCTKGNNKMDLPAKVGPRGQIG
LVEATWEGGDKEHKDKPGKTPVDSAHQVAFTMYMLSSSHTSINENTRLPFSSSITYVGVTRFNFGTGT
FFCDVPGVYVFTFSAATYFYNPLIIHLRKNFDFVISARNNDKMQEEQVSGSAVVVLEKDDFVYLSYLG
VVYSASFRRYTTFSGFLLYPK
C1q (PF00386)
Complement C1q tumor necrosis factor-related protein 2; oki.86.53; gbr.410.13 MQLRFAISLSIALLLSLNLRAALTGPVPAMGNEGSKGENGEMRTLRNNCTKGNNKMDLPAKVGPRGQIC
LVQAIEEAGVKGQKDKRGKTPDDSANQVAFTVYRVSESRQSSNQDTRLPFHLSKTLLPGTSFDFRTGT
FTCNKPGTYVFTFSAARSRSFTLILHLRKNGSILASARNSDKSQEEQVSGSAVVVLEWRDTVYLSFFG
KVFGMFGRAYTTFSGFLLYPK
C1q (PF00386)
Deleted in malignant brain tumors 1 protein-like; oki.96.79, oki.83.49; gbr.504.1, gbr.645.4 MKTLTLFLLILPVVFGHGGIPEPDVTVRLAGSNHYNEGRVEVYYQGQWGTVCDDEWDISDADVVCRQL
GFARATRAVSEAGFGEGTGQILLDDVACSGRESRLELCANRGWGVENCDHSEDAGVVCHGSITVRLVG
GENDNEGRVEVYYQGQWGTVCDDEWDISDANVVCRQLGFAGAARAVSEAEFGEGTGQILLDDVACTGD
WWW.NATURE.COM/NATURE | 42
SUPPLEMENTARY INFORMATIONRESEARCHdoi:10.1038/nature22033

43
ESRLEDCPNSGWGVENCFHYEDAGVVCLSFDVNNVRLVGPDPNVGRVEVYHNGVWGTVCDDDWDIDDA
SVVCRQLGFTNGAARAASDAQFGEGAGPIFLDDVACAGTESRLAHCPNPGWEVENCGHSEDAGVVCLP
DEEPGVTVRLAGSNHYNEGRVEVYYQGEWGTVCDDEWDISDANVVCRQLGFAGATQAVSEARFGEGTG
RILLDDVACTGRESRLEVCINRGWGEENCDHSEDAGVVCHSGTYM
SRCR (PF00530) x 4
Deleted in malignant brain tumors 1 protein-like; oki.96.82; gbr.645.1 MKTLAVFLLIFPMVFGYGFLPDEGDVRLVGRDPNTGRVEVYHNGVWGTVCDDGWDFDDASVVCRQLGF
TNGAARAATGANFGAGEGPIFLDDVACAGTESRLVDCPNPGWEVENCGHSEDAGVVCLPDEEPDVTVR
LAGSDNHSEGRVEVYYPGEWGTVCDDEWDISDADVVCRQLGFSSATEAVPGARFGEGIGQILLDDVAC
TGDESRLEDCPNRGWGVENCGHGEDAGVVCLNSEPVSLRLVGGENDNEGRVEVFYQGEWGTVCDDDWD
LNDANVVCKQLGFASAEEAVPEARFGQGTGEILLDDVACTGDESRLEDCPNSGWGVENCWHGEDAGVV
CLCADVSNIRLIGPDPGTGRVEVYHNGVWGTVCDDYWDIDDANVVCRQLGFTQGAVRAASFAEFGEGE
GPIFLDNVACAGTESRLVDCPNPGWEVENCGHSEDAGVVCLFNEVADSEGAVRLAQGPNGPHEGRVEI
YHDSQWGTVCDDTWYTDYNAQVVCRQLGYAGVEEVKRLAFFQEGEGPIWMDDVYCEGDEAGLADCPFA
GWGVNDCGHYEDVGVVCLTDFSEGDVRLYGPDPNVGRVEVYHNGVWGTVCDDDWDFDDASVVCRQLGF
TNGAARAATDANFGAGAGPIFLDDVACAGTESRLVDCPNPGWEVENCDHDEDAGVVCLPDEEPDVTVR
LAGSNHYNEGRVEVYYQGEWGTVCDDEWDISDANVVCRQLGFERATRAVSEAGFGEGTGRILLDDVAC
SGRESKLELCANRGWGEENCDHSEDAGVVCHGSVTVRLVGGENDNEGRVEVYYQGEWGTVCDDEWDIS
DANVVCRQLGFAGAARAVSEAGFGQGTGQILLDDVACTGDEFRLEDCPNRGWGVENCFHHEDAGVVCL
SFGMYMKKMVVLGACHFIKWHAADSYENCNRSMECNVDDKNLPRYGLGKGFFHVERIVSLFVLVEGNSL
PSKNFAYVLTS
SRCR (PF00530) x 8
di-N-acetylchitobiase-like; oki.86.66; gbr.245.15 MATSFRVVLVFAVVCQGWCLDVFSRSNGDCPCEDPALCNVIKTPPRKELFAFWVGGTHWKEYDWSKLTT
VVMFGSHYEADLMCYAHSKGVRVTLLGEFPAANLTSVADRSAWVMQQVDRAIQGHMDGINFDIEYPLD
ASKAKYLTALVDETTKAFHLSIPGSQVTFDVAWSPNCIDGRCYDYKGIADSCDFLFVMSYDEQSQIFG
PCIAMANSPYNKTAGGVESYLKLGIPADQLVLGVPWYGYNYNCTSLSTKTNVCHIPHVPFRGVNCSDA
AGKQVSYQGIIQLLMQNSTSGRLYNTTYQAPYFNYVDATTGDHHQVWYDNPQSLTTRYKYAQKMKLRG
VGMWNADTLDYRDNPTSKKLTKEMWDAIGKFFLP
Glyco_hydro_18 (PF00704)
Dipeptidyl peptidase 1-like; oki.165.35; gbr.627.4 MMATVKVFLAVVAFLPVVLADTPANCTYDDIVGRWVFKVSAGGGDNTLRCSDPGPVDHTVIVDLKFPD
VAVDATYGHTGFWTLIYNQGFEVVLNKKKYFAFSKYVKEGKKYKSICDETLPGWSHNVVGTDWACYVG
TKNQTKNRPPPEKPVDASKQLYKIDRDLINKINAAQSSWKAGVYPEYEKMTVEEMVRRRGGRASIMAS
KPSPAPVTEAVRNLAKTLPLSFDWRNVNGQNFVSPVRNQGGCGSCYAFGSMAMYEARLRIATNNTKQL
VMSPQDVVSCSEYSQGCEGGFPYLIAGKYAEDFGLVEESCTPYVGEDTPCKKNTCKRYYATDYKYVGG
FYGGCNEELMRIQLVKDGPIAVSFEVYPDFQAYKGGIYHHVGLTDRPGYRFNPFEITNHVVLVVGYGA
DPKTGEKFWVVKNSWGKYWGEQGYFRIRRGTDECAIESIAVETFPIYP
CathepsinC_exc (PF08773); Peptidase_C1 (PF00112)
Disintegrin and metalloproteinase domain-containing protein; oki.137.42; gbr.350.29 MMLPASLFLCLSAMAFAGPPVPSHRFSKDELQRYFGVDSDEKAPEYEIVYPEYATDDMKRSVGRSAIA
ALSLDVYVDAFGETLHMTVERDDSGIKPGLEVEYYTDEGIITEPVQTDCIYTGKVVGEADSLVSATTC
EGLMAIAYHTSGPTYIEPLDDEHAYKRDIGRGLPHVAYKNKPKNGASCPVRSLRCTEGDIKPSSTKYL
ELAFVGDAVLYYRRGNTTQTSLTTLFNAPGYRISWDLYRYLPSAAEWLDDNKYPSSDDRHWDNAVVLS
GMHFNYGILGLAYVGACDSKEAVSVSSFLSFDEATDTAAHEIGHNLGMCHDSEGNSCPPSGYVMAAYE
NEEKIKPIWSSCSRRYYNSFVEKMTCYNDS
Pep_M12B_propep (PF01562); Reprolysin (PF01421)
Dopamine beta-hydroxylase-like; oki.27.87; gbr.41.45 MLAASLFLLYAVTGGFYYPVCSEPHSAFPYSILLVAEGQDSDQAATLFWAVDFEKETVDFRLSVPLIY
GGTLRENGEWFAFGMSPDGTLSNADLVVFEFPQGELKLTEAYTDDTGEVHEDGNDHDYVLLGWRVSPG
VGGNDESPAHLEVEFRRKFDTCDRHDYLIDSGTVNLFYLRGSHSSISSGYIDPREAEIAFQRAQLLKS
WWW.NATURE.COM/NATURE | 43
SUPPLEMENTARY INFORMATIONRESEARCHdoi:10.1038/nature22033

44
TRRTPPLPPNVKTADIVMHNTAIPNQATTYWCRVQKFPDIEEDHHIIQYEAVVTPGNEGIVHHMEVFH
CILPAGVKVPDYNGECEGEDLPAELASCRRVIGAWAMGAKAFFYPEEVGVPIGGSSVSSYVVLQVHYN
NPRLREGVLDSSGIRFHYTSSLRPYDAGVLDSSGIRFHYTSSLRPYDAGILEIGATYSPNLSIPPESN
GFYFTGYCSPDCTDKGIPDRGIRVFASQLHTHLSGTAIWTKHIRNGVEMKELNRDDHYNAMFQEIRFL
QKDVTVLPGDALITTCRYDTSARQNVTLGGFGIQDEMCVNYMHYYPSINLEVCKSTIASTALAAFFKT
VDSRTGDSPHDVNLTSPSAVANCFLHMTWTPSVKLLWQYVINEAPLDIECLKSSGQPFTGKWKDQPPPS
VKIPLPRKKRKCPHKKIHPFQRKLGSSPTT
DOMON (PF03351); Cu2_monooxygen (PF01082); Cu2_monoox_C (PF03712)
Endothelin-converting enzyme 1-like; oki.52.105; gbr.39.67 MILSVICVLCQAVVSLGLPVQDATLVSPGPICLDPECVIDSGVILSALDQTADPCQDFYRYACGGWMD
KAQIPPWDSSISKSFGGLYHANLKTVKTILEADSPMYSALQKARDYYAACMDLQGMEKAGAQPLLKLI
EVIGGWSLLPSLKLEFTTNNPQFLTTLIAVQKITGSPLFDMGVTIDDKNSSRHIIEFVQSGLWLGARE
LYLGGHDDLLAAYVKFGVTLASLLAWDKGLSIAGDFLVQTERKMKEILAFEIELAKISVSMAELRNPW
KTYHKMTLSEFAQLVPDVDVQSYVNGVFGREIPMDEEVLVPTLSYFPKMNELTKRTPQRTIHDYVVWN
LVASLSGSLSQAYREAVLEFTSAFTGTMTVAPRWMTCAGSANQVLGFATGAEFVRKRHSLEIKDKIKA
IVENVRKTFIDRLPSVDWMDNTTKSLAVQKAQAIQEKLVAPSWLEDTNRIDDYYSKLMVNSKSFFNNI
LSAGKFYSEKNLAKYGEPVDRMEWDMVPAEVNAYYTSSMNEIVFPAGILQFPFYSSALPSSINYGSIG
WVIGHELTHGFDDRGRNYDDVGNLHNWWKNASAQAYKERAQCVLEQYSSFKIGDKHVNGLLTLGENIA
DNGGLRLALQAYHSYRELKGGKETRLPGLQDMTPEQIFFIGAGQTWCKLDTPQHAVLKLLSDPHSPGK
YRVIGTFSNTEEFSEAFKCPKGSVMNPEKKCHIW
Peptidase_M13_N (PF05649); Peptidase_M13 (PF01431)
Ependymin-related; oki.140.50; gbr.184.58 MSLARVSTLVLALVLVGTVSAVSQTPCCYPKQFVARLEIIDTVLGNGTVVVFEKKTEMAYDEINEKTAE
ITEVYNDVTGVVEKTKLIYDYKKGKKYIIEGGHCTTKHLSYSFLPQCIPPIATFDETVPIGLGDAFPV
SSFHFLIPSSSPSFNLLVRYSVGAEGCIPYQLGIFAVQKTTRGSSRGLPVMDPVPPSHPMFPWYASPT
AGPYRKLSSAYQYSDYQNGIEDPAYWFDPPSGCFPGLRGSKSTIGGPLEKVATMNKILRNRVL
Ependymin (PF00811)
Ependymin-related; oki.66.102; gbr.184.59 MVSYLSTTLLLACLAAVGADEPTPCCPPKQFTIRIDEETTDLVDGVVTTLEQQVHKAYDATNKLLTDIL
FQYDSVTGATVQSKTIYLFPQGAKYVIRNGKCTKETLHYQFLELCVPAVAKYGHSYTFGLGEYSANLF
YLEIPHQGYNQVYDFVYGADKCIPYQYAVSRKAAGTTSSASSAGFNGTLTLPVPFNQSRLAVGAEVPL
SIRAQYFDYVEGISDPAYWFKLPAECKQLEQQPSEKQKAAAKMMTKKLMAKLNSDKKFVMY
Ependymin (PF00811)
Ependymin-related; oki.227.19; gbr.213.18 MNRCSVVRLVALLAATVLVADADNYCCTAPQFVIRADQLQGLQLPSGQGIAQLNVLDMALDFTNERAGE
EIDSYSMGRLTKIKVIIDKKKNVMYTIIGQNCTKTEARGEFLQCIPKTAHFDGSSYLGDNELTLDAFS
FPLDEPKVVRGNVTVSVTHGNCIYAGTWLVGEATQTEPPIPLVSSTSFVNFKRGIADPSRWFDVPSFC
QQEKSTRARRSVRPVSDDHKDVMKLVSIFNTMMLPDVGHAKVLKPQKPSSKQ
Ependymin (PF00811)
Ependymin-related; oki.227.20; gbr.213.19 MNPCSVVRLVALLAATVLVADADNYCCTAPQFVIRADQLQGIKLPSGQGLAQLNLVDIAFDFTNERLGE
EIDSYSLGRLTKIKVIIDKKKNVMYTIIGQNCTKTEARGEFMQCIPKTAHFDGSSYLGDNELTLDTFS
FPVDEPKVVSGNVSMSVTHGNCIFAGTLLVGEATQTEPPIPLVSSTSFVNFKRGIADPSRWFDVPSFC
QQKKSTRARRSVRSVSDDHKDVMKLVSIFNTMMLPDVEPAKVLKPQKP
Ependymin (PF00811)
WWW.NATURE.COM/NATURE | 44
SUPPLEMENTARY INFORMATIONRESEARCHdoi:10.1038/nature22033

45
Ependymin-related; oki.11.62; gbr.218.31 MQTEACVCSPLYQAMLAMACRVVLAVVCLLLVVEIWAEEPQPCCWINQMTGKFELQQTEELEGGTVVL
ETTNAEFAYDKTFSCKAFIFTETFANGTQRVDRLVEFYNRIEKAVYQGNVTLGDDALSGNTWELNFAQ
GGYVANRTYLLAADYCVPITVNFVLMNFNTDPPEANAGTIAYADIELGICDRDKFFHIPDECPQDIMT
PFLEKISKRRQLLEMQYEAFM
Ependymin (PF00811)
Ependymin-related; oki.11.63a; 218.32a MSFSSLACLLMVVIAGAQANVAQGLPFRGVYNPFSHHADEPQPCSIPRYFTYLQEDFVTTVEEGRLKVE
EESWEGAYDTIAQKYSAKKEERFFNGTDDYSKIIFDEGKGVEYIIEKRGEETVCLVLDIEGQKFPDTY
TFPKNAKFVGEATLGDRDLVVNVWYYPSEDNTKHTVKTYTREECVPIGLRHRKFDPQTGVEIELRESS
LYDIKLGICDEEKYFKVPDECKEGRALKEPTLTMMKIRNHFN
Ependymin (PF00811)
Ependymin-related; oki.11.65; gbr.218.33 MLSSFIVCVLVVSAGAMAVKKPVLNAQTVFGISPREGEDERKPCATPKYFTFDQADFMTTLEEGRLTVE
YVNFHGAYDEVLKRYSVETFLDFFNGTLLHLKGKGYLVQRLGDEIECEVYDLEGKKFPEEFSFPEDAT
FLADSTLGDRDLTVESWYYVSEDGTKHNVKTVTKDECVPVSLFSRKFDPETGEELEVVNGQVINFKLG
ICDPESYFKIPEECKEVGVSKELSKNMKKMHRFGLM
Ependymin (PF00811)
Ependymin-related; oki.11.66a; gbr.218.34 MKDHGLLCVSTIVIQIIDLGNLVLRACRSESWSVALGLKTARHTHHNPYQGPPIAAMYAAVILCILVVA
ASASPEKFIFGNKLDQPAPEKCCAEPYYTFQADSVFNTLQEGSLLTELIRARGAYDSIDKKFGLKVDLH
ISNGTVELYQLINDFKEGLGYYIYTEEEETKCVEFPITSGFPYNCIPEGSTYVGSVTIGDRALRAANW
YFNDKTDPTKDMHIVFSIKEEECIDLGYLARTFDPETGTEISVDRTGISDYNLGICDPDTYFKPPEEC
KSAKVKRVNSVPKRIGGLRGPRGQRLFQ
Ependymin (PF00811)
Ependymin-related; oki.11.66b; gbr.218.35 MWSGLLVCMLVVGAMAFQPSVPFGASQPGERHEPCCAPRYFTFNQVTTTTSVQDGSLLVEYDNAEGAYD
AKFERIAVKLVIDYFNGTEVYLRLIEDYIKGVSYYILEHAGEDICFVGRTEGRFNEECLNDDAQFLSE
ATLGDYDLVLDNWYVVSEDKTEHSVKSVQHEGCVPVGLLTRTFDPDTGKELKVDDSRVLDFKLGICDP
DKYFKPPASCDEGRAVDKPTPQMLKYRRKGLFRRSISE
Ependymin (PF00811)
Ependymin-related; oki.141.70; gbr.60.100c MGLKSVAFVLFVVVAASYAKSLANVKPCCYPDKYEISSGTQAGLSRNGRGTGYSIQSVSAVDATAMKIG
EKGIFFEEDGTAHEFRNIKDYAKKEEYRIDPKGEQCEVEPLEEDMPLCVPENATFSDSSYLGNDSLIV
DSYIYFYNYPGYVVGHQSVGVAKEGCIPTSYTFSGSLGKGRRRTDILTITGFYNYKDGISDEASFFDV
PGYCETSVNKNAELWELLRYKQVPIHF
Ependymin (PF00811)
Ependymin-related; oki.141.71; gbr.60.101 MGLKSVAFVLLVVVAASYAKSLANIKPCCYPDKYEISSGTQAGLSKNGRGTGYSIQSVSAVDATAMKIG
EKGTFFAEDGMAYEFRNIKDYAKEEEYRIDPKRETCEVVELKDEMPRCVPDNATYSDSSYLGNDSLTV
DSYIYFYHYPGVVVGQQSVGVAKEGCIPTSYTFSGSLGKGRRRTDILTVTGFYNYVDGISDEASFFDV
PEYCEESVNKNAELWELLRYKQVPIHF
Ependymin (PF00811)
Ependymin-related; oki.141.72; gbr.60.102a MDIKLAALLLLVGLATSYAQPAEGPCCFPDQFVVGVDSEAFLGQGYPWQLEEEQSRESASKIQPEGVVL
GSETAVGGRGGTKRLAIVGQSAVDVNKNMIGNEFTLFQSDEERPSRQRLIYDYEQGFQYIIDTDELKC
SKTKLQGDIPRCVPPGVDFNTTVYLGDRQLFIDSYHYQIQQLFKNGRSSVSVTKEGCIPNSASFSGTT
FRTSILSFAGYFNYEAGIADPDRFFEVPEYCPTVRL
Ependymin (PF00811)
WWW.NATURE.COM/NATURE | 45
SUPPLEMENTARY INFORMATIONRESEARCHdoi:10.1038/nature22033

46
Ependymin-related; oki.141.73; gbr.60.102b MDIKSAVLLLLVGLAVSYAQPAEGPCCFPDQFEVGYGSETAVGGRGGTKRLALVGQAAIDVTKNMIGNE
FMLFQSDEERPSRQRLVQDYEQGFQYIIDTDELKCSKTKLQGDIPHCVPPGVDFNTTVYLGDRQLFID
SYHYQIQQLFKNGRSSVSVTKEGCIPNSASFSGTTFRTSILSLTGYFNYEAGIADPDRFFEVPEYCPT
YIEKEPKLLELLKYSQVLF
Ependymin (PF00811)
Ependymin-related; oki.141.74; gbr.60.103 MEVKSVFLLLLVVVATSLAQKKCCFPKEFEALDGQVVGTISAGKPVAVLESIQFAFDYFNQRAGEFAFI
QDGAEVYMYQIIVDYKAQTEYIIQAHTQTCQKIPLPAGTNMSHCVPDDATYESSFYVGDNKMTADSFT
YSLKQGVVAGNVILSVSKGDCIPYSVTFFGQHQGTPVLQVTGFVNYTSGIQDPARYFTVPEYCMEQSF
SQAPKMYNSFIHLFV
Ependymin (PF00811)
Ependymin-related; oki.141.75; gbr.60.104 MSILSVVFLCQAFLAISYAQKKCCYPDQFVSIEGIEIGLSQSGKGSATVGKIQVAFDYTNKRVAELGIM
TTDQKSEELQGIADYSKGVQYFIQPKARECIKVPLAGPMPHCVPDNATSVGSIYLGNHKLTVDVYNLP
VDEGIVSLSVTHGSFLAVTGFFNYTAGIKDPSKFFTVPDYCPKSFLEVPVFQKLPSYKMFF
Ependymin (PF00811)
Epididymis-specific alpha-mannosidase-like; oki.12.113; gbr.3.77 MAIHPLLMLIAAVTAVCTAAPTSMTPPMESATPTSMLVTLHTYYAIDSELNELRRTQKTAYDNYKMDRF
HDEDIYISSTMVNIAGMPDLSGLTNADRFAMNESDLLQLHGSNLQIFRNLMFFVEADEALSNSPINFGN
NFSTIRVRLNRVVAMLEAVMEQRDFFQTGFPTPPAVYLQPNGNELERNTRDLFVLQEMHSYLHVAHYDL
YTWPVVHASLARAQSPTGGSNGDDATPTMIQAFIIPHSHMDVGWIYTVQESMEAYAADVYTTVVANLV
KDSKRRFIAVEQEFFRLWWTTVASDTQKVEYFRTVMNQGCFIQTHDYLHSSRKVTLFACFFFLPEGHS
FIYETFGKRPRFSWHVDPFGASSATPTLFALMGFDAHLTSRIDYDIKEQMQKNKGLQFMWRASPSLGE
SQQIFTHVMDQYSYCTPGRLPFSLKTGFYWNGYAVFPKPPPGVSYPDMSLPVTNENIKKYAAVLVNNI
KQRAAWFRTQQLLWPWGCDKQFFNATIQFENMDKLVAYINQNAKSLGVQVQYATLGEYFQAVHQTNLS
WALKQEGDYLSYSSAANAAWTGFYTSRSALKGIARRAQSTLHAGETLFSIYLHQPKLNRTVNTTEVLN
SLQGLRWASAEVQHHDGITGTDSVKVKGMFEDHLETAENKTLASMKKVFQDLIKNPGRDEEEPDILTS
VGPGRILDVNRDKPLAPILVYNSLGWSVKRLVQTSITDPNVTVIDIHGRDIGSQVNPPLEPGGPYHLF
FYAQLAPLNLDVYYIKYKTHPSDTTAHQGKLESLGAVALDITPSKDTKPMQGADVKSISNDCFEVTYD
TTTNMLMAITDKKNGKTIPMEQVFMEYYSHYNAMFGQTSNLYVFRPWGAGPHTAGESAKLDIVTGPYV
NETRQSIFNMYDPKNSRFVVTLRIFDLPHSHNDDIVCGHIELDFKVGPLMPNKELVYRFSTKLDSSRV
LYTNDNGFQTMKRTWRPNKPEPEAQNYYPLVSTAYIESPKDDIRLTVMAERSHGVGSLNNGQMEVMLL
RRLITNSGYDDKNNLTLEEPEVAMPTLWLLLGNRTHSSELQRRAWLHLENPPIIMAVNQNPEVLQKKL
KGKSPNPLPTVLTDLPLNVHLLTMKIPGWTYKTSHKEHLRSLQARLRQGSYDRSEEDPNLDRILLRLQ
HLYEKGEHPVLSKPATIDLAKFLSPLGTIASISERSLTAIWQADQVKRWTWKVKDDPSASQQFNNSGA
ATPRARNTTIFTLNPQEIKTFFITLQKTEA
Glyco_hydro_38 (PF01074); Alpha-mann_mid (PF09261); Glyco_hydro_38C (PF07748)
Fibrillin-1 –like; oki.2.22; gbr.73.44 MLKSLVLTVWIVWIVLLNTIPESVDGDVTLEMLLTTYTGNDRDFDNNCCDFCGFFNGDSCDISFDISIN
NMGGTPIYVLSTGLIQNDAESVTFGSVVGTSPNPIQMTFSSWPWRVKMVLDVYDDDSINVIGGQPELVD
TYETTITHVPEANSSIAVTHYYSETGTRANNPTTLTFELKVYCNSNYYGTDCATYCQATDGNSGHYTC
HPLTGDKICLDGYEDPTTNCLTETDECLSSPCLNNATCTDQINRFTCVCSDGFEGTLCETNTDECASN
ACQNDAICLDEINGYTCVCPDGFEDQINRFTCVCSDGFEGTLCETNTDECTSNPCPNDATCLDEINGY
TCVCPDGFEGTQCETNTYECASNPCQNDAICLDEINGYTCVCPEGFEDTTPDIRSTTQEQVETLQTTS
QSATFDFTTDNAEISASLGGHTYLTRLQFSTDEPSNGVTTVVHPLRTEQELATTVPVFRPTTRKHTTSL
ETTVQPSTTVANVVGTESATLLEDQTQSTISSSAAFTTHRTTDASRSATEPVISPTTASEACGSQPCQ
NGGVCSDVFEGYECSCPLGFVGADCELIDLCIPSPCYNGAKCSMNSHQNFTCTCARGYNGALCADDID
ECEEEGDCPDRSECVNSIGSYTCVCIQGFKGQECSERDFCADGPCLNNATCVSVVEKFSCECKGGYTG
TRCETIIESPCQPSPCLNGGECMFGQGDGQPQCLCGQQFLGENCEIDTDIFSCKMYVEGASVDTETFK
TDTANLIKSTMADNAGSYSTVEVVLVSTADYESAETGEPVTLVTYLVLVNGTALTPAEVTDLMEGTSDD
VMDDIVSYKPFKGNVSARSEMVRAKKQKQKVHSVDECDASKEVMSVQAEVYLASHLDGNVEQSTV
DSL (PF01414); EGF (PF00008) x 5; EGF_CA (PF07645); EGF (PF00008)
WWW.NATURE.COM/NATURE | 46
SUPPLEMENTARY INFORMATIONRESEARCHdoi:10.1038/nature22033

47
Ficolin-2-like; oki.73.19; gbr.259.26 MMKFCMLLLLACCVVGIRAENGNKHQSTEPSNPEAVQSAVTSEVLKLIEVAIKVAQYTDSAEKQKAVGW
VQERLSNIKDLLDSTNKQPTEPETVYYEDCSALLSEGFSESGLYDIYPAYPESTDPMQVYCDQETDGG
GWIVFQRRVDGSESFERTWDEYRQGFGNLEGEFWLGNDNLVLLTVPGQVSGGSGGNVELRVDIRDWAD
NTAFAKYLDFSVQGSEFTLTADNFAEESTAGDALDYHNGMDFTTIDHDNDRASGGNCANWMRGGFWFN
YCLTADPNGPYLPEEGEHGALSPGTDQGVTWTTYTGHGYPGREYSLKGTEMKLRRAPVILS
Fibrinogen_C (PF00147) Gamma-interferon-inducible lysosomal thiol reductase; oki.287.11; gbr.460.4 MMGYRSTVAVLLVVFATQSARGMSCTFPPELWCSSSEIAESCHVVKQCSEWQSPVKDAPKVNFTLYYE
SYCPDCQLFISGQLHDAYMAVSEIMNLTMVPYGNAEEKREGSKYVFQCQHGQEECRGNVLETCILHFA
PFQTAFQTIYCMEVSRDPVTYARECMEKMKVNPEQVFACANGSLGNALEHQMALKTDALKPPHQYVPW
VTLNGVHTEKIQNEAEMNLKKLICDTYQGAKKPPACSQDKPKLRSRMRE
SapA (PF02199); GILT (PF03227)
Glutathione peroxidase-like; oki.208.14; gbr.467.2 MATAASAAMPFSALLVVLWTVAALSTAATGPLESVCVREGSASVHLFSLGSLNDTSPPVPLSRYAGKVL
LLYHQLNALAERYEGMLEILALPCNQFGLQEPGENDEILNGVKYVRPGGGFEPAFPVFAKIDVNGKKE
HELYTHLKSVCPPVKLEIGDKSKLYWSDIKIGDITWNFEKFLVGGDGQAYKRYDPSIHPKGIEADIEG
LILRERLRSEEERRDFEAFLHEKVY
GSHPx (PF00255)
Heme-binding protein 2-like; oki.355.13; gbr.476.10 MAISQGSLVLLLALTGFIVCTGFSINKHDKGESGPPFFCHELECPKFKEDYNSSDYQIRRYETSKWVS
TTITGIDYQAASEEAFLRLYEYIQGQNDQKVKIPMTVPVINSVQPGLGPVCASNFTFSFFVPFEFQSN
TPKPTNPELFLTTLDQHKAYVRVYSGFTNEKVFPKEAAALAAALNSTQTYDKSYYYLAGYDSPFVVHN
RHNEIWFIATEK
SOUL (PF04832)
KDEL motif-containing protein 1-like; oki.156.24; gbr.130.23 MSRISRTFVVTLLCCVLACCAVKDVVTGYDRERVVCPLKSRVWGPGLEANFNVPARFFFIQAVDFENN
SFTYSPGPNAFQVSVRPTSGRGRVWTQVLDRNDGSFIVRFRLYESYPGMRIEVKSGDRHVQGSPFLIS
DPVYDEKCYCPEQIQSQWQADMRCRSEMHPQIEEDLSIFPAIDLDRLATETVNRFARHHSLCHYSIINN
RVQLPDVEFFINLGDWPLEKRGADHSPLPILSWCGSDESRDIVLPTYDITESTLETLGRVTLDMLSVQ
ANTGPKWVNKTNKAFWRGRDSRRERLNLVKLSREQPELIDAALTNFFFFRNEEAEYGPKVKHISFFDF
FKYKFQINIDGTVAAYRLPYLLSGDSTVLKHDSVFYEHFYKQLEPWVHYIPFKKDLSDLVDKIKWAQT
HDEEAKTIAQNAQQFAREHLMSNNIFCYYFQLLQEYAKRQTGPPVVREGMELVEQPQDGTPCQCSRLS
PIVVKATTMDHWMRNKWIEKVLSKFDRNAVTPISDDQEPLACQVLNIKVLDKVVGSIGGVAEVHDCELY
IKALFSVDAIRRFEEREESTSCAEFVELRNSLLDLTRYHIMVDVQQQIEKSDIAICVEDFAMTVYKALP
GTWRTPLQPAIHHPTVAHDLRRMWRAKYAPDEPDTCQSQDQSQDSPDKCTLSVLLEAMENTSQQASELS
EAEQDQPIEGPTGTLKSPEESEETCASRVAFELGSAGCDESGQGTVEALEKAVKEVETKLIVAKNFPEL
AERIPEYLRDAQGFSVEDLPQDEELDLSRSELLECWISEEALEKLCGIEEWKPDYIPPSSLPVVSSSSS
EVISFLTEPSADNQAEKMPKDRLEDPSQDGVTQCGSKRKLSSWQIGESPHKAAKNSVSGQGGVVCAGDV
DCEAGADLGESSEMVLDIDDPDREVVTEPSDKQTDAEAASKEGRADRRISCNCESSPEEEGLTALCQCL
TPLEEALGETENQVNQQDESLVSNTDSTDTSLVVSCEMPSQSVNSDPDKDQEDLVIFHKLLNVSSEAES
LLGVNDMPVTVDSSMSPAQTGRNETLQCSGERPVTTSCTSDTNSKDAAEHVEPSNTIDEPEAAGQMADT
SAEVLLVDAEILNVEHVSNSSGQRDVDTSPLPAALKQRANSTPSKTVSEQVTDDPAKPQQVPDKCKEAS
NTGPSCLPSTTRTVQTNWSVNVIPLKKTVSSTASQKATSESRDERPGHRPITQLRSPVILPSISTPVHS
LTSHQPRRTQQSETASSLNTNEEALKSASSREAPPGGARSLMLHSVAF
Filamin (PF00630); Glyco_transf_90 (PF05686)
Laccase-like; oki.97.25; gbr.140.46 MTGFVTAVVFLTVVSVVTALRPADDHPCYRQCDFTTPMICTYNWTVNWYYALSNQICSGDEVVVSVTN
NLQNNEGVTIHWHGIFQNGSQFMDGLPMVTQCPIPSPGNFEYRFTPYEPGTHWFHSHTGLQRSDGLMG
PFIIRESRRTDPHGDLYDLDVAENVIFLNDWHHDTSVSEFAKSQWGGGSRVDSILINGKGIAPGISPP
HPPLEVFNVEQGKRYRFRVINGASSFCNMQFSVQNHTLLVIASDGGPFQPQAVEYFRINGGERMDFVL
NTNQTVDNYQIQVIGLPCGNTVPSKQIAYLRYDGANDPPAINELPNITTYGNSSTWWQAFPGKSFAQV
WWW.NATURE.COM/NATURE | 47
SUPPLEMENTARY INFORMATIONRESEARCHdoi:10.1038/nature22033

48
DSADADYRSTEGAEDRQEYIQVGFGSRRDPTTNQLMTYPQLNDITYYFPTSPVLSQFGDLPENIFCNQS
DFPQGECAGEKLCSCVHTINVGEKERIEVILVNSDDFGVLHPMHLHGQQFEVVAMERMEGVTIPLVRE
LLANGSILRNNNGPRKDVIIVPDMGYTIFQFQGWNPGWWIFHCHIEFHLEVN
Cu-oxidase_3 (PF07732); Cu-oxidase (PF00394); Cu-oxidase_2 (PF07731)
Lysosomal alpha-glucosidase-like; oki.157.9, gbr.498.9 MQSLRATGCHRAIFGIAFISYLLSGVTLTSGMQCSGIASSYRFDCHPEEDATQQECQRRGCCWLASKN
LDEGVPYCFYPSDFPTYQMGSPQPTAFGYTVMLKRTTKGYYPNDVMQLQMDLYFETSYRLHFKIYDPK
SKRYQVPVPTPKVSKRVPSTDYKVQFSRSPMGLIVTRRVDGTAIFNSTLSPLIFADQFLQLSTSLVTP
YIYGLGEHRGRFRVASDWETYPMWSRDQPPHVGDNLYGVHPFHLGLEGSSGNSHGVFLLNSNAMEVVL
QPAPALTYRTIGGILDFYIFMGPRSDQVVQQYTEVIGRPFMPPYWGLGFHLCRWGYGSSNRTLEIVKQ
MRAASIPQDTQWNDIEYAVGRKDFTVNNGSFAGLPELIGYLHSVGMHYIPITDPGISSTQPAGTYPPY
DTGIAQDVFIKDSNGKPIVGRVWPGSTVFPDFFNNKTKSWWLDQIRDFHSKVPFDGLWIDMNEPSNFV
NGSVNGCPQNSWNNPPYTPAIVGGKLSAMTLCPSATQAIGKHYDLHSLYGYSEAIATHEALVEIRHKR
SFVISRSTYPGSGKYTGHWLGDNYSLWPDMAYSIAGILSFNLFGIPLVGADICGFNLNTTEELCQRWM
QLGAFYPFSRNHNTLGAMDQDPTSFSQDMQTSTRKALQLRYSLLPYIYTLFHFAHTQGSTVARPLFFE
FLGDPQLYDVDKQFMLGSAIIVTPVLEKGATSVTGIFPKGVWLGVYYEFSINLFDMDYKNLGTHFQVD
STQPVTLPAPLNEINVHVREGRIVPLQLPSGGNPTTTTQYRQLAFTLLITRSDRSPGTGQLFWDDGDS
LDTYESGNYLLVEFASDATMMNSTVVHDGYSGSQPVTVETIILGAVPRPVSQVTINGTAVPFHYLPDVQ
NVYVDKLKVPMQFNFYVKWKYQTQE
Trefoil (PF00088); NtCtMGAM_N (PF16863); Gal_mutarotas_2 (PF13802); Glyco_hydro_31 (PF01055)
Lysozyme; oki.43.110; gbr.99.40 MMRLAVLPVFGFVVLMIAEPCMLTSVNASAGPVPYNCMHCICIVESNCKMPNPVCHMDVGSLSCGPYQ
IKKAYWNDARLKGGSLMGDWKKCTATFTCSEDAVQGYMERYAIYSRLGHNPTCEDFARIHNGGPNGFK
NPATIPYWDKVKNCLERK
Destabilase (PF05497)
Melanotransferrin; oki.3.93, gbr.11.89 MAQAAIFLTTVLLVLCLHHATSQVTEMRWCTTSSHEEEKCLAMKNAFASNNLKTLNCVAGESAMHCMR
LISTNQADLITLDGGDVYVAGKEFNMIPIMQEVYAGNDMGYYAIAVVKKNNTGFGLRDLQGKKSCHTG
VRKTAGWNVPVGYLLEAGYMIPTDCQDDIRSTGAFFSESCAPGALSSEYNPDGNNPESLCALCQTTTP
IKCPRNSNEPFYNYGGAFRCMAVGGGDVAFIKPVTITENTDGNNQADWAVSLRSQDFQLLCKDNTRAE
VGQHESCNLAFVPSHAVMASKNFDSAVLQDFRAVLGQAQELFGPDTNTNGFSMFDSSLYGASNLLFKD
STQMLADVTKEYDAFLGADYLATLKGLDKCPDGTLRWCAISAQEKSKCRAMKAAFSGAGITPNISCYE
SYSADACAVDIAGDEADLVSLDGGELYEHGREGRVAPILAEDYGTGDPTARYWGVAVVKRSSSFTIND
LKGKKSCHTGYMRSAGWVVPIGFLINRGDIVSSHACDIPKAVGEFFSQSCVPGVLEPSNNPFNTNPDN
LCALCKGQGENKCKPNHNEPYVGYDGAFRCLVEDSGDVAFVKHSTVPSNVNGDQSWNSGVRKEDYQLL
CPDGTRKNIDDYRDCNLAKLPSHAVVTAVGKTTSQRDAMKTVLKSGQDQFRFDNSPQGMFKMFDSAGY
GANARDLLFKDVTLYLNDTPTTYDQFLSQEYRDALDVLYCNPSSRPSAAAGLLPSLLVMMLAWVMHRL
ARG
Transferrin (PF00405) x 2
N-acetylglucosamine-6-sulfatase-like; oki.277.11; gbr.290.3 MDHLWRICLVMSLVITVYGNGKRPNIVFILTDDQDVTMNGMTPLVNTVSLIGKQGITFNNMFVSSPLC
CPSRSSIFTGNYVHNHKTLNNSISGGCSNKNWQSGPERSTFATYLKGMGYSTFFAGKYLNQYGTKLAG
GVSHIPPGWDEWNGLVKNSKYYNYTLSVNGKAEQHGDDYHHDYLTDLINNRSHEFLEKQSESTPPFFV
MVSTPACHAPFDSAPQYVQNFTKNAAPRGPSFNKAGKDKHWLIRHAPNPMAKSSVTILDDVFRKRYSR
QFSLPMDKRQLYEFDIRVPLLVRGPKIKAGTVTDHIAVNIDIMPTIVHLAGDPAPQNVDGISLVPILI
PNITESDEDKRDCLTKNKEENTVEDCPNTDPHTSFQEYYDLNKDPHQLTNTIKSVKPPDLAAMHKLLVL
LQLCKGDNCRQLIPPHTRH
Sulfatase (PF00884)
WWW.NATURE.COM/NATURE | 48
SUPPLEMENTARY INFORMATIONRESEARCHdoi:10.1038/nature22033

49
Nucleobindin-2-like; oki.21.120; gbr.122.8 MERWRSLVLLLALLAVCRAAPVLPEKTDTDDEGDIEDSEHTGLEYDRYLRKVVKTLENDPVMKKKLDDL
SLDDLKTGKMMEILDGVSDKMRARLDDLKRSEIQRLRQVARQRFQQANHRPMDQKQIEDMTGHLDINNM
DQFGGKDFEKLIKKATEDLDKADKERKEEFKRYEMQKEIERRQKLKEMDEAKRKEAEQEHEERRKKLKE
KHMKHPGSKPQLEDVWEETDHLEREDFNPRTFFNLHDTNGDGTLDAFELEALFVKQVEKMYAERHNSD
PREKFEEISRMREHVMNEIDKNKDKMVSRKEFMEATEAEDFDEDKGWDDLEEQDIYTEDELETYEKNI
QEEMKKLKLRLQQEHDQYKENRVPQPGDPVVMNQAKAAISNPQQLADQVIQAAADHEAEKFHQASQQMK
KLVDEVANQVKANAQGGQKQQDNTQHQQQQQQ
EF-hand_7 (PF13499)
Otoancorin-like; oki.67.66; gbr.101.44, 65.74 MMQLFQLSLLVVFLAGLKYLEIRALERDDQWRSPAATRGHEWHEAFDPKEHDTDVLDDSRLHEVAKAYG
DFFVPDGSGRTDLNMSAVMYQAEKQQREAMAGGGLGRPAFIKQPILPNTVLKRISPDIIRNMTASEVFQ
LQKVTEMSYESLAHLLSNLQPQEFDKLIALARNATNFETKIPDPTIAKAVIDSCHRQWGPVSEWTTKQV
SKIGPMLTSLNIEQVKQLNEEVLIEVIRTFARVGFRGPATRTLVLKAKRSWGAIRTWNPDQFATLGPLL
IYLTPRDLKHIQPAQNVTSLLPLLGSLELERGQARAIISIAASSPDWRWTLEQVQSLGKMRQYLDPMEL
KAAPASAFASPELLEEMLPSNRRGHHRQTKEIARVLKESKGDVSAWGTEDFRSMGRAASGLGVSDLEQL
DPSVVQGAIEDIADADYSPRQRKVLLRKYQRARGVQNTAMSAAEVRQMKGLAADLSTSDLAHMDPEDIR
ESVDVFAKNAKRMKKTQKREIIKQLKEAPGGIKDAIRDMGDMVKELPLKDLDNLCTANFTTMADQNSTS
VAAAGLMNWTDGQSMKLFRCFKDEVLGSGEAEGADLPALPTPTTIRYLGSIARGMTCSDINGFVADDIL
PTVGSMMEQEGWSPRQLDCTHRKVRSSLSEAHSDYTADFTETEIASLTGQLLKEFSVVELDTIPSSHCE
MLYSEISEEDLMGLKREKRKVLTSRALQCLGVDGELDTLEQDTMDVIGNLACDLDADALRRLSSSTFTD
NLYSLQKCCLDVDQLVVVGERLVQELGSPNQWLSDTISDIGPLLVSLSELEIQSLEEDQFSLVAEDVMV
RFAEYKDKWRRHCDIDLQPQDISSREEGFVSVAIKAKDALVAVSQADGSRRKRRESTYSPTCDEIESLG
DGNIAWTVDELGAMSADTFDSCGYALGEVTGFTDAQLAALLNKAKEAWGQAADMTPDQISQLGHIASK
FTPAEISQLNLTETDTVYAIAQYHIYTTDQLGAGVARFLELSGVSVASLDSLDLTALGNFLCGLTVVE
MASIPSSAYQEAASTIGDLRSCDAGQWASLKAKAVEEYGAIDTWMPEVFAEVGSLVAGFTAEELSSLS
DVSIAGIKPHAVSLIGPQTLAAGWSSSQLSKLDQLQAEAVTEEQLAALSEERRSALLDAEYGDDVSLA
EMDEVTEEENDGTQGKSAGYQSTGLVPTIIAMCNVISTAMQ
Mesothelin (PF06060)
Ovoperoxidase; oki.26.138; gbr.13.85 MVIFSSFTLLPGQGQDTSQRLLLLALLVSLGSCTLLDKDVGMLEDLEDLLLKDENMKGYSNQKNGRTPF
GLWNQFNSARRSPMNRKKLQTYLKMLEERDPTFTRVTERLTAHVTXIAKPEQGAAETLLIRVVDNAYD
DGLSKPRTKSVAGGPLPNARNASRAVFDNRETTLSDLTTLAMHFGQLTDHDLTAVHTPSDVNCSDCSV
DGECFSILINNADPVFGGVQACFPFVRSNFETDSSGVRQHINSITGYLDASFVYGSDDASALDLIDSN
GFLLHDTDGVTGRQLLPPDVDLDLCAGVNETEGIYCGKAGDGRAPEQPGLTALHTLFLREHNRVADAL
LSLDSTLSPFNVYQTARKIVGAEWQHIVYNEFLPLIVGADLYASEGLSPDSTYAYNPAVDASSANVFA
AAAFRFGHTLVPFDITRVNRNYRPRFDEIKLTEAFFNATYIYDESIPDGAVDSILRGMTVQNSQKVDQ
HFSDAITDNLFGDPNKEGDGFDLTALNIQRARDHGLPGYTTIRKDFCELGEINSFRDLFDDGVMTRQN
FRNLRDTYADVRDIDAFVGFVLEKPLPNALVGPTLACIFADQFRRLKFGDRFFYQSLGQFTPAQIQEI
EKASMARLLCDNVEAVDEIQPYIFMKARNFGNLERRQQGKRGPYTSFYEYSRSGAWPHKRETVLEGLD
NRRVSCTATSGEIPVVDLSKFV
An_peroxidase (PF03098)
Palmitoyl protein thiosterase 1-like; oki.142.20; gbr.18.23 MDMELQNLAFFLVVLSPALATTPLVMWHGMGDSCCNPLSLGRIQTLVEKEVPGIYVRSLEIGNNIIED
TLNGFLMNANKQVEMACQKIRSDPKLAKGYNSMGFSQGGQFLRTVAQRCPTPPMFNLISVGGQHQGVF
GFPRCPGNYSSICEYIRKLLNFGAYLPIVQAEYWHDPLNEEEYRQKSIYLADINQERKVNETYKTNLQ
KLKKFVMVMFGNDTMVQPKESEWFGFYEPGQDKEVYTLKESPLYTEDKLGLKEMDEQGKLVFLTSYTD
HLQFTESWFVQNLIPYIK
Palm_thioest (PF02089)
PC3-like endoprotease variant B-like; oki.102.30; gbr.67.22 MGLRALSPLLLVIATLLGGTATTDNFGEEREFHNEWAVEVPGGEEVAREVAEEFGFTFGRRIGALENM
YSLQKDNHERRSRRQAVDVTSLLVEDARVAWVEQQETHFHEKRDAAAVSHNQTGDDYVPPFNDPRFPD
QWYLHNDGQNDATPGVDMNLAPVWKLGIMGQGSVVAVVDDGVDGTHPDLQANYDPLASWDFNGNDSDP
WWW.NATURE.COM/NATURE | 49
SUPPLEMENTARY INFORMATIONRESEARCHdoi:10.1038/nature22033

50
HPDDRAEVGGKNNHGTRCAGEIAAAANNGICGVGAAPKAGIGGIRFLDGRVTDMMEAEALTFNNQHVD
IYSCCWGPSDNGKTMREPGKLMTEALAQGCREGRGGKGSIYVWASGNGGHNDDDCGADAYVGNIHTIS
VGSINDKGESVYFMESCPSTMGVILSGGLNDRSSLGEMKKRQNLVITTDIHDACIDNFIGTSSAAPLA
AGLLALVLQANPNLTWRDIQHIVVNGAHIPNTVESGWHVNGAGFHVNEKFGFGMLDAGKMVELALTWS
NVGKQKICEVPTFKIDKSVLQGTSYLTHLQVDCPHMTKLEHTLVRISFKAPRRGDVSLKVWSPFGTPS
ELLSRRRHDNSTDEVVRFPFMSVRNWGENPTGTWGFELMYHFTPPDVQPKPKWPDIPRQHDSMVELMD
VQLILYGTADGEDEGTSNSDDANPEVNTEFTGRLDSDEVVDIFNDEQTDDEEIVVDLDDLAAGVRPPPN
TAHNLDKNREGVIDTGQFDKVLQDPEVRSLIHDIYVHKKAEALRRLAAKRLHQDKRYHDQRQRSQDLDR
AHDEEESRREALEHVLELLHDGGL
S8_pro-domain (PF16470); Peptidase_S8 (PF00082); P_proprotein (PF01483)
Conserved uncharacterized protein; oki.1.62; gbr.2.191 MRALVAAVLVLGLVGFQMTNAWNEDGLDFLERFLKEEVAETKKSACSTNLPIVGKITWQSSTLGAYSS
NKAVDGSSSSNLYPSQHCSHTITNAKNPWWMVDLGSNHCITQVRILNRGDCCSKRLEGAVVRIGPSVT
ATENWACGSPVTAAQAAPLGGTIEFTCQPALKGRYVSVDIPGSATLQLCEVTLEEIPQGQCPDSQPFD
IVGKPAEQSTTYDKRFTANKAVDGSSSSIISHCSHTGERLQNAIVRAGTSETATANQACGAPITANQAQ
PLGGTINIKCDRPLRARYVSVDIPGTATLQLCEVSVEVLSSPDC
F5_F8_type_C (PF00754)
Peptidase inhibitor 15/16-like; oki.208.17; gbr.334.16 MLRFGDVFFLLGLYLFWGAGVNARVDADGTYTAVSLTPEEKDVFLNAHNELRSNVDPEAANMMFMNWD
KSLALMAQAWSAKCIWDHGQPTPNISPFTSLGQNMYLITGYGNRPSGRAVSTFWYNENRHYTFETDAC
SGVTCDHYTQLVWAKSRSLGCGMAFCKSVSNTKWRDVWIVTCNYGPRCPRFSPLRPAYRSSIRTTASA
PPIPERTL
CAP (PF00188)
Peptidyl-prolyl cis-trans isomerase FKBP2; oki.19.124, gbr.72.126 MVPCKSIVSAIVLVILVISCTFFTDVEAGDKPKKLQIGVKKKVENCEQRSKSGDTLHMHYTGTLQDGTE
FDSSIPRGSPFVFTLGAGQVIKGWDQGLLNMCVGEKRKLVIPSDLGYGDRGSPPKIPGGATLIFEVELM
KIDRKKEL
FKBP_C (PF00254)
Phospholipase A2-like; oki.8.262; gbr.558.2 MNFLVVIVTTVSLAGAASAGEIQNLYQFGKMVMCLGNLNVLEGLEYNGYGCYCGRGGKGTPLDDTDRC
CKQHDECYERATDEMGCWSIETYATTYDYTKSKVSGKCTIKCSSEEGKVHKRKLISPDDNTISRRVRP
ECQNDVPIWTLSLPTELESDYSRFTIRKKCKAFICECDRIGAQCFADKRSTFNRSLISYTKDKC
Phospholip_A2_1 (PF00068)
Phospholipase A2-like; oki.8.264; gbr.558.1 MKTFLILAMAVALAKAQSTDEITNLVQFGKLVMCLGNIGYTEGLEYNGYGCFCGKGGKGTPVDATDRC
CEVHDNCYGQAVKEGKCWSIETYGTTYWYDKSTSSGSCSIRCWEENEYNRFVPSKACKAAICECDRKA
AQCFADNRPTFNRKYLSYAKDTC
Phospholip_A2_1 (PF00068)
Phospholipase A2-like; oki.8.261, gbr.558.4 MKTFLILTMAVALAIQFGNLVMCLGNIGYTEGLEYDGYGCFCGKGGKGTPVDATDRCCEVHDNCYGQA
VEEGKCWSVETYGTTYWYDQSTSGSCSIRCWEEGDYNSLVPRKACKAAICECDRKAAQCFADNRPTFN
RKYLNYAKDTC
Phospholip_A2_1 (PF00068)
Plancitoxin-1; oki.27.35a; gbr.147.30 MPCCVMTFTFLVLTAIMVGTSEAAVTCKGANGYPVDWFIVYKLPQDSSSSVQVIKDGYGQMYMDVNNP
VLTLSSASLKDTNHAIAYTLEEIYRNQGNDDLAYVMYNDQPPPSKEIQTGLNGHTKGVLAFDDDTGFW
LVHSVPKFAPPASKEYKWPDNARRNGQTLLCITFNYNQFEKIGQQLKYNHPLVYNYDLPPDLAKDNPS
IKDVINGVHVTVAPWNRALTLQSKDGQTFVSFNKAGKFSADLYKDWLAPYFKSGLYCETWQNGRARKL
NSSCVGGIDVYNVREVSLRGGSDFKGTKDHSKWAVTTKPGLKWTCIGGINRVNLSPHQAEQTLAVPGS
WWW.NATURE.COM/NATURE | 50
SUPPLEMENTARY INFORMATIONRESEARCHdoi:10.1038/nature22033

51
LLSNSWSGLYDVLIYREFGCTLMIAVPHFPYPAPALALYSLVRTAKALIYSGYIPFPSRLRNVACPRWT
AMEVILGRKIFQRHLRVKVIFGEMKKNRFIVYKLPQDSASSIPEIRDGYGQMYMDVNNPVLTLSSASL
KDTNHAIAYTLEEIYRNHGTGNLAQVMYNDQPPPGKEIQSGLYGHTKGVLAFDDDTGFWLVHSVPKFP
LPSSKSYNWPDNARRNGQTLLCVTYNYNQFEKIGQQLKYNYPWVYDNTIPPDLVGQTPSIVDLVNNIH
VTSPPWNRRLNLQSKNGQTFVSFNKAGKWGKDLYAGWIALDFNSGLYVETWQNGGRNLNSSCIGGLNV
YNVKQVNLSGGSNFKGTKDHSKWAVATKSGLIWTCFGGINRQNLSPHQAEQTLAVPGSLLSNSWSGSA
E
DNase_II (PF03265) x 2
Plancitoxin-1; oki.27.35b; gbr.147.31 MSTMVVILMLLAVTVLTAMMGTSQQLKYNYPGVYDSDLPSKLVGKTPSIVDLVKNVHVTSPPWNRQLN
LQSKSGQTFVSFNKASKWGEDLYKNWLATHFKSGLYCETWQNGGRNLNSSCEAGLNVYNVKKVSLSGG
SDFKGTKDHSKWAVTTKSGLKWTCIGEPFTASSRADPSSPREFVEQIMEWILWYSASSKPVIREGYGQ
MYMDVNNQALKFSSTSLKDDDHAIAYTVDDIYKNHGKGNLAHVMYNDQPPAGEEIQSGLVGHTKGVLA
FDGTSGFWLVHSVPKFPLPASRSYDWPDNAKRNGQTLLCITFKYDQFEKIGQQLKYNYPGVYDSDFPS
RLVGQTPSIVDLVNNIHVTSPPWRQLNLQSRSGQSFDSFNKASKWGADLYKDWLATHFKSGLYCETWQ
NGERNLNSSCEGGLNVYNVMKVSLSGGSDFKGTKDHSKWAVTTKPGQKWTCIGGINRQNLAPHQTEQT
LAVLGVQLMECEYLLSTHTDLGNRSANFTTLDFERLEVSGVKTTRFVVYKLPQDSASSVQEIKDGYAH
MYMDVNNPVLTLSSASLKDTNHAIAYTLEEIYRNQGSDNFAYLMYNDQPPAGKEIQSGLVGHSKGVVA
FDDYTGFWLVHSVPKFPIPGSKGYTWPDNARRNGQTLLCVTYPYNQFEKIGQQLKYNYPGVYDSQLPS
SLAGDNPSIKDVINGVHVTVAPWNRELSLQSKDGKIFVSFNKASKWGLDLYKDWLATRFKSGLYCETW
QNGGRNLNSSCEAGLNVYNVKKVSLKGGSDFKGTKDHSKWAVTTKSGLQWACFGGINRQTSQMYRGGG
AVCFEHPDVHKTFYDCVAEYEPCT
DNase_II (PF03265) x 3
Tachylectin-like; oki.66.97; gbr.732.1 MFVNTRQYFPLSLVWAVCILCEVLRPNRVSACPQATTSWTQLSGALKHVSVGNSGVWGVNTHNWIYYK
GTSYGEEESPTCRAWEKVSGSLTQLDVGHNIVWGVNVHNNIYYRQGITASNPKGRDWVQVSGALKHVS
VSQRGHVWGVNRQDYIYHRIGASNCNPAGDSWRKLDGRLKQISVGSGGVWGVNSGNNIYYRVGTYGDL
PSDPDGSDWKQIQGSLKYISSADMIYGVNSNDNIYYRVGVSEGTPWGTRWEQIPGALKQIESLSCVVW
GVNRSDNIYKKKTDN
Hyd_WA (PF06462) x 4
Deleted in malignant brain tumors 1 protein-like; oki.42.51; gbr.22.25 MIASMHNFVGRSARPWWSWLLHCWASFCVIWASAQYHEDSSSRSDISRPPNNLPCKDYTGRKYYHGET
YHIDKCTSCTCNNATVKCLFESCPVPTCRRPISFPGECCRLCPYNITVNKVRPVIPRSQSIQEGRAEN
NLTVNLDVLYANTNDTTSVTGQGLWQTAMWISSMEDGSVKLPGTYVGNVLTEGQESLDLRKRGSISTNF
YINDIIYPVDMSNLTCDEARYLCAKFNRGENPQVAKSFLAFHFEARPSEDVLTGCSPIEDCKGCCTDQL
ESGESTPLSEPNGVPLFQIGTRVVRGPDWKWGDQDGFPPGKGTIVDELESDGWIAVLWDAGERHFYRM
GAEGKYDLKLIEDSRVRLVDGVDELSGHVEINHDGTWGTVCDVRWDMRDANVVCRQLGSFLKAVEIKK
GSFYGESDRPIVLSRVKCKGTETRLADCPFVSTINHPCASLQVAGVVCRPKLYSLRLVGGSDRLRGHV
EIYLGGIWGTLGDNDWDIDDARVVCRQLGFSGASQAMSGAHQGDGPVHMDGLACDGSEERLADCPSYS
RKKPARVRAADAWVVCRGD
VWC (PF00093); MIB_HERC2 (PF06701); SRCR (PF00530) x 2
Deleted in malignant brain tumors 1 protein-like; gbr.504.3 MKILAVFLLIFQAVFGNEVIPEPDVTLRLVGSENDKEGRVEVYYQGEWGTVCDDQWDINDANVVCKQL
GFVNATEAVLGARFGEGTGRILLDDVDCTGDESRLEDCPNRGVVPDEGDVRLIGPEPNLGRVEVNHNG
IWGTVCDDEWDIDDANVVCRQLGFTNGAARAASEAEFGQGENPIFLVDVACGGTESRLVDCSNPGWIV
EKCGHSEDAGVVCLPNEEPDVTLRLVGSDNDKEGRVEVYYQGEWGTVCDDQWDINDANVVCKQLGFVN
ATEAVLGARFGEGTGRILLDDVDCTGDESRLEDCGSRGWGVENCWHNEDAGVVCHSSEIEEDVRLVGP
EPNSGRVEVKYNNVWGTVCDDNWDIEDANVVCRQLGYTNGAARALSGAQFGRGEDPILLDEVACVGTE
NRLVDCSNAGWGTTDCSHSEDAGVVCLPSEEPDVTVRLAGSENDKEGRVEVYYQGEWGTVCDDEWDVT
DANVVCKQLGFAGAIQAVSGARFGQGSGQILLDDVGCTGNETRLEDCANRGWGVQYCGHDEDAGVICY
GYETEGNIRLVGPETNLGRVEVNHNGIWGTVCDDNWDIEDANVVCRQLGFTNGASRAATRALFGQGTD
PIYLDEVQCNGTESRLVDCSNAGWGTTDCSHSEDAGVVCLPSEGPNVTVRLAGSENYNEGRVEVYYRG
WWW.NATURE.COM/NATURE | 51
SUPPLEMENTARY INFORMATIONRESEARCHdoi:10.1038/nature22033

52
EWGTVCDDEWDTSDANITCKQLGFESAIEAVSRARFGQGLGPVLLDDLGCTGDESRLEDCPNRGWGVE
NCEHYEDAGVICSSGSFSQ
SRCR (PF00530) x 7
Serine carboxypeptidase CPVL-like; oki.52.56, gbr.411.2 MSSVVLTTIVVALMLAVMPGALHAVRGPFQAMFAANPPAHADMTGVDPGQPLFLTPYIERGQIQEGQRL
SLVGDLNGTSVKSYSGFLTVNKDYNSNMFFWFFPAQHERITTRDKRAPVMSDTILLHANLSHIERHQL
RTVPVSGTRENYITPHNLGSFYKAAGLAEILWRQ
Peptidase_S10 (PF00450)
calcineurin-like phosphoesterase domain-containing protein 1-like; oki.62.127, oki.62.127a, oki.62.128; gbr.6.127, gbr.6.127b MASALFAIFSLILLSGVSAKEPRPCCWISQMTGQAELQGTKKLEDGTVILEESELQWAYDATFQAEAFI
FDEILENSTVIKGRIVNFYDQGLSFYIIDNQGVERCAKIRIPARFPKKCIPEHAEYYGNRTLGNDSLVA
HEWKLNTVAGGDVLNVSFLIQDEYCVPISFGVVSQEHEGTWRGPFTFIASADPQYGLTAGWNNPGLLD
WTQEVELTQRGIERINKMKPRPRFLVVLGDMLDAMPGRPGRDDQKVSFTEVFSKVDPEIPLVFLPGNH
DLSDSPSMEDIKLYRDTFGDDFYSFWVGGVRFIVLNSQFYADSSKCQEARDEQDTWLNEQLEDVQATG
CKHLVVFQHIPWFLKNPEEENEYFNLDVNLRLPMLEKLRKAGVRIIFCGHYHRNAGGFYKDMEEVVTS
AWGLQLGEDKSGLRVVKVTEDSISHQYFSVDDIPLERQAPDPASSDESRWMIPTEDPCQCTEVQLGGLN
ILPSLQPFRVKYWNTLLRSRDSEEIQTWMKCEVCRDPLGMENSDIPDNALSASDVGHTGYGIRRSRLN
FKAAWCPRSIDENQWIRIDLQAPTTVAGLITQGRHHSDVWVTSYAVQYSDDGINWNNVTGSDGTTAQF
QANTDNETPVTNIFPASLTTRFIQIRPLAWARYICLRLELLGCRSV
Metallophos (PF00149); F5_F8_type_C (PF00754)
Protein SpAN-like; oki.27.95, gbr.41.55 MRLILLAMLLGCALAASTNRVRRNKFEKGNRLRPTPKATLDRDGEDFNRPRVKRKSQFEKGNRPTPTPT
MPLDLVDGEDNRSGRDRRAPPATWPNNKVCYEFASGFNDDNMKKNLRNAMNEFERVSCMKFIEAGTSD
ASCTSQSSPLLTVQNTAEGCWAHVGCHSSTNTVNVPTKCDLYDEIGVLIHELFHALGRYHEHTRPDRD
HFVTVQWDNVLDGQAHNFEKHTSDDFITFGIPYDYESIMHYGRSFFAKDKSQPTLTLIDTKYNDKVGK
QKQLSPSDVLYVNKLYECYEGEPEPCKNGGERMASSDCYCIFPFMGTDCGDVDPGVTVTENDGSGPIS
LVSLNYPDHYPLNTVTQNLLMCTDTSKKVQIVVEDFDVEGYGCYYDKFRYTLKAGDVNPETKCEDDLK
GSTVKADGNSIFITLVSDDMYTFKGYKMEFTCV
Astacin (PF01400); CUB (PF00431)
Aqualysin-1-like; gbr.117.1 MHTLVLLLLVGVAAAGLAPLYEVEENVKGHYLIKFKDEVDSDMTAEGIQRHVQQQRLGEAIISHRYYN
VLKGVAAKLSEEAVQYVRTLDDVEYVSQDGMAYAAAIPWGLDRIGQRRLPLDGRFTPDPVYNEGQGVE
IWIVDTGIRPTHSDFGNRASIVFDAYGGNVITVGATNSRDERCRFSNYGNCVDIFAPGRAIVSAGWKT
DTSITTMSGTSTACAHVAGIVALYLAQNRTLSPAEIKSKLKTSATTHLLSNVGQGSPNRLAYIDP
Inhibitor_I9 (PF05922); Peptidase_S8 (PF00082)
>Subtilisin-like protease; oki.571.1, oki.406.1; gbr.685.5MHTLVLLLLVGVAAAGLAPLYEVEENVKGHYLIKFKDEVDSDMTAEGIQRHVQQQRLGEAIISHRYYN
VLKGVAAKLSEEAVQYVRTLDDVEYVSQDGMAYAAAIPWGLDRIGQRRLPLXWTLHT
Inhibitor_I9 (PF05922)
Conserved uncharacterized protein; oki.258.16; gbr.501.3 MRIFLLLAFVAVVRGASLPWSVVPWEEWDVDLGITGPEVSMPSPSDSPNSIKVCCEGYTGTVEDGCPTP
VCDSPCLNGGTCAAPNHCICPKAYTGQTCDTLKREFVWSSWANVNQKPLLDSFQMTLNLYHIRDEVEA
CKNVVPEDIECRTRENHMDHTQTGQVVTCDRRSGFKCRNDEQPYGEPCLDYEVRILCPVKDQVTKRGF
TCIHETLEYNVGEVVKEGDCSACECQSDGRWNCHRDNHFCDRVRTGQCVVGERVFNHGDTTTLDCKMCT
CDTTTGWSCVNIDDHTCVAPPEDDYCRIDNHFIFFHGQTAKKDCNTCICKNREWDCTQMICPDKTNKAA
YFHKCTNPLTNERHNDGEIIKRDCNVCVCTQGKWDCTRDPCVEGTSLESEYSLANRKVCTTPTGLPFPH
GATISQDCNACKCFDGKWQCTRRYCSPETYPNSTCLDDVTISLVKSGQTIRRGCDVCVCNGGNLTCTTK
PCETNNGMCFDEQRRFVTTSTSFNRQYRPACNPDGTFRPIQCNPVHGVCFCVTTLGQVIPGTAVKQDT
GSPNCSPYTTGNAWSFMAVYEPMDVPQTNTQTGSDPCIETTRNTDTHLTGYNTPKCLRNGFFAPMQCD
LHTGVCYCVTMEGATIPGTVMHVSQGRPNCDVIREDMTPCQQERATAEHYKLPFVPECNQLGYYQPIQ
WWW.NATURE.COM/NATURE | 52
SUPPLEMENTARY INFORMATIONRESEARCHdoi:10.1038/nature22033

53
VNTMLGVRFCVDTNGVVIPHTITKSSNLHCDNIVDSEDVEPYTNKVDENHAPLIFQTYPIKDAIHKTP
RCKLQRLSSQFVSTVYRPTCLSDGRYTPMQCPEGVGVCFCVDVTGAIIPETVSRSGNTPNCNDYRSIF
DVVTPMNTSTVIIHPDVSLIHTGWELKLREIDHPTHVVGPQYQSTTTPQVLKTNVTTCIRQQQIASMV
PGVFYPSCHRNGTFNTMQHTPLNSKVYCVDKNGVKIELTERRMDVHLTLPECNKYWNTTIEINSLNKH
WTSTHQDVMTTTPIPLDKLFPAGLHHHPNCTRQQEITSRLEGAVVPTCEPNGTYTPLQCNATTGVCYC
ILPYGDVLPETVLPMVKGTPNCWHLRNASIQHSTTPVPDVCRLPISRGPCLARFPRWAYSTLLNKCHL
FVYGGCRGNDNRFETKEECENTCGYMTPRDSRPVTCSRKLNRFYRMSLTQRLRMKRPTCTPDGNYAPK
QCHLTRTERGLIESVCECIHRITGEPQVCPEEEVMVNPEFIDTIGVSTTLAPVPVIDGCLHERVEYHE
GDNFFQECNQWWVWPILVFGGGECIRRLMWPVWAIGENCYVNGQVAVEKDQGCEHCTCMGGQWDCEPMA
NCDTDPGPMSESGTSTHCVMEDGTSMTVGSSFYNKCNKCTCLSTGVVSCQNNYCIPRHCYERGIPYHTE
DTIMRDCNRCTCFSGQWQCQEYTCDPYIRTMVRVEGCQYKEKTYSNDETFYDVCNLCRCLGNNQTSCNR
RFCNPTSCYVKEVEIRNGESEIFECKTCSCINGLLDCHEDEECLNVMVDPVPEVNRDTSVTCNFEGKT
YTNGDEFFKQCQPCRCFDDGQVQCEEKACSPNLCYMEGVGYRSGKVLLTDIHKCTCYRGGHWDCQDKP
ADAGPPEVIECLDHQPVTVCATNPCNHVICPTNRDAICIPDPCNHQCHPAFFDIYGNRLRC
Mucin2_WxxW (PF13330); Thyroglobulin_1 (PF00086) x 6; Kunitz_BPTI (PF00014); Thyroglobulin_1 (PF00086); VWC (PF00093)
Transforming growth factor-beta-induced protein ig-h3-like; gbr.80.55 MAAGRILPVLALVALAILANPEETSGAGVLEVAEDYGAASFVSFARKCAYLKNLLETSTQPGGFTLFA
FSEKAYSESPPALRKLIANNTQTLQWVLEYHVALGPYMSSDIKDNLLLTSLYPSPTSGASLPLQYLRT
NIYTILSEAERERLGTGKVVTAGGAPIVQADLQASNGIVHIIDKVMFPLPTGADMTEFVNDDGRFSSL
FGFLQTANLTKALETDPSRPLTLFAPNNQAFKNLPKNVVQKLANVTFLQQVLEYHVVPGAYYAAGLWD
NQILHPLYNKPLLVERGQGGIYLQNSKVLQADNTVSNGVVHEISAVLIPPK
Fasciclin (PF02469) x 2
Transforming growth factor-beta-induced protein ig-h3-like; oki.2.137; gbr.80.58 MAAGRILPVLALVALAILATPEETSGAGVLEVAEDYGAASFVSFARKCAYLKNLLETSTQPGGFTLFA
FSEKAYSESPPALRKLIANNTQTLQWVLEYHVALGPYMSSDIKDNLLLTSLYPSPTSGASLPLQDLRT
NIYTILSRERI
Fasciclin (PF02469)
Transforming growth factor-beta-induced protein ig-h3-like; oki.2.139; gbr.80.54 MYLISAALFLLSLLGEYSLAHDVRNQEGNILQVCEKAGALTFVKYARATPWVNKTLVSGIGYMALAPT
DRAFGDLPLVVKIALKDPQTLEWYLRYHIALSVAYKQEINNNLRIPSAFRPPGKTEDLPEPVLPIRFN
VYDVLADYLSDGSFGQYLRTNIYTILSEAERERLGTGKVVTAGGAPIVQADLPASNGIVHIIDKVMFP
LPTGADMTEFVNDDGRFSSLFGFLQTANLTKALETDPSRPLTLFAPNNQAFKNLPKSVVQKLANVTFL
QQVLEYHVVPGAYYAAGLWDNQILHPLYNKPLLVERGQGGIYLQNSKVLQADNTVSNGVVHEISAVLI
PPK
Fasciclin (PF02469) x 2
Serine protease inhibitor Kazal-type-like; gbr.307.8 MRKLILITCIAVLLCSVYDAKGEPDPVLPDFCGKYGILPACPRILWPVCASTGTTYDNLCLMCADMLR
EEIPTSVTYTTGRCATD
Kazal_1 (PF00050)
Conserved uncharacterized protein; oki.13.128; gbr.43.33 MSQLALVALLGVIGHALSAQGQEHIPLTLNVESGLQDVPCGGFRYFSVEVTDPCKDLRVMVTKIEGEPD
VYIGRGNNMFPTDNTLAWSSYEWGSENLTVSSWDPEFEVGTFYIGVHAYCGIDVHTGNTSSKVKVLAES
LATSHMHPEITAGSPIRDGRVDAQGYNYYRFCLPHKCANVEVKLENCLSGADCPDSYGYPELLVSRSIV
RPSINDHSWKLATVTRRSVYLRHDDPDVKPGHYFVGVYGWCTPDENCPDKSTCGPCEYVANMAYSVSII
MTDVADCNPNPEKRNALSVEGQKHVPLTLNVESGLYEVPCGEFRYFSVEVTDPCKDLRVRIQAIQGEPD
LYISRGNDKFPTDKSLTWTSYNWGSEDLTVSSWDPEFEVGPFYIGVHAYCGSDVGTGHTPSKFTILAES
VPTSHPHDEITVNSPIRDGRVVAQGYNYYRFCLPQKCANVEVKLENCLSGADCPDSYGYPELLVSRSIV
QPSINDHSWKLASIYRRSVYLRHDDPDVKPGHYYVGVYGWCTPDEHCPDKNSCGPCEYVPNMTYNVSLI
LTDVADCHPTAGNTATISMSSFVAVQFSGFVMNCSFSFSFGSNDNN
WWW.NATURE.COM/NATURE | 53
SUPPLEMENTARY INFORMATIONRESEARCHdoi:10.1038/nature22033

54
Conserved uncharacterized protein; oki.132.13; gbr.332.10 MRQAMRLPIYVATLLTVVSAIDIPVFTNFVTTEVATISHSSTVKLIGYLCGQARGNHVNVSLELPHNPD
WNPSLGVLYYYVVDSPSKGEADALCTNLHQGVPGPSCNVKSWPSVGDLYITVHSGLADAVAFSVIGTSY
TKREVNPGVGGERTRKVFSPLKPPTANRVPRLPPGQETKEGQVIYLAEFVTLMGPQAIPRLQKAHLNFT
FCPTPRMGRVSAIDVRVATKFTTTEVTTLSQNSTVNLIGFLCGQAKGNTVNVTVVLNNNPYWRLNQGVL
YYYVVDSPSKGEADALCTNMNQGAPWAYCTVKSWPSLGDLYIKGRSGPVEAVSFSLDAERTQQSEVSFS
ADAVKIDKVPASAQKAPTSTAEPLPRVPPGYKLRDGKTVYLTEYITLTASQVVPRLQEAHLNFTFCPTP
ETGSQYSIIGTVIAKEGRSSWVQYICNKYPCELSHPENIIAYNGRQLPINTVVTGAGQWKQLYALIICW
GGPFDPKSGLYIGDFLFDAVANKV
Conserved uncharacterized protein; oki.172.23; gbr.106.45 MKAAVVMVYLVAVASAHICLLNPHQRGSMKGINVKDAGDCGLLIKPCGNRIQDKPGIQIKGGSPYTVVF
QKNLNHFETFPNGTATNGYFEISFLTSTDVQMLSKVNDGATPSLTLYYPNVTMPRGPIGVPAILQLTYV
TNNAEVPMGGIFYQCADIELF
Conserved uncharacterized protein; oki.172.24; gbr.106.46 MKAAVVMVCLVAVASAHLCLLNPHQRGSMKGINVKEADDCGLLVKPCGNRTQEKPGIQIKGGSPYTVVF
QKNLNHFETFPNGTVTNGYFEISFWTSTECHILGKVDDGATPSLTLYSPVVTMPTGPIGVPAVLQLTYV
TNNAEVPMGGIFYQCADIELF
Novel uncharacterized protein; oki.111.24; gbr.283.2 MFRTLVVVLLATVAVSVFGKDYPVSKDCNDDPAGCKICVQTYQFMKDSLMNAAFVDDTRKYCGYICPSA
RNSSLPSCQPKAVQLREGDTCVLNEDGPVCGVCTGTVVWLKEMLLNKQLIMTADVYLNFYCDLAASPCV
RQICRQYVREMNKLAMALGTVLDAKSVCQPMCSSSVTVHTPNLAGAIADFLRHVTEVMDVVAVGHRSAT
PDPPMGHCFADEQIHRWANGTPGPPLDHWYLLVGRETILYCSVLSA
Novel uncharacterized protein; oki.327.14; gbr.309.8 MAHCFSLTVLAIFLLGVGLVVPKKVEEEGSYARMETVKLKNLQLENRLRGFEPANLESSKGFMRDDVAK
RRRRVPKTDEMLASKKRSSVSN
Novel uncharacterized protein; oki.107.43; gbr.33.86 MRYIAVALLLTILLFDVVVGDGVKAQAPDKHSPAVADSRARRAVPHAGLINPADLGMRLKSRRSDPFRR
APRMKRYRRMVEDPEMYKRGLPGGKQIRVKKASKV
Conserved uncharacterized protein; oki.132.11; gbr.332.7 MKHSKMILLSVGLLFSVAWAIPXXXXXXXXXXXIIVPVVTNYITTEVQTLAQDASITFIGQLCEQYKGM
GVQVTVLLNNNPDWDPSVGVLYYYVVDDPNKGSSAALCNNSPGGSPQANCTVKAWPSNGDIYIKGHAGQ
SEAISFTLSVVIRPKASKGGASIKPRPFSFIKPPLRNLGGTPSANNLTVYLSEVVTLTATQPLGYHKKA
LLAFTFCPTPQTGTRYEVQSTTSATDGRSSYASYICDKLPCVVDGENVIAHNGRQLPSNIVRTGSGTWK
TLYALIVCWGGVWNPPKDEYIGHFIFNAHIM
Conserved uncharacterized protein; gbr.332.9 MRQAMRLPIYVATLLTVVSAIDIPVFTNFVTTEVATISHSSTVKLIGYLCGQARGNHVNVSLELPHNPD
WNPSLGVLYYYVVDSPSKGEADALCTNLHQGVPGPSCNVKSWPSVGDLYITVHSGLADAVAFSVIGTSY
TKREVNPGVGGERTRKVFSPLKPPTANRVPRLPPGQETKEGQVIYLAEVVTLMGPQAIPRLQKAHLNFT
FCPTPRTGSQYVIEARVISVDMKSTWSQCICDKYPCELSHPENIIGCNNTPLPINTVVTARGQWKQLYA
LIVCFDGPYDPKSHSYVGQFEFTAVAIKV
Novel uncharacterized protein; oki.33.77; gbr.422.5 MFRTLVVVLLVTVAVSVFGKDHPVSKDCNDDPAGCRICVETYQFMKASLTNAAFVRSNVEYFKLSTCPF
VPEGQPEHRLCVNHFNEIYGHVRLFVSMYLDNTRKYCGYVCPSARNSSLPSCQPKAVQQREGDTCVLNK
EGPVCGVCTGTVIWLKEMFLNQQFIQSAGVYLNVYCDLAKSPCLQKICRRYVRETEMVFLAFGAALDAK
SVCQPMCSGSATASIPNLASTVVDFLRRVTEAKDTVGSK
Conserved uncharacterized protein; oki.13.130; gbr.43.30 MSQLALVVLLGVICHALSAQGQEHIPLTLNVESGLQDVPCGGFRYFSVEVTDPCKDLRVMVTKIEGEPD
VYIGRGNNMFPTDNTLAWSSYEWGSENLTVSSWDPEFEVGTFYIGVHAYCGIDVHTGNTSSKVKVLAES
LATSHMHPEITAGSPIRDGRVDAQGYNYYRFCLPHKCANVEVKLENCLSGADCPDSYGYPELLVSRSIV
RPSINDHSWKLASIYRRSVYLQHNDSDVQPGHYFVGIYGWCTPDENCPDKSTCGPCEYVANMAYNVSVI
WWW.NATURE.COM/NATURE | 54
SUPPLEMENTARY INFORMATIONRESEARCHdoi:10.1038/nature22033

55
MTDVADCDLNPEKCNALSVEGQKHVPLTLNVESGLHKVPCGEFRYFSVEVTDPCKDLRVRVNMVEGEPD
LYIGRGNNKFPTDNTLAWSSYNWGSEDLTVSSWDPEFEVGTFYIGVHAYCGIDVATGDTPSKVTILAES
IPTTHPHNEITVNSSIRDGRVNAEGYNYYRFCLPHKCANVEVKLENCLSAAECPDSYGYPELLVSRSIV
RPSINDHSWKLASIYRRSVYLQHNDSDVQPGHHYVGVYGWCTPDENCPDKSTCGPCDYVANMTYSVSII
MTDIPDCDPNAWNPDPCNTNKAQILMPSYLVFCVSAILMKIFF
Novel uncharacterized protein; gbr.452.4 MRSLFWLLYVGMAVIIMMDFCTAQESQYTTDCTRFITLPGCPKNYRPHCTTVDGTVYQYANLCLLCRAI
ESEELPEDVSFARCTEEQLENNQ
Novel uncharacterized protein; oki.50.195; gbr.58.38 MFRFTAILLVLGMVAIQASRARPETRRYETNLKDSLKRREDLDLVNQLLERLLASEEKREVQKDCPEAT
ICSIGECYYVTDTPPGYGLVLYNRNSDKLLFQFDEDTLRRLDDKKTNVTVALLSTYFPYTSEDFEVDGE
TYNVKVDNVTVDDEGNITVDGFCLVLKEEWSRQRQLARRFY
Novel uncharacterized protein; oki.327.23; gbr.309.15 MANGSLKIQMLLLVIFAGVVAFAAPVNQQDNGFLGNMNRATENKTQSNADNDMQQEDLQEKNMHDLQNL
KKRPNWLIFRERHLMDKPSLRIPLSHVDFFPHLQDDDPQATKIVNKF
Conserved uncharacterized protein; oki.460.2 MNTLIVFASCCLLLSLQAAGSPFGYDEIHSMSKKYTEKSEPETAWAIPVSDSSAPPPINVSVVTNYITT
EVQTLAQEAEITFIGQLCEQSKGFEVEVTVLLNNNPDWDPSVGVLYYYVVDDPNKGSSAALCNNSPGGT
PQANCTVKAWPSNGDIYIKGHAGQSEAVSFTLSVTMKQKAGIKPTPFFFDKSPFRNLERTPSANNPTVY
LSQVVTLSSIQPLGYHKSALLAFTFCPTPQTGTRYEVQSATSATDGHSSYASYICDKLPCVVDGENVIA
ANGRQLPSNIVQTESGTWKTLYALIVGWGGVWNPPKDEYIGHFIFDAQTM
Vitellogenin; oki.185.68; gbr.198.26 MKLLLFLVGIALANAATTIIQNNDLEKSITIHRNAPETYPTEFQLSKTHRFNYTGDIRTSFPQTGNET
VGQRLQCIVEIYPLTTTLWNMRLVNPTIYEINGTHDKPQWMVNSTKVTEELRELLQYNVSILINQGKI
EAVFVNKSEAEWIVNLKKGIMNMISLTVEKDNVYEVDEEGVSGICKTLYTIKENKNEDLVTIMNITKV
RDLTNCSKTAFNKLMTFKAKDCDDCEKSKDSMEALATFKYNITGTKQRYIINSVQSDAHYVFFPMGVK
GGSVLVHVNQTLKLINVTSDPYFEKSPTQESRGGLTYLFPEIVKVEEDMLNTVQKVDFMLKKLEKQTN
SSLTIDSPSYFLLLVRSLFEANYETLEDIWNLVRHKPEQRKWLIEAIPFVNRPDMTLLIKELITTEET
LLTTEEKITILTRLGFIRQPSETTVEAIKALLCDLGNHVQDICEHRVLQWHHNTKVNTTYVYNLVRMR
HACYRSLGIQINSLKKTAKFVPPALVHSLLHCEKHFDDSTKATPWDPTVYKQMGVNQVTSEVDDNLTLE
EAQALVDVTKKTKVREMCLVAMGQVGLPDHIPYIEPILHQTVTNQTQDVRIAACFALRKMKNIPNKVL
SLLLPILRNPYEDPELRMIAYLVTTVTNKRPSVFTLIGQELNKEKSKQVRSFIYSHLKTLSESVVPCE
KDLAIAARYALVFTKPFNLGPTYSKVRNVGFYDHETKLGAKLKTRTMFSEGELTPSRTNIGLEVEMLG
KKTNFLEVEMKTSGMTNLLDKMFGVDGHFYKRKSIFDLLKESNRKRRSVSSNEEELNKINKKLSPYEV
TPEDPRFRLYISLVGNRILDMDVNKEYLTTLIKEGKFMTDFTSLDEELAKKQMFNTTKGMILMDHMFQ
HPTIMGMPLSYNTTVASILRIKVNATVKADPSLLLTQNTLKGSFNITPEVVVNAFFKMGCHIPQIKFG
SAINSTFNVTLPVHTNISIDFTKKKYEVIFPQIERNLTFLNFTHKIYTFWQKKDEMENQTIVNTTLTN
RKPVKKVLCIEPINDTKLCLNVTFTPRLGHPNSPYHPLTGPSYLSIFQNKTVYSPKIIKFKYQVNNPEL
WETEKNVDIVMTTMGLKHDLMEYENITTFNVRIHHPNKRIVLEVTDSAHPEWRSEIRAVNMDGEVDLKA
YWGNPHDHVVKINNTDMRLTREYFLQINSQSWTFNDTRNITIFWAELPQWLKNVTYLTKTYVLPVVLEA
IKKTTDTEFFVEPLLNPIVNSTTVSLKIKTNYTMDVEIHLPIEKITVVNVTVPVNTSVLKYNVPDAVAT
IQRRLTEKFLSGNCTYNHTGTFVTYDQLFYKYNLTGSCPHVLTKDCSPKKRFTVLVQNTRQSNLLVRT
NPLVTVYIDNHKIELITRNDEEVYMKYNGIEHLTQRDSTPIETDTCIIERNHTHITVKAKIGLTVVYC
KHNVTTSLSPWYVNKTCGMCGDFNGEIFREMKNTTAEEVNNSTKFGASWLVHGDDCMDETCKLTKEDL
YALPETVYLANKPAVCFSKEPVKLCPIGCNNESPENIFTSTLVPKKQFVKVPFFCMASENLEETKTLMK
TRTDLIRSQPVDLYRDIELPHDCICTSNCNIKV
Vitellogenin_N (PF01347) x 2; DUF1943 (PF09172); VWD (PF00094)
Conserved uncharacterized protein; oki.10.197, gbr.10.204, gbr.10.206; gbr.127.19, gbr.127.26, gbr.127.28 MDMTVRGFLFIFCFLPASFELARSQSTDDTMQPGAEGTYVVISTLRRLSQLTEDSSGDLQPDHGFLRRV
AWVDTRDGTAAGAYDPNYHGGIWRVDRSVYDATQAMLEDSRYSSIFGRIRQLFDINWDQTTWQDCRKPI
YSALAARLYFHRLQSTIPKRLSDQATLWWNEYHTRPTDTVENFIRKVSALEGTYATVCALNMAKTRDRG
WWW.NATURE.COM/NATURE | 55
SUPPLEMENTARY INFORMATIONRESEARCHdoi:10.1038/nature22033

56
TDLTVVAEASGTAVVEATLQKINRLMTEQDGSGSQPGQTGLQADFNFMRRLAWVETLDGTAEFTYSDPA
YHGGIWRVDRGPLQATLEMTNVPEYRAIFRTIEQIFCIDWKETSWEDCRKPLYSALAARLYFHNQKPAI
PQGVSDQAEYLGMQDQSRPNKTVTNFVMNVTNLDSESECLVRGIDLVFVMDSSGSVTSSNFELMKNFV
LEVVDFFDIGPDRTRVSVIRYASDASIQFSLNKYTDKTLLKQAIQRIEYSGGGTQTVTALNLMESQSF
LEGNGARPANQGLPRVAVVITDGQSQGPQAVAIPADRAREKGITLFAIGVTSSVNDDELNAIANKPSE
TYVFHVDNFQAIANIGVTLQGTTCNQATPITEPIINGTLDGEATQYLQQAVPAEGVTLAIEASNGSVA
MYVSITTPNPNEALHDFLLVAVAGAGSVEVFLGPENFDGPVTVAAGGGSAGGTSRKRRDVPNSNQTLAG
SPIGTVYMTIQGRLAENKFVLVVDRGDVTEPSTTKPATDVGVATATTVAYRLLLALTIVTAALVPTLLS
C
VWA (PF00092)
Conserved uncharacterized protein; oki.52.142; gbr.150.20 MLRSLAAVVLMLGVLGFQMTTAWNEDELGQLLKRVLKEEVEETKKSIDSSNLPIVGKITWQSSTLSPY
SSDKAVDGSSSSNLYSSEHCSHTIAAARDPWWMVDLGSNHCISKVRILNRGDCCSKRLKDAVVRVGPN
VAATENWACGSPVTAAQAAPWGDTIEFICYPTLKGRYVSVDIPGSATLHLCEVALEEVPLGHCPDSQP
FSVFGKPAEQSTTHAAGYAASFAVDGSSSAIMYPDRHCSSTVTNSNHPWWKVDLGGEQCVTKVTILNR
GDCCSERLQNAIVRAGTYKTVAANQACGAPITARQAQPLGGTIEIKCDRPLRARYVSVDIPGTATLQL
CEVSVEVLSSPDC
F5_F8_type_C (PF00754) x 2
Conserved uncharacterized protein; oki.1.63; gbr.2.190 MLRSLAAVVLVLGLVGFQMTTAWNGDKLDLLERVLKEEVEESKKSGDSTNLPIVGKITWQSSTLGAYS
SNKAVDGSSSSNLYPSQHCSHTITAARDPWWMVDLGSNHCISKVRILNRGDCCSERLEGAVVRVGPSV
TGTENWACGSPVTAAQAAPSGGTIEFTCYPALKGRYVSVDIPGSATLQLCEVTLEEIPLSQCPVPQPF
NVVGKTAEQSTTHGAGYTADLAVDGSSSAILYPARHCSHTVTNSNHPWWKVDLGGEQCVTKVTILNRG
DCCSDRLQNAIVRAGTSETATANQACGAPITASQAQPLGGTIEIKCDRPLRARYVSVDIPGTATLQLC
EVSVEVLSSPDC
F5_F8_type_C (PF00754) x 2
Fig. S7.4. Derived amino acid sequences and annotation of COTS proteins secreted into
seawater during aggregation or when alarmed. The predicted gene family name and OKI and
GBR gene model identifiers precede the sequence. Yellow, predicted signal peptide; red,
predicted cleavage site; green, cysteine; blue, predicted glycosylation site; grey boxes,
predicted domains using Pfam search with a E-value threshold of 1.0. The predicted domains
are listed after the sequence in the order of appearance from the N-terminal. See Table
S7.2a-n for further details about these proteins.
7.3. Behavioural response of COTS to signals from starfish aggregations
Behavioural responses of adult COTS were examined in the Australian Institute of
Marine Science (AIMS) SeaSim aquarium precinct (www.aims.gov.au/seasim) as
described in the Online Methods. Starfish test subjects were placed in a starter box
at the distal end of a 4.4 m long Y-maze. For control assays a COTS was subjected to
ambient flowing sea water entering via both of the Y-maze arms. The control subject
was removed from the Y-maze after every assay and a new animal used for the next
control experiment. Twenty-four hours prior to the treatment experiments six COTS
WWW.NATURE.COM/NATURE | 56
SUPPLEMENTARY INFORMATIONRESEARCHdoi:10.1038/nature22033

57
were placed in the header tank where they formed an aggregation. A test subject
was then exposed to the aggregated COTS-conditioned sea water in the header tank
via one arm, and ambient flowing sea water via the other arm. As for the controls,
fresh test subjects were used for each experiment. Given that COTS are nocturnal
and sedentary these experiments were performed at night and basic indicators of
motivation and activity recorded. Motivation was determined if the test animal
moved out of the original starter box. Experiments were run for 45 min. In the sea
water negative controls only 10% of starfish moved out of the starter box (N=32;
90% did not respond at all) whereas 96% of those exposed to the aggregation-
conditioned seawater (N=22) did so (Fig. 2a; Supplementary Video S1) with 23%
moving into the treatment arm. These changes in motivation were graphically
represented in heat maps where the frequency of a specific position in a 2D space
was visualised as a colour representing the minimum and maximum per-pixel
frequency over the duration of the experiment (see Online Methods). Activity, how
long and how frequent a test subject was active is determined by the number of
changed pixels for a current sample divided by the total number of pixels in the
arena. Using this measure, activity state thresholds can be arbitrarily set as inactive,
moderately active, active and highly active. Activity is not necessarily a simple
measure of distance moved, as anxiety movement will be detected as activity and
such behaviour is typically triggered by a stimulus.
Given the encouraging results from the short-term exposure to aggregated COTS,
experiments were largely replicated but with observations spanning 8 h to establish
a definitive response. A threshold of >60% active time was imposed as a measure of
‘highly active’. When starfish are exposed long term to an aggregation water-borne
signal they are highly active for 45% of the time. There was a significant difference in
the activity of starfish exposed to aggregated COTS-conditioned seawater
(aggregation; Mean=216.8, Standard Error Mean=33.2) compared to seawater only
(control; Mean=0.66, SEM=0.45); t-test for Equality of Means (N=52)=7.89, Sig. (2-
tailed) p=0.000, (Fig. S7.5b, Supplementary Video S2). Further, those COTS exposed
to the conditioned water showed a reduction in meandering indicating they were
moving more directly
WWW.NATURE.COM/NATURE | 57
SUPPLEMENTARY INFORMATIONRESEARCHdoi:10.1038/nature22033

58
Fig. S7.5. Response of COTS to COTS aggregation-conditioned sea water over 8 h. a, Heat
maps showing the cumulative response of COTS over 8 h to water conditioned with six
aggregating COTS (N=22) and ambient (control) sea water (N=32). Red, area in which COTS
spent most of the time with descending time to blue; black, no presence. Green outline
represents the Y-maze and the arm divider that prevents recirculation of water into the
opposite arm; starter zones are shown in yellow. b, The duration of movement (highly active
threshold set at >60%; p<0.05) and c, the meander (change in direction of movement;
p<0.05) of active animals over 8 h. Control, header tank containing ambient sea water only;
Aggregation, header tank containing six COTS. Mean ± standard error.
towards the cue (Fig. S7.5c). As the COTS in header tank were inaccessible to the test
subjects this meant they could not physically join the aggregation but were clearly
WWW.NATURE.COM/NATURE | 58
SUPPLEMENTARY INFORMATIONRESEARCHdoi:10.1038/nature22033

59
agitated exhibiting behaviour indicative of searching for the source regardless of
time observed.
7.4. Behavioural response of COTS to signals from its main predator, the giant
triton Charonia tritonis
Behavioural responses of adult COTS were examined in the presence of the giant
triton, Charonia tritonis, using the same Y-maze setup as for the aggregation assays.
One starfish test subject was placed in each of the two Y-maze arms. Twenty-four
hours prior to the treatment experiments a giant triton was placed in the header
tank. One COTS was subjected to ambient flowing sea water entering via one of the
Y-maze arms while the second test subject was exposed to the giant triton-
conditioned sea water in the header tank via the second arm. Fresh control and test
subjects were used for each experiment. Given that COTS are nocturnal and
sedentary, these experiments were performed under simulated night conditions and
basic indicators of motivation and activity recorded. Motivation was determined if
the test animal moved out of the Y-maze arm and into the distal leg. Experiments
were run for 45 min (N=18). There was no movement of over 94% of COTS in the
control group (sea water only) whereas 50% of COTS exposed to the giant triton-
conditioned water moved, with 33% moving completely out of the arm. The control
COTS spent most of their time in one position whereas the exposed COTS moved
further downstream in the arm or as far away from the signal that it could get
(Extended Data Fig. 5, Supplementary Video S3). Some exposed COTS travelled to
the arm that was without predator water-borne signal. The pattern of responses of
COTS across the three movement categories was significantly associated with giant
triton-derived chemical signals in the water (Fischer exact test, p < 0.01). These
changes in motivation were graphically represented in heat maps as for the
aggregation assays.
The cumulative duration of movement, i.e. mobility state, was approximately 10
times greater in the COTS exposed to predator water-borne signal (298±87 sec)
compared to controls (29±16 sec) (p<0.05) (Extended Data Fig. 5). Control COTS
meander twice as much (25.8±2.63 deg mm-1) compared to those animals exposed
WWW.NATURE.COM/NATURE | 59
SUPPLEMENTARY INFORMATIONRESEARCHdoi:10.1038/nature22033
60
to the giant triton-conditioned sea water (12.7±1.34 deg mm-1) (p<0.05) (Extended
Data Fig. 5). COTS alarmed by the giant triton overall move further, in a near straight
line and more quickly than controls. As the giant triton in the header tank was
inaccessible to the test subjects this meant the COTS could not visually detect the
predator but were clearly agitated exhibiting behaviour indicative of a flight
response.
Additional Supplementary Tables
Table S7.1. Summary of all COTS exoproteins detected in the seawater.
Table S7.2a-n. Summary of 108 COTS secreted proteins detected in the seawater.
Supplementary Videos
Supplementary Video S1. Response of crown-of-thorns starfish over 45 minutes to
factors released by aggregating starfish. Time-lapse videos of 45 min Y-maze
behavioural assays showing in the first instance two crown-of-thorns starfish
subjected to flowing ambient seawater (control) and then two different COTS
subjected to flowing seawater conditioned with factors released by aggregating
COTS. Two example Y-mazes are shown (1, 2), with right (R) and left (L) arms. 270x
real time speed.
Supplementary Video S2. Response of crown-of-thorns starfish over 8 hours to
factors released by aggregating starfish. Time-lapse videos of 8 h Y-maze
behavioural assays showing in the first instance two crown-of-thorns starfish
subjected to flowing ambient seawater (control) and then two different COTS
subjected to flowing seawater conditioned with factors released by aggregating
COTS. Two example Y-mazes are shown (1, 2), with right (R) and left (L) arms. 480x
real time speed.
Supplementary Video S3. Response of crown-of-thorns starfish over 45 minutes to
factors released by their predator, the giant triton. Time-lapse videos of 45 min Y-
maze behavioural assays showing two crown-of-thorns starfish, one subjected to
flowing ambient seawater (control) and the other subjected to flowing seawater
WWW.NATURE.COM/NATURE | 60
SUPPLEMENTARY INFORMATIONRESEARCHdoi:10.1038/nature22033

61
conditioned with factors released by their predator, the giant triton. Two Y-mazes
are shown (1, 2), with right (R) and left (L) arms. 270x real time speed.
WWW.NATURE.COM/NATURE | 61
SUPPLEMENTARY INFORMATIONRESEARCHdoi:10.1038/nature22033

62
8. Identification and analysis of ependymin-related genes
8.1 Identification and manual curation of ependymin-related genes
Potential ependymin-related genes (EPDRs) were identified and aligned as described
in the Online Methods. From the alignment, it became evident that several of the
predicted proteins appeared to be incorrect, based upon corresponding transcript
sequences. The transcripts were then used as queries to identify the correct
intron/exon architecture of the genes in the genome assemblies. Using this method,
26 EPDR genes were found in GBR and OKI A. planci genomes (Table S8.1). The gene
arrangement, intron-exon structure and intergenic distances are largely consistent
between the OKI and GBR genomes, with two inconsistencies identified that likely
originate from the genome assembly (Fig. S8.1). The majority of the genes are found
in two clusters of 11 and 8 genes, with the remaining genes occurring as pairs or
single genes on other scaffolds (Fig. S8.1; created using FancyGene, Rambaldi and
Ciccarelli 2009).
8.2 Characteristics of COTS ependymin-related proteins
An alignment of the manually curated GBR ependymin-related proteins is presented
in Fig. S8.2. All proteins are predicted to possess signal peptides and are therefore
expected to be secreted. A sequence logo indicating the overall frequencies of amino
acids reveals a high level of conservation of a number of residues within the
alignment, most notably of six cysteine residues. The conservation of these residues
most likely indicates that they play structural role in this class of proteins.
WWW.NATURE.COM/NATURE | 62
SUPPLEMENTARY INFORMATIONRESEARCHdoi:10.1038/nature22033
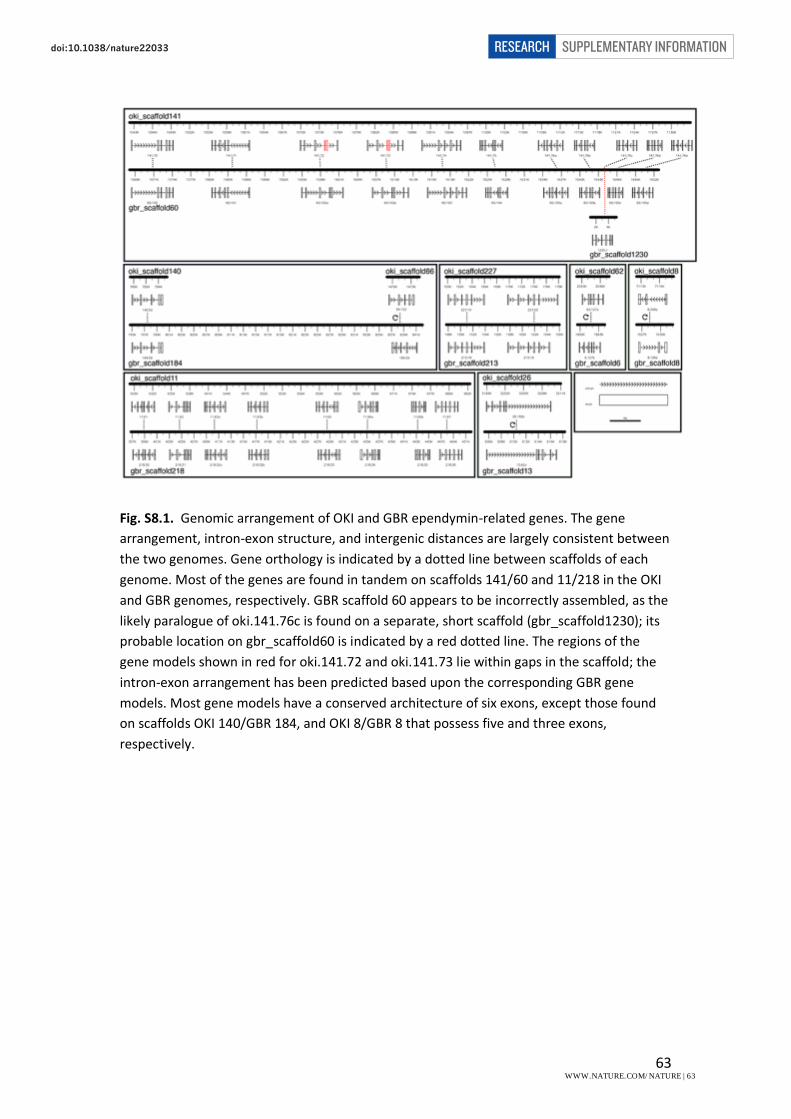
63
Fig. S8.1. Genomic arrangement of OKI and GBR ependymin-related genes. The gene
arrangement, intron-exon structure, and intergenic distances are largely consistent between
the two genomes. Gene orthology is indicated by a dotted line between scaffolds of each
genome. Most of the genes are found in tandem on scaffolds 141/60 and 11/218 in the OKI
and GBR genomes, respectively. GBR scaffold 60 appears to be incorrectly assembled, as the
likely paralogue of oki.141.76c is found on a separate, short scaffold (gbr_scaffold1230); its
probable location on gbr_scaffold60 is indicated by a red dotted line. The regions of the
gene models shown in red for oki.141.72 and oki.141.73 lie within gaps in the scaffold; the
intron-exon arrangement has been predicted based upon the corresponding GBR gene
models. Most gene models have a conserved architecture of six exons, except those found
on scaffolds OKI 140/GBR 184, and OKI 8/GBR 8 that possess five and three exons,
respectively.
WWW.NATURE.COM/NATURE | 63
SUPPLEMENTARY INFORMATIONRESEARCHdoi:10.1038/nature22033

64
Figure S8.2. Alignment of COTS ependymin-related proteins. The signal peptide is indicated
by a blue box. The size of the amino acid residues in the sequence logo displayed beneath
the alignment indicates the proportion of proteins possessing that residue at the same
position. Residues that are conserved 50% and above across all sequences are shaded in
yellow.
WWW.NATURE.COM/NATURE | 64
SUPPLEMENTARY INFORMATIONRESEARCHdoi:10.1038/nature22033

65
8.3 Distribution of ependymin-related genes in other species
Given the large number of EPDR genes found in the COTS genomes - these genes are
generally found as single copies in non-teleost vertebrate genomes, (Suárez-Castillo
and García-Arrarás 2007), we investigated the content of EPDR genes in a range of
metazoan species as described in the Online Methods (Tables S8.1 - S8.3).
The number of unique ependymin domain-containing genes found in each species
was extremely variable (Tables S8.2 and S8.3). Some genomes, including the
nematode Caenorhabditis elegans and the arthropod Tribolium castaneum, appear
to have lost the gene family in its entirety; previous studies have also failed to find
ependymin-related genes in ecdysozoans (Suárez-Castillo and García-Arrarás 2007).
Expansions of the gene family have occurred in other lineages, however the
occurrence of these expansions does not appear to correlate with phylogeny. For
instance, although expansions appear to have occurred in the molluscs Pinctada
fucata and Lottia gigantea, a third molluscan species, Octopus bimaculoides,
possesses only two EPDR genes. From this survey, the largest expansion appears to
have occurred in COTS, which possesses 26 ependymin-related genes. Most other
ambulacrarians possess significantly fewer ependymin-related genes - with the
caveat that this analysis was performed on transcriptomes for most of these taxa,
and some members of the gene family may not have been identified. Interestingly,
however, 22 EPDR genes were identified in Patiria miniata, a closely related valvatid
asteroid. This points towards a potential expansion of the EPDR gene family in the
order Valvatida.
8.4 Phylogenetic analysis of ependymin-related genes
To reveal the relationship between COTS ependymin-related genes and those
previously identified (Suárez-Castillo and García-Arrarás 2007), phylogenetic analysis
was performed using a subset of the sequences identified in Table S8.3 (Fig. 3b; Fig.
S8.3). The alignment included ependymin-related sequences identified in taxa for
which whole genome data are available, as well as those identified in the
transcriptomes of two other valvitid asteroids, P. miniata and Asterina pectinifera,
and a more distantly-related forcipulatid asteroid, Labidaster annulatus. To
WWW.NATURE.COM/NATURE | 65
SUPPLEMENTARY INFORMATIONRESEARCHdoi:10.1038/nature22033

66
determine whether the apparent expansion of EPDRs in COTS and other valvatid
asteroids resulted from a lineage-specific expansion, an additional analysis was
performed using all sequences identified in ambulacrarian transcriptomes (Table
S8.3, Extended Data Fig. 7). Analyses were performed as described in the Online
Methods. The ML trees are presented in Fig. 3b, Extended Data Fig. 7 and Fig. S8.2.
The analysis reveals that the majority of the COTS ependymin-related genes fall
within two clades (Fig. 3b; clades 4 and 5 in Extended Data Fig. 7; Fig. S8.2), and in
many cases have closely related orthologues in P. miniata and A. pectinifera, and less
frequently L. annulatus. The purple sea urchin (Strongylocentrotus purpuratus)
sequences can be found in a separate clade. This indicates that there has been a
large expansion of EPDR genes within both the Asteroidea and the Valvatida. In
COTS, the majority of genes within each of the clades are found clustered within the
genome (Figs 3c and S8.1), indicating that gene expansion has occurred via tandem
duplication.
Clade 1 in Extended Data Fig. 7 within the tree contains members with a broad
taxonomic distribution, including vertebrates, cnidarians and molluscs, and
encompasses many of the EPDR genes reported in Suárez-Castillo and García-Arrarás
(2007). The true ependymins, which are fish-specific, restricted to the brain, and
involved in memory formation (Shashoua 1991; indicated in Figs 3 and S8.3 by a
star), also fall within this clade. The clade has one COTS member that groups closely
with P. miniata and S. purpuratus genes. Interestingly, this putative ancestral
ependymin is found on a separate scaffold to other COTS-related genes and has a
distinct intron-exon arrangement (Fig. S8.1).
WWW.NATURE.COM/NATURE | 66
SUPPLEMENTARY INFORMATIONRESEARCHdoi:10.1038/nature22033

67
Table S8.2. Ependymin-related gene family numbers in metazoan genomes, and echinoderm genomes and transcriptomes
Name EPDRs Phylum Class Superorder Order Family Reference Accession/version/source
Acanthaster planci 26 Echinodermata Asteroidea Valvatacea Valvatida Acanthasteridae Asterina pectinifera 7* Echinodermata Asteroidea Valvatacea Valvatida Asterinidae Reich et al. 2015 SRX445871 Patiria miniata 22* Echinodermata Asteroidea Valvatacea Valvatida Asterinidae Reich et al. 2015# SRX445851/SRX1261879 Solaster stimpsoni 0* Echinodermata Asteroidea Valvatacea Valvatida Solasteridae Telford et al. 2014 Luidia clathrata 3* Echinodermata Asteroidea Valvatacea Paxillosida Reich et al. 2015 SRX445684 Luidia senegalensis 2* Echinodermata Asteroidea Valvatacea Paxillosida O’Hara et al. 2014 SRX1625090 Asterias amurensis 0* Echinodermata Asteroidea Forcipulatacea Reich et al. 2015 SRX445872 Asterias forbesi 0* Echinodermata Asteroidea Forcipulatacea Reich et al. 2015 SRX445857 Asterias vulgaris 2* Echinodermata Asteroidea Forcipulatacea Reich et al. 2015 SRX445860 Labidaster annulatus 13* Echinodermata Asteroidea Forcipulatacea Cannon et al. 2014 SAMN03012748/12747 Leptasterias sp. 3* Echinodermata Asteroidea Forcipulatacea Reich et al. 2015 SRX445863 Marthasterias glacialis 7* Echinodermata Asteroidea Forcipulatacea Reich et al. 2015 SRX445866 Pisaster ochraceus 2* Echinodermata Asteroidea Forcipulatacea Reich et al. 2015 SRX445868 Echinaster spinulosus 12* Echinodermata Asteroidea Spinulosacea Reich et al. 2015 SRX446364 Henricia sp. 9* Echinodermata Asteroidea Spinulosacea Reich et al. 2015 SRX445861 Amphipholis squamata 10* Echinodermata Ophiuroidea Telford et al. 2014 Astrotoma agassizii 3* Echinodermata Ophiuroidea Cannon et al. 2014 SAMN03012756 Ophiactis abyssicola 5* Echinodermata Ophiuroidea O’Hara et al. 2014 SRX1625094 Ophiocoma echinata 7* Echinodermata Ophiuroidea Reich et al. 2015 SRX445856 Ophiomyxa australis 5* Echinodermata Ophiuroidea O’Hara et al. 2014 SRX1625098 Eucidaris tribuloides 0* Echinodermata Echinoidea Reich et al. 2015 SRX445845 Strongylocentrotus purp. 8 Echinodermata Echinoidea Sea Urchin GSC 2006 GCA_000002235.2 Ensembl Leptosynapta clarki 2* Echinodermata Holothuroidea Cannon et al. 2014 SAMN03012745 Parasticophus californ. 5* Echinodermata Holothuroidea Cannon et al. 2014 SAMN03012744 Apometra wilsoni 4* Echinodermata Crinoidea O’Hara et al. 2014 SRX1625091 Dumetocrinus sp 5* Echinodermata Crinoidea Cannon et al. 2014 SAMN03012750 Saccoglossus kowalevskii 4 Hemichordata Simakov et al. 2015 PRJNA42857 Cephalodiscus gracilis 5* Hemichordata Cannon et al. 2014 SAMN03012629 Ptychodera bahamensis 2* Hemichordata Cannon et al. 2014 SAMN03012539 Danio rerio 4 Chordata GCA_000002035.3 Ensembl Homo sapiens 1 Chordata GCA_000001405.20 Ensembl Mus musculus 1 Chordata GCA_000001635.6 Ensembl Onchorhyncus mykiss 6 Chordata Berthelot et al. 2014 Tetraodon nigroviridis 2 Chordata TETRAODON 8.0 Ensembl Takifugu rubripes 4 Chordata FUGU 4.0 Ensembl Xenopus tropicalis 1 Chordata Hellsten et al. 2010 GCA_000004195.1 Ensembl Lottia gigantea 16 Mollusca Simakov et al. 2013 v.1.0 JGI Proteins:Filt.Models Pinctada fucata 13 Mollusca Takeuchi et al. 2016 v.2.0 Octopus bimaculoides 2 Mollusca Albertin et al. 2016 PRJNA270931Capitella teleta 4 Annelida Simakov et al. 2013 v.1.0 JGI Proteins:Filt.Models Tribolium castaneum 0 Arthropoda Tribolium GSC 2008 GCA_000002335.2 EnsemblCaenorhabditis elegans 0 Nematoda GCA_000002985.3 EnsemblTrichoplax adhaerens 10 Placozoa Srivastava et al. 2008 Triad1 JGI best_proteins Acropora digitifera 0 Cnidaria Shinzato et al. 2011 Nematostella vectensis 1 Cnidaria Putnam et al. 2007 v.1.0 JGI Proteins:Filt.Models
Amphimedon queensl. 12 Porifera Srivastava et al. 2010
* Estimate is from a transcriptome and may not represent the complete gene complement in that species. # Also unpublished.
WWW.NATURE.COM/NATURE | 67
SUPPLEMENTARY INFORMATIONRESEARCHdoi:10.1038/nature22033

Figure S8.3. Phylogenetic tree of ependymin-related genes. This is a more detailed depiction of the
tree presented in Fig. 3b. Midpoint rooted maximum likelihood phylogenetic tree of EPDR genes in
selected lineages. GBR COTS sequence names are in red, ovals next to the names indicate whether
the protein was found within the exoproteome in aggregating (red) or in both aggregating and
alarmed (green) animals. The true ependymins (expressed in the brain of teleosts) are indicated by a
star. Branches with ML bootstrap values >70 and Bayesian posterior probability values >0.9 are
indicated by a solid line, those with lower values are indicated by a dashed line. The scale bar
indicates the number of substitutions per site. Ape, Asterina pectinifera; Cte, Capitella teleta; Dre,
Danio rerio; Hsa, Homo sapiens; Lan, Labidaster annulatus; Lgi, Lottia gigantean; Mmu, Mus
musculus; Nve, Nematostella vectensis; Omy, Onchorhyncus mykiss; Pmi, Patiria miniata; Sko,
Saccoglossus kowalevskii; Spu, Strongylocentrotus purpuratus; Tni, Tetraodon nigroviridis; Tru,
Takifugu rubripes; Xtr, Xenopus tropicalis.
Additional Supplementary Tables
Table S8.1. GBR-OKI EPDRs (curated).
Table S8.3. EPDRs used in analyses.
WWW.NATURE.COM/NATURE | 68
SUPPLEMENTARY INFORMATIONRESEARCHdoi:10.1038/nature22033

69
9. Identification and analysis of GPCRs
We screened the protein models of 6 deuterostome species – Acanthaster planci (both OKI
and GBR genomes), Branchiostoma floridae, Homo sapiens, Saccoglossus kowalevskii,
Ptychodera flava, and Strongylocentrotus purpuratus – using PFAM-scan.pl
(ftp://ftp.sanger.ac.uk/pub/databases/Pfam/Tools/) against version 27 of the PFAM-A
database (Krishnan et al. 2014; Table S9.1). Sequences annotated by PFAM_scan.pl with
domains in GPCR_A Pfam clan (CL0192), and with at least 5 transmembrane regions
according to hmmtop (Tusnady and Simon 2001), were considered to be GPCRs and were
further annotated with InterProScan 5.8-49.0 (Jones et al. 2014).
Large-scale phylogenetic analysis of olfactory receptors (ORs) from several chordates
showed that in most species the ORs expanded in a lineage-specific manner (Adipietro et al.
2012, Khan et al. 2015, Niimura 2012). However, identification of ORs in non-chordates
based simply on sequence similarity has been difficult (Nei et al. 2008). Helpful to the
present analysis is the genome of another echinoderm, the sea urchin S. purpuratus, which
encodes a large taxon-specific expansion of rhodopsin family GPCRs (Raible et al. 2006). A
substantial fraction of these appear to be OR-like, based on gene architecture (single exon
genes as vertebrate ORs) and on their expression in tissues with known chemosensory
function, including pedicellariae and tube feet (Raible et al. 2006).
Many sequences were annotated as rhodopsin and hence sequences annotated with PFAM
00001 were trimmed specifically to the region annotated as “7 transmembrane receptor
(rhodopsin family)” by InterProScan and subsequently parsed into subfamilies using
FastOrtho, a modified version of OrthoMCL (Li et al. 2003) with inflation parameters of 1.5.
FastOrtho identified 957 groups of at least two GPCRs in the rhodopsin family (7tm_1)
(Table S9.2).
The other GPCRs were similarly trimmed to the transmembrane receptor region for
phylogenetic analysis. The annotations used for trimming for each of these GPCRs were as
follows: 7TM_3/Glutamate (PF00003); Dicty_CAR (PF05462) “G-protein coupled receptors
WWW.NATURE.COM/NATURE | 69
SUPPLEMENTARY INFORMATIONRESEARCHdoi:10.1038/nature22033
70
family 2 profile 2”; Frizzled (PF01534) “Frizzled/Smoothened family membrane region”;
GpcrRhopsn4 (PF10192) “rhodopsin-like GPCR transmembrane domain”; Lung_7-TM_R
(PF06814) “Lung seven transmembrane receptor”; and Ocular_alb (PF02101) “Ocular
albinism type 1 protein”. Phylogenetic analyses were conducted on the transmembrane
receptor region for each GPCR family using FastTree 2 (Price et al. 2010) with the slow
gamma model options (Tables S9.3-S9.6).
9.1 Tissue expression of GPCRs
To examine tissue-specific patterns of GPCR gene expression, we inferred the expression of
all genes in each of our transcriptomes using rsem (Li et al. 2011). Expression data, in terms
of fragments per kilobase of transcript per million mapped reads (FPKM), was then
assembled into a data matrix and visualized using Pretty Heatmap (https://cran.r-
project.org/web/packages/pheatmap) in R (R Core Team 2015).
9.2 Identification and phylogenetic analysis of olfactory receptor-like genes
Olfactory receptors (ORs) constitute the largest multigene family in mammals and the
number and diversity of ORs vary markedly from species to species (Nei et al. 2008). In
vertebrates, olfaction is largely mediated by ORs belonging to the rhodopsin family (Class A)
of GPCRs (Fredriksson et al. 2003). OR repertoires have been characterised in a number of
chordates, including terrestrial mammals, fishes, sea lamprey and the cephalochordate
amphioxus (Niimura 2009). Vertebrate ORs are categorised into Type I and Type II ORs,
which are further classified into six (α-ζ) and five (η-λ) groups, respectively (Niimura 2009).
Mapping of OR repertoires in terrestrial and marine chordates showed that Type I α and γ
groups are more specific for detecting airborne odourants, whereas Type I δ, ε, and ζ and
Type II η are likely to detect water-borne chemical signals (Niimura 2009). Large-scale
phylogenetic analysis of ORs from several chordates showed that in most species, the ORs
expanded in a lineage-specific manner (Adipietro et al. 2012, Khan et al. 2015, Niimura
2012,). Given these lineage-specific expansions, which have resulted in a diversity of
chordate ORs, identification of ORs in non-chordates based simply on sequence similarity
has been difficult (Nei et al. 2008). A substantial fraction of the large taxon-specific
expansion of rhodopsin family GPCRs in S. purpuratus appear to be OR-like, based on gene
WWW.NATURE.COM/NATURE | 70
SUPPLEMENTARY INFORMATIONRESEARCHdoi:10.1038/nature22033
71
architecture (single exon genes as vertebrate ORs) and their expression in chemosensory
tissues (Raible et al. 2006).
To identify putative OR-like genes in the COTS genome, we thus utilised a similar
methodology as described previously (Niimura 2009, Niimura 2013) with some
modifications to incorporate the approaches of Raible et al. (2006). Initially, we conducted a
Pfam search against all predicted protein models of both GBR and OKI COTS genomes, using
an e-value cut-off of 0.001. Although we identified 766 sequences that align with the 7tm_1
domain (PF00001), representative to the class A or rhodopsin-like GPCRs, a screen with the
7tm_4 Pfam HMM model (PF13853; e-value cut-off of 0.001) identified no ORs in either
COTS genome. This anomaly appears to be because the seed alignment for the 7tm_4
model contains only the mammalian representatives, which comprises recently duplicated
OR-like genes. Analogous scenarios were observed in amphioxus (Churcher and Taylor
2009), and in other invertebrates including S. purpuratus (Churcher and Taylor 2011), where
7tm_4 model failed to readily identify OR-like sequences. Therefore, to search for putative
OR-like sequences in A. planci, we built 13 distinct HMM profiles from previously curated OR
repertoires, comprising those from fish (fugu, medaka, pufferfish, zebrafish and stickleback),
amphioxus, sea urchin (“Specific rapidly expanded lineages of rhodopsin family” GPCRs
(Surreal GPCRs) groups A-F) and manually curated ORs from Swiss-Prot. All non-redundant
hits were retrieved from the combined results of all HMM searches and, as anticipated, as
all class A GPCRs share key residues, the non-redundant dataset contained a large number
of non-ORs. These include an E/DRY motif at the junction of TM3 and intracellular loop, and
an NpxxY motif in TM7. To distinguish between ORs from rest of the 12 rhodopsin
subfamilies (non-ORs), we conducted a BLASTP search (default settings) against a local
database containing all class A or rhodopsin-like GPCRs from the Swiss-Prot database. As
observed for the S. purpuratus Surreal GPCRs (Raible et al. 2006), this approach yielded an
unexpectedly low number of rhodopsin GPCR genes in both GBR and OKI genomes (four
each) that could be unambiguously categorised into OR subfamily. This anomaly is because
the top five Blastp hits of A. planci rhodopsin-family GPCRs contained both ORs as well as
other non-OR Rhodopsin subfamilies, preventing the unambiguous classification of these as
ORs. Conversely, an all-against-all comparison of COTS rhodopsin-like GPCRs revealed a
WWW.NATURE.COM/NATURE | 71
SUPPLEMENTARY INFORMATIONRESEARCHdoi:10.1038/nature22033

72
number of paralogous clusters of putative OR-like genes, as observed earlier in S.
purpuratus Surreal GPCRs.
To determine if these COTS paralogous clusters of Class A GPCRs are species-specific – as is
the case for the Surreal GPCRs - and to resolve their relationship to other “Class A”
deuterostome GPCRs, we conducted a large-scale comparative phylogenetic analysis. The
dataset included class A rhodopsin-like GPCRs from S. purpuratus, which includes the
Surreal GPCRs, from two hemichordates (P. flava and S. kowalevskii), as well as ORs from
fish (fugu, medaka, pufferfish, zebrafish, stickleback) and amphioxus. All sequences that
contained 5 to 7 transmembrane helices were considered for phylogenetic analysis. The
final dataset (2615 sequences) was aligned using MAFFT V7 with the FFT-NS-2 progressive
method (Katoh and Standley 2013) and the alignment was manually trimmed to conserved
blocks of transmembrane regions for phylogenetic tree reconstruction. The ML phylogenetic
tree topology shown in Fig. 4b was built using MEGA7 using a Poisson model with rate
uniformity across sites (Kumar et al. 2016). Attempts to verify the inferred tree topology
using the Bayesian approach implemented in MrBayes3.2 (Ronquist et al. 2012) and ML
methods implemented in RAxML (Stamatakis et al. 2006) yielded unresolved trees, likely
due to size and divergence of the dataset. Nonetheless, the reported ML topology supports
several paralogous clusters (a to k) of COTS rhodopsin family GPCRs that appear to be
closely related to surreal GPCRs in the S. purpuratus genome (Raible et al. 2006). These
paralogous clusters are distinct from non-OR rhodopsin-like GPCRs as well as distinct from
fish and amphioxus ORs, implying that both A. planci and S. purpuratus have undergone
lineage-specific expansions of rhodopsin-like GPCRs that may perform analogous
chemosensory functions to ORs in other species.
9.3 Identification of OR-like Motifs
Although ORs have undergone taxon-specific expansions and diversifications in several
chordate taxa, they share a few characteristic OR-like amino acid motifs. Such conserved
characteristic motifs include LxxPxYxxxxxLxxxDxxxxxxxxP, KAxxTxxxH, MAxDRYxxxCxPLxY,
SSxxNPxxY (Churcher and Taylor 2009, Churcher and Taylor 2011); the latter two may not be
specific to ORs as they comprise the DRY and NPxxY usually found in all Rhodopsin-like
GPCRs. These motifs were previously used to query/search for ORs in non-chordate species,
WWW.NATURE.COM/NATURE | 72
SUPPLEMENTARY INFORMATIONRESEARCHdoi:10.1038/nature22033

73
and were also found to occur in echinoderms and cnidarian OR-like sequences, although not
all residues were found to be conserved (Churcher and Taylor 2009, Churcher and Taylor
2011). We here considered LxxPxYxxxxxLxxxDxxxxxxxxP and KAxxTxxxH to be indicative of
OR-related sequences and searched for these in putative COTS OR-like paralogous clusters
identified as described above. Of these, the LxxxxxxxxxxLxxxD motif is encoded in most
genes comprising COTS OR-like clusters; the KAxxTxxxH is largely absent. An alignment of
representative mammalian, amphioxus, sea urchin and COTS OR-like sequences reveal a
strong conservation of the LxxxxxxxxxxLxxxD motif across deuterostome phyla (Fig. S9.1).
Additional Supplementary Tables Table S9.1. Comparison of ambulacrarian and amphioxus GPCR repertoires.
Table S9.2. Class A GPCRs – rhodopsin receptors.
Table S9.3. Class B GPCRs – adhesion and secretin receptors.
Table S9.4. Class C GPCRs - glutamate receptors.
Table S9.5. Class F GPCRs - Frizzled receptors.
Table S9.6. Other GPCR receptors.
WWW.NATURE.COM/NATURE | 73
SUPPLEMENTARY INFORMATIONRESEARCHdoi:10.1038/nature22033

74
Fig. S9.1. Alignment showing the presence one of the characteristic OR-like motifs conserved across
deuterostome taxa. A few representative sequences are aligned from each cluster shown on the left.
Residues that are conserved 50% and above across all sequences are shaded in yellow. Panels on the
right shows amino acid logos of the corresponding clusters made using all sequences of each cluster.
Residues that aligned with the characteristic LxxPxYxxxxxLxxxDxxxxxxxxP motif are highlighted in red
in both the alignment and the amino acid logo.
WWW.NATURE.COM/NATURE | 74
SUPPLEMENTARY INFORMATIONRESEARCHdoi:10.1038/nature22033

75
10. References Adipietro KA, Mainland JD, Matsunami H (2012) Functional evolution of mammalian odorant
receptors. PLoS Genet 8:e1002821.
Adjeroud M et al. (2009) Recurrent disturbances, recovery trajectories, and resilience of coral assemblages on a South Central Pacific reef. Coral Reefs 28:775–780.
Albertin CB et al. (2015) The octopus genome and the evolution of cephalopod neural and morphological novelties. Nature 524:220-224.
Alqaisi KM et al. (2016) A comparative study of vitellogenesis in Echinodermata: Lessons from the sea star. Comp Biochem Physiol A Mol Integr Physiol 198:72-86.
Audsley N, Down RE (2015) G protein coupled receptors as targets for next generation pesticides. Insect Biochem Mol Biol 67:27-37.
Babcock RC, Mundy CN, Whitehead D (1994) Sperm diffusion models and in situ confirmation of long-distance fertilization in the free-spawning Asteroid Acanthaster planci. Biol Bull 186:17-28.
Babendreier D (2007) Pros and Cons of Biological Control. pp 403-418. In ‘Biological Invasions’, Nentwig W (ed) Ecol Ser 193. Springer-Verlag, Berlin.
Baird AH, Pratchett MS, Hoey AS, Herdiana Y, Campbell SJ (2013) Acanthaster planci in a major cause of coral mortality in Indonesia. Coral Reefs 32:803-812.
Barham EG, Gowdy RW, Wolfson FH. (1973) Acanthaster (Echinodermata, Asteroidea) in the Gulf of California. US Nat Mar Fish Serv Fish Bull 71:927–942.
Barnes JH (1966) The crown-of-thorns starfish as a destroyer of coral. Aust Nat Hist 15:257-261.
Bateman A et al. (2004) The Pfam protein families database. Nucl Acids Res 32:D138–D141.
Benzie JAH, Black KP, Moran PJ, Dixon P (1994) Small-scale dispersion of eggs and sperm of the crown-of- thorns starfish (Acanthaster planci) in a shallow coral reef habitat. Biol Bull 186:153–167.
Berthelot C et al. (2014) The rainbow trout genome provides novel insights into evolution after whole-genome duplication in vertebrates. Nat. Comm. 5:3657.
Birkeland C (1982) Terrestrial runoff as a cause of outbreaks of Acanthaster planci (Echinodermata: Asteroidea). Mar Biol 69:175-185.
Birkeland C, Randall RH (1979) Report on the Acanthaster planci (Alamea) studies in Tutuila, American Samoa. NOAA: Local climatological data. Annual summary with comparative data. Pago Pago, American Samoa.
Birkeland CE, Lucas JS (1990) Acanthaster planci: major management problems of coral reefs. CRC Press, Boca Raton, Florida; 257 p.
Boetzer M et al. (2011) Scaffolding pre-assembled contigs using SSPACE. Bioinform 27:578–79.
Bouchon C (1985) Quantitative study of scleractinian coral communities of Tiahura Reef (Moorea Island, French Polynesia. Proc 5th Coral Reef Congr 6:279-284.
Branham JM, Reed SA, Bailey JH, Caperon J (1971) Coral-eating sea stars Acanthaster planci in Hawaii. Science 172:1155.
Caers J et al. (2012) More than two decades of research on insect neuropeptide GPCRs: an overview. Front Endocrin 3:2-30.
WWW.NATURE.COM/NATURE | 75
SUPPLEMENTARY INFORMATIONRESEARCHdoi:10.1038/nature22033

76
Camacho C et al. (2009) BLAST+: architecture and applications. BMC Bioinform 10:421.
Cameron A et al. (2015) Do echinoderm genomes measure up? Mar Genomics 22:1-9.
Cameron AM, Endean R, DeVantier LM (1991) Predation on massive corals: Are devastating population outbreaks of Acanthaster planci novel events? Mar Ecol Prog Ser 75:251–258.
Cannon JT et al. (2014) Phylogenomic resolution of the hemichordate and echinoderm clade. Curr Biol 24:2827–2832.
Chapman JA et al. (2011) Meraculous: de novo genome assembly with short paired-end reads. PLOS ONE 6:e23501.
Cheney DP (1973) An analysis of the Acanthaster control programs in Guam and Trust Territory of the Pacific Islands. Micronesica 9:171.
Chikhi R, Medvedev P. (2013) Informed and automated k-mer size selection for genome assembly. Bioinform 30:31-37.
Churcher AM, Taylor JS (2009) Amphioxus (Branchiostoma floridae) has orthologs of vertebrate odorant receptors. BMC Evol Biol 9:242.
Churcher AM, Taylor JS (2011) The antiquity of chordate odorant receptors is revealed by the discovery of orthologs in the cnidarian Nematostella vectensis. Genome Biol Evol 3:36-43.
Cohen E (2014) Advances in Insect Physiology: Target Receptors in the Control of Insect Pests: Part II. Elsevier, Amsterdam, 495 p.
Cole RN, Burggren WW (1981) The contribution of respiratory papulae and tube feet to oxygen uptake in the sea star Asterias forbes. Mar Biol Lett 2:279-287.
Conand C (1984) Distribution, reproductive cycle and morphometric relationships of Acanthaster planci (Echinodermata: Asteroidea) in New Caledonia, western tropical Pacific. Proc 5th Intl Echinoderm Conf:499–506.
Connell JH, Hughes TP, Wallace CC (2015) A 30-year study of coral abundance, recruitment and disturbance at several scales in space and time. Ecol Monogr 67:461-488.
Cote RG et al. (2012)The PRoteomics IDEntification (PRIDE) Converter 2 framework: an improved suite of tools to facilitate data submission to the PRIDE database and the ProteomeXchange consortium. Mol Cell Proteomics 11:1682-1689.
De’ath G, Fabricius K, Sweatman H, Puotinen M (2012) The 27-year decline of coral cover on the Great Barrier Reef and its causes. Proc Natl Acad Sci USA 109:17995-17999.
Dong G et al. (2011) Chemical constituents and bioactivities of starfish. Chem Biodiv 8:740-791.
Endean R, Chesher RH (1973) Temporal and spatial distribution of Acanthaster planci population explosions in the Indo-West Pacific region. Biol Conserv 5:87.
Farmanfarmaian A (1966) The Respiratory Physiology of Echinoderms. pp 245- 265. In Boolootian RA (editor) Physiology of Echinodermata. John Wiley & sons, New York.
Fraser N, Crawford B, Kusen J (2000) Best practices guide for crown-of-thorns clean-ups. Coastal Resources Center Coastal Management Report #2225. Proyek Pesisir, CRC/URI CRMP, NRM Secretariat, Ratu Plaza Building 18th Floor Jl. Jenderal Sudirman 9, Jakarta Selatan 10270, Indonesia, 37 pp.
WWW.NATURE.COM/NATURE | 76
SUPPLEMENTARY INFORMATIONRESEARCHdoi:10.1038/nature22033

77
Fredriksson R, Lagerstrom MC, Lundin LG, Schioth HB (2003) The G-protein-coupled receptors in the human genome form five main families. Phylogenetic analysis, paralogon groups, and fingerprints. Mol Pharm 63:1256-1272.
Galtsoff PS, Loosanoff VL (1939) Natural history and method of controlling the starfish (Asterias forbesi). Bull US Bur Fish 49:75-132.
Garlovsky DF, Bergquist A (1970) Crown-of-thorns starfish in Western Somoa. S Pac Bull 20:47
Garner D (1971) A report on the preliminary findings of a brief study on the crown-of-thorns starfish (Acanthaster planci) carried out on the island of Malaaita in the British Solomon Islands Protectorate. Regional Symp Conserv Nature – Reef and Lagoons, South Pacific Commission, Noumea, New Caledonia.
Gladstone W (1992) Observations of crown-of-thorns starfish spawning. Mar Freshw Res 43:535-537.
Gouezo M et al. (2015) Impact of two sequential super typhoons on coral reef communities in Palau. Mar Ecol Prog Ser 540:73-85.
Haas BJ et al. (2008) Automated eukaryotic gene structure annotation using evidence modeler and the program to assemble spliced alignments. Genome Biol 9:1-22.
Hellsten U et al. (2010) The genome of the Western clawed frog Xenopus tropicalis. Science 328:633-636.
Hock K, Wolff NH, Condie SA, Anthony RN, Mumby PJ (2014) Connectivity networks reveal the risks of crown-of-thorns starfish outbreaks on the Great Barrier Reef. J Appl Ecol 51:1188-1196.
Hostettmann K, Marston A (1995) Saponins. Cambridge University Press, Cambridge. 555 p.
Jones P et al. (2014) InterProScan 5: genome-scale protein function classification. Bioinformatics 30:1236-1240.
Kanayama RK (1970). The Crown-of-thorns starfish. Aloha Aina Dept Land Nat Resources Hawaii 1:16-18.
Katoh K, Kuma K, Toh H, Miyata T (2005) MAFFT version 5: improvement in accuracy of multiple sequence alignment. Nucl Acids Res 33:511–518.
Kayal M et al. (2012) Predator crown-of-thorns starfish (Acanthaster planci) outbreak, mass mortality of corals and cascading effects on reef fish and benthic communities. PLOS ONE 7:e47363.
Kenchington RA, Pearson R (1981) Crown of thorns starfish on the Great Barrier Reef; a situation report. Proc 4th Intl Coral Reef Symp 2:597-600.
Kent JW et al. (2002) The human genome browser at UCSC. Genome Res 12:996–1006.
Kettle BT, Lucas JS (1987) Biometric relationships between organ indices, fecundity, oxygen consumption and body size in Acanthaster planci (Echinodermata; Asteroidea). Bull Mar Sci 41:541–551.
Khan I et al. (2015) Olfactory receptor subgenomes linked with broad ecological adaptations in Sauropsida. Mol Biol Evol 32:2832-2843.
Krishnan A et al. (2014) The GPCR repertoire in the demosponge Amphimedon queenslandica: insights into the GPCR system at the early divergence of animals. BMC Evol Biol 14:270.
WWW.NATURE.COM/NATURE | 77
SUPPLEMENTARY INFORMATIONRESEARCHdoi:10.1038/nature22033

78
Kumar, S, Stecher G, Tamura K (2016) MEGA7: Molecular Evolutionary Genetics Analysis Version 7.0 for Bigger Datasets. Mol Biol Evol. [in press]
Lawrence JM (2013) Starfish: Biology and Ecology of the Asteroidea. John Hopkins University Press, Baltimore, 267 p.
Lee C-C, Tsai W-S, Hsieh HJ, Hwang D-F (2013) Hemolytic activity of venom from crown-of-thorns starfish Acanthaster planci. J Venom Anim Toxins Incl Trop Dis 19:22.
Lee C-C, Hsieh HJ, Hwang D-F (2014) Cytotoxic and apoptotic activities of the plancitoxin I from the venom of crown-of-thorns starfish (Acanthaster planci) on A375.S2 cells. J Appl Toxicol 35:407-417.
Li B, Dewey CN (2011) RSEM: accurate transcript quantification from RNA-Seq data with or without a reference genome. BMC Bioinform 12:323.
Li L, Stoeckert CJ, Roos DS (2003) OrthoMCL: identification of ortholog groups for eukaryotic genomes. Genome Res 13:2178-2189.
Lin LI (1989) A concordance correlation coefficient to evaluate reproducibility. Biometrics 45, 255-268.
Love MI, Huber W, Anders S (2014) Moderated estimation of fold change and dispersion for RNA-seq data with DESeq2. Genome Biol 15:550
Lucas JS, Hart RJ, Howden ME, Salathe R (1979) Saponins in eggs and larvae of Acanthaster planci (L.) (Asteroidea) as chemical defences against planktivorous fish. J Expt Mar Biol Ecol 40: 155–165.
Marcais G, Kingsford C (2011) A fast, lock-free approach for efficient parallel counting of occurrences of k-mers. Bioinform 27:764–70.
Marsh JA (1972) Past and present status of Acanthaster planci in Palau. Proc Univ Guam – Trust Territory Acanthaster planci Workshop. Tsuda RT (ed) Univ Guam Mar Lab Tec Rep No 3, 24.
Mendonça VA et al. (2010) Persistent and expanding population outbreaks of the corallivorous starfish Acanthaster planci in the Northwestern Indian Ocean: are they really a consequence of unsustainable starfish predator removal through overfishing in coral reefs, or a response to a changing environment? Zool Stud 49:108–123.
Menge BA, Freidenburg TL (2001) Keystone species. Pp 613-631. Levin SA (editor) Encyclopedia of Biodiversity. Academic Press, New York.
Menge BA, Sanford E (2013) Ecological role of sea stars from populations to meta-ecosystems. Pp 67-80. In Lawrence JM (ed) Starfish: Biology and Ecology of the Asteroidea. John Hopkins University Press, Baltimore.
Menge BA, Sanford E (2013) Ecological role of sea stars from populations to meta-ecosystems. pp 67-80. In Lawrence JM (ed) Starfish: Biology and Ecology of the Asteroidea. John Hopkins University Press, Baltimore.
Messmer V, Pratchett MS, Clark TD (2013) Capacity for regeneration in crown of thorns starfish, Acanthaster planci. Coral Reefs. 32:461-461.
Moran PJ (1986) The Acanthaster phenomenon. Ocean Marine Biol: Ann Rev 24:379-480.
Mori C et al. (2015) Through bleaching and tsunami: Coral reef recovery in the Maldives. Mar Poll Bull 98:188-200.
Moutardier G et al. (2015) Lime juice and vinegar injections as cheap and natural alternative to control COTS outbreaks. PLOS ONE 10: e0137605.
WWW.NATURE.COM/NATURE | 78
SUPPLEMENTARY INFORMATIONRESEARCHdoi:10.1038/nature22033

79
Muhando CA, Lanshammar F (2008) Ecological effects of the crown-of-thorns starfish removal programme on Chumbe Island Coral Park, Zanzibar, Tanzania. Proc 11th Int Coral Reef Symp 23:1127-1131.
Nakamura K (1972) Past and present status of Acanthaster planci in Yap Proc Univ Guam – Trust Territory Acanthaster planci Workshop. Tsuda RT (ed) Univ Guam Mar Lab Tech Rep No 3, 23.
Nakamura M, Okaji K, Higa Y, Yamakawa E, Mitarai S. (2014) Spatial and temporal population dynamics of the crown-of-thorns starfish, Acanthaster planci, over a 24-year period along the central west coast of Okinawa Island, Japan. Mar Biol 161:2521–2530
Nei M, Niimura Y, Nozawa M (2008) The evolution of animal chemosensory receptor gene repertoires: roles of chance and necessity. Nat Rev Genet 9:951-963.
Niimura Y (2009) On the origin and evolution of vertebrate olfactory receptor genes: comparative genome analysis among 23 chordate species. Genome Biol Evol 1:34-44.
Niimura Y (2012) Olfactory receptor multigene family in vertebrates: from the viewpoint of evolutionary genomics. Curr Genomics 13:103-114.
Niimura Y (2013) Identification of chemosensory receptor genes from vertebrate genomes. Meth Mol Biol 1068:95-105.
O’Hara TD, Hugall AF, Thuy B, Moussalli A (2014) Phylogenomic resolution of the class Ophiuroidea unlocks a global microfossil record. Curr Biol 24:1874-1879.
Omori M (2011) Degradation and restoration of coral reefs: Experience in Okinawa, Japan. Mar Biol Res 7:3012.
Onizuka EW (1976) Studies on the effects of crown-of-thorns starfish on marine game fish habitat. Job Progress Report, Statewide Dingell-Johnson Program, Hawaii.
Osborne K, Dolman AM, Burgess SC, Johns KA (2011) Disturbance and the dynamics of coral cover on the Great Barrier Reef (1995-200). PLOS ONE 6: e17516.
Owens D (1971) Acanthaster planci starfish in Fiji: a survey of incidence and biological studies. Fiji Agric J 33:15.
Pearson R (1981) Recovery and recolonization of coral reefs. Mar Ecol Prog Ser 4:105–122.
Porter JW (1972) Predation by Acanthaster and its effect on coral species diversity. Amer Nat 106:487-492.
Pratchett MS (2010) Changes in coral communities during an outbreak of Acanthaster planci at Lizard Island, northern Great Barrier Reef (1995-1999). Coral Reefs 29:717-725.
Pratchett MS, Caballes CF, Rivera-Posada JA, Sweatman HPA (2014) Limits to understanding and managing outbreaks of crown-of-thorns starfish (Acanthaster planci). pp 133-200. In Hughes RM, Hughes DJ, Smith IP (eds) Ocean Mar Biol Ann Rev 52. CRC Press.
Putnam NH et al. (2007) Sea anemone genome reveals ancestral eumetazoan gene repertoire and genomic organization. Science 317:86-94.
Rambaldi D, Ciccarelli FD (2009) FancyGene: dynamic visualization of gene structures and protein domain architectures on genomic loci. Bioinformatics 25:2281-2282.
Randall JE (1972) Chemical pollution and the sea and the crown-of-thorns starfish (Acanthaster planci). Biotropica 4:132.144.
Rand C, Medvedev P (2014) Informed and automated k-mer size selection for genome assembly. Bioinform 30:31–37.
WWW.NATURE.COM/NATURE | 79
SUPPLEMENTARY INFORMATIONRESEARCHdoi:10.1038/nature22033

80
Reich A, Dunn C, Akasaka K, Wessel, G. (2015) Phylogenomic analyses of Echinodermata support the sister groups of Asterozoa and Echinozoa. PLOS ONE 10:e0119627.
Richards S et al. (2008) The genome of the model beetle and pest Tribolium castaneum. Nature 452:949-955.
Riegl B, Berumen M, Bruckner A (2013) Coral population trajectories, increased disturbance and management intervention: a sensitivity analysis. Ecol Evol 3:1050-1064.
Rivera-Posada J, Owens L (2014) Osmotic shock as alternative method to control Acanthaster planci. J Coast Life Med 2:99-106.
Rivera-Posada J, Pratchett MS (2012) A review of existing control efforts for A. planci; limitations to success. Report to the Department of Sustainability, Environment, Water, Population & Communities. NERP, Tropical Environmental Hub. Townsville, 26 pp.
Rivera-Posada J, Caballes CF, Pratchett MS (2013) Lethal doses of oxbile, peptones and thiosulfate-citrate-bile-sucrose agar (TCBS) for Acanthaster planci; exploring alternative population control options. Mar Poll Bull 75:133-139.
Rivera-Posada J, Pratchett MS, Aguilar C, Grand A, Cabelles GF (2014) Bile salts and the single-shot lethal method for killing crown-of-thorns sea stars (Acanthaster planci). Ocean Coast Manag 102:383-390.
Rivera-Posada J, Prattchet M (2012) A review of existing control efforts for A. planci; limitations to successes. Report to the Department of Sustainability, Environment, Water, Population & Communities, NERP, Tropical Environmental Hub. Townsville, June 5 2012. 26 p.
Rivol G, Schiel DR (2011) Community regulation: The relative importance of recruitment and predation intensity on an intertidal community dominant in a seascape context. PLOS ONE 6: e23958.
Ronquist F et al. (2012) MrBayes 3.2: efficient Bayesian phylogenetic inference and model choice across a large model space. Syst Biol 61:539-542.
Sablan B (1972) Past and present status of Acanthaster planci in the Marshall Islands. Proc Univ Guam – Trust Territory Acanthaster planci Workshop. Tsuda RT (ed) Univ Guam Mar Lab Tech Rep No 3, 21.
Sapp J (1999) What is Natural? – Coral Reef Crisis. Oxford University Press, Oxford. 275 pp.
Savitri IKE, Ibrahim F, Sahlan M, Wijanarko A (2011) Rapid and efficient purification method of phospholipase A2 from Acanthaster planci. Int J Pharm Bio Sci 2:401-406.
Schiffels S, Durbin, R (2014) Inferring human population size and separation history from multiple genome sequences. Nat Genet 46:919-925.
Schleyer MH, Celliers L (2003) Biodiversity on the marginal coral reefs of South Africa: what does the future hold? Zool Verh 345:387–400.
Semmens DC et al. (2013) Discovery of a novel neurophysin-associated neuropeptide that triggers cardiac stomach contraction and retraction in starfish. J Exp Biol 216:4047-4053.
Shiomi K, Midorikawa S, Ishida M, Nagashima Y, Nagai H (2004) Plancitoxins, lethal factors from the crown-of-thorns starfish Acanthaster planci, are deoxyribonucleases II. Toxicon 44:499-506.
Sluka RD, Miller MW (1999) Status of crown-of-thorns starfish in Laamu Atoll, Republic of Maldives. Bull Mar Sci 65:253–258.
WWW.NATURE.COM/NATURE | 80
SUPPLEMENTARY INFORMATIONRESEARCHdoi:10.1038/nature22033

81
Shashoua VE (1991) Ependymin, a brain extracellular glycoprotein, and CNS plasticity. Ann. N. Y. Acad. Sci. 627:94-114.
Shinzato C et al. (2011) Using the Acropora digitifera genome to understand coral responses to environmental change. Nature 476:320-323.
Shoguchi E et al. (2013) Draft assembly of the Symbiodinium minutum nuclear genome reveals dinoflagellate gene structure. Curr Biol 23:1399–1408.
Simakov O et al. (2013) Insights into bilaterian evolution from three spiralian genomes. Nature 493:526-531.
Simakov O et al. (2015) Hemichordate genomes and deuterostome origins. Nature 527:459–65.
Sodergren E et al. (2006) The genome of the sea urchin Strongylocentrotus purpuratus. Science 314:941-952.
Srivastava M et al. (2008) The Trichoplax genome and the nature of placozoans. Nature 454:955-960.
Srivastava M et al. (2010) The Amphimedon queenslandica genome and the evolution of animal complexity. Nature 466:720-726.
Stump R (1990) Life history characteristics of Acanthaster planci populations, potential clues to causes of outbreaks. pp 105-118. In Engelhardt U, Lassig B (eds) The Possible Causes and Consequences of Outbreaks of the crown-of-thorns Starfish. GBRMPA Workshop Series No. 18.
Suárez-Castillo EC, García-Arrarás JE (2007) Molecular evolution of the ependymin protein family: a necessary update. BMC Evol Biol 7:23.
Sweatman H, Delean S, Syms C (2011) Assessing loss of coral cover loss on Australia’s Great Barrier Reef over two decades, with implications for longer term trends. Coral Reefs 30:521-531.
Takemura F et al. (2015) Development of an acetic acid injection device for crown-of-thorns starfish controlled by a remedy operated underwater robot. J Robot Mech 27: 571-580.
Takeuchi T et al. (2016) Bivalve-specific gene expansion in the pearl oyster genome: implications of adaptation to a sessile lifestyle. Zool Lett 2:3.
Telford MJ et al. (2014) Phylogenomic analysis of echinoderm class relationships supports Asterozoa. Proc R Soc. Lond B Biol Sci 281:20140479.
Timmers MA, Bird CE, Skillings DJ, Smouse PE, Toonen R (2012) There’s no place like home: crown-of-thorns outbreaks in the central Pacific are regionally derived and independent events. PLOS ONE 7:e31159.
Tsuda RT (1972) History of Acanthaster planci in Guam and the Trust Territory. Proc Univ Guam – Trust Territory Acanthaster planci Workshop. Tsuda RT (ed) Univ Guam Mar Lab Tech Rep No 3, 4.
Tusnady GE, Simon I (2001) The HMMTOP transmembrane topology prediction server. Bioinform 17:849-850.
Van Lenteren JC (1988) Implementation of biological control. Amer J Alt Agric 3:102-109.
Vizcaino JA et al. (2016) Update of the PRIDE database and its related tools. Nucleic Acids Res 44:D447-456.
Vizcaino JA et al. (2104) ProteomeXchange provides globally coordinated proteomics data submission and dissemination. Nature Biotech 32:223-226.
WWW.NATURE.COM/NATURE | 81
SUPPLEMENTARY INFORMATIONRESEARCHdoi:10.1038/nature22033

82
Wass RC (1973) Acanthaster population levels and control efforts on Ponape, Eastern Caroline Islands. Micronesica 9:167.
Wilkinson C (2000) Status of the Coral Reefs of the World: 2000. Townsville, Australia, Global Coral Reef Monitoring Network and Reef and Rainforest Research Centre.
Yamaguchi M (1973) Early life history of coral reef asteroids with special reference to Acanthaster planci. pp 369-387. In Jones OA, Endean R (eds) Biology and Geology of Coral Reefs. Vol. II, Biology 1. Academic Press, New York.
Yamaguchi M (1975) Coral-reef asteroids of Guam. Biotropica 7:12-23.
Yamaguchi M (1977) Larval behaviour and geographical distribution of coral reef asteroids in the Indo-West Pacific. Micronesica 13:283-296.
Yamaguchi M (1986) Acanthaster planci infestations of reefs and coral assemblages in Japan: a retrospective analysis of control efforts. Coral Reefs 5:23-30.
Yamamoto T, Otsuka T (2013) Experimental validation of dilute acetic acid solution injection to control crown-of-thorns starfish (Acanthaster planci). Naturalistae 17:63-65.
Yamazato K (1969) Acanthaster planci, a coral predator. Kon-nichi no Ryukyu 13:7.
Yasuda N, Nagai S, Hamaguchi M, Okaji K, Gérard K (2009) Gene flow of Acanthaster planci (L.) in relation to ocean currents revealed by microsatellites analysis. Mol Ecol 18:1574-1590.
Yasumoto T, Watanabe T, Hashimoto Y (1964) Physiological activities of starfish saponins. Bull Jap Soc Sci Fish 30:357-364.
Zann L, Bell L (1991) The effects of the crown-of-thorns starfish on Samoan Reefs. FAO/UNDP SAM/89/002 Field Report No. 8.
Zann L, Brodie J, Vuki V (1990) History and dynamics of the crown-of-thorns starfish Acanthaster planci (L.) in the Suva area, Fiji. Coral Reefs 9:135-144.
Zann LP, Weaver K (1988) An evaluation of crown-of-thorns starfish control programs undertaken on the Great Barrier Reef. Proc 6th Intl Coral Reef Symp 2:183-188.
WWW.NATURE.COM/NATURE | 82
SUPPLEMENTARY INFORMATIONRESEARCHdoi:10.1038/nature22033