Embed Size (px)
Citation preview

Supplemental Materials: Appendices
Appendix 1: Search strategy (A and B)
Appendix 2: List of experts contacted
Appendix 3: Detailed characteristics of included studies
Appendix 4: Risk of bias assessment of included studies
Appendix 5: Additional forest plots (Figures S1-S11)
Appendix 6: Immunological assessment and outcomes (immunoglobulin analysis)
Appendix 7: Immunological assessment and outcomes (cytokine analysis)
Appendix 8: On-going/unpublished studies

Appendix 1: Search strategy A for MEDLINE, EMBASE, GLOBAL HEALTH,
AMED and CAB
1. exp Food Hypersensitivity/
2. exp Milk Hypersensitivity/
3. exp Egg Hypersensitivity/
4. exp Peanut Hypersensitivity/
5. exp Tree nut Hypersensitivity/
6. exp Nut Hypersensitivity/
7. ((food or Oral Allergy Syndrome or milk or egg or peanut or arachis hypogaea or
tree nut or hazelnut or brazil nut or walnut or chestnut or pistachio or almond or
legumes or wheat or soy or fish or seafood or shellfish or shrimp or lobster or crab or
crawfish or kiwi or apple or peach or apricot or cherry or pear or plum or tomato or
green pea or potato or carrot or parsley or celery or additives) adj3 (allerg* or
hypersensitivit*)).mp. [mp=title, original title, abstract, name of substance word,
subject heading word, unique identifier]
8. 1 or 2 or 3 or 4 or 5 or 6 or 7
9. exp Desensitization, Immunologic/
10. exp Immunotherapy/
11. Desensitis?ation.mp. [mp=title, original title, abstract, name of substance word,
subject heading word, unique identifier]
12. Immunotherapy.mp. [mp=title, original title, abstract, name of substance word,
subject heading word, unique identifier]
13. Oral Immunotherapy.mp. [mp=title, original title, abstract, name of substance
word, subject heading word, unique identifier]
14. Oral desensiti?ation.mp. [mp=title, original title, abstract, name of substance
word, subject heading word, unique identifier]
15. Specific oral tolerance induction.mp.
16. Oral tolerance induction.mp.
17. Sublingual Immunotherapy.mp.
18. Specific Immunotherapy.mp.
19. 9 or 10 or 11 or 12 or 13 or 14 or 15 or 16 or 17 or 18
20. exp Intervention Studies/
21. Intervention Studies.mp. [mp=title, original title, abstract, name of substance
word, subject heading word, unique identifier]
22. Analytical stud*.mp. [mp=title, original title, abstract, name of substance word,
subject heading word, unique identifier]
23. Experimental stud*.mp. [mp=title, original title, abstract, name of substance word,
subject heading word, unique identifier]
24. Etiology.mp. [mp=title, original title, abstract, name of substance word, subject
heading word, unique identifier]
25. exp Clinical Trial/
26. Trial.mp. [mp=title, original title, abstract, name of substance word, subject
heading word, unique identifier]
27. Clinical Trial.mp. [mp=title, original title, abstract, name of substance word,
subject heading word, unique identifier]

28. exp Controlled Clinical Trial/
29. Controlled Clinical Trial.mp. [mp=title, original title, abstract, name of substance
word, subject heading word, unique identifier]
30. Uncontrolled Trial.mp. [mp=title, original title, abstract, name of substance word,
subject heading word, unique identifier]
31. Randomi?ed Controlled Trial.mp. [mp=title, original title, abstract, name of
substance word, subject heading word, unique identifier]
32. Quasi-randomi?ed trial.mp. [mp=title, original title, abstract, name of substance
word, subject heading word, unique identifier]
33. Non-randomi?ed trial.mp. [mp=title, original title, abstract, name of substance
word, subject heading word, unique identifier]
34. exp Placebos/
35. Placebos.mp. [mp=title, original title, abstract, name of substance word, subject
heading word, unique identifier]
36. exp Random Allocation/
37. Random Allocation.mp. [mp=title, original title, abstract, name of substance word,
subject heading word, unique identifier]
38. exp Double-Blind Method/
39. Double-Blind Method.mp. [mp=title, original title, abstract, name of substance
word, subject heading word, unique identifier]
40. Double-Blind design.mp. [mp=title, original title, abstract, name of substance
word, subject heading word, unique identifier]
41. exp Single-Blind Method/
42. Single-Blind Method.mp. [mp=title, original title, abstract, name of substance
word, subject heading word, unique identifier]
43. Single-Blind design.mp. [mp=title, original title, abstract, name of substance
word, subject heading word, unique identifier]
44. Triple-Blind Method.mp. [mp=title, original title, abstract, name of substance
word, subject heading word, unique identifier]
45. Random*.mp. [mp=title, original title, abstract, name of substance word, subject
heading word, unique identifier]
46. 20 or 21 or 22 or 23 or 24 or 25 or 26 or 27 or 28 or 29 or 30 or 31 or 32 or 33
or 34 or 35 or 36 or 37 or 38 or 39 or 40 or 41 or 42 or 43 or 44 or 45
47. 8 and 19 and 46
Search strategy B for The Cochrane Library, LILACS, TRIP, CINAHL, ISI
Web of Science and BIOSIS
(Food hypersensitivity OR food allergy OR Oral Allergy Syndrome OR milk allergy
OR egg allergy OR nut allergy OR peanut allergy OR arachis hypogaea allergy OR
tree nut allergy OR hazelnut allergy OR legumes allergy OR wheat allergy OR soy
allergy OR fish allergy OR seafood allergy OR shellfish allergy OR kiwi allergy OR
apple allergy OR peach allergy OR additives hypersensitivity OR additives allergy)
AND
(Immunologic, desensiti*, OR immunotherapy OR oral immunotherapy OR
sublingual immunotherapy OR oral desensiti* OR Specific Oral Tolerance Induction
OR Oral Tolerance Induction)
AND
(Analytical stud* OR intervention stud* OR experimental stud* OR trial OR clinical
trial* OR controlled clinical trial OR uncontrolled trial OR randomi* controlled trial
OR quasi randomi* OR non randomi* OR random allocation OR single blind method
OR double blind method OR triple blind method OR random*)
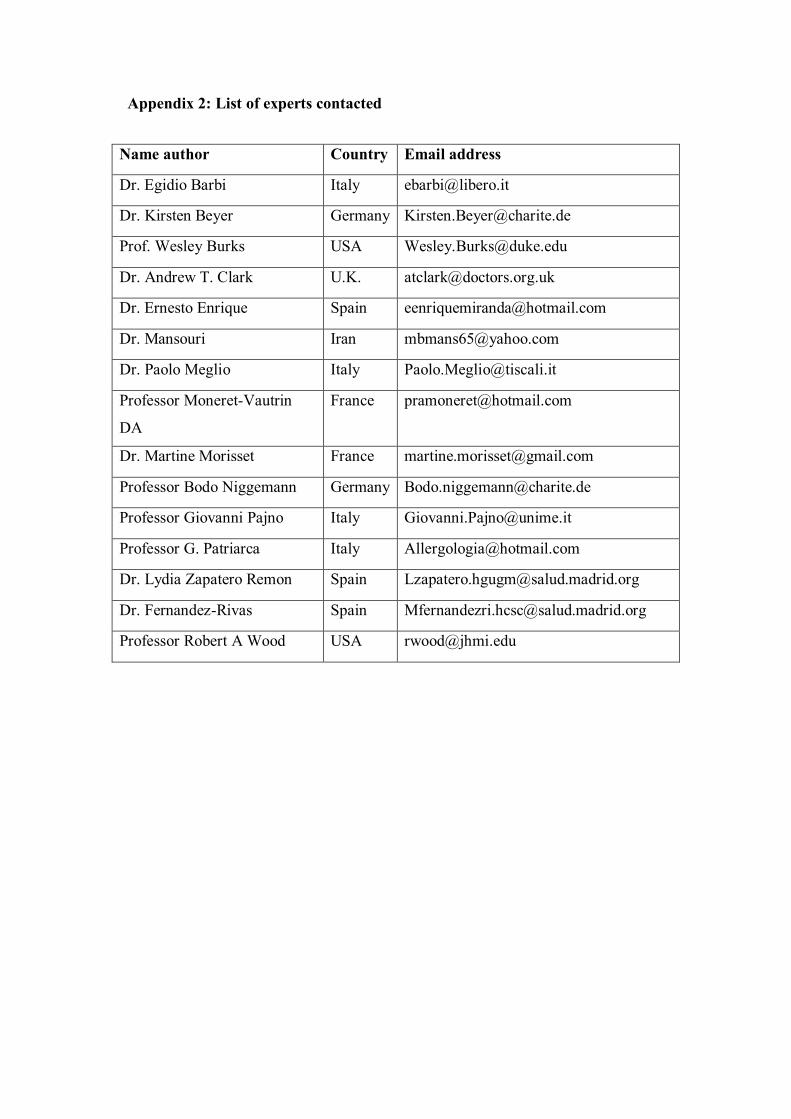
Appendix 2: List of experts contacted
Name author Country Email address
Dr. Egidio Barbi Italy [email protected]
Dr. Kirsten Beyer Germany [email protected]
Prof. Wesley Burks USA [email protected]
Dr. Andrew T. Clark U.K. [email protected]
Dr. Ernesto Enrique Spain [email protected]
Dr. Mansouri Iran [email protected]
Dr. Paolo Meglio Italy [email protected]
Professor Moneret-Vautrin
DA
France [email protected]
Dr. Martine Morisset France [email protected]
Professor Bodo Niggemann Germany [email protected]
Professor Giovanni Pajno Italy [email protected]
Professor G. Patriarca Italy [email protected]
Dr. Lydia Zapatero Remon Spain [email protected]
Dr. Fernandez-Rivas Spain [email protected]
Professor Robert A Wood USA [email protected]

Appendix 3: Detailed characteristics of included studies
Study Patients
characteristic
s/
diagnosis
criteria
Design Foods Type of immunotherapy Clinical outcomes Immunologic outcomes
H1 H2 OD OT R
R
Adverse events/
medication use
SRs LRs SPT TIgE/
SpIgE
IgG/
IgG4
Other
Burks,
2012
55 children
aged 5 to 11
years (median
7); HE OIT -
40;
placebo=15;
inclusion
criteria:
clinical history
of egg allergy
(development
of allergic
symptoms
within minutes
to 2 hours after
ingesting egg);
serum egg-
specific IgE
antibody level
> 5 kU/l (≥ 6
years), or > 12
kU/l (5 year
old)
Randomised
double-blind
placebo-
controlled trial
HE Initial dose-
escalation
(clinical research
setting), build-
up, and
maintenance
phases double
blind placebo
controlled until
5g egg white
challenge at 10
months. Open
label thereafter
Placebo then
discontinued,
OIT group on
maintenance
until 22 months
Children who
successfully
passed the 10g
challenge at 22
months
discontinued
oral
immunotherapy
and avoided all
egg consumption
until 10g
(+whole cooked
egg) food
challenge at 24
months, to test
for sustained
unresponsivenes
s.
Children who
passed this
challenge at 24
months were
placed on a diet
with ad libitum
egg consumption
and were
evaluated for
continuation of
sustained
unresponsivenes
s at 30 months
and 36 months.
After 10 months
of therapy, none
of the children
who received
placebo and 55%
of those who
received oral
immunotherapy
passed the oral
food challenge
and were
considered to be
desensitized;
After 22 months,
75% of children
in the oral-
immunotherapy
group were
desensitized.
In the oral-
immunotherapy
group, 28% (11
of 40
children) passed
the oral food
challenge at 24
months and were
considered to
have sustained
unresponsivenes
s.
At 30 months
and 36 months,
all children who
had passed the
oral food
challenge at 24
months were
consuming egg.
Adverse
events, 25.0%
of 11,860
doses of oral
immunotherap
y with egg and
3.9% of 4018
doses of
placebo.
Respiratory &
skin 3.2% of
4018 placebo
doses, 12.2%
of 11860 OIT
doses
Oral or
pharyngeal
78% of OIT
doses 20% of
placebo
(p<0.001)
In the oral-
immunotherap
y group, 78%
of
children had
oral or
pharyngeal
adverse events,
as compared
with 20% of
those in the
placebo
group
(P<0.001).
After 10
months, the
rate of
symptoms in
the oral-
immunotherap
y group
decreased to
8.3% of 15,815
doses (data not
shown)
SPT wheal
sizes
decreased
significantly
more from
baseline to
Month 22
among OIT
subjects Vs
placebo
group
(p=0.02)
When
positive skin
tests were
measured
with end-
point
titration, egg
OIT subjects
had a
median 1-
log
decrease,
whereas
placebo
recipients
had no
change
(p=0.009).
The median
reduction in
egg-specific
IgE levels
from baseline
to Month 22
(-5.9 [range: -
94.6, 16.6]
kUA/L) for
egg OIT was
not
significantly
greater
(p=0.06) than
that for
placebo (-1.9
range [-23.5,
37.1]
kUA/L).
The median
change from
baseline to
Month 22 in
egg-specific
IgG4 levels in
the egg OIT
group
(median: 48.5
[range: -0.1,
162.1]
kUA/L,
p<0.001) was
significantly
higher than
that for
placebo.
Basophil
activation
decreased
more during
therapy in the
egg OIT
group
compared
with the
placebo group
and these
differences
were
statistically
significant
(0.01 ug/mL
stimulus,
p=0.002; 0.1
ug/mL
stimulus ,
p=0.001).
Caminiti,
2009
13 children of
both sexes (8
boys) aged 5-
10 yrs (mean
age 8yrs);oral
Randomised
double-blind
placebo-
controlled
design for 6
CM The desensitization
schedule started
with one drop of
whole CM diluted
1:25 every week,
Full
tolerance
(200 ml of
milk) was
achieved in
1 child in the double-blind
group with 4 ml of CM had
urticaria, rhinitis, throat
pruritis, vomiting, and
circulatory collapse; he was
1 in the
double-blind
group and 2
patients in the
open study
Baseline
data - SPT
for the
confirmation
of diagnosis
Baseline data
- Specific
IgE was
measured for
the
Study Patients
characteristic
s/
diagnosis
criteria
Design Foods Type of immunotherapy Clinical outcomes Immunologic outcomes
H1 H2 OD OT R
R
Adverse events/
medication use
SRs LRs SPT TIgE/
SpIgE
IgG/
IgG4
Other
desensitization
– 10; placebo –
3;only 6
patients were
randomised to
double-blind
desensitization
with milk or
soy formula as
placebo; the
diagnosis of
CMA was
based on
clinical
history, SPT,
SpIgE,
DBPCFC
patients only
7 patients
underwent the
protocol in
open fashion
then doubled
weekly until the
18th week to
achieve an intake of
200 ml in ≈ 4
months; all doses
were administered
at the clinic under
medical supervision
7 children;
in 2
children
failed,
because of
severe
reactions;
1patient
achieved a
partial
tolerance
(64 ml of
milk)
treated with i.m.
epinephrine;antihistamines;i.
v. corticosteroids and
gradually recovered; the
desensitisation stopped;
1 patient in the open study
group with 4 ml of CM had
rhinitis, cough, asthma,
generalised urticaria, and
laryngeal edema; he received
i.m. epinephrine and
corticosteroids; oral
antihistamines; inhaled
salbutamol and promptly
recovered.
1 patient achieved a partial
tolerance because with the
dose of 64 ml she developed
urticaria, angioedema,
cough; i.m. antihistamines
and corticosteroids were
introduced
group had
throat pruritis,
gritty eyes,
watery eyes,
abdominal
pain, transient
erythema (face
and hands); no
medication has
been taken
confirmation
of diagnosis
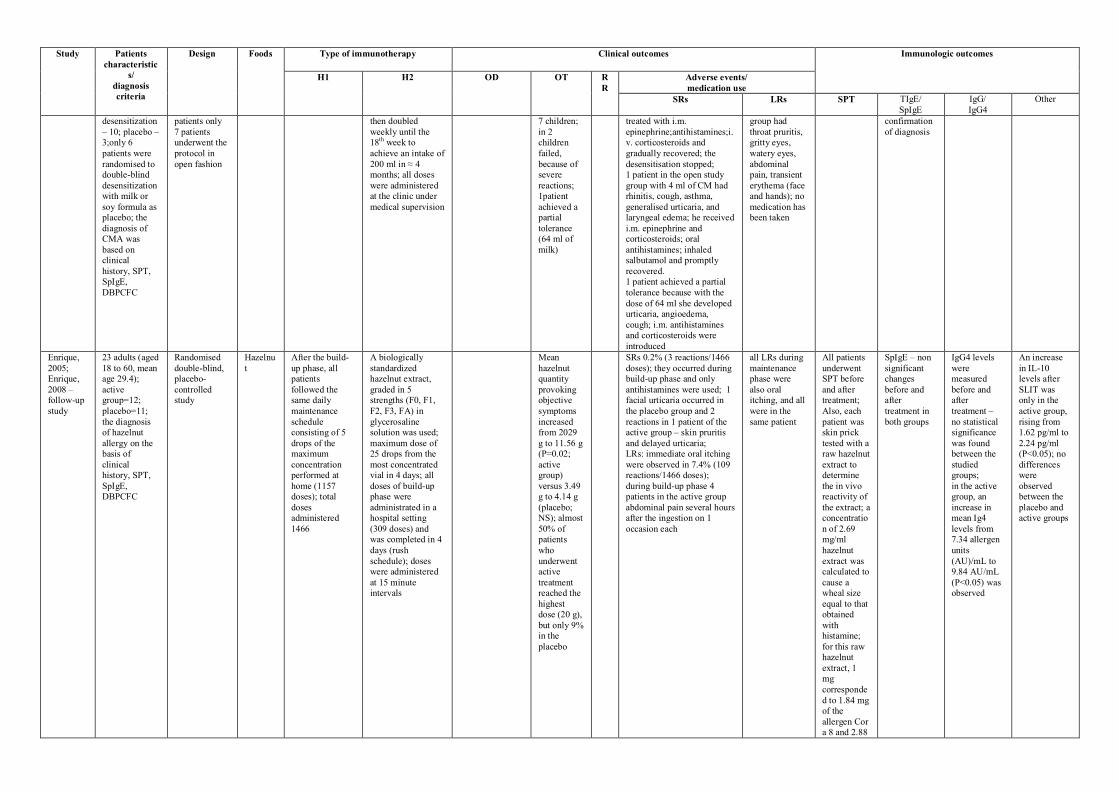
Enrique,
2005;
Enrique,
2008 –
follow-up
study
23 adults (aged
18 to 60, mean
age 29.4);
active
group=12;
placebo=11;
the diagnosis
of hazelnut
allergy on the
basis of
clinical
history, SPT,
SpIgE,
DBPCFC
Randomised
double-blind,
placebo-
controlled
study
Hazelnu
t
After the build-
up phase, all
patients
followed the
same daily
maintenance
schedule
consisting of 5
drops of the
maximum
concentration
performed at
home (1157
doses); total
doses
administered
1466
A biologically
standardized
hazelnut extract,
graded in 5
strengths (F0, F1,
F2, F3, FA) in
glycerosaline
solution was used;
maximum dose of
25 drops from the
most concentrated
vial in 4 days; all
doses of build-up
phase were
administrated in a
hospital setting
(309 doses) and
was completed in 4
days (rush
schedule); doses
were administered
at 15 minute
intervals
Mean
hazelnut
quantity
provoking
objective
symptoms
increased
from 2029
g to 11.56 g
(P=0.02;
active
group)
versus 3.49
g to 4.14 g
(placebo;
NS); almost
50% of
patients
who
underwent
active
treatment
reached the
highest
dose (20 g),
but only 9%
in the
placebo
SRs 0.2% (3 reactions/1466
doses); they occurred during
build-up phase and only
antihistamines were used; 1
facial urticaria occurred in
the placebo group and 2
reactions in 1 patient of the
active group – skin pruritis
and delayed urticaria;
LRs: immediate oral itching
were observed in 7.4% (109
reactions/1466 doses);
during build-up phase 4
patients in the active group
abdominal pain several hours
after the ingestion on 1
occasion each
all LRs during
maintenance
phase were
also oral
itching, and all
were in the
same patient
All patients
underwent
SPT before
and after
treatment;
Also, each
patient was
skin prick
tested with a
raw hazelnut
extract to
determine
the in vivo
reactivity of
the extract; a
concentratio
n of 2.69
mg/ml
hazelnut
extract was
calculated to
cause a
wheal size
equal to that
obtained
with
histamine;
for this raw
hazelnut
extract, 1
mg
corresponde
d to 1.84 mg
of the
allergen Cor
a 8 and 2.88
SpIgE – non
significant
changes
before and
after
treatment in
both groups
IgG4 levels
were
measured
before and
after
treatment –
no statistical
significance
was found
between the
studied
groups;
in the active
group, an
increase in
mean Ig4
levels from
7.34 allergen
units
(AU)/mL to
9.84 AU/mL
(P<0.05) was
observed
An increase
in IL-10
levels after
SLIT was
only in the
active group,
rising from
1.62 pg/ml to
2.24 pg/ml
(P<0.05); no
differences
were
observed
between the
placebo and
active groups

Study Patients
characteristic
s/
diagnosis
criteria
Design Foods Type of immunotherapy Clinical outcomes Immunologic outcomes
H1 H2 OD OT R
R
Adverse events/
medication use
SRs LRs SPT TIgE/
SpIgE
IgG/
IgG4
Other
mg of the
allergen Cor
a 1
Fernandez
-
Rivas,
2009;
Garcia,
2010 –
follow-up
study
18-65 y.o.
randomised to
active [(n=33)
(a Pru p 3
quantified
peach extract)]
or placebo
[(n=16)
(similar
solution
without peach
allergen)] in
2:1 proportion
during 6
months; the
tolerance
(DBPCFC),
immunological
changes (SPT,
SpIgE, IgG4)
and clinical
efficacy
(nature,
severity and
causal relation
with the
treatment of
every adverse
events) were
evaluated; the
diagnosis of
peach allergy
on the basis of
clinical
history, SPT,
SpIgE,
DBPCFC
Randomised
double-blind,
placebo-
controlled trial
Peach Home
maintenance (6
months)
Monday,
Wednesday and
Friday 1 dose
10.0 µg of Pru p
3 peach extract;
patients visited
the clinics once a
month
Rush build-up
phase (hospital):1st
day – 3 doses (0.22
µg) of Pru p 3; 2-nd
day – 3 doses (1.12
µg); 3rd day – 3
doses (5.60 µg); 4th
day – 3 doses (28.0
µg); 5th day – 1
dose (50 µg);
sublingual-swallow
technique
comprised four
vials containing
0.4, 2, 10 and 50
µg/ml of Pru p 3 or
placebo; diary cards
for recording any
adverse event
Tolerance
was
assessed
with a
careful
recording of
adverse
events.
The main
efficacy
outcome
was the
change in
the
response to
a DBPCFC
with peach;
after 6
months of
SLIT in the
active
group the
dose of Pru
p 3 needed
to induce
LR or SR
were 9 (32)
and 3 (31)
times
higher
respectively
; inter
group
differences
at T6 for
SR were
almost
significant
(Log Rank
test,
P=0.06)
SRs 16 occasions [(14 in the
build-up phase (skin
reactions in 6 patients, 1
rhinoconjunctivitis, 7 gastric
complaints)]; 1
rhinoconjunctivitis during
the hospital maintenance
week, 1 gastrointestinal
complaints during the home
maintenance; all SRs were
mild and subsided either
spontaneously or with oral
antihistamines, antacids
and/or omeprazol;
Placebo group: 3 SRs 1 in
the build-up phase
(cutaneous itching), and 2 in
the first maintenance week
(1 angioedema and 1
diarrhea)
Total 1480
adverse
events(no
serious; 1344
in the active
group, and 12
in the placebo
group
p<0.0001)
Active group:
LRs 98.8%
(n=1328);
mostly during
build-up phase
and the first
maintenance
week
(P=0.014);
94.9%
(n=1260)
located on the
oropharynx,
others gastric
complaints
SPTs were
performed
before (T0),
after 1
month if
treatment
(T1), and at
the end of
the trial
(T6); after
treatment
the patients
had a
significant
decrease in
SPT (5.3
times)
compared to
controls
Serum
samples of
SpIgE were
collected at
T0; T1, and
T6; SpIgE
showed a
significant
increase both
in the active
(P<0.001)
and placebo
(P=0.025)
groups,
although the
increase
remained
only
significant at
T6 in the
former
(active 4.23,
P<0.001;
placebo 4.04,
P=0.079, T-
test); no
significant
inter-group
differences
were
observed
(P=0.456);
none of the
patients with
negative IgE
to rPru p 3 at
T0 converted
to positive at
T1 or T6
IgG4 was
collected at
T0; T1; T6;
IgG4 to nPru
p3 showed a
different
evolution
between
groups
(P=0.022)
with a
significant
increase in
the active arm
(P=0.007) not
observed in
the placebo
one
(P=0.185)
Fleischer,
2013
40 subjects
aged 12 to 37
years old
(median 15);
male 68%;
were enrolled
in a
randomized,
double-blind,
placebo
controlled
study;
Randomized
double-blind,
placebo-
controlled
multicentre
trial
Peanut Dosing started at
0.000165 mg of
peanut protein or
placebo
escalation
through 660 ug
occurred every 2
weeks, 660ug
attained at 12
weeks. 3 doses
attempted at a
minimal interval
of 30 minutes. If
subjects failed 3-
The primary end
point was the
percentage of
desensitized
subjects
measured with
5-g peanut
powder OFC
performed 44
weeks after
initiation of
therapy (Week
44 Unblinding
OFC); subjects
Only 1 out of 127 adverse
events required epinephrine
and oral antihistamine
Only 127
(1.1%) of
11,854 total
doses required
treatment
during the first
phase: 125
(1.1%), oral
antihistamine
only; 1
(0.01%),
albuterol only
No
significant
difference
between
SLIT and
placebo
Sp IgE Week
44 peanut sp
IgE 35.8 (3.3
to 75.0) in
SLIT vs 20.1
(4.1 to 80.3)
in placebo
(NS).
Increase
between
baseline and
wk 44 in
SLIT
Sp IgG4
Week 44 sp
IgG4 0.7 (0.4
to 2.3) SLIT
vs 0.5 (0.2 to
0.7) placebo
(NS).
Increase
between
baseline and
wk 44 in
SLIT.
Basophil
activation %
CD63+
values were
significantly
lower for
Peanut SLIT
subjects
compared
with Placebo
subjects for
the 10-2
mg/mL crude
peanut

Study Patients
characteristic
s/
diagnosis
criteria
Design Foods Type of immunotherapy Clinical outcomes Immunologic outcomes
H1 H2 OD OT R
R
Adverse events/
medication use
SRs LRs SPT TIgE/
SpIgE
IgG/
IgG4
Other
inclusion
criteria:
Clinical history
or physician’s
diagnosis of
peanut allergy,
positive peanut
SPT response
(wheal
diameter
>3mm) or
detectable
peanut-specific
IgE (PN-IgE;
>0.35 kilounits
of antibody per
liter [kUA/L]),
positive
baseline
DBPCFC to
peanut
(defined as
objective
allergic
symptoms at a
cumulative
dose of <2 g of
peanut
powder).
dose escalations
after 3
consecutive
biweekly
attempts, 1- or 2-
dose biweekly
escalations were
allowed
subsequently.
After each
observed dose,
subjects
continued the
same daily dose
at home for 2
weeks. After 660
ug was achieved,
single dose
increases
occurred,
followed by 2
weeks of
maintenance
therapy of
1,386ug/d;
Phase 1 subjects
took a minimum
dose of 165ug
and a maximum
maintenance
dose of 1386 ug
of peanut protein
or placebo
(420umL) at
home on a daily
basis for the
maintenance
period until the
Week 44
Unblinding 5-g
DBPCFC. After
unblinding,
subjects
receiving active
peanut SLIT
continued on
maintenance
dosing with a
10-g OFC after
approximately 1
year of
maintenance
therapy;
Phase 2 Placebo
subjects crossed
over to active
peanut SLIT and
were escalated to
successfully
consuming 5 g
or at least 10-
fold more peanut
powder than the
baseline OFC
threshold were
considered
responders 70%
(14) SLIT
responders 15%
placebo
responders
p<0.001;
The median
successfully
consumed dose
(SCD) at Week
44 was
significantly
higher than the
baseline OFC for
Peanut SLIT
subjects (371 vs
21 mg,
respectively; P
5.01) but not for
Placebo subjects
(146 vs 71 mg,
respectively; P
=.14). However,
the median SCD
after 44 weeks of
therapy was not
significantly
different
between
treatment groups
(P=0.16).
All Week 44
responders still
being followed
were Week 68
responders. The
median SCD
increased to 996
mg, and this was
significantly
higher than at
Week 44 (P
=.05) and
baseline (P
=.009)
stimulant (P
=008) and the
10-3 mg/mL
crude peanut
stimulant (P
=.049)
indicating a
weak effect
on basophil
activation.

Study Patients
characteristic
s/
diagnosis
criteria
Design Foods Type of immunotherapy Clinical outcomes Immunologic outcomes
H1 H2 OD OT R
R
Adverse events/
medication use
SRs LRs SPT TIgE/
SpIgE
IgG/
IgG4
Other
a maximum
maintenance
dose of 3696mg
(1120mL).A5-g
Crossover OFC
was performed
after 44 weeks of
SLIT therapy
Kim, 2011 18 children
aged between
1 and 11 years
were enrolled
in a double-
blind, placebo
controlled
study
(active=11;
placebo=7).
The diagnosis
based on a
physician-
documented
clinical
history, a
CAP-FEIA
peanut-specific
IgE level of 7
kU/L or
greater; SPTs
to peanut were
not required
for enrolment
Randomised
double-blind
placebo-
controlled
design for 18
subjects who
underwent 6
months of
dose
escalation and
6 months of
maintenance
dosing
followed by a
DBPCFC
Peanut All observed dosing
was performed in
the hospital. The
active group
received dilutions
of crude peanut
extract (1:20
wt/vol) dissolved in
0.2% phenol and
50% to 55%
glycerinated saline
(max peanut
concentration 5000
µg/ml. The placebo
group received a
glycerinated saline
solution + phenol
with caramel
coloring (doses 1 to
8 pumps (50 µL per
pump). The first
day the starting
dose was 0.25 µg of
peanut protein (1
pump of 1:1000
dilution). Subjects
then returned for 13
biweekly observed
dose-escalation
visits. After each
observed dose
escalation, subjects
continued the same
dose daily at home
for 2 weeks. When
the maintenance
dose reached 2000-
µg of peanut
protein (8 pumps of
1:1 stock dilution) ,
subjects continued
daily maintenance
dosing at home for
approximately 6
months
In active group
the 12 mo
DBPCFC
subjects had a
significant
increase in
reaction
threshold after
safely ingesting
a median
cumulative dose
of 1710mg of
peanut protein (a
20-fold greater
amount of
peanut protein
and
approximately
equivalent to 6-7
peanuts). In
control group the
subjects only
safely ingested a
median
cumulative dose
of 85 mg (<1
peanut) and this
level of
desensitization is
significant
One (0.02%) subject had
mild wheezing which
required albuterol
Skin symptoms 0.6% active,
6.5% control
Reactions were
reported with
11.5% of
peanut doses
and 8.6% of
placebo doses.
In active group
most of the
symptoms
were transient
oropharyngeal
itching (9.3%),
whereas skin
itching was
most common
for those
receiving
placebo
(6.5%). Of the
4182 active
peanut doses,
11 (0.26%)
home doses
required
antihistamines,
no epinephrine
required for
whole study.
Titrated SPT
were
performed at
baseline; 4
months; 8
months, and
the day of
the
DBPCFC;
SPT
responses
after 12
months of
SLIT were
significantly
smaller in
the active
group
compare to
placebo
(P=0.020)
Active SPT
4mm range
0-11 vs.
control
11.5mm
range 3.5-
2.1
Serum for
SpIgE was
obtained at
baseline; 4
months; 8
months, and
the day of the
DBPCFC;
Specific IgE
levels in the
active group
saw
statistically
significant
rise compare
to placebo
over the
initial 4
months
(P=0.002)
and then over
the remaining
8 months
decreased
(P=0.003)
Serum for
IgG4 was
obtained at
baseline; 4
months; 8
months, and
the day of the
DBPCFC;
IgG4 levels in
the active
group
increased
significantly
during 12
months
compare to
placebo
(P=0.014)
Whole blood
for basophil
activation
was obtained
at baseline
and the day of
the DBPCFC;
There was
decreased
basophil
responsivenes
s after
stimulation
with peanut in
the active
group
(P=0.009).
IL-5 levels
decreased
after 12
months
(P=0.015).
IL-13 levels
in the active
treatment
group
decreased
after 12
months.
However, this
level was not
significant
compared
with that in
the placebo
group
(P=0.06)
No difference
in IL-10,
IFN-γ, Treg
Lacono,
2013
20 children
aged between
5 and 11 years
pld (median 7
years 7
Randomised,
not blinded
clinical trial
Raw HE SOIT done at
home and in day
hospital with
raw hens egg
emulsion; initial
No child
could
tolerate
40ml of egg
in a single
All children in
SOTI group
had side effects
53 events,
none required
SOTI vs
control at 6
months
SPT 5 (4–
13) vs 10
SOTI vs
control at 6
months
Sp IgE 8.7
(3.3–17) vs
Study Patients
characteristic
s/
diagnosis
criteria
Design Foods Type of immunotherapy Clinical outcomes Immunologic outcomes
H1 H2 OD OT R
R
Adverse events/
medication use
SRs LRs SPT TIgE/
SpIgE
IgG/
IgG4
Other
months); male
50%; were
enrolled in a
randomised
controlled trial.
Inclusion
criteria: i) ≥t 1
anaphylactic
reaction after
accidental egg
exposure
within 12
months of pre-
enrolment; (ii)
previous
SPT/IgE
positive for
egg
(iii) a positive
DBPCFC at
≤0.9 ml of raw
egg emulsion.
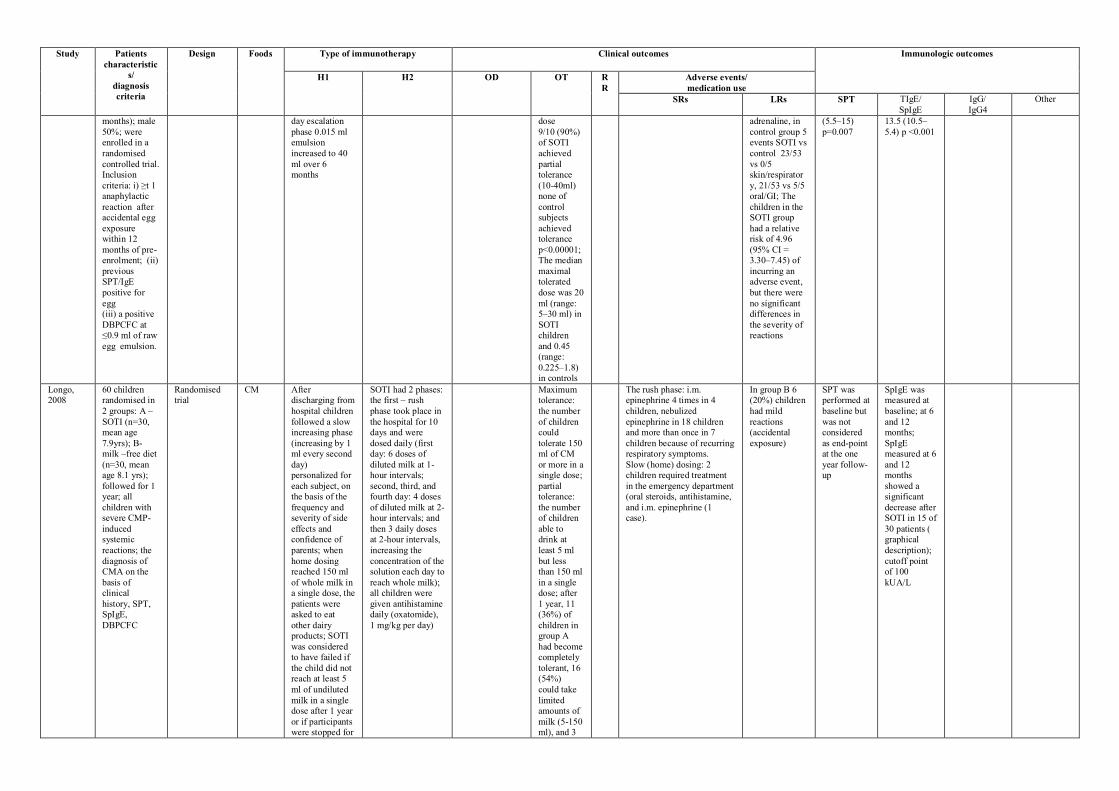
day escalation
phase 0.015 ml
emulsion
increased to 40
ml over 6
months
dose
9/10 (90%)
of SOTI
achieved
partial
tolerance
(10-40ml)
none of
control
subjects
achieved
tolerance
p<0.00001;
The median
maximal
tolerated
dose was 20
ml (range:
5–30 ml) in
SOTI
children
and 0.45
(range:
0.225–1.8)
in controls
adrenaline, in
control group 5
events SOTI vs
control 23/53
vs 0/5
skin/respirator
y, 21/53 vs 5/5
oral/GI; The
children in the
SOTI group
had a relative
risk of 4.96
(95% CI =
3.30–7.45) of
incurring an
adverse event,
but there were
no significant
differences in
the severity of
reactions
(5.5–15)
p=0.007
13.5 (10.5–
5.4) p <0.001
Longo,
2008
60 children
randomised in
2 groups: A –
SOTI (n=30,
mean age
7.9yrs); B-
milk –free diet
(n=30, mean
age 8.1 yrs);
followed for 1
year; all
children with
severe CMP-
induced
systemic
reactions; the
diagnosis of
CMA on the
basis of
clinical
history, SPT,
SpIgE,
DBPCFC
Randomised
trial
CM After
discharging from
hospital children
followed a slow
increasing phase
(increasing by 1
ml every second
day)
personalized for
each subject, on
the basis of the
frequency and
severity of side
effects and
confidence of
parents; when
home dosing
reached 150 ml
of whole milk in
a single dose, the
patients were
asked to eat
other dairy
products; SOTI
was considered
to have failed if
the child did not
reach at least 5
ml of undiluted
milk in a single
dose after 1 year
or if participants
were stopped for
SOTI had 2 phases:
the first – rush
phase took place in
the hospital for 10
days and were
dosed daily (first
day: 6 doses of
diluted milk at 1-
hour intervals;
second, third, and
fourth day: 4 doses
of diluted milk at 2-
hour intervals; and
then 3 daily doses
at 2-hour intervals,
increasing the
concentration of the
solution each day to
reach whole milk);
all children were
given antihistamine
daily (oxatomide),
1 mg/kg per day)
Maximum
tolerance:
the number
of children
could
tolerate 150
ml of CM
or more in a
single dose;
partial
tolerance:
the number
of children
able to
drink at
least 5 ml
but less
than 150 ml
in a single
dose; after
1 year, 11
(36%) of
children in
group A
had become
completely
tolerant, 16
(54%)
could take
limited
amounts of
milk (5-150
ml), and 3
The rush phase: i.m.
epinephrine 4 times in 4
children, nebulized
epinephrine in 18 children
and more than once in 7
children because of recurring
respiratory symptoms.
Slow (home) dosing: 2
children required treatment
in the emergency department
(oral steroids, antihistamine,
and i.m. epinephrine (1
case).
In group B 6
(20%) children
had mild
reactions
(accidental
exposure)
SPT was
performed at
baseline but
was not
considered
as end-point
at the one
year follow-
up
SpIgE was
measured at
baseline; at 6
and 12
months;
SpIgE
measured at 6
and 12
months
showed a
significant
decrease after
SOTI in 15 of
30 patients (
graphical
description);
cutoff point
of 100
kUA/L

Study Patients
characteristic
s/
diagnosis
criteria
Design Foods Type of immunotherapy Clinical outcomes Immunologic outcomes
H1 H2 OD OT R
R
Adverse events/
medication use
SRs LRs SPT TIgE/
SpIgE
IgG/
IgG4
Other
adverse effects (10%) were
not able to
complete
the study
because of
adverse
effects
Martorell,
2011
60 children
aged 24-36
months with
IgE-mediated
allergy to
CMPs were
enrolled in this
trial; 30
(treatment
group0 and 30
children
(control group)
were kept on a
milk-free diet
and followed
up for 1 year;
the diagnosis
of CM allergy
on the basis of
clinical
history, SPT,
SpIgE,
DBPCFC
Randomized,
controlled,
parallel-group,
multicentre
trial
CM Day 1 in hospital:
doses hourly; milk
(dilution) 1/100
dose (ml): 1,2,3,4,8
Dilution 1/10: dose
1.6 ml
Day 2 hospital:
milk dilution 1/10:
1.6ml
Doses hourly: 3.2;
6;12 ml and pure
milk 2.5 ml;
Dose maintained at
home, with
elevation once a
week in hospital
Total 16 weeks;
At the end of the
study, OD was
offered to the CG
patients who had
not achieved
tolerance
After 1-year
follow-up
period, 90%
of the
children in
active
group had
become
completely
tolerant vs
23% in CG
24 patients in
AG (80%) [14
moderate
(47%) and 10
mild (33%)
reaction]. The
most common
manifestations
were urticaria-
angioedema,
followed by
cough
SPT
decreased
significantly
after the
treatment in
the active
group
compared to
controls
(p<0.0001)
SpIgE
decreased
after the
treatment in
the active
group
significantly
(AG 11.5 ±
13.84,
median 7
versus 33.75
± 34.17
kU/L)
Meglio,
2013
20 children
with median
age 8.4 years;
active
group=10;
control=10
with HE
allergy were
enrolled in this
open trial. The
diagnosis of
HE allergy on
the basis of
SPT, SpIgE,
DBPCFC and
convincing
history
Randomized,
controlled
open trial
HE Initial day
escalation phase: Started from 1
drop (mixed raw
egg white and
yolk) diluted
1:100 with
water,
corresponding to
0.27 mg of HE
proteins;
Build-up phase:
The HE doses
were doubled
every 8 days
until day 80.
Maintenance
phase:
Subsequently,
the HE doses
were doubled
every 16 days to
achieve a total
daily intake of
25 ml in 6
months
8/10 children
(80%) in the
active group
achieved the
daily intake of
25 ml over a 6-
month period. 1
child (10%)
could tolerate up
to 2 ml/day
while another
child (10%)
failed the
desensitisation
1 child had
urticarial and
pruritus around
3 ml of raw he
and the
treatment was
stopped
SPT no
differences;
no between
group
comparisons
SpIgE tests
were
determined
with REAST
(Reverse
Enzyme
Allergo
Sorbent Test)
and ISAC
(Immuno
Solid-phase
Allergen
Chip)
methods; no
comparisons
between
groups;
No
comparisons
between
groups
Morisset,
2007a;
CMA: 57
children aged
Randomised
trial
CM
Egg
OD protocol
from 1 ml whole
A SBPCFC to
milk was
Unable to differentiate
systemic and local reactions
Unable to
differentiate
SPT was
performed at
SpIgE was
measured at

Study Patients
characteristic
s/
diagnosis
criteria
Design Foods Type of immunotherapy Clinical outcomes Immunologic outcomes
H1 H2 OD OT R
R
Adverse events/
medication use
SRs LRs SPT TIgE/
SpIgE
IgG/
IgG4
Other
Morisset,
2007b
between 13
months and 6.5
years (mean
2.2 ± 1 yrs)
were
randomised to
OD group
(n=27) and A
group
(interrupted
avoidance
n=30) for 6
months;
Egg allergy:
OD group
(n=49, mean
age 3.5 yrs); A
group (n=35,
mean age 3.6
yrs); the
diagnosis of
CM and egg
allergy on the
basis of
clinical
history, SPT,
SpIgE,
SBPCFC
pasteurized milk
day 1 to 20 ml
day 1 (first
week); second
week – 50
ml/day; third
week – 100
ml/day; fourth
week 100 ml/day
and introduction
of cream
desserts,
yoghurts or
cream cheese;
fifth and sixth
week – 250
ml/day and dairy
products;
seventh week
and thereafter:
routine amounts,
not quantified.
OD protocol
with hard-boiled
eggs: first week
– 1 g of egg yolk
once a day,
every day;
second week – 1
g of yolk and 1 g
EW once a day,
every day; third
week – 2 g of
yolk and 2 g of
EW once a day,
every other day;
fourth week – 4
g of yolk and 4 g
of EW once a
day, every other
day; second
month:
introduction of
biscuits and
crackers, etc;
third month:
introduction of
flans, cream
desserts
positive in
11.1% of those
following OD
vs. 40% after A
(p<0.025). The
size of SPT
decreased after
OD and
increased after A
(-3.4 mm vs.
+0.84 mm,
p<0.002)
Egg allergy:
After 6 months,
in the OD group,
the mean size of
the SPT was
significantly
reduced
compared to the
A group.
systemic and
local reactions
baseline and
after 6
months; In
both trials
SPT was
significantly
lower in
active group
compared to
controls
(p<0.05)
baseline and
after 6
months;
SpIgE
decreased in
both groups.
However, the
decrease in
IgE was
greater in the
“recovery”
subgroup:
3.07 vs. 1.6
kU/l (P<0.1)
and 8.21 vs.
6.7 kU/l in
the “failure”
subgroup (P
ns)
Pajno,
2010
30 children
(active=15;
control=15)
aged between
4 and 10 y.o.
were enrolled
in the study.
The diagnosis
Randomised
single-blind
controlled
study
CM Fresh CM or soy
formula was
administered at the
clinic at weekly
intervals at
increasing doses of
0.1,0.3,1,3,10,30,an
d 100 ml with 30
In 10
patients in
the active
group
achieved
full
tolerance to
CM (200
In 3 patients systemic
reactions occurred and then
stopped OIT.
7 children had
mild reactions
– abdominal
pain, throat
pruritis, gritty
eyes and they
were transient
(just in 1 case
SPT was
performed
only for the
confirmation
of diagnosis
SpIgE levels
were
measured at
baseline;
after 8 weeks,
and at the end
of the study;
No
IgG4 was
measured at
baseline; after
8 weeks, and
at the end of
the study; At
week 18 the
levels of

Study Patients
characteristic
s/
diagnosis
criteria
Design Foods Type of immunotherapy Clinical outcomes Immunologic outcomes
H1 H2 OD OT R
R
Adverse events/
medication use
SRs LRs SPT TIgE/
SpIgE
IgG/
IgG4
Other
of CM allergy
based on
clinical
history, SPT,
CAP-RAST
assay and
DBPCFC
minutes between
doses. The initial
dose started from 1
drop of whole milk
diluted 1:25. The
dose was doubled
every week at the
clinic until week 18
to achieve an intake
of 200 mL in
approximately 4.5
months
mL) and in
1 patient
partial
tolerance
(100 mL)
10/13
tolerance,
10/15 on
intention to
treat
antihistamines
were given)
significant
difference in
specific IgE
levels
between the
active and
control
groups
IgG4 in the
active group
were
significantly
higher than in
the control
group
(P<0.01)
Mean (SD)
difference
23.8 (5.3) vs.
4.3 (1.7)
Patriarca,
1998
Cases (n=14)
4-14 yrs old,
mean not given
(median 5.5
p=0.486); 6/14
male (43%);
one female
entered three
times
Controls
(n=10) aged 5-
13 (median
7.5); 6/10 male
(60%); the
diagnosis of
allergy on the
basis of
medical history
of food allergy,
SPT >3 mm,
SpIgE,
DBPCFC (all
but one who
had life
threatening
reaction)
Quasi RCT
One subject
entered into
the
intervention
group on 3
occasions
when
desensitized to
milk, egg,
fish. Hence 24
subjects in
trial from 22
individuals
CM 6
(43%)
Egg 5
(36%)
Fish 2
(14%)
Apple 1
(7%)
Initial day
escalation phase:
CM 10 drops 10
ml; days 1-12, 4
drops increased
to 12/day
Egg 10 drops
egg in 100 ml
water; days 1-20
4 drops to 36
drops x 3
Fish 10 ml 6%
fish extract in 90
ml water; days 1
to 24 4 drops to
108 drops
Apple 1 ml
apple mixed in 9
ml water; days 1
to 34 1 dropx2 to
6 drops x4
Build-up phase:
Milk 13 to 104
drops 1 drop
milk to 30 ml x4
Egg 21 to 90 1
drop to 30 mlx3
Fish 25 to 120
15 drops 6%
extract to 200 g
boiled fish/day
Apple 35 to 109
1 drop apple mix
to 1 apple a day
Maintenance
phase: Milk 100
ml 2-3x/week
Egg 1 egg 2-3
x/week
Fish 200 g
boiled/week
Apple 1 2x/week
12/14 (86%)
successfully able to
eat any foods
without problems in
follow-up 3-6 yrs; 2
failures due to
attendance; in
controls all
DBPCFC at 6
months positive,
also SPT, RAST
still positive at 6
months (P<0.0001)
6/14 urticaria, 2 asthma, 1
angioedema, 2 abdominal
pain, 4 none; all reactions
were mild and easily
controlled by antihistamines
SPT was
performed at
baseline and
after treatment;
No changes in
SPT
Total and
SpIgE were
performed at
baseline and
after
treatment;
No changes
in total IgE
or SpIgE
Salmivesi
2012
28 children
aged 6-14
Randomized,
double-blind,
CM The amount of
milk protein
The first dose (0.06
mg) and eight later
24 (86%)
patients
In the active group wheezing
in 5 (19.2%I, but no
Active group:
subjective

Study Patients
characteristic
s/
diagnosis
criteria
Design Foods Type of immunotherapy Clinical outcomes Immunologic outcomes
H1 H2 OD OT R
R
Adverse events/
medication use
SRs LRs SPT TIgE/
SpIgE
IgG/
IgG4
Other
years
(active=18;
control=10)
with CMA
were enrolled
in this trial; the
diagnosis of
CMA on the
basis of
clinical
history, SPT,
SpIgE,
DBPCFC
placebo
controlled
study
increased daily,
being doubled
every week,
from 0.06 to
6400 mg; The
final dose of
6400 mg was
given at home
on day 162, and
control visit was
held within 2
weeks, all other
dose increases
were performed
at home
according to a
prospective,
daily schedule;
doses were given in
the outpatient
clinic; All 10
children in the
control group
successfully
completed an open-
lable OIT by an
identical protocol
completed the
protocol: 16/18
in active and
8/10 placebo;
After OIT: 14
children
tolerated 6400
mg, and other
two 960 and
1920 mg
emergency rooms were
needed. Follow-up 3.0-3.5
years later, one child had
stopped using CM products
because of severe eczema
and severe asthma; one
anaphylactic reaction took
place when milk avoidance
was restored
abdominal and
oral symptoms; Control group:
subjective
abdominal and
oral symptoms
Skripak,
2008
20 children
aged between
6 and 21 were
divided into 2
groups: Active
(n=13; male 8,
mean age and
SD 9.3 ± 3.3
from the
pediatric
clinics);
Placebo group
(n=7, male 4,
mean age and
SD 10.2 ± 3.3);
the diagnosis
of CMA on the
basis of
clinical
history, SPT,
SpIgE,
DBPCFC
Randomised
double-blind,
placebo-
controlled
study
CM Home dose was
initiated at the
highest dose
tolerated on the
dose escalation
day after 7 to 14
days on a given
dose, they
returned to the
hospital to
receive a dose
increase (table
1); once a dose
of 500 mg
(equivalent to 15
ml of milk) was
achieved, they
continued on
that dose daily
for 13 weeks,
after which they
underwent
DBPCFC
The hospital-based
dose-escalation
started with 0.4 mg
of milk protein;
doubling doses
were given every
30 minutes to a
maximum of 50 mg
(cumulative dose,
98.7 mg);
participants had to
tolerate a minimum
dose of 12 mg
(cumulative dose,
23.7 mg) to proceed
with home dosing
The median
milk
threshold
dose in both
groups was
40 mg at
the baseline
DBPCFC,
after OIT in
the active
group the
median
cumulative
dose
inducing a
reaction
was 5140
mg (range
2540-
8140); all
patients in
the placebo
group
reacted at
40 mg
(P=0.0003)
Among 2437 active OIT
doses vs. 1193 placebo
doses, there were 1107
(45.4%) vs. 134 (11.2%)
total reactions; SRs
(gastrointestinal, lower
respiratory tract, and skin
symptoms)were rare,
occurring with a median
frequency of 1% of active
doses vs. none in the placebo
group (P=0.01)
Skin side effects 0.9% vs.
0.1% p=0.1
Respiratory 8.1% vs. 2.3%
p=0.3
LRs (oral
pruritis,
abdominal
pain) with a
median
frequency of
16% and 2% of
active doses,
respectively
(P= 0.006 and
0.02)
SPTs were
performed at
baseline and
after OIT
(23 week).
Not changes
between
groups
SpIgE was
measured at
baseline and
after
treatment (23
week); Total
serum CM
IgE levels did
not change,
on average,
IgG4 was
measured at
baseline and
after
treatment (23
week);
Although
there was no
significant
change in CM
IgG4 levels in
the placebo
group, there
was a median
increase from
baseline of
767% in the
active group
(P = 0.002,
table III and
fig 5)
Staden,
2007
45 children
(SOTI=25,
control
group=20)
were included
(29 boys, 16
girls, median
age 2.5 years,
range 0.6-
12.9); the
diagnosis of
CMA or HE
allergy on the
basis of
Randomised
clinical trial
CM
hens’
egg
(HE)
SOTI was
carried out at
home with
starting dose for
CM 0.02 mg CM
protein from
3.5% fresh
pasteurized CM;
HE – starting
dose 0.006 mg
lyophilized HE
protein
(induction
phase);
At follow-
up
DBPCFC 9
of 25
children
(36%)
showed
permanent
tolerance in
the SOTI
group; 3 of
25 (12%)
were
tolerant
In 4 children in the SOTI
group generalized urticaria,
bronchial obstruction, or
angioedema, which were
treated with antihistamines
and steroids; in the control
group 1 child had severe
reactions (vomiting,
paleness, circulatory
disorder) after accidental
exposure; 2 children during
follow-up DBPCFC had
bronchial obstruction,
generalized urticaria, and
21/25 (84%)
mild symptoms
SPT data not
available
Total and
SpIgE levels
were
measured at
baseline and
after
treatment;
With respect
to total IgE
there was no
significant
alteration in
values for
either SOTI

Study Patients
characteristic
s/
diagnosis
criteria
Design Foods Type of immunotherapy Clinical outcomes Immunologic outcomes
H1 H2 OD OT R
R
Adverse events/
medication use
SRs LRs SPT TIgE/
SpIgE
IgG/
IgG4
Other
clinical
history, SPT,
RAST,
DBPCFC
47 recruited,
45 reported, 2
lost to follow
up or failed to
start
Doses were
increased
according to the
individual
tolerance to a
maximum dose
of 8250 mg CM
protein (250 ml
CM) or 2800 mg
HE protein
(around ½ HE);
the maintenance
phase followed
with a minimum
daily
maintenance
dose of 3300 mg
CM protein (100
ml CM) and
1600 mg HE
protein (around
¼ HE) plus
deliberate intake
for 67 days
(table 1 and 2)
with regular
intake and 4
of 25 (16%)
were partial
responders;
in the
control
group, 7 of
20 children
(35%) were
tolerant
16/25
(64%)
tolerant in
active
group, 7/20
(35%) in
control
group
P=0.05
circulatory disorders and
were equipped with an
epinephrine self-
administration-pen
or
elimination
group (data
not shown)
Sp IgE
decreased
significantly
over time in
children who
developed
their natural
tolerance
under
elimination
diet as
expected (P <
0.05; fig 3B).
Under
intervention
with SOTI,
children in
the responder
group and
partial
responder
groups
(patterns I-
III) showed a
similar
response (P <
0.001; fig 3A
graphical
description).
There was no
significant
change in
SpIgE in
children who
had to stop
SOTI (pattern
IV, non-
responder)
and the ones
who were
non-
responders
under
elimination
diet. Children
in SOTI
group who
were
responders
had lower Sp
IgE levels
than the non-
responders at
the beginning

Study Patients
characteristic
s/
diagnosis
criteria
Design Foods Type of immunotherapy Clinical outcomes Immunologic outcomes
H1 H2 OD OT R
R
Adverse events/
medication use
SRs LRs SPT TIgE/
SpIgE
IgG/
IgG4
Other
of the study
(P <0.05).
Varshney,
2011
28 children
aged 1-16
years
randomised in
2 groups:
Active –
[n=19, age
(mo), median
range 84 (38-
126)]; Placebo
– [n=9, age
(mo), 69 (28-
114)];
followed for 1
year. The
diagnosis of
peanut allergy
on the basis of
clinical
history, SPT,
SpIgE
RCT Peanut At home the
dosing was
resumed if
children missed
less than 3 daily
doses, if from 3
to 5 doses were
missing children
returned for an
observed dose
Initial day
escalation phase: in
clinical area; 0.1
mg peanut protein
(as flour) or
placebo; dose
doubled every 30
minutes until 6 mg
or symptoms;
Build-up phase: in
clinical area first
day, dose from
escalation phase
day before; every 2
weeks dose
increased by 50-
100% until 75
mg/day tolerated,
then 25-33% until
maintenance dose
of 4000 mg
achieved within 44
weeks;
Maintenance phase:
4000 mg/day, for 1
month then
returned for
DBPCFC at 48
weeks
16/19 active
group reached
maintenance
dose, 9/9 in
controls; Active
group at
DBPCFC all
16/16 ingested
5000 mg
(approximately
20 peanuts);
placebo median
dose 280 mg (0-
1900 mg)
p<0.001
At DBPCFC 0/16 in active
group required epinephrine,
3/9 in placebo group needed
epinephrine
1/16 in active
group were
mild symptoms
which required
antihistamines
SPT were
performed at
enrolment
and at the
time of oral
food
challenge
(12 months);
SPT in
active group
decreased
from 7 range
(5.5-15) to
1.75 (0-10),
p<0.001; No
changes in
placebo
group 7(5.5-
13) to 4 (0-
12.5);
SpIgE was
measured at
enrolment
and at the
time of food
challenge (12
months);
SpIgE in
active group
had initial
increases but
did not show
significant
change from
baseline
during
DBPCFC
IgG4 was
measured at
enrolment
and at the
time of food
challenge (12
months);
IgG4 was
increased
significantly
after OIT
compare to
placebo
(p<0.001)
Cytokine
analysis was
performed at
baseline; at 9
months, and
at the time of
oral food
challenge; IL-
5, IL-13
declined in
active group,
no change in
placebo
group; also,
no change in
IL-10, IFN-γ
in active or
placebo; in
active group
increased
ratio FoxP3
hi to Fox P3
intermediate
CD4 CD25,
not for
tetanus
toxoid; no
changes in T-
regs of
controls
Mansouri,
2007
Intervention
group n=20,
40%
(8=female), 8
mo-18 yrs,
mean age 56
mo;
Control group
n=13 (31%
female) 4 mo-
13 yrs, mean
age 52 mo; the
diagnosis of
CMA on the
basis of
clinical
history, SPT,
RAST and
DBPCFC
Quasi-RCT
(no formal
randomisation
), control
group no
placebo,
followed up
CM Dose 0.06 mg
increased to 6.4
g/day over 6
months; 1 drop of
CM diluted in 25
drops of water 0.06
mg of CM; initial
dose given for 7
days, doubled every
7 days for 70 days,
then doubled every
16 days; if
concurrent viral
infection dose not
doubled; 1,2,4
drops of non
diluted CM given
in hospital;
Build-up phase:
1:25 diluted, 1-49
days 1-64 drops;
50-70 5-20 drops of
CM; 70-180 2-200
ml CM;
Maintenance phase:
18/20
(90%) able
to tolerate
200 ml/day;
avoidance
group are
still
symptomati
c after CM
(reassessed,
DBPCFC,
SPT, IgE)
80% mild
reactions
during
desensitisation
(nausea,
abdominal
pain, throat
itching,
eczema,
dyspnoea)
responded to
antihistamine;
10% children
wheezed,
slower increase
in dose was
employed
SPT were
performed at
baseline and
after
treatment
Total and
SpIgE were
measured at
baseline and
after
treatment;
IgE reduced
after
desensitisatio
n (P=0.004);
SpIgE
reduced after
desensitisatio
n (P=0.001)

Study Patients
characteristic
s/
diagnosis
criteria
Design Foods Type of immunotherapy Clinical outcomes Immunologic outcomes
H1 H2 OD OT R
R
Adverse events/
medication use
SRs LRs SPT TIgE/
SpIgE
IgG/
IgG4
Other
200 ml undiluted
milk a day
Patriarca,
2003
59 cases aged
3-55 yrs; 32
children (54%)
<16 yrs (mean
age not given);
25/59 male
(42%)
Controls n=16
aged 5-29 no
further
information;
the diagnosis
of allergy on
the basis of
clinical
history, SPT,
RAST,
DBPCFC
Quasi-RCT,
not
randomised,
controls
refused
desensitization
Milk 29
(44%)
Egg 15
(23%)
Albumi
n 3
(4.5%)
Fish 11
(17%)
Orange
2 (3%)
Apple 1
(1.5%)
Corn 1
(1.5%)
Beans 1
(1.5%)
Peanut
1
(1.5%)
Lettuce
1
(1.5%)
Peach 1
(1.5%)
Milk 10 drops in
100ml water
1-18 1-
18drops/day
Egg 10drops in
100ml
1-33 1drop to
36drops x3
Fish
25g cod in 50ml
water
Days
0.000033mg-
160g days 1 to
165
Build-up phase:
Milk 19-136
1drop milk to
120ml
Egg pure egg
day 34 to 139
1drop to 50ml (1
egg)
Maintenance
phase: Milk
120ml (1 glass)
2-3x/wk
Egg 1 egg 2-
3x/wk
Fish 160g boiled
cod, 2-3x/wk
Other foods 2-
3x/wk
136 days milk;
139 days egg;
165 days fish
Desensitization
success rate 45 out
of 54 (83%)
(ITT 68%)
During the protocol, 51.1%
of patients experienced
reactions (urticaria,
angioedema, or abdominal
pain) which were controlled
by antihistamines or sodium
cromolyn; in 9 patients
(16.7%) treatment was
stopped due to the
occurrence of skin reactions
or gastrointestinal symptoms
(diarrhea, vomiting and
abdominal pain) not
controlled by antihistamines
or sodium cromolyn
SPT were
performed at
baseline and
after
treatment
SpIgE was
measured at
baseline;
after 6, 12
and 18
months;
During the
oral
desensitisatio
n a
significant
decrease in
Sp IgE after 6
(P<0.01); 12
(P < 0.01)
and 18
months (P <
0.01; fig 1;
graphical
description)
IgG4 was
measured at
baseline; after
6, 12 and 18
months; A
significant
increase in
IgG4 after 6
(P<0.01), 12
(P<0.01) and
18 months
(P<0.01) fig 1
graphical
description)
Patriarca,
2007
42 cases (18
girls; 24 boys;
aged 3-16 yrs);
14/42 had also
atopic
dermatitis.
Controls n=10
(4 girls; 6 boys
aged 5-13 yrs)
had only strict
elimination
diet for 18
months; the
diagnosis of
allergy on the
basis of
clinical
Quasi-RCT,
not
randomised,
controls
refused
desensitization
Milk 18
cases;
Egg 17;
Fish 9;
Wheat
2;
Apple
1;
Bean 1
Dilution: 10
drops of milk in
100 ml; from 1
drops/day at the
beginning of the
protocol and at
the end of
treatment days
175-177 130
ml/day;
maintenance
dose: 130 ml of
milk at least two
or three times a
week;
Egg dilution: 1
drop of raw
Desensitization was
successful in 31/36
cases (85.7%)
In 11/36 cases (30.5%) had
reactions such as, urticaria,
vomiting, worsening of
bronchial asthma or of atopic
dermatitis, angioedema, and
abdominal pain
SPT were
performed at
baseline and
after
treatment
(18 months);
In 27 /36
patients
(75%) SPTs
markedly
decreased
after the
treatment
and only 9
cases (25%)
did not show
any changes
SpIgE levels
were
measured at
baseline; at 6,
12 and 18
months;
During the
treatment
SpIgE
decreased
significantly
after 6
(P<0.001); 12
(p=0.004),
and 18
(P=0.002)
months
IgG4 levels
were
measured at
baseline; at 6,
12 and 18
months; IgG4
significantly
increased
after 6
(P<0.001), 12
(P<0.001),
and 15
(P<0.001)
months of
oral
desensitizatio
n

Study Patients
characteristic
s/
diagnosis
criteria
Design Foods Type of immunotherapy Clinical outcomes Immunologic outcomes
H1 H2 OD OT R
R
Adverse events/
medication use
SRs LRs SPT TIgE/
SpIgE
IgG/
IgG4
Other
history, SPT,
RAST,
DBPCFC
shaken egg
(albumin + yolk)
in 100 ml of
water;
1 drops from
days 1-3 till 10
drops days 22-
24; then dilution
10 drops of raw
shaken egg
(albumin + yolk)
in 100 ml of
water 1 drops in
days 25-27 till
50 ml days 166-
168;
maintenance
dose: 1 egg at
least two or three
times a week;
Cooked fish
(boiled cod)
0.000033 mg
days 1-3 till 100
g days 154-156;
maintenance
dose: 100 g of
boiled cod at
least twice a
week
CM Cows’ milk
H1 Home-based immunotherapy
H2 Hospital-based immunotherapy
HE Hens’ egg
IgG Immunoglobulin G
IgG4 Immunoglobulin IgG4
LRs Local reactions
nsLTPs non-specific Lipid Transfer Proteins
OD Oral desensitization
OT Oral tolerance
RR Relapse Rate
SOTI Specific Oral Tolerance Induction
SPT Skin Prick Test
SpIgE Specific IgE
SRs Systemic reactions
TIgE Total IgE

Appendix 4: Risk of bias assessment of included studies
Study, year Food Design Adequate
sequence
generation
Allocation
concealment
Blinding/ patient-
related outcomes
Incomplete
outcome data
addressed?
Free of
selecting
reporting
Free of other
bias*
Grade
Burks,
2012
Hens’ Egg RCT Yes Yes No Yes Yes Yes B
Caminiti,
2009
Cows’ Milk RCT No No Yes Yes Yes No C
Enrique,
2005
Hazelnut RCT No No Yes Yes Yes No C
Fernandez-
Rivas, 2009
Peach RCT Unclear Yes Yes Yes Yes No B
Fleischer,
2013
Peanut RCT Yes Yes Yes Yes Yes Yes A
Kim,
2010
Peanut RCT Unclear Yes Yes Yes Yes No B
Lacono,
2013
Hens’ Egg RCT Yes No No Unclear Unclear Unclear C
Longo,
2008
Cows’ Milk RCT Yes Yes Yes Yes Yes Yes A
Martorell,
2011
Cows’ Milk RCT Yes Unclear No Yes Yes Yes B
Meglio,
2013
Hens’ Egg RCT Yes No No Yes Yes Yes C
Morisset, 2007 a
Cows’ Milk RCT No No Single-blind Unclear Yes No C
Morisset,
2007 b
Hens’ Egg RCT No No Single-blind Unclear Yes No C
Pajno,
2010
Cows’ Milk RCT Yes No Yes No Yes No C
Patriarca,
1998
Cows’ Milk
Hens’ Egg
RCT Unclear No Yes Unclear Yes No C
Salmivesi,
2012
Cows’ Milk RCT Unclear Yes Yes No No No C
Skripak, Cows’ Milk RCT Unclear Yes Yes Yes Yes Yes B

Study, year Food Design Adequate
sequence
generation
Allocation
concealment
Blinding/ patient-
related outcomes
Incomplete
outcome data
addressed?
Free of
selecting
reporting
Free of other
bias*
Grade
2008
Staden,
2007
Cows’ Milk
Hens’ Egg
RCT No No Yes Unclear Yes No C
Varshney,
2011
Peanut RCT Yes Yes Yes Yes Yes Yes A
Mansouri,
2007
Cows’ Milk CCT Unclear No Yes No Yes No C
Patriarca, 2003
Cows’ Milk Hens’ Egg
Peanut, Fish
Peach, Orange,
Apple, Corn, Bean,
Lettuce
CCT No No Yes No Yes No C
Patriarca,
2007
Cows’ Milk
Hens’ Egg
Fish, Wheat
Apple, Bean
CCT No No Yes No Yes No* C
*As described in Higgins JPT, Green S. Cochrane Handbook for Systematic Reviews of Interventions. The Cochrane Collaboration. Wiley-
Blackwell, 2009 these included: recruitment bias; selection bias; information bias; publication bias; confounding; intervention bias; bias due to
early stopping; performance bias; attrition bias; detection bias; reporting bias

Appendix 5: Additional forest plots
Figure S1: Sensitivity analysis RR of food allergy after OIT or SLIT (diagnosis of food allergy confirmed by DBPCFC)

Figure S2: RR of CMA as assessed by DBPCFC in OIT vs. controls
Figure S3: RR of HE allergy as assessed by DBPCFC in OIT vs. controls

Figure S4: RR of peanut allergy as assessed by DBPCFC in OIT/SLIT vs controls
Figure S5: SPT (wheal in mm) following OIT for cows’ milk allergy
Figure S6: SpIgE (kU/L) following CMA
Study or Subgroup
Mansouri 2007
Morisset 2007
Skripak 2008
Total (95% CI)
Heterogeneity: Tau² = 4.17; Chi² = 8.91, df = 2 (P = 0.01); I² = 78%
Test for overall effect: Z = 2.43 (P = 0.02)
Mean
3.8
1.4
6.5
SD
1.3
2
2.3
Total
20
28
13
61
Mean
7.7
2.7
13.9
SD
3.4
3
6.6
Total
13
32
7
52
Weight
38.5%
43.1%
18.3%
100.0%
IV, Random, 95% CI
-3.90 [-5.83, -1.97]
-1.30 [-2.58, -0.02]
-7.40 [-12.45, -2.35]
-3.42 [-6.18, -0.66]
Experimental Control Mean Difference Mean Difference
IV, Random, 95% CI
-20 -10 0 10 20Favours experimental Favours control
Study or Subgroup
Longo 2008
Morisset 2007
Pajno 2010
Skripak 2008
Total (95% CI)
Heterogeneity: Tau² = 268.09; Chi² = 18.58, df = 3 (P = 0.0003); I² = 84%
Test for overall effect: Z = 0.89 (P = 0.37)
Mean
65.2
2.3
31.8
71.3
SD
34.4
4
27.1
140.9
Total
30
28
15
13
86
Mean
93.6
2
39.7
30.2
SD
15.2
3.1
34.2
41.1
Total
30
32
15
7
84
Weight
32.0%
37.5%
25.5%
5.0%
100.0%
IV, Random, 95% CI
-28.40 [-41.86, -14.94]
0.30 [-1.53, 2.13]
-7.90 [-29.98, 14.18]
41.10 [-41.32, 123.52]
-8.96 [-28.64, 10.73]
Experimental Control Mean Difference Mean Difference
IV, Random, 95% CI
-200 -100 0 100 200Favours experimental Favours control

Figure S7: IgG4 (µg/ml) following OIT for cows’ milk allergy
Figure S8: Safety data – absence of systemic reactions during OIT or SLIT for food allergy (only grade A and B studies)
Figure S9: Safety data – absence of systemic reactions during OIT for cows’ milk allergy
Study or Subgroup
Pajno 2010
Skripak 2008
Total (95% CI)
Heterogeneity: Tau² = 6.01; Chi² = 1.03, df = 1 (P = 0.31); I² = 3%
Test for overall effect: Z = 7.05 (P < 0.00001)
Mean
4.37
6.3
SD
1.7
7.6
Total
15
7
22
Mean
23.8
45.9
SD
5.3
70.7
Total
15
13
28
Weight
98.0%
2.0%
100.0%
IV, Random, 95% CI
-19.43 [-22.25, -16.61]
-39.60 [-78.44, -0.76]
-19.83 [-25.34, -14.32]
Control Experimental Mean Difference Mean Difference
IV, Random, 95% CI
-100 -50 0 50 100Favours experimental Favours control
Study or Subgroup
Fernandez-Rivas 2009
Varshney 2011
Total (95% CI)
Total events
Heterogeneity: Tau² = 0.00; Chi² = 0.57, df = 1 (P = 0.45); I² = 0%
Test for overall effect: Z = 0.25 (P = 0.80)
Events
17
9
26
Total
19
9
28
Events
34
17
51
Total
37
19
56
Weight
59.1%
40.9%
100.0%
M-H, Random, 95% CI
0.97 [0.81, 1.17]
1.09 [0.87, 1.35]
1.02 [0.89, 1.17]
Control Experimental Risk Ratio Risk Ratio
M-H, Random, 95% CI
0.005 0.1 1 10 200Favours experimental Favours control
Study or Subgroup
Mansouri 2007
Pajno 2010
Patriarca 1998
Total (95% CI)
Total events
Heterogeneity: Tau² = 0.00; Chi² = 0.00, df = 1 (P = 0.96); I² = 0%
Test for overall effect: Z = 2.25 (P = 0.02)
Events
13
15
0
28
Total
13
15
10
38
Events
16
12
0
28
Total
20
15
14
49
Weight
55.5%
44.5%
100.0%
M-H, Random, 95% CI
1.23 [0.96, 1.57]
1.24 [0.94, 1.63]
Not estimable
1.23 [1.03, 1.48]
Control Experimental Risk Ratio Risk Ratio
M-H, Random, 95% CI
0.01 0.1 1 10 100Favours experimental Favours control

Figure S10: Safety data – absence of local reactions during OIT or SLIT for food allergy (only grade A and B studies)
Figure S11: Safety data – absence of local reactions during OIT for cows’ milk allergy

Appendix 6: Immunological assessment and outcomes (immunoglobulin analysis)
First author, year,
country
Immunoglobulin measured Method of
measurement
Time parameters Findings
RCTs
Burks, 2012; USA
Specific IgE IgG4
(egg-specific)
Serum egg-specific IgE and IgG4 were
measured with the use
of the ImmunoCAP 100 (Thermo Fisher
Scientific).
Baseline to month 10, 22 and 24
At 10 months, specific IgE levels were lower in children who were successfully
desensitized at 22 months than in those
who were not (p=0.02 and p=0.04, respectively)
Median IgG4 levels at 10 months were
higher in children who were desensitized
at 10 months (p=0.0007), those who were desensitized at 22 months (p=0.005), and
those who had sustained unresponsiveness
at 24 months (p=0.02), as compared with children who did not pass the oral food
challenge at these time points.
Caminiti, 2009;
Italy
Specific IgE Before the beginning of
oral desensitization.
Measured only for the purpose of
diagnosing CMA.
Enrique, 2005;
Spain
Enrique, 2008^
Specific IgE
IgG4
(hazelnut specific)
Specific IgE against
hazelnut was measured
by an enzyme allergosorbent test.
Blood samples taken
before treatment for in
vitro studies. Blood samples were again
drawn for in vitro studies
8-12 weeks later (at time
of final DBPCFC).
Specific IgE showed no significant
changes before and after SLIT in both
groups.
IgG4 levels: no statistical significance
was found between the studied groups.
However, there was an increase in the mean IgG4 levels in the active group
(from 7.34 allergen units (AU)/mL to 9.84
AU/mL, P < 0.05).
Fernandez-
Rivas, 2009;
Spain
Specific IgE
IgG4
(specific to Pru p 3)
Specific IgE to rPru p
3 was determined by
the ADVIA Centaur
Serum samples were
collected at T0, T1 and
T6, and processed
Specific IgE showed a significant increase
both in the active (P < 0.001) and placebo
(P = 0.025) groups, although the increase

First author, year,
country
Immunoglobulin measured Method of
measurement
Time parameters Findings
Garcia, 2010^ platform and specific IgG4 to nPru p 3 by
means of ELISA.
together at the end of the study by an investigator
blinded to the treatment.
(T0 = before treatment, T1= after 1 month of
treatment, T6 = after 6
months of treatment).
remained only significant at T6 in the former (active 4.23, P < 0.001; placebo
4.04, P = 0.079, T-test).
No significant inter-group differences
were observed (P = 0.456).
None of the patients with negative IgE to
rPru p 3 at T0 converted to positive at T1 or T6.
IgG4 to nPru p 3 showed a different evolution between groups (P = 0.022)
with a significant increase in the active
arm (P = 0.007) not observed in the placebo one (P = 0.185).
Fleischer, 2013;
USA
Specific IgE
IgG4 (peanut specific)
Serum egg-specific
IgE and IgG4 were measured with the use
of the ImmunoCAP
100 (Thermo Fisher Scientific).
Serum was obtained at
baseline, at weeks 29, 44 and 68
Specific IgE week 44 peanut –specific
IgE 35.8 (3.3 to 75.0) in SLIT versus 20.1 (4.1 to 80.3) in placebo (NS). Increase
between baseline and week 44 in SLIT.
IgG4 levels week 44 0.7 (0.4 to 2.3) SLIT versus 0.5 (0.2 to 0.7) placebo (NS).
Increase between baseline and week 44 in
SLIT.
Kim, 2010; USA
Specific IgE IgG4
(peanut specific)
Peanut-specific IgE and IgG4 levels were
measured with the
Phadia AB ImmunoCAP 100
instrument.
Serum was obtained at baseline, 4 months, 8
months, and the day of
DBPCFC (after 12 months of SLIT).
After 12 months, peanut SLIT results in an increase in specific IgE levels over 4
months followed by a decrease over the
subsequent 8 months.
IgG4 levels in the active group increased
significantly during 12 months compared
to the placebo group.

First author, year,
country
Immunoglobulin measured Method of
measurement
Time parameters Findings
Lacono, 2013; Italy
Specific IgE (specific to HE)
Not specified At baseline, after 6 months.
In SOTI group egg-specific IgE decreased significantly compared to controls at 6
months (p=0.007).
Longo, 2008; Italy
Specific IgE (CM specific)
Specific IgE levels were measured by
using the Phadia CAP
System FEIA.
Specific IgE levels in serum samples were
measured at the time of
enrolment, and after 6
and 12 months.
Specific IgE measured at 6 and 12 months showed a significant decrease after SOTI
in 15 of 30 subjects. (cut-off point of 100
kUA/L)
Martorell, 2011;
Spain
Specific IgE
(CM specific)
Specific IgE levels
were measured by
using the Phadia CAP System FEIA.
At baseline and after 12
months
Specific IgEs decreased significantly in
active group compared to controls after 12
months (p<0.0001).
Meglio, 2013;
Italy
Specific IgE
(specific to HE)
Specific IgEs and
IgG4s to HE proteins
were determined with Realtest (Reverse
Enzyme Alergo
Sorbent Test – Reast) (Lofarma) and an
allergen microarray
assay (Immuno Solid-
phase Allergen Chip ISAC).
At baseline and after 6
months (pre and post
desensitisation period).
The differences between specific IgEs
before and after the treatment were
significant only in the active group (p=0.01) (ISAC method). No comparisons
between groups.
Morisset, 2007;
France
Specific IgE
(specific to CM and HE)
Specific IgE levels
were measured by
using the CAP system FEIA.
Specific IgE levels were
assessed at: baseline and
6 months.
Specific IgEs decreased in both groups.
However, the decrease in IgE was greater
in the "recovery" sub-group: 3.07 vs. 1.6 kU/l (p < 0.1) and 8.21 vs. 6.7 kU/l in the
"failure" sub-group (p ns).
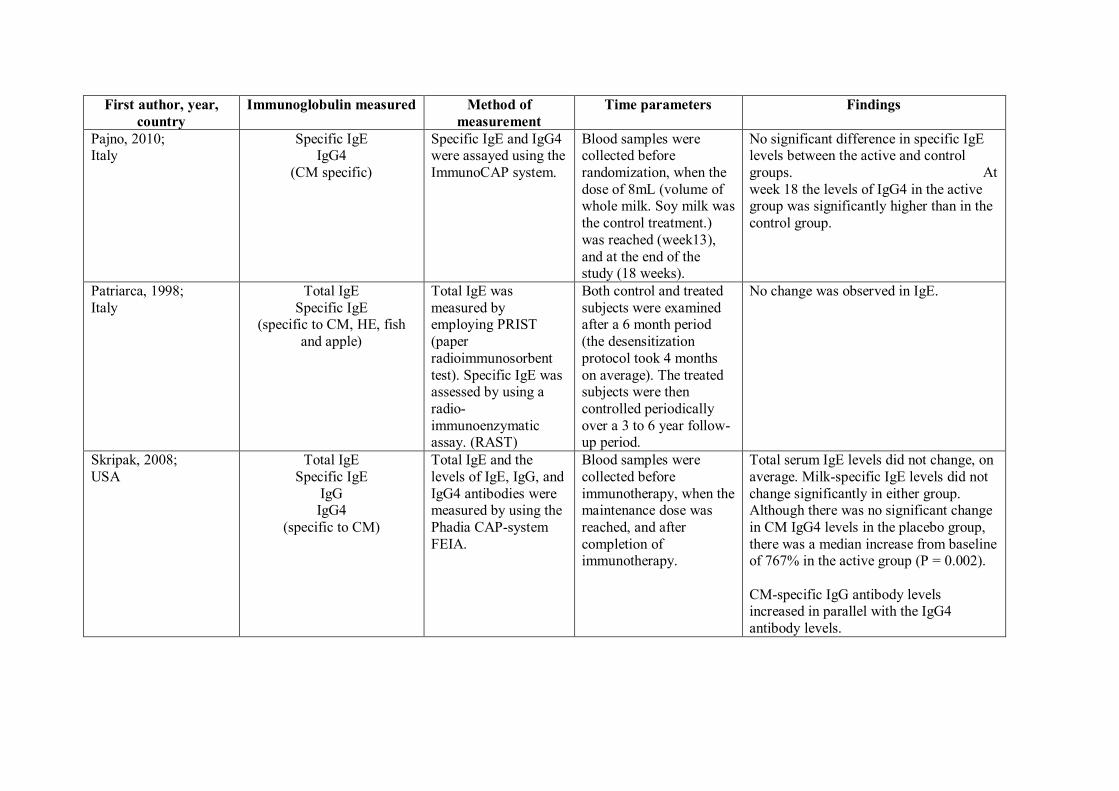
First author, year,
country
Immunoglobulin measured Method of
measurement
Time parameters Findings
Pajno, 2010; Italy
Specific IgE IgG4
(CM specific)
Specific IgE and IgG4 were assayed using the
ImmunoCAP system.
Blood samples were collected before
randomization, when the
dose of 8mL (volume of whole milk. Soy milk was
the control treatment.)
was reached (week13),
and at the end of the study (18 weeks).
No significant difference in specific IgE levels between the active and control
groups. At
week 18 the levels of IgG4 in the active group was significantly higher than in the
control group.
Patriarca, 1998;
Italy
Total IgE
Specific IgE (specific to CM, HE, fish
and apple)
Total IgE was
measured by employing PRIST
(paper
radioimmunosorbent
test). Specific IgE was assessed by using a
radio-
immunoenzymatic assay. (RAST)
Both control and treated
subjects were examined after a 6 month period
(the desensitization
protocol took 4 months
on average). The treated subjects were then
controlled periodically
over a 3 to 6 year follow-up period.
No change was observed in IgE.
Skripak, 2008;
USA
Total IgE
Specific IgE
IgG IgG4
(specific to CM)
Total IgE and the
levels of IgE, IgG, and
IgG4 antibodies were measured by using the
Phadia CAP-system
FEIA.
Blood samples were
collected before
immunotherapy, when the maintenance dose was
reached, and after
completion of immunotherapy.
Total serum IgE levels did not change, on
average. Milk-specific IgE levels did not
change significantly in either group. Although there was no significant change
in CM IgG4 levels in the placebo group,
there was a median increase from baseline of 767% in the active group (P = 0.002).
CM-specific IgG antibody levels increased in parallel with the IgG4
antibody levels.

First author, year,
country
Immunoglobulin measured Method of
measurement
Time parameters Findings
Staden, 2007; Germany
Total IgE Specific IgE
(specific to CM and HE)
Total IgE and specific IgE were measured
using the Phadia CAP-
system FEIA.
Blood sample was drawn prior to start of the
intervention, prior to re-
challenges or at final examination.
With respect to total IgE there was no significant alteration in values for either
SOTI or elimination group (data not
shown).
Specific IgE decreased significantly over
time in children who developed their
natural tolerance under elimination diet as expected (P < 0.05). Under intervention
with SOTI, children in the responder
group and partial responder groups showed a similar response (P < 0.001).
There was no significant change in
specific IgE in children who had to stop SOTI and the ones who were non-
responders under elimination diet.
Children in the SOTI group who were
responders had lower specific IgE levels than the non-responders at the beginning
of the study (P < 0.05).
Varshney, 2011; USA
Specific IgE IgG
IgG4
(peanut specific)
Peanut-specific IgE, IgG, and IgG4 levels
were measured by
using the ImmunoCAP
100 instrument (Phadia AB).
Serum immunoglobulin levels were analysed at
regular intervals:
baseline, 2 months, 6
months, 9 months and at OFC (week 48).
In the active group, median peanut-specific IgE increased nearly 3-fold by 2
months and was not significantly different
from baseline at OFC; the placebo group
showed no changes. The active group had significant increases
in peanut-specific IgG at all time points.
Peanut-specific IgG4 showed a significant increase from baseline at all time points
with peanut OIT and did not change with
the placebo group.
CCTs
Mansouri, 2007; Total IgE Specific IgE was Specific IgE levels were IgE reduced after desensitisation (P =

First author, year,
country
Immunoglobulin measured Method of
measurement
Time parameters Findings
Iran Specific IgE (CM specific)
measured qualitatively (an ELISA was
performed).
measured during: pre-observational period &
post-observational period
(for the control group) and pre-desensitization &
post-desensitization (for
the case group).
Total IgE was measured before the study but was
not rechecked afterwards.
0.004); specific IgE reduced after desensitisation (P = 0.001).
Patriarca, 2003; Italy
Total IgE Specific IgE
IgG4
(specific to CM, HE, fish,
orange, peanut, corn, peach, apple, lettuce and beans)
Total and specific IgE and specific IgG4 in
the serum were
detected with an
immuno-enzymatic assay (UniCAP was
used to detect IgE and
CAP FEIA was used to detect IgG4).
Specific IgE and IgG4 in the serum were measured
at: baseline and after 6,
12 and 18 months.
During the oral desensitization, there was a significant decrease in specific IgE after
6 (P < 0.01), 12 (P < 0.01) and 18 months
(P < 0.01), and a significant increase in
specific IgG4 after 6 (P < 0.01), 12 (P < 0.01) and 18 months (P < 0.01).
Patriarca, 2007;
Italy
Total IgE
Specific IgE
IgG4
UniCAP [Pharmacia]
was used to detect IgE
and CAP FEIA [Pharmacia] was used
to detect IgG4.
IgE and IgG4 levels were
monitored at: baseline
and 6, 12, & 18 months after starting the protocol
in all patients who
completed the treatment successfully.
During the oral desensitizing treatment, a
significant decrease was observed in
specific IgE after 6 (P < 0.001), 12 (p = 0.004), and 18 (P = 0.002) months and a
significant increase in specific IgG4 after
6 (P < 0.001), 12 (P < 0.001), and 18 (P < 0.001) months.

Appendix 7: Immunological assessment and outcomes (cytokine analysis)
First author, year,
country
Cytokines measured Method of
measurement
Time parameters Findings
RCTs
Enrique, 2005;
Spain
Enrique, 2008^
IL-4, IL-5, IL-10, TGF-β,
and IFN-γ.
ELISA Blood samples taken before treatment for in vitro
studies. Blood samples were again drawn for in
vitro studies 8-12 weeks later (at time of final
DBPCFC).
An increase in IL-10 levels after
SLIT was found only in the
active group, rising from 1.62
pg/mL to 2.24 pg/mL (P < 0.05).
No differences were observed
between the placebo and active groups.
Unable to obtain results for the other cytokines because of the
low sensitivity of the tests used.
Kim, 2010; USA
IL-5, IL-10, IL-13, and IFN-γ.
ELISA Cytokine levels measured at baseline and after 12 months of peanut SLIT or placebo.
After 12 months, peanut SLIT results in a decrease in IL-5
secretion. After 12 months, IL-
13 levels in the active treatment group decreased from a median
of 147.1 pg/mL at baseline to
62.1pg/mL. However, this level
was not significant compared with that in the placebo group
(P= 0.06), which also decreased
from a median baseline of 369.6 pg/mL to 149.55 pg/mL after 12
months.
No differences between the 2 groups were found in IL-10 or
IFN-γ levels at baseline or at 12

First author, year,
country
Cytokines measured Method of
measurement
Time parameters Findings
months (data not shown).
Meglio, 2013;
Italy
IL-4, IL-5, IL-6, Il-10, IL-
13, IFN-γ, TNF-ɑ, TGF-β1
and TGF-β2
ELISA Pre and post desensitisation period Only a significant increase of IL-
5 in the active group was observed (pre: mean, 19.00 ± 9.4
pg/ml; range, 5.00-32.00; post
28.13 ± 14.7 pg/ml; range,
12.00-56.00 – p=0.03). All other differences were not significant
Varshney, 2011; USA
IL-5, IL-10, IL-13, IFN-γ, and TGF-β.
ELISA Cytokine analysis occurred at: baseline, 9months, and the time of oral food challenge (OFC
performed after approximately 1 year of OIT).
IL-5 and IL-13 decreased in peanut OIT subjects. Also, there
was a transient increase in TGF-
β in the active group at 9 months but levels returned to the
baseline at OFC.
No change in IL-5, IL-13, or TGF-β in placebo group. No
significant change in IL-10 or
IFN-γ in either the active or placebo group.

Appendix 8: On-going/unpublished studies
PI,
country
Title Study
design
ClinicalTrials.gov
identifier
No. of
participants
Intervention Primary
outcome
measures
Started
reporting
Estimated
study
completion
date
Status
Burks
W, USA
Oral
immunotherapy for childhood
egg allergy
Allocation:
Randomized
NCT00461097 NA Oral egg
immunotherapy
Percent of
participants who can
tolerate 10,000
mg of egg
white solid
Yes October
2013
Active, not
recruiting
Burks
W,
USA
Sublingual
immunotherapy
for peanut allergy and
induction of
tolerance (SLIT
2)
Allocation:
Randomized
NCT01373242 50 Liquid peanut
extract
Percentage of
subjects on
placebo vs peanut SLIT
who pass the
54 month
DBPCFC to assess
tolerance
No June 2021 Recruiting
Burks W,
USA
Mucosal immunotherapy
for peanut
allergy (MIT)
Allocation: Randomized
NCT00597675 45 Peanut flour An outcome measure will be
determined by
a comparison
of the result of the DBPCFC at
the starting and
at the end of the study for
each of the
subjects
No December 2012
Active, not recruiting
Burks W,
USA
Double blind peanut
sublingual
Allocation: Randomized
NCT00597727 80 Peanut protein Subject will successfully
pass a
Yes December 2014
Active, not recruiting

PI,
country
Title Study
design
ClinicalTrials.gov
identifier
No. of
participants
Intervention Primary
outcome
measures
Started
reporting
Estimated
study
completion
date
Status
immunotherapy
(PN SLIT)
DBPCFC at the
end of the study after
having been off
the SLIT for 2
to 4 weeks
Burks
W,
USA
Peanut oral
immunotherapy
Open label:
single group
assessment
NCT00598039 40 Peanut flour Subject will
pass a
DBPCFC at the end of the
study and a
second food
challenge 1 month later
after being off
peanut for 1 month
Yes July 2012 Active, not
recruiting
Burks
W,
USA
Mucosal
immunotherapy
for peanut allergy in young
children
(DEVIL)
Allocation:
Randomized
NCT00932828 60 Peanut and
placebo flour
To treat
peanut-allergic
subjects with PMIT and to
determine
whether this protocol lowers
their risk of
anaphylactic reactions and
causes long-
term tolerance
No December
2014
Active, not
recruiting
Burks W,
Immunotherapy for peanut
Non-randomized
NCT00429429 40 Sublingual peanut
A negative DBPCFC at the
Yes
May 2011 Completed

PI,
country
Title Study
design
ClinicalTrials.gov
identifier
No. of
participants
Intervention Primary
outcome
measures
Started
reporting
Estimated
study
completion
date
Status
USA allergy immunotherapy completion the
two years of the study
Burks
W, USA
Egg oral
immunotherapy (Egg OIT)
Open label:
single group assessment
NCT00597558 12 Egg white
protein
Subjects on egg
OIT will have a negative
DBPCFC to
egg when the IgE is < 2 kU/l
Yes July 2012 Active, not
recruiting
Burks
W,
USA
Pilot oral
immunotherapy
(OIT) – initial pilot study in
adults
Open label:
single group
assessment
NCT01274429 20 Powdered
peanut protein
To treat
peanut-allergic
subjects with POIT and to
determine
whether this protocol lowers
their risk of
anaphylactic
reactions and causes long-
term tolerance
No September
2014
Recruiting
Burks W,
USA
Peanut oral immunotherapy
and anti-
immunoglobulin
E (IgE) for peanut allergy
Allocation: Randomized
NCT00932282 10 Peanut oral immunotherapy;
omalizumab
The percentage of subjects who
pass the 20 gm
peanut flour (≈
50% peanut protein) oral
food challenge
following the desensitization
No July 2014 Recruiting

PI,
country
Title Study
design
ClinicalTrials.gov
identifier
No. of
participants
Intervention Primary
outcome
measures
Started
reporting
Estimated
study
completion
date
Status
phase of the
study
Burks
W,
USA
Oral
immunotherapy
(OIT) for peanut
allergy
Allocation:
Randomized
NCT00815035 60 Peanut flour To treat
peanut-allergic
subjects with
peanut OIT and to determine
whether this
protocol lowers their risk of
anaphylactic
reactions and
causes long-term tolerance
Yes November
2013
Active, not
recruiting
Burks
W, USA
Peanut
sublingual immunotherapy
Allocation:
Randomized
NCT00580606 40 Peanut powder Percentage of
desensitized participants
(while on daily
SLIT) as
measured by the 5 gm OFC
or a 10-fold
increase in the amount of
peanut powder,
compared to baseline oral
food challenge
Yes September
2013
Active, not
recruiting
Clark
AT, UK
Study of
tolerance to oral
Open label:
single group assessment
NCT01259804 22 Peanut oral
immunotherapy
Pass/fall peanut
challenge
Yes January
2012
Active, not
recruiting

PI,
country
Title Study
design
ClinicalTrials.gov
identifier
No. of
participants
Intervention Primary
outcome
measures
Started
reporting
Estimated
study
completion
date
Status
peanut (STOP)
Clark AT,
UK
Study of tolerance to oral
peanut:
Allocation: Randomized
ISRCTN62416244 104 Peanut oral immunotherapy
Proportion of subjects in the
active group
and control
groups who pass a peanut
challenge
No
August 2013
Active, recruiting
Dupont C,
France
Sublingual milk immunotherapy
in children
(Lactaide)
Allocation: Randomized
NCT00874627 51 Milk sublingual immunotherapy
Reactive milk dose at
inclusion; 6 mo
and 12 mo
Yes
December 2012
Active, not recruiting
Lollar KW,
USA
Sublingual immunotherapy
for food allergy
Active, not recruiting
NCT00736281 150 Food drops; food allergens
(peptides)
Validated Questionnaire
will be
administered to trial
participants at
3,6,9,12
months after achieving the
maintenance
dose of food drops
No October 2010
Active, not recruiting
Paassilta
M,
Finland
Safety of oral
immunotherapy
for cows’ milk allergy in
school-aged
children
Active, not
recruiting
NCT01361347 28 Milk oral
immunotherapy
Number of
participants
with adverse events as a
measure of
safety and
No December
2014
Active, not
recruiting

PI,
country
Title Study
design
ClinicalTrials.gov
identifier
No. of
participants
Intervention Primary
outcome
measures
Started
reporting
Estimated
study
completion
date
Status
tolerability
Spergel JM,.
USA
Milk oral immunotherapy
in children
Allocation: Randomized
NCT01162473 40 Milk oral Immunotherapy
The percentage of children
completing
desensitization
in each study group
No
June 2011 Enrolling by
invitation
Sampson
HA, USA
OIT and Xolair
(Omalizumab) in cows’ milk
allergy
Allocation:
Randomized
NCT01157117 76 Xolair
(omalizumab) placebo/milk
OIT
Percentage of
subjects in the Xolair
(omalizumab)
group vs
placebo group developing
clinical
tolerance to milk
No December
2014
Recruiting
Shreffler
WG,
USA
Oral peanut
immunotherapy
(PNOIT)
Allocation:
Randomized
NCT01324401 32 Peanut flour
OIT
Tolerance No March
2014
Recruiting
Wood R,
USA
A randomized,
double-blind,
placebo-
controlled study of oral milk
immunotherapy
for cows’ milk allergy
Allocation:
Randomized
NCT00465569 20 Milk oral
Immunotherapy
The percentage
of patients who
can tolerate
four times the initial OFC
threshold dose
or the maximum OFC
dose of 8
grams after therapy
Yes
June 2008 Completed
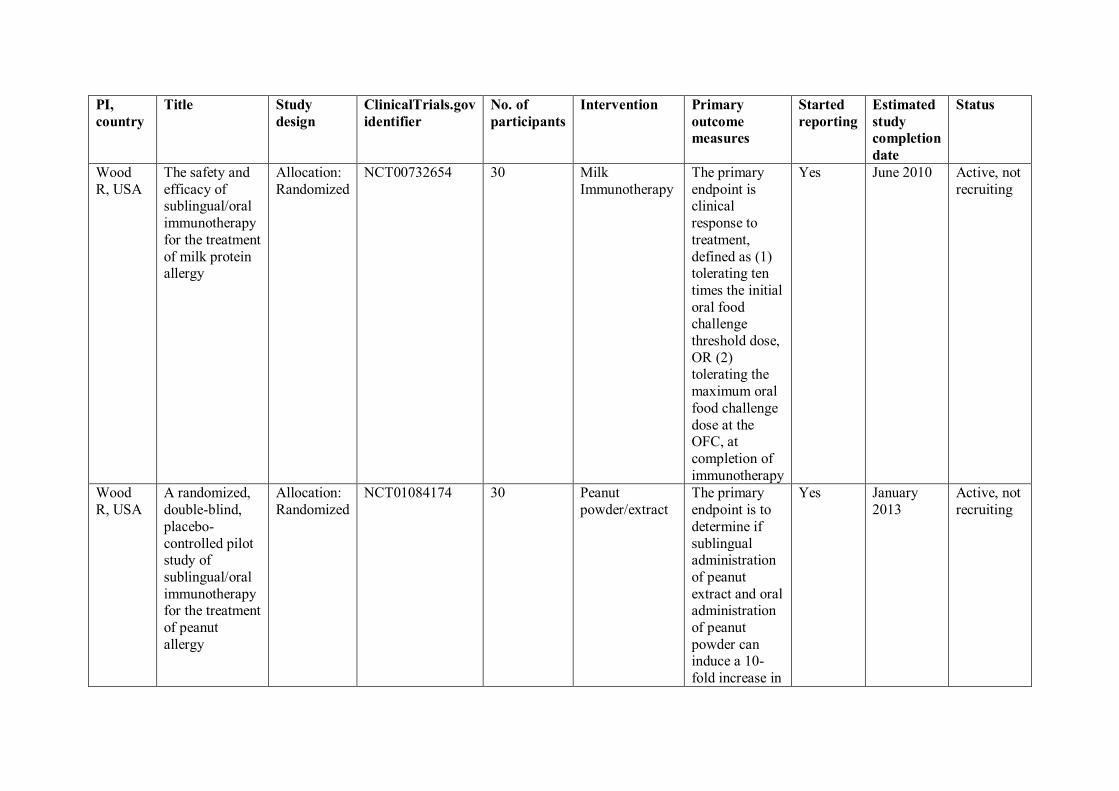
PI,
country
Title Study
design
ClinicalTrials.gov
identifier
No. of
participants
Intervention Primary
outcome
measures
Started
reporting
Estimated
study
completion
date
Status
Wood
R, USA
The safety and
efficacy of sublingual/oral
immunotherapy
for the treatment
of milk protein allergy
Allocation:
Randomized
NCT00732654 30 Milk
Immunotherapy
The primary
endpoint is clinical
response to
treatment,
defined as (1) tolerating ten
times the initial
oral food challenge
threshold dose,
OR (2) tolerating the
maximum oral
food challenge
dose at the OFC, at
completion of
immunotherapy
Yes June 2010 Active, not
recruiting
Wood
R, USA
A randomized,
double-blind,
placebo-
controlled pilot study of
sublingual/oral
immunotherapy for the treatment
of peanut
allergy
Allocation:
Randomized
NCT01084174 30 Peanut
powder/extract
The primary
endpoint is to
determine if
sublingual administration
of peanut
extract and oral administration
of peanut
powder can induce a 10-
fold increase in
Yes January
2013
Active, not
recruiting

PI,
country
Title Study
design
ClinicalTrials.gov
identifier
No. of
participants
Intervention Primary
outcome
measures
Started
reporting
Estimated
study
completion
date
Status
tolerance as
measured by food challenge