Embed Size (px)
Citation preview

Supplemental Material for
Endothelial CXCR7 Regulates Breast Cancer Metastasis
Amanda C. Stacer1
Joseph Fenner1
Stephen P. Cavnar2
Annie Xiao1
Shuang Zhao3
S. Laura Chang4
Anna Salomonnson1
Kathryn E. Luker1
Gary D. Luker1,2,5*
Figure S1. Deletion of endothelial CXCR7 elevates systemic CXCL12
Figure S2. Flow cytometry for CXCR4 and CXCR7 in AT-3 and E0771 cells
Figure S3. Figure S3. Spontaneous lung metastases in control and CXCR7END/END mice
Figure S4. Circulating AT-3-FL cells recovered from control and CXCR7END/END mice
Figure S5. Percentages of CXCR7END/END mice and control mice with detectable disseminated AT-3-FL cells in bone marrow
Figure S6. CXCR7END/END mice with experimentally-induced E0771 metastases
Figure S7. Figure S7. GSEA analysis shows negative correlation of CXCR7 with proliferation in breast cancer
A
CXCR7 deletion
CXCR7 intact
CXCR7ΔEND/ ΔEND
CXCR7loxP loxP
PCR primer
PCR primer
1.7 kB
Cre
PCR primer
PCR primer
150 BP
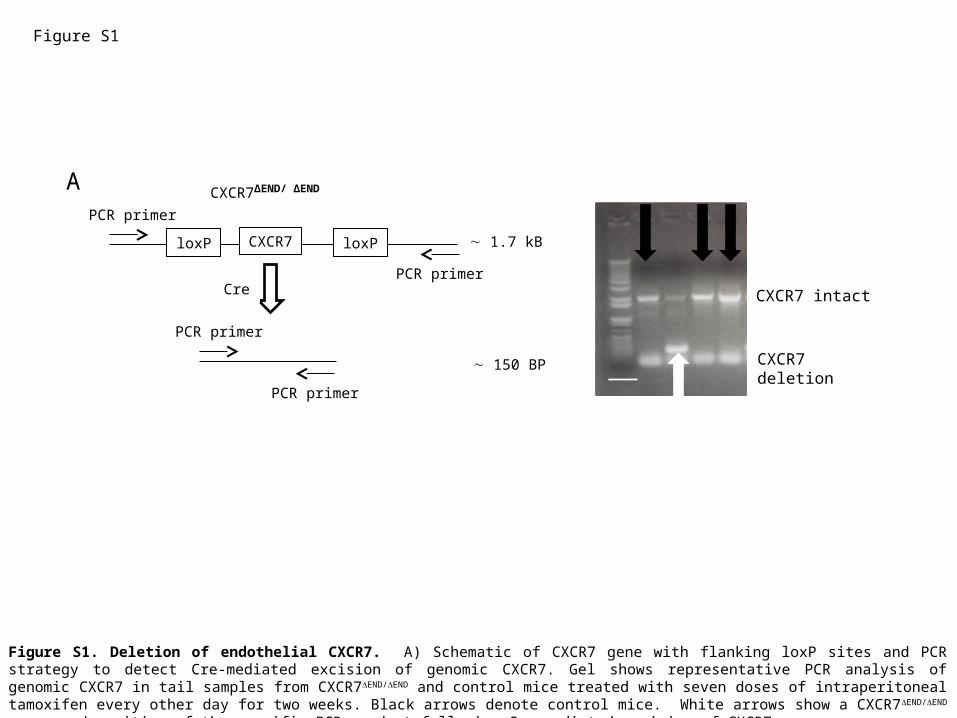
Figure S1
Figure S1. Deletion of endothelial CXCR7. A) Schematic of CXCR7 gene with flanking loxP sites and PCR strategy to detect Cre-mediated excision of genomic CXCR7. Gel shows representative PCR analysis of genomic CXCR7 in tail samples from CXCR7END/END and control mice treated with seven doses of intraperitoneal tamoxifen every other day for two weeks. Black arrows denote control mice. White arrows show a CXCR7END/END mouse and position of the specific PCR product following Cre-mediated excision of CXCR7.

B
Figure S1. Deletion of endothelial CXCR7. B) Immunofluorescence of liver shows reduced expression of CXCR7 on endothelium in CXCR7END/END mice. Scale bar denotes100 µm.
CD31
CXCR7
Merge
Control CXCR7END/ENDFigure S1

Figure S2. Deletion of endothelial CXCR7 elevates plasma levels of CXCL12. Graph displays mean values + SEM for plasma levels of CXCL12 in CXCR7END/END and control mice (n = 5 per group). *, p < 0.05.
Figure S2
AT-3
E0771
CXCR4
AT-3
E0771
CXCR7
Figure S3
Ce
ll n
um
be
rC
ell
nu
mb
er
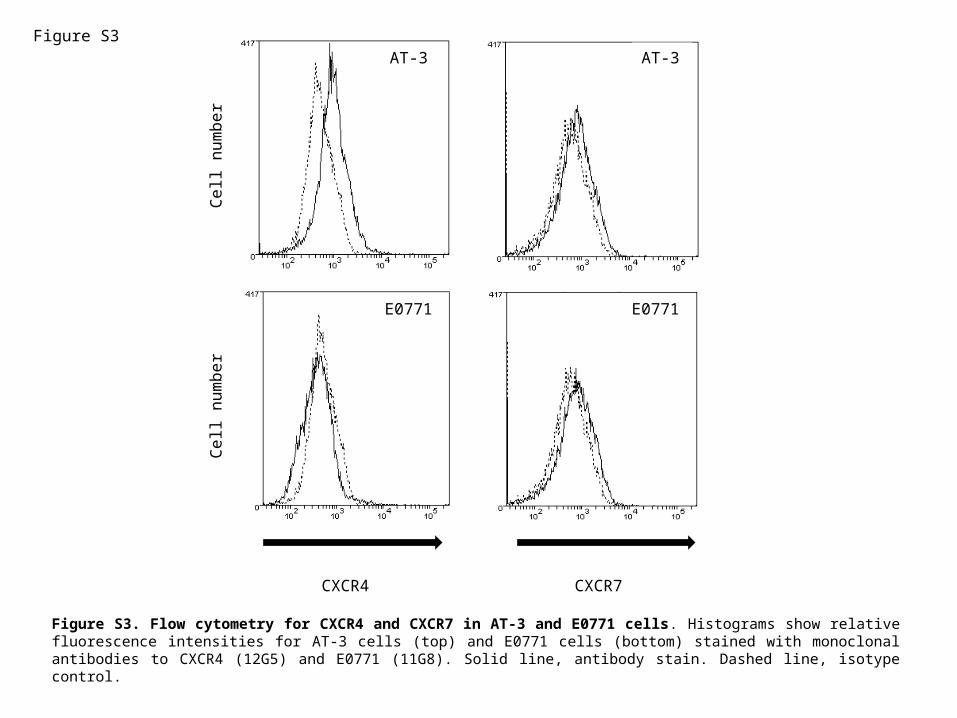
Figure S3. Flow cytometry for CXCR4 and CXCR7 in AT-3 and E0771 cells. Histograms show relative fluorescence intensities for AT-3 cells (top) and E0771 cells (bottom) stained with monoclonal antibodies to CXCR4 (12G5) and E0771 (11G8). Solid line, antibody stain. Dashed line, isotype control.
Control
CXCR7END/END
Figure S4
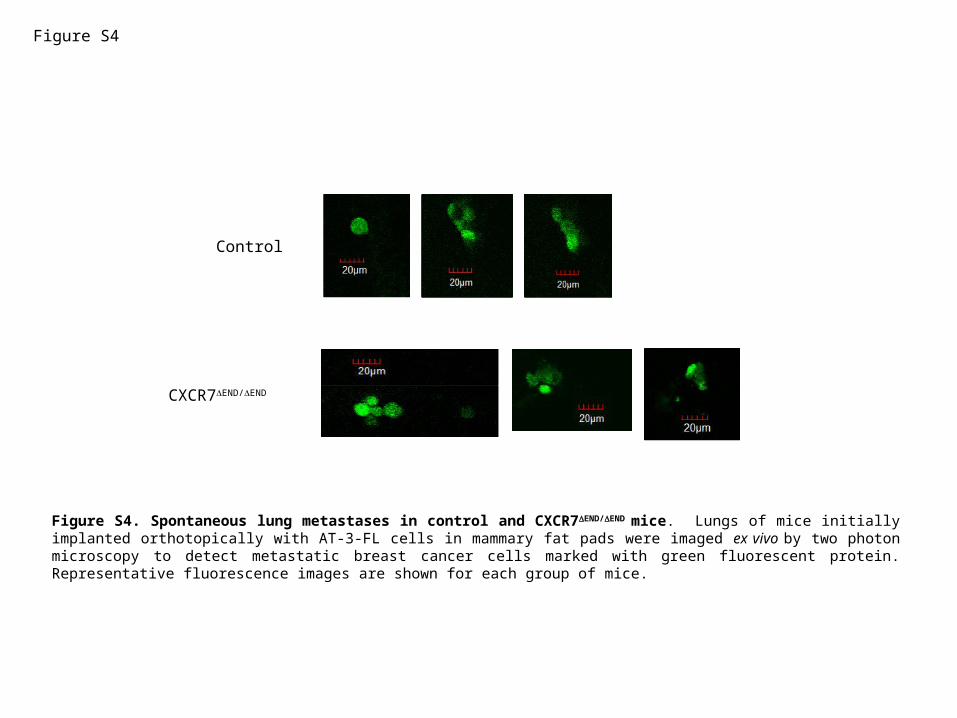
Figure S4. Spontaneous lung metastases in control and CXCR7END/END mice. Lungs of mice initially implanted orthotopically with AT-3-FL cells in mammary fat pads were imaged ex vivo by two photon microscopy to detect metastatic breast cancer cells marked with green fluorescent protein. Representative fluorescence images are shown for each group of mice.
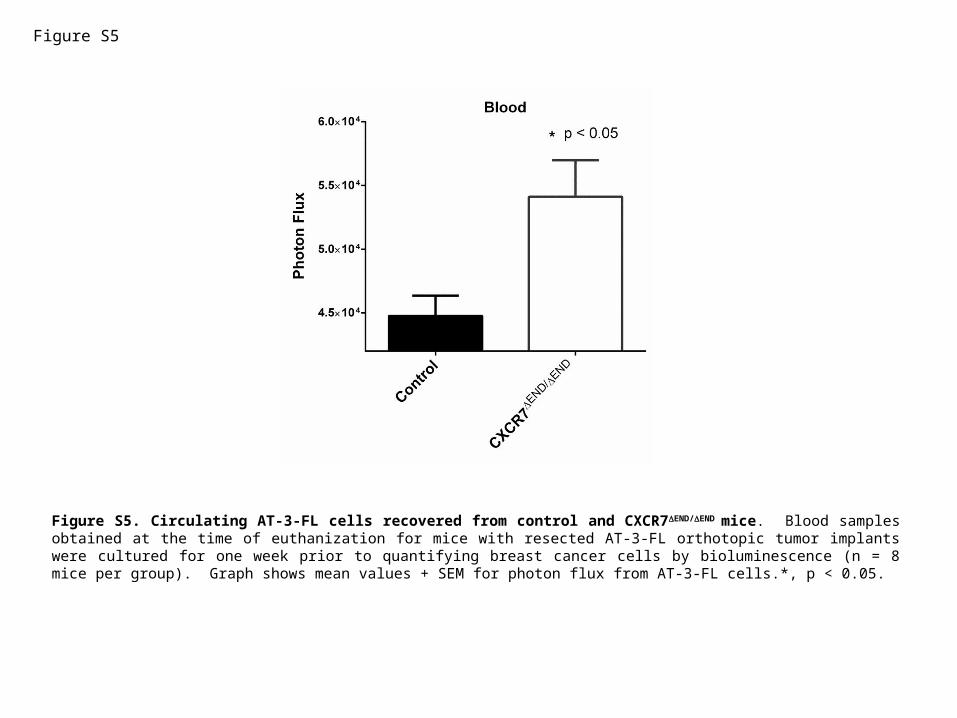
Figure S5
Figure S5. Circulating AT-3-FL cells recovered from control and CXCR7END/END mice. Blood samples obtained at the time of euthanization for mice with resected AT-3-FL orthotopic tumor implants were cultured for one week prior to quantifying breast cancer cells by bioluminescence (n = 8 mice per group). Graph shows mean values + SEM for photon flux from AT-3-FL cells.*, p < 0.05.
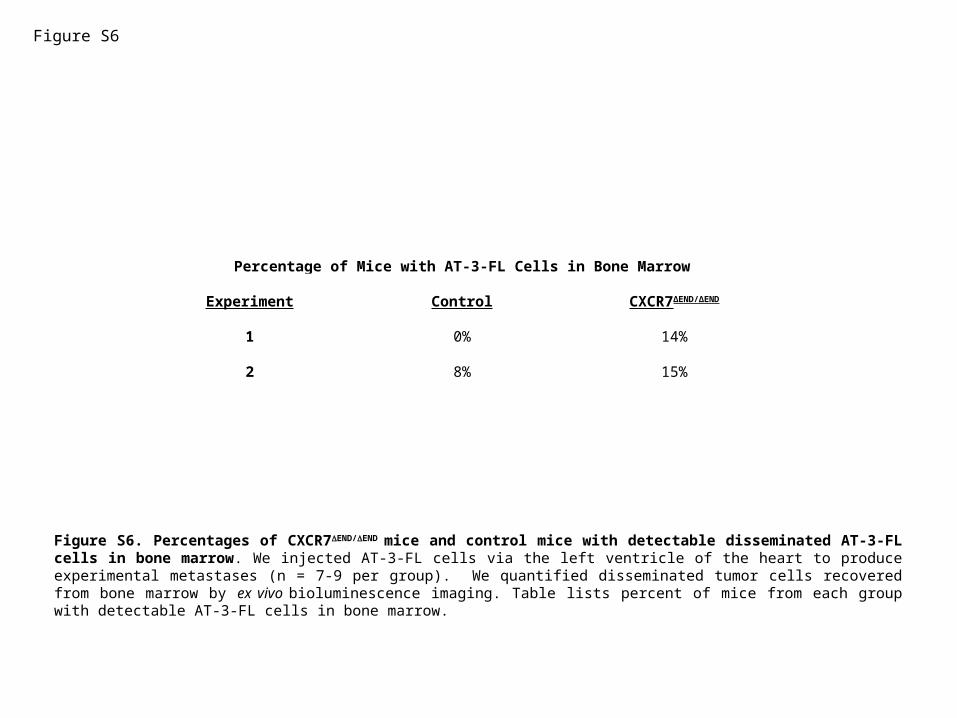
Figure S6. Percentages of CXCR7END/END mice and control mice with detectable disseminated AT-3-FL cells in bone marrow. We injected AT-3-FL cells via the left ventricle of the heart to produce experimental metastases (n = 7-9 per group). We quantified disseminated tumor cells recovered from bone marrow by ex vivo bioluminescence imaging. Table lists percent of mice from each group with detectable AT-3-FL cells in bone marrow.
Figure S6
Percentage of Mice with AT-3-FL Cells in Bone Marrow
Experiment Control CXCR7∆END/∆END
1 0% 14%
2 8% 15%

p = 0.1
Figure S7
Figure S7. CXCR7END/END mice with experimentally-induced E0771 metastases. We injected E0771 cells systemically via the left ventricle of the heart and monitored mice until each had to be euthanized for humane experimental endpoints (n = 8 per group). Kaplan-Meier curves show a trend toward shorter survival of CXCR7END/END mice, although differences were not significant (p = 0.1).
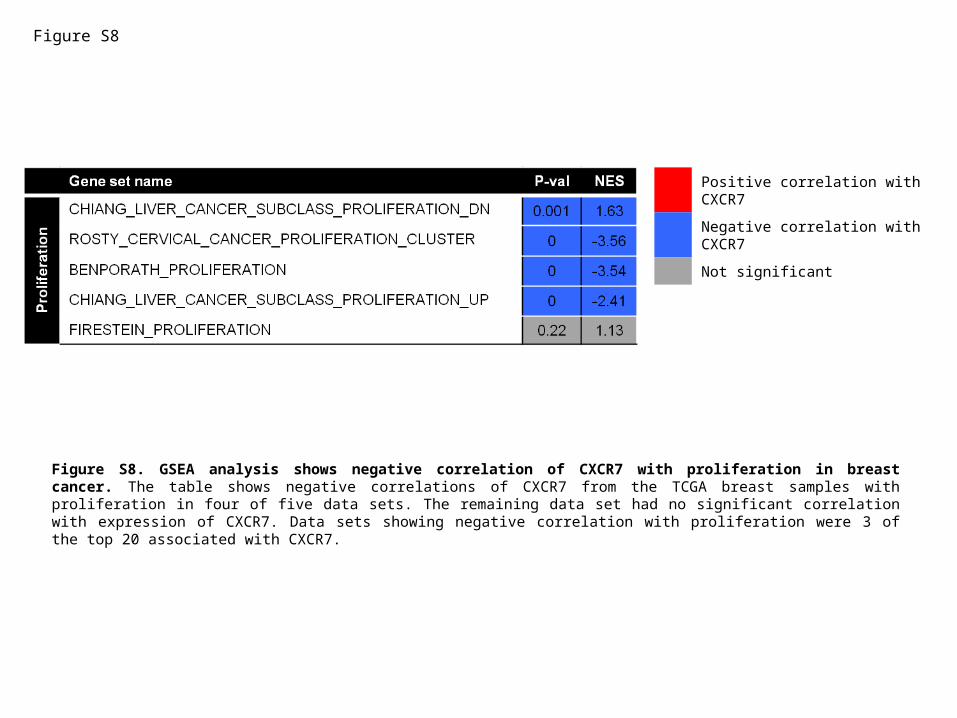
Positive correlation with CXCR7
Negative correlation with CXCR7
Not significant
Figure S8
Figure S8. GSEA analysis shows negative correlation of CXCR7 with proliferation in breast cancer. The table shows negative correlations of CXCR7 from the TCGA breast samples with proliferation in four of five data sets. The remaining data set had no significant correlation with expression of CXCR7. Data sets showing negative correlation with proliferation were 3 of the top 20 associated with CXCR7.