Embed Size (px)
Citation preview

Molecular Cell, Volume 52
Supplemental Information
Stable Pausing by RNA Polymerase II Provides an Opportunity to Target and Integrate Regulatory Signals Telmo Henriques, Daniel A. Gilchrist, Sergei Nechaev, Michael Bern, Ginger W. Muse, Adam Burkholder, David C. Fargo, and Karen Adelman
INVENTORY OF SUPPLEMENTAL INFORMATION Supplemental Data Supplemental Figure S1, related to Figure 1 p. 2-3 Supplemental Figure S2, related to Figure 2 p. 4 Supplemental Figure S3, related to Figure 3 p. 5 Supplemental Figure S4, related to Figure 4 p. 6 Supplemental Figure S5, related to Figure 5 p. 7 Supplemental Figure S6, related to Figure 6 p. 8 Supplemental Table S1, statistics on scRNA sequencing data p. 9-10 Supplemental Experimental Procedures p. 11-16 Supplemental References p. 17

Figure S1. Stringent washing of chromatin does not dissociate the paused elongation complex or release associated RNA species. Related to Figure 1. (A) Western analyses of detergent-washed chromatin and solubilized material confirm that the fully mature elongation complex, characterized by Serine-2 phosphorylation on the Rpb1-CTD, is left intact on chromatin throughout our washing procedure. In contrast, transcription factors such as heat shock factor (HSF) and transcript cleavage factor TFIIS are efficiently washed into the soluble nucleoplasm + cytoplasm fraction. (B) Small nuclear and nucleolar RNAs are released into the soluble fraction by the washing procedure. Shown is the ratio of normalized sequencing reads observed in the Soluble fraction/ chromatin pellet. scRNAs derived from mRNA TSSs (left, N=6,152) are generally more abundant in the chromatin fraction, whereas snRNAs and snoRNAs are enriched in the soluble fraction (P<0.0001, Mann-Whitney). Data for snRNAs and snoRNAs include reads around 78 TSSs that are significantly occupied by Pol II in ChIP-seq data and which generate RNA species of <120nt in length, allowing us to observe full-length RNA species in our scRNA-seq samples. (C) Permanganate footprints are indistinguishable when prepared from whole cells vs. the isolated chromatin fraction, indicating the stability of paused Pol II. Permanganate reactivity in cells and chromatin fractions are shown alongside purified DNA and the adenine + guanine (A+G) ladder used for position identification. The arrows indicate the TSSs and gene names are given below each footprint. Footprinting is performed as described (Nechaev et al., 2010). (D) The number of scRNAs detected in the chromatin-associated fraction from each gene TSS (from the TSS to +100nt downstream) is highly correlated with the number of Pol II ChIP-seq reads detected near the promoter (using a window from +/- 150 bp, plotted as RPKM/TSS) as well as the promoter-proximal GRO-seq signal (+/- 150 nt, shown as RPKM/TSS). However, there is little relationship between the level
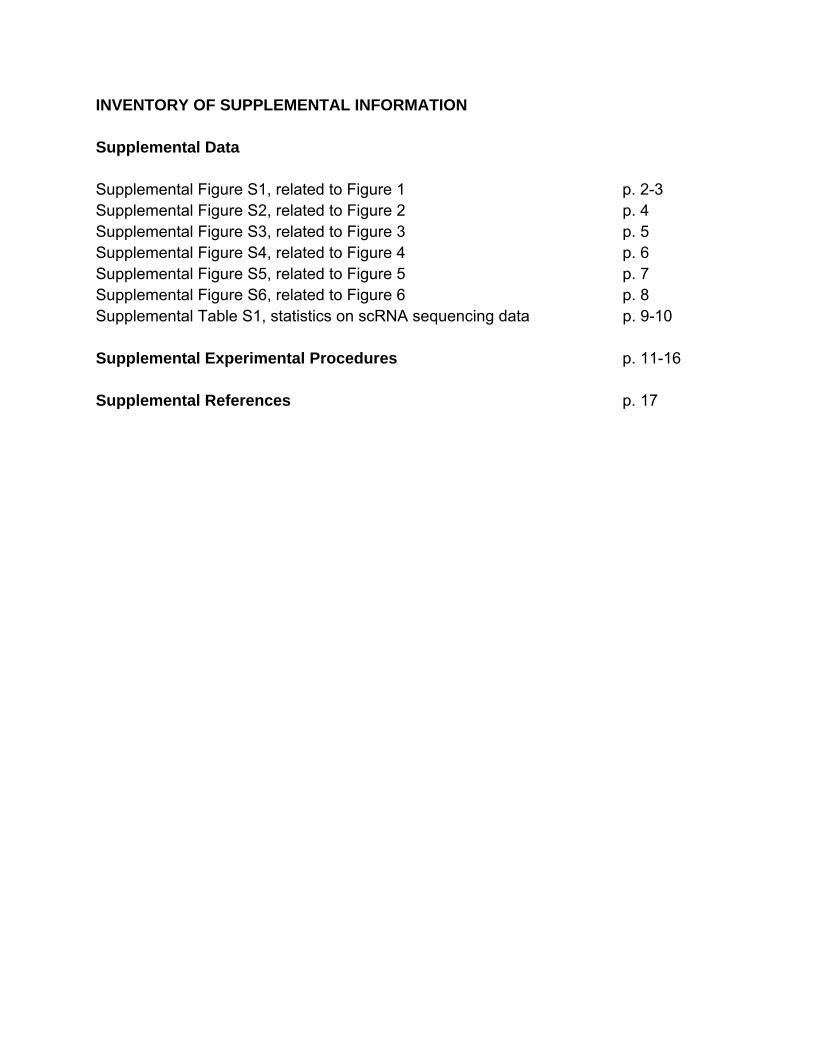
of scRNAs and gene activity as measured by Gene body GRO-seq signal (+250 to +1500 nt within the gene, RPKM/TSS). Shown are Drosophila genes with significant Pol II occupancy in Pol II ChIP-seq experiments (N=6,152 genes), defined as a signal of >150 RPKM within +/- 150bp of the TSS. Correlations are calculated as Spearman’s rho. (E) The number of scRNAs observed in the detergent-soluble fraction are compared to the Pol II data sets as shown in D. As shown in Figure 1D, the soluble scRNA species correspond better with the level of gene activity and less well with promoter Pol II signal than do the chromatin-associated scRNAs. (F) Whereas 3’-ends are tightly focused in the pausing region in the chromatin-associated fraction, 3’-end reads are more diffusely distributed across the initially transcribed region in the soluble fraction. Composite metagene analysis of scRNA reads 3’-ends in the chromatin-associated pellet (left axis, blue) or detergent-soluble fraction (right axis, red). Shown is the average number and position of scRNA 3’-end reads per TSS at the top decile of genes when rank ordered by promoter Pol II ChIP-seq signal. (G) Northern analysis of short RNAs derived from the Hsp70 (top) and CG9008 (bottom) genes reveals tight chromatin-association. Specific RNAs are denoted by brackets or arrows at right. We note that short RNA species are cross-linked to the nitrocellulose through their 5’-ends (Pall and Hamilton, 2008), which cannot occur if the species has a 5’-end cap. Therefore, the requirement for decapping to observe RNA signal is indicative of a high level of 5’-end capping of short RNAs in vivo. Two non-specific bands that were detected on multiple blots in a decapping-independent fashion are shown by asterisks.
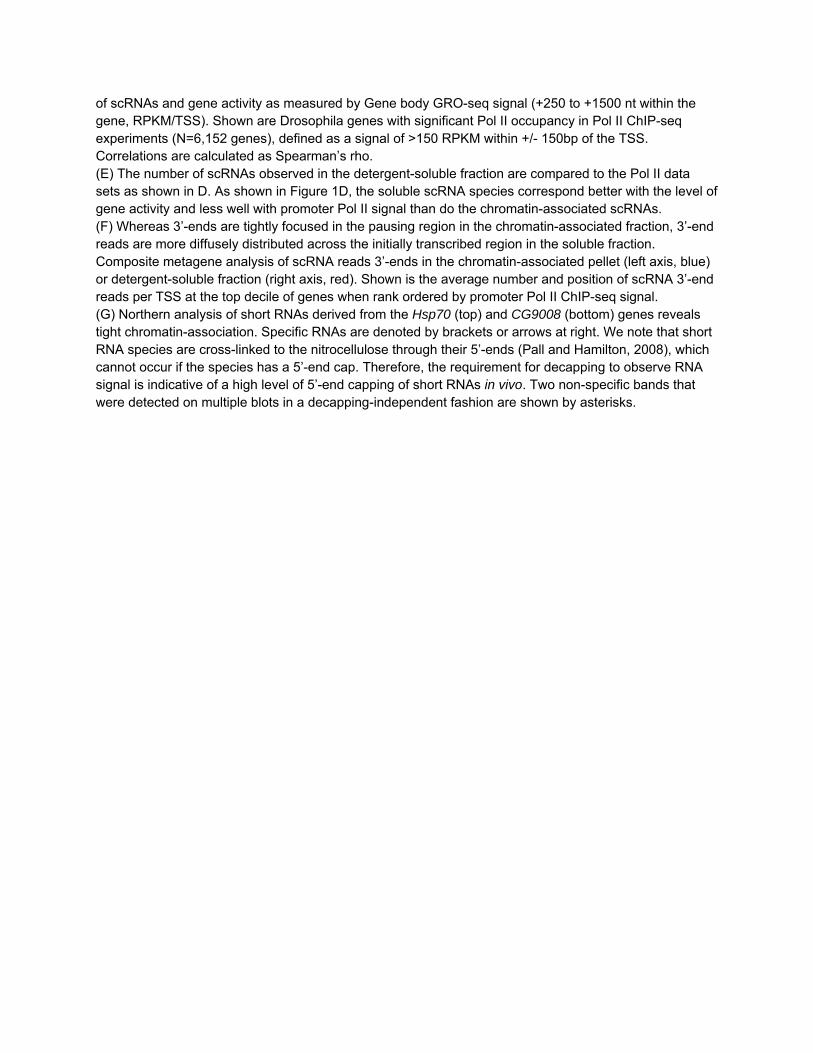
Figure S2. Exosome depletion reveals oligo-adenylated tssRNAs. Related to Figure 2. (A) Western analyses of Mock-treated and Rrp40-depleted samples confirming efficient knock-down of Rrp40 protein levels. Rrp40 antibody was the kind gift of Erik Andrulis (Case Western Reserve). Ser2-P Pol II is shown as an internal control. (B) Comparison of the number of scRNA reads in Mock-tr. vs. Rrp40-dep. samples in the top quartile of genes when sorted by promoter Pol II signal (left) pausing index (middle), or mRNA expression by microarray (right). (C) Comparison of scRNA reads in Mock-tr. vs. Rrp40-dep. samples across all 6,152 Pol II occupied genes. Correlation is calculated using Spearman’s rho. Statistical analysis of read counts (Supplemental Experimental Procedures) also failed to identify TSSs that were significantly affected by Rrp40-depletion. (D) Rrp40-depletion stabilizes scRNAs with A residues at the 3’-end. Reads that did not map to the Drosophila genome contained an elevated level of A residues at the 3’-end in exosome-depleted cells. (E) No such enrichment was observed for oligo-U or other nucleotides (not shown). (F) Blocking pause release with Flavopiridol treatment (500 nM, 10 minutes) did not shift the distribution of reads bearing non-templated oligo-A tails (compare to Figure 2G). (G) Heat maps of oligo-A scRNAs 3'-ends from Mock-tr. or Rrp40-dep. cells with genes rank ordered by decreasing mRNA expression. A modest enrichment is observed at highly expressed genes, suggesting some evidence for degradation intermediates in these samples. Also shown is the effect of Flavopiridol treatment. We observe a modest increase in the number (but not the fraction) of oligo-A species in Rrp40-dep. cells treated with Flavopiridol, supporting the idea that they are generated by termination of paused Pol II. Arrows represent the positions at which 50% of the reads lie (compare to Figure 1D).
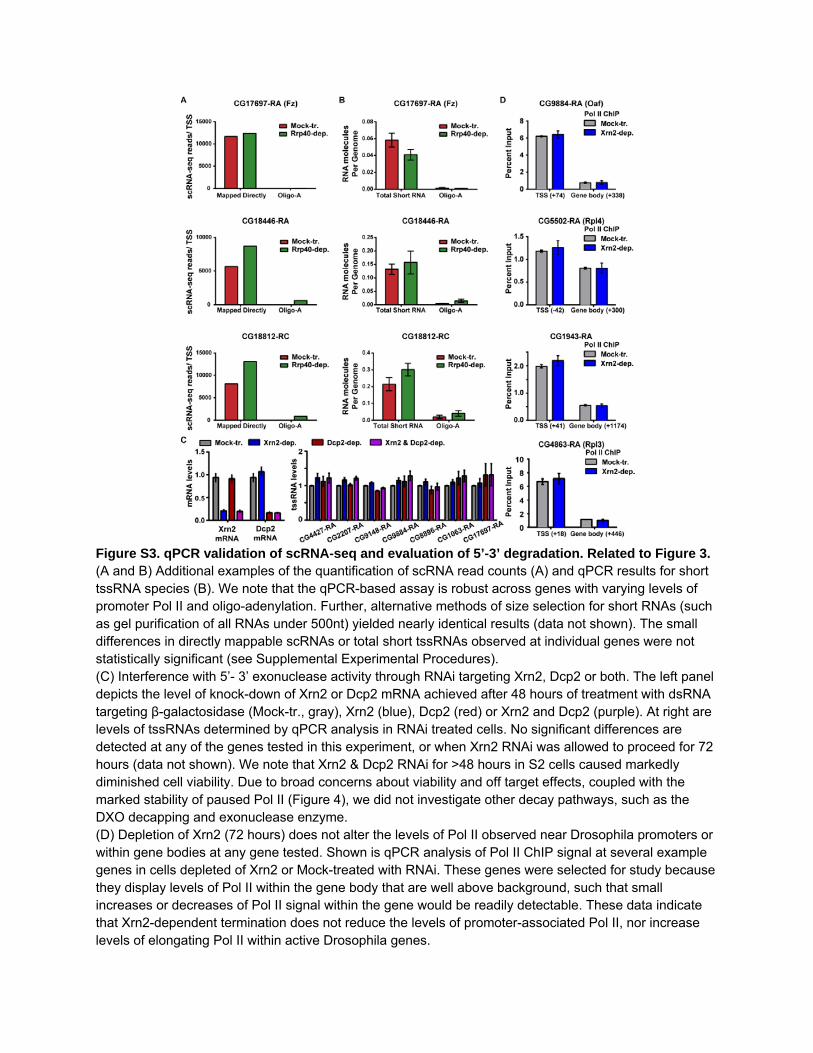
Figure S3. qPCR validation of scRNA-seq and evaluation of 5’-3’ degradation. Related to Figure 3. (A and B) Additional examples of the quantification of scRNA read counts (A) and qPCR results for short tssRNA species (B). We note that the qPCR-based assay is robust across genes with varying levels of promoter Pol II and oligo-adenylation. Further, alternative methods of size selection for short RNAs (such as gel purification of all RNAs under 500nt) yielded nearly identical results (data not shown). The small differences in directly mappable scRNAs or total short tssRNAs observed at individual genes were not statistically significant (see Supplemental Experimental Procedures). (C) Interference with 5’- 3’ exonuclease activity through RNAi targeting Xrn2, Dcp2 or both. The left panel depicts the level of knock-down of Xrn2 or Dcp2 mRNA achieved after 48 hours of treatment with dsRNA targeting β-galactosidase (Mock-tr., gray), Xrn2 (blue), Dcp2 (red) or Xrn2 and Dcp2 (purple). At right are levels of tssRNAs determined by qPCR analysis in RNAi treated cells. No significant differences are detected at any of the genes tested in this experiment, or when Xrn2 RNAi was allowed to proceed for 72 hours (data not shown). We note that Xrn2 & Dcp2 RNAi for >48 hours in S2 cells caused markedly diminished cell viability. Due to broad concerns about viability and off target effects, coupled with the marked stability of paused Pol II (Figure 4), we did not investigate other decay pathways, such as the DXO decapping and exonuclease enzyme. (D) Depletion of Xrn2 (72 hours) does not alter the levels of Pol II observed near Drosophila promoters or within gene bodies at any gene tested. Shown is qPCR analysis of Pol II ChIP signal at several example genes in cells depleted of Xrn2 or Mock-treated with RNAi. These genes were selected for study because they display levels of Pol II within the gene body that are well above background, such that small increases or decreases of Pol II signal within the gene would be readily detectable. These data indicate that Xrn2-dependent termination does not reduce the levels of promoter-associated Pol II, nor increase levels of elongating Pol II within active Drosophila genes.
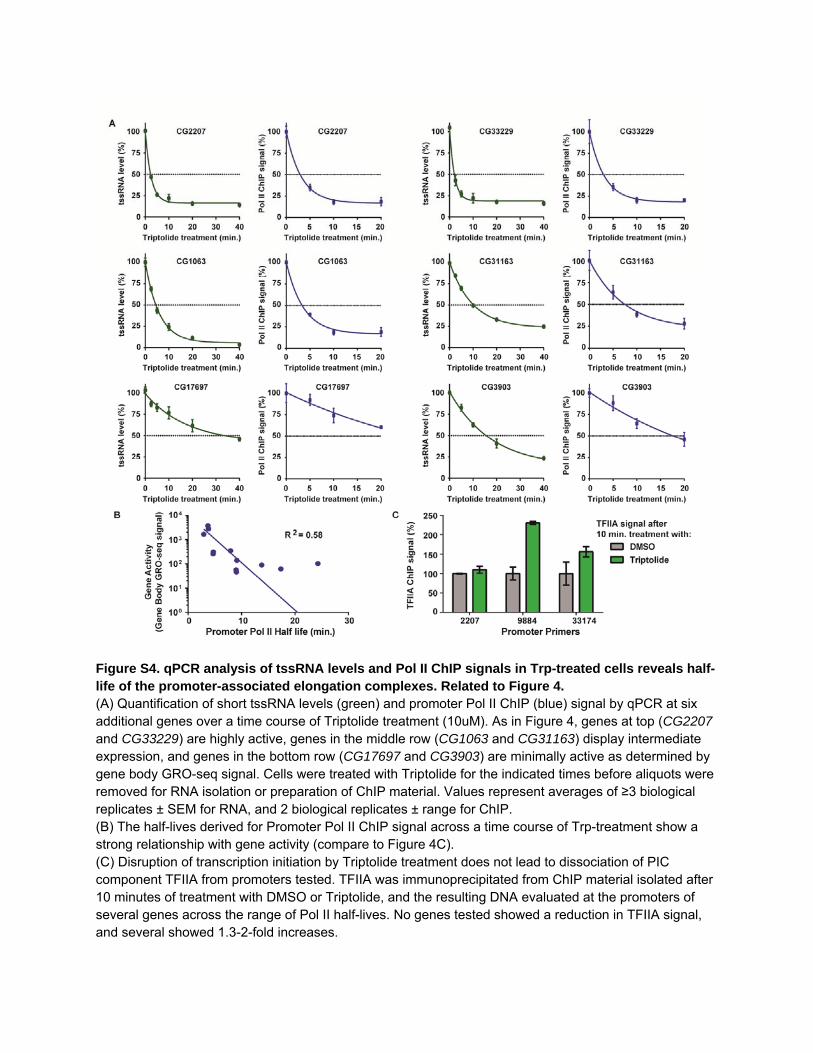
Figure S4. qPCR analysis of tssRNA levels and Pol II ChIP signals in Trp-treated cells reveals half-life of the promoter-associated elongation complexes. Related to Figure 4. (A) Quantification of short tssRNA levels (green) and promoter Pol II ChIP (blue) signal by qPCR at six additional genes over a time course of Triptolide treatment (10uM). As in Figure 4, genes at top (CG2207 and CG33229) are highly active, genes in the middle row (CG1063 and CG31163) display intermediate expression, and genes in the bottom row (CG17697 and CG3903) are minimally active as determined by gene body GRO-seq signal. Cells were treated with Triptolide for the indicated times before aliquots were removed for RNA isolation or preparation of ChIP material. Values represent averages of ≥3 biological replicates ± SEM for RNA, and 2 biological replicates ± range for ChIP. (B) The half-lives derived for Promoter Pol II ChIP signal across a time course of Trp-treatment show a strong relationship with gene activity (compare to Figure 4C). (C) Disruption of transcription initiation by Triptolide treatment does not lead to dissociation of PIC component TFIIA from promoters tested. TFIIA was immunoprecipitated from ChIP material isolated after 10 minutes of treatment with DMSO or Triptolide, and the resulting DNA evaluated at the promoters of several genes across the range of Pol II half-lives. No genes tested showed a reduction in TFIIA signal, and several showed 1.3-2-fold increases.
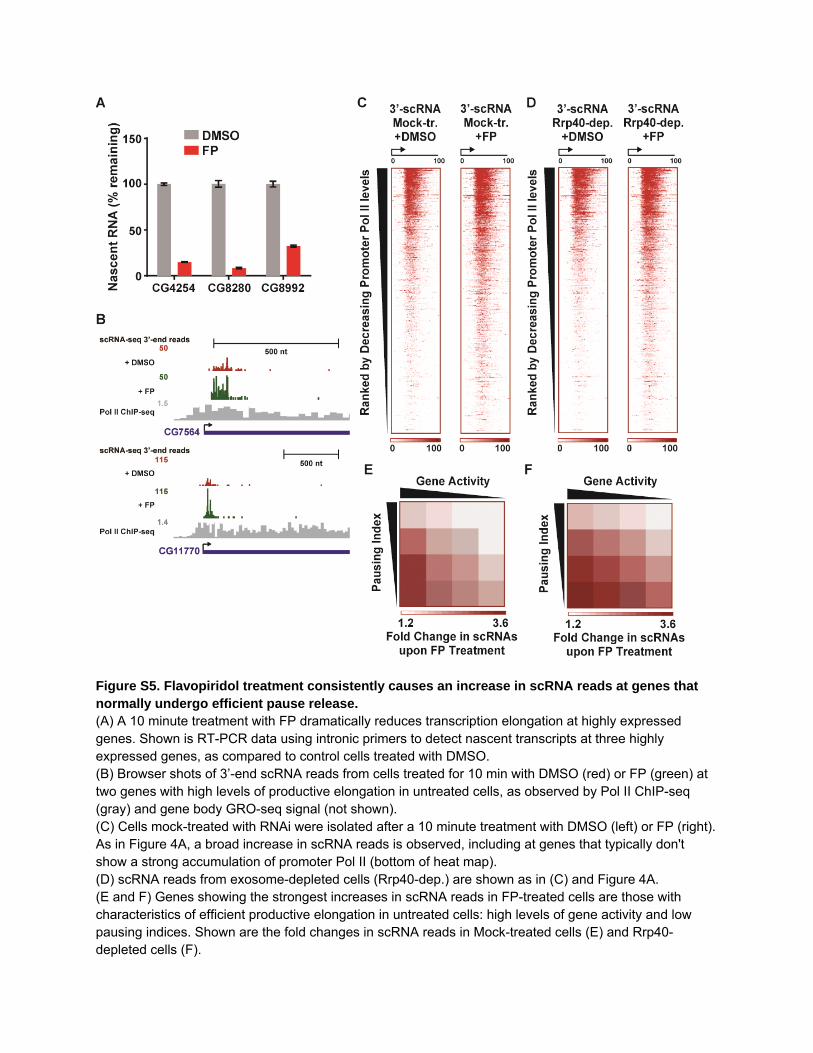
Figure S5. Flavopiridol treatment consistently causes an increase in scRNA reads at genes that normally undergo efficient pause release. (A) A 10 minute treatment with FP dramatically reduces transcription elongation at highly expressed genes. Shown is RT-PCR data using intronic primers to detect nascent transcripts at three highly expressed genes, as compared to control cells treated with DMSO. (B) Browser shots of 3’-end scRNA reads from cells treated for 10 min with DMSO (red) or FP (green) at two genes with high levels of productive elongation in untreated cells, as observed by Pol II ChIP-seq (gray) and gene body GRO-seq signal (not shown). (C) Cells mock-treated with RNAi were isolated after a 10 minute treatment with DMSO (left) or FP (right). As in Figure 4A, a broad increase in scRNA reads is observed, including at genes that typically don't show a strong accumulation of promoter Pol II (bottom of heat map). (D) scRNA reads from exosome-depleted cells (Rrp40-dep.) are shown as in (C) and Figure 4A. (E and F) Genes showing the strongest increases in scRNA reads in FP-treated cells are those with characteristics of efficient productive elongation in untreated cells: high levels of gene activity and low pausing indices. Shown are the fold changes in scRNA reads in Mock-treated cells (E) and Rrp40-depleted cells (F).
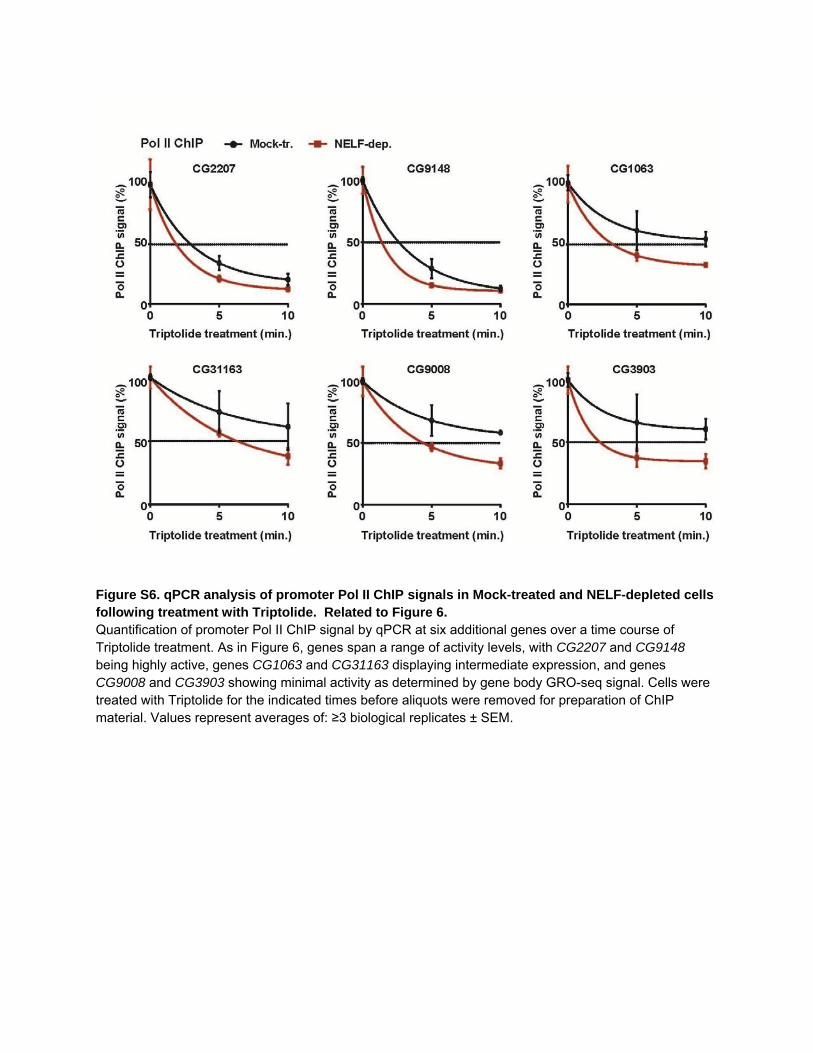
Figure S6. qPCR analysis of promoter Pol II ChIP signals in Mock-treated and NELF-depleted cells following treatment with Triptolide. Related to Figure 6. Quantification of promoter Pol II ChIP signal by qPCR at six additional genes over a time course of Triptolide treatment. As in Figure 6, genes span a range of activity levels, with CG2207 and CG9148 being highly active, genes CG1063 and CG31163 displaying intermediate expression, and genes CG9008 and CG3903 showing minimal activity as determined by gene body GRO-seq signal. Cells were treated with Triptolide for the indicated times before aliquots were removed for preparation of ChIP material. Values represent averages of: ≥3 biological replicates ± SEM.
Supplemental Tables S1
A
Sample
Data type
Total reads
Uniquely mapped reads (Percentage of
total)
Agreement between
replicates
Whole cells 3’ RNA 23,025,433 12,616,491 (54.8%) 0.9574* Chromatin-assoc. 3’ RNA 72,693,475 56,360,556 (77.5%) 0.9502 Detergent Soluble 3’ RNA 68,673,500 20,675,085 (30.1%) 0.9419 Mock-tr. 3’ RNA 41,074,556 26,750,577 (65.1%) 0.9544 Rrp40-dep. 3’ RNA 39,920,434 24,625,416 (58.1%) 0.9525 DMSO-tr. 3’ RNA 26,829,790 16,483,358 (61.4%) 0.9574* FP-tr. 3’ RNA 18,387,815 10,686,249 (58.1%) 0.9727†
Mock-tr. + FP 3’ RNA 27,740,357 18,226,519 (65.7%) 0.9727†
Rrp40-dep. + FP 3’ RNA 29,784,481 16,985,447 (57.0%) NA
B
Breakdown of uniquely mappable reads (given as % of mappable reads):
Sample TSS-proximal Gene Body Extragenic Chromatin-assoc. 73.7 12.5 13.8 Detergent Soluble 58.4 32.3 9.3 Mock-tr. 77.2 11.8 11.0 Rrp40-dep. 74.8 13.1 12.2 Mock-tr. Oligo-A 5.4 2.0 92.6 Rrp40-dep. oligoA 40.1 7.4 52.5
C
Breakdown of unmappable reads (given as % of unmappable reads):
Sample
Aligned non-uniquely (multiple
locations)
Aligned to transcriptome
(i.e. spliced reads)
Adapter Poor
Quality Uncharacterized
Chromatin-assoc.
31.0 3.85 15.99 32.4 16.79
Detergent Soluble
40.8 15.17 4.44 14.01 25.58
D
Breakdown of reads that map to multiple locations (given as % of multi-mapped):
Sample rRNA tRNA sn/snoRNA histone cluster
Uncharacterized regions
within mRNA
LTR Other
Chromatin-assoc.
9.85 1.36 7.57 2.73 19.92 18.68 34.65 5.23
Detergent Soluble
40.02 10.43 6.11 1.03 28.54 8.45 2.47 2.95
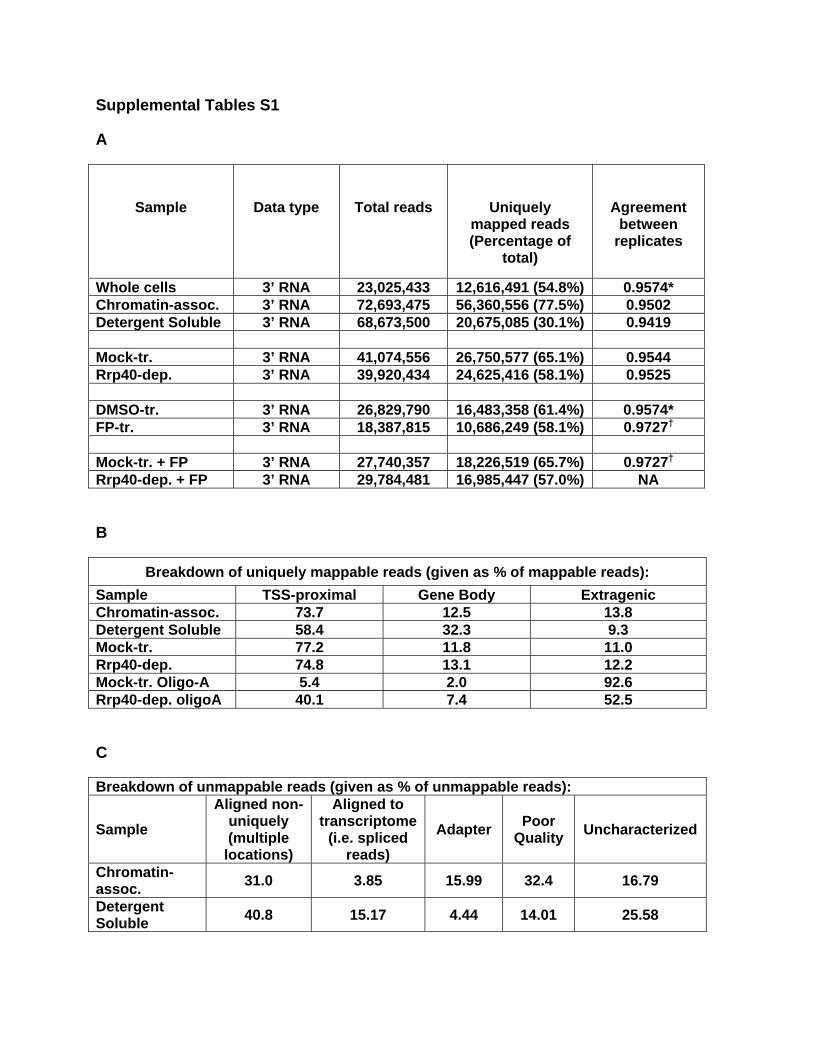
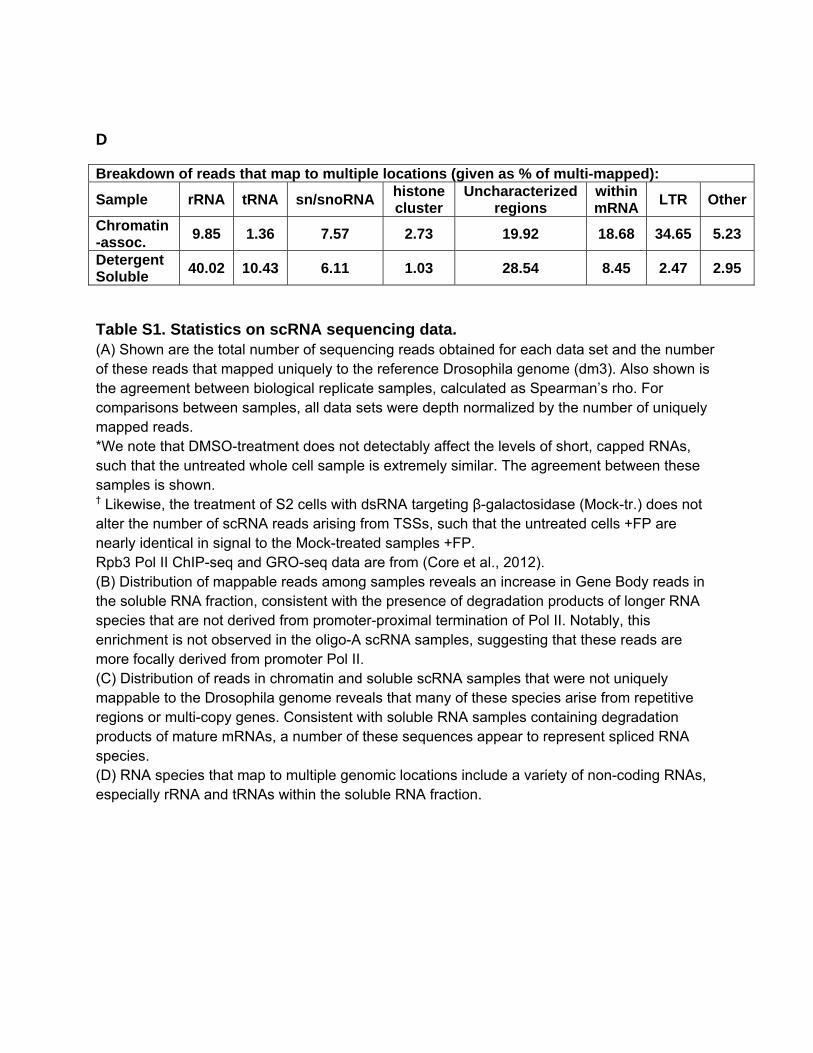
Table S1. Statistics on scRNA sequencing data. (A) Shown are the total number of sequencing reads obtained for each data set and the number of these reads that mapped uniquely to the reference Drosophila genome (dm3). Also shown is the agreement between biological replicate samples, calculated as Spearman’s rho. For comparisons between samples, all data sets were depth normalized by the number of uniquely mapped reads. *We note that DMSO-treatment does not detectably affect the levels of short, capped RNAs, such that the untreated whole cell sample is extremely similar. The agreement between these samples is shown. † Likewise, the treatment of S2 cells with dsRNA targeting β-galactosidase (Mock-tr.) does not alter the number of scRNA reads arising from TSSs, such that the untreated cells +FP are nearly identical in signal to the Mock-treated samples +FP. Rpb3 Pol II ChIP-seq and GRO-seq data are from (Core et al., 2012). (B) Distribution of mappable reads among samples reveals an increase in Gene Body reads in the soluble RNA fraction, consistent with the presence of degradation products of longer RNA species that are not derived from promoter-proximal termination of Pol II. Notably, this enrichment is not observed in the oligo-A scRNA samples, suggesting that these reads are more focally derived from promoter Pol II. (C) Distribution of reads in chromatin and soluble scRNA samples that were not uniquely mappable to the Drosophila genome reveals that many of these species arise from repetitive regions or multi-copy genes. Consistent with soluble RNA samples containing degradation products of mature mRNAs, a number of these sequences appear to represent spliced RNA species. (D) RNA species that map to multiple genomic locations include a variety of non-coding RNAs, especially rRNA and tRNAs within the soluble RNA fraction.
SUPPLEMENTAL EXPERIMENTAL PROCEDURES Cell Fractionation Cell fractionation was performed as described previously (Wysocka et al., 2001) with modifications. In brief, approximately 5x10⁷ Drosophila S2 cells were collected by centrifugation and, after washing with ice-cold 1xPBS, were lysed in 1 ml of Buffer A (10 mM HEPES [pH 7.9], 10 mM KCl, 1.5 mM MgCl2, 0.34 M sucrose, 10% glycerol, 1 mM dithiothreitol, 0.1% Triton-X-100 and Superase-in RNAse inhibitor (Ambion)) by incubating for 10 minutes on ice followed by a 5-minute spin at 1500 g. The first supernatant (cytoplasm) was removed and the pellet was resuspended in 1 ml of buffer B (3 mM EDTA, 0.2 mM EGTA, 1 mM dithiothreitol, Superase-in RNAse inhibitor), incubated and spun as above. The second supernatant (nucleoplasm) was removed and the chromatin pellet was resuspended in 1 ml buffer B. Samples analyzed by scRNA-seq were: whole cells in Buffer A, the two combined supernatants representing the detergent-soluble fraction, and the chromatin-associated pellet, using a uniform cell equivalent portion of each fraction. Short RNA Northern Blotting Total RNA was size-separated using 15% urea-TBE PAGE and short (~20-200 nt) RNAs were extracted from the gel using crush-and-soak method and, where designated, treated with tobacco acid pyrophosphatase (Epicentre) to remove the 5’-cap. The de-capped short RNA was loaded on a 10% urea-TBE gel and blotted to Hybond-NX membrane (GE Healthcare) using semi-dry transfer in 0.5xTBE. RNA was then covalently bound to the membrane using 1-ethyl-3-(3-dimethylaminopropyl) carbodiimide (EDC) chemical crosslinking (Pall and Hamilton, 2008). The membrane was blocked in ULTRAhyb-Oligo buffer (Invitrogen) and hybridized in the same buffer with 5’-32P labeled probe. Probes were either DNA (Hsp70, sequence 5'-GCG ACG TGT TCA CTT TGC TTG TTT GAA TTG A-3', IDT) or Locked Nucleic Acid (CG9008; sequence 5’-TCT GCC AAC GAG CGA CCG ATT G-3’, Exiqon). Hybridization was performed, respectively, at 30°C or 45°C followed by washing at 42°C or 65°C with 2xSSC or 0.2xSSC before autoradiography. Short-RNA qPCR A qPCR assay was developed to quantify short tssRNAs that was based on protocols and reagents designed to measure miRNA levels, using a strategy similar to one used previously (Conrad et al., 2012).To isolate and reverse-transcribe short RNAs as shown in Figure 3, total RNA smaller than 200nt was harvested from a known quantity of cells using the Qiagen miRNeasy Mini Kit and RNeasy MinElute Cleanup Kit. To confirm that this method of size-selection was not biasing our results, select experiments were repeated following gel-based size selection of species under 500nt, giving nearly identical results (data not shown). Four synthetic spike-in control RNAs were added during RNA isolation at a ratio of 10 copies per genome present, as defined in (Zhang et al., 2010). For quantification of total short RNA, 200ng of isolated short RNA was Oligo-A tailed in vitro using 1.5U of E. coli Poly(A) Polymerase (NEB) for 20min at 37°C (diagramed in Figure 3B). To quantify only
those short RNAs that were oligo-adenylated in vivo, the A-tailing step was omitted. Samples were then reverse transcribed with an anchored oligo-dT primer (IDT) using SuperScript II Reverse Transcriptase (Invitrogen) according to the manufacturer’s instructions. RNAs were degraded using 3U of RNAse H (Epicentre) for 20min at 37°C. To isolate and reverse-transcribe total short RNA as shown in Figure 4 and 6, known quantities of cells were flash frozen at the time points indicated. Total RNA smaller than 200bp were harvested and spiked with synthetic RNAs as above. 200ng of isolated RNA was reverse transcribed using the Qiagen miScript Reverse Transcription Kit according to the manufacturer’s instructions. qPCR measurements were performed identically for Figures 3, 4, and 6, using a universal reverse primer together with gene-specific forward primers complementary to the 5’-ends of the nascent RNAs. qPCR signals derived from isolated cellular RNA and added spike-in controls were normalized by spike-in molar equivalents to account for the efficiency of the reverse transcription and amplification reactions. To estimate the number of transcripts per cell through linear interpolation, standard curves specific to each gene were generated by qPCR of serial dilutions of an ssRNA oligonucleotide corresponding to the primary short tssRNA species detected at that gene, as well as for each of the spike-in RNAs. The number of molecules per genome was calculated based on a comparison of spike-in normalized cellular values to the standard curve generated for that RNA species. Of the 13 genes analyzed in Trp-treated cells, we note that only (CG9884) displayed any increase in gene body GRO-seq signal in samples from NELF-depleted cells (Core et al., 2012), demonstrating that the accelerated loss of Pol II from promoters in Trp-treated samples lacking NELF is not due to increased productive elongation. ChIP Pol II ChIP was performed using the anti-Rpb3 antibody as previously described (Muse et al., 2007) except cells were crosslinked for 12 minutes. For ChIP time courses of triptolide treatment, cells were resuspended by shaking and incubated with 10 µM triptolide or an equivalent volume of DMSO. At the indicated times aliquots were removed and crosslinked with formaldehyde. The percent of Pol II ChIP signal remaining at each time point was calculated relative to the value prior to addition of inhibitor. All data points represent the average of 3-4 biological replicates and error bars depict SEM. For flavopiridol treatment experiments, cells were resuspended and incubated with 500 nM flavopiridol for 10 minutes prior to formaldehyde crosslinking. Each Pol II immunoprecipitation was performed in duplicate. The percent of Pol II ChIP signal in FP treated samples was calculated relative to control (DMSO) values. Data points represent the average of 3 biological replicates +/- SEM. Chip material was evaluated using primer pairs that amplified a 100-200 bp region centered on the promoter, unless otherwise indicated. The center position of promoter primer pairs are as follows:
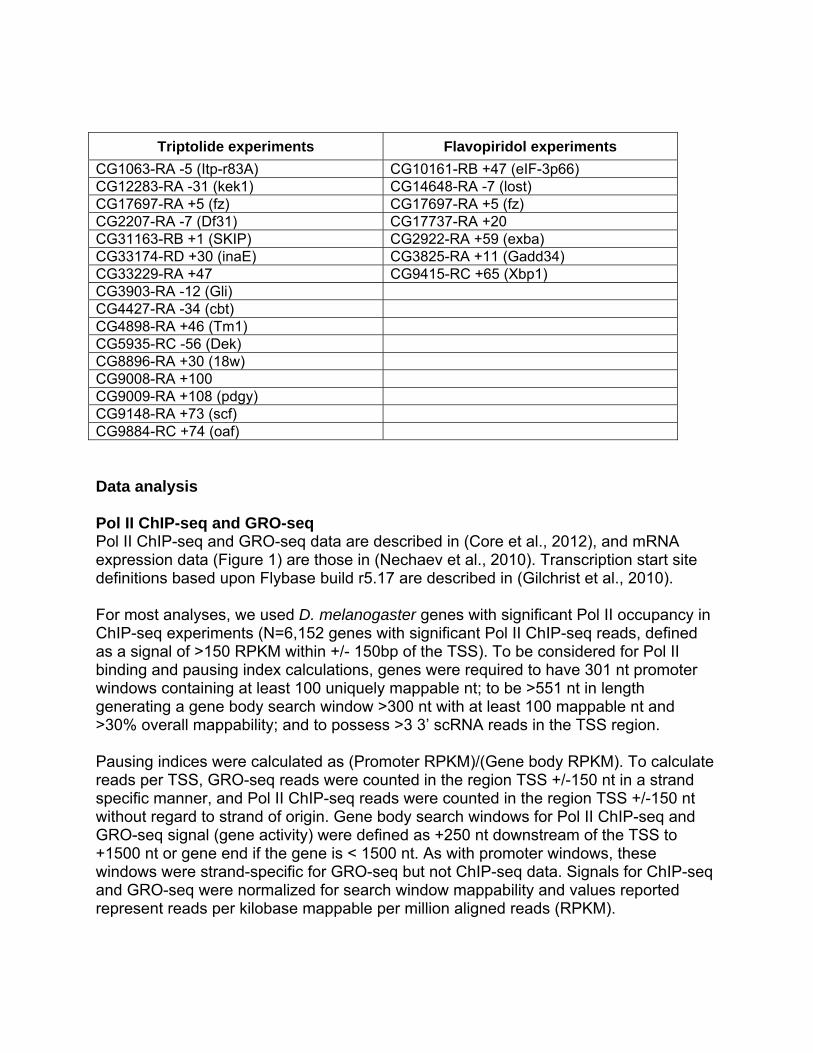
Triptolide experiments Flavopiridol experiments
CG1063-RA -5 (Itp-r83A) CG10161-RB +47 (eIF-3p66) CG12283-RA -31 (kek1) CG14648-RA -7 (lost) CG17697-RA +5 (fz) CG17697-RA +5 (fz) CG2207-RA -7 (Df31) CG17737-RA +20 CG31163-RB +1 (SKIP) CG2922-RA +59 (exba) CG33174-RD +30 (inaE) CG3825-RA +11 (Gadd34) CG33229-RA +47 CG9415-RC +65 (Xbp1) CG3903-RA -12 (Gli) CG4427-RA -34 (cbt) CG4898-RA +46 (Tm1) CG5935-RC -56 (Dek) CG8896-RA +30 (18w) CG9008-RA +100 CG9009-RA +108 (pdgy) CG9148-RA +73 (scf) CG9884-RC +74 (oaf) Data analysis Pol II ChIP-seq and GRO-seq Pol II ChIP-seq and GRO-seq data are described in (Core et al., 2012), and mRNA expression data (Figure 1) are those in (Nechaev et al., 2010). Transcription start site definitions based upon Flybase build r5.17 are described in (Gilchrist et al., 2010). For most analyses, we used D. melanogaster genes with significant Pol II occupancy in ChIP-seq experiments (N=6,152 genes with significant Pol II ChIP-seq reads, defined as a signal of >150 RPKM within +/- 150bp of the TSS). To be considered for Pol II binding and pausing index calculations, genes were required to have 301 nt promoter windows containing at least 100 uniquely mappable nt; to be >551 nt in length generating a gene body search window >300 nt with at least 100 mappable nt and >30% overall mappability; and to possess >3 3’ scRNA reads in the TSS region. Pausing indices were calculated as (Promoter RPKM)/(Gene body RPKM). To calculate reads per TSS, GRO-seq reads were counted in the region TSS +/-150 nt in a strand specific manner, and Pol II ChIP-seq reads were counted in the region TSS +/-150 nt without regard to strand of origin. Gene body search windows for Pol II ChIP-seq and GRO-seq signal (gene activity) were defined as +250 nt downstream of the TSS to +1500 nt or gene end if the gene is < 1500 nt. As with promoter windows, these windows were strand-specific for GRO-seq but not ChIP-seq data. Signals for ChIP-seq and GRO-seq were normalized for search window mappability and values reported represent reads per kilobase mappable per million aligned reads (RPKM).
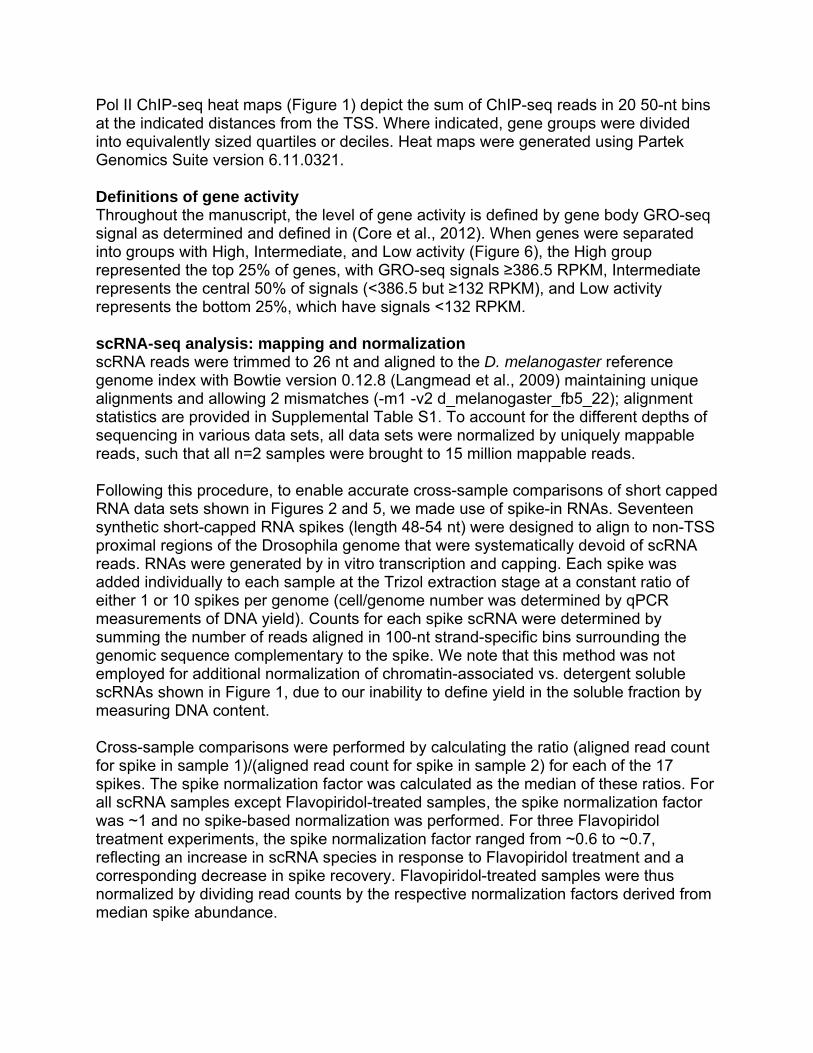
Pol II ChIP-seq heat maps (Figure 1) depict the sum of ChIP-seq reads in 20 50-nt bins at the indicated distances from the TSS. Where indicated, gene groups were divided into equivalently sized quartiles or deciles. Heat maps were generated using Partek Genomics Suite version 6.11.0321. Definitions of gene activity Throughout the manuscript, the level of gene activity is defined by gene body GRO-seq signal as determined and defined in (Core et al., 2012). When genes were separated into groups with High, Intermediate, and Low activity (Figure 6), the High group represented the top 25% of genes, with GRO-seq signals ≥386.5 RPKM, Intermediate represents the central 50% of signals (<386.5 but ≥132 RPKM), and Low activity represents the bottom 25%, which have signals <132 RPKM. scRNA-seq analysis: mapping and normalization scRNA reads were trimmed to 26 nt and aligned to the D. melanogaster reference genome index with Bowtie version 0.12.8 (Langmead et al., 2009) maintaining unique alignments and allowing 2 mismatches (-m1 -v2 d_melanogaster_fb5_22); alignment statistics are provided in Supplemental Table S1. To account for the different depths of sequencing in various data sets, all data sets were normalized by uniquely mappable reads, such that all n=2 samples were brought to 15 million mappable reads. Following this procedure, to enable accurate cross-sample comparisons of short capped RNA data sets shown in Figures 2 and 5, we made use of spike-in RNAs. Seventeen synthetic short-capped RNA spikes (length 48-54 nt) were designed to align to non-TSS proximal regions of the Drosophila genome that were systematically devoid of scRNA reads. RNAs were generated by in vitro transcription and capping. Each spike was added individually to each sample at the Trizol extraction stage at a constant ratio of either 1 or 10 spikes per genome (cell/genome number was determined by qPCR measurements of DNA yield). Counts for each spike scRNA were determined by summing the number of reads aligned in 100-nt strand-specific bins surrounding the genomic sequence complementary to the spike. We note that this method was not employed for additional normalization of chromatin-associated vs. detergent soluble scRNAs shown in Figure 1, due to our inability to define yield in the soluble fraction by measuring DNA content. Cross-sample comparisons were performed by calculating the ratio (aligned read count for spike in sample 1)/(aligned read count for spike in sample 2) for each of the 17 spikes. The spike normalization factor was calculated as the median of these ratios. For all scRNA samples except Flavopiridol-treated samples, the spike normalization factor was ~1 and no spike-based normalization was performed. For three Flavopiridol treatment experiments, the spike normalization factor ranged from ~0.6 to ~0.7, reflecting an increase in scRNA species in response to Flavopiridol treatment and a corresponding decrease in spike recovery. Flavopiridol-treated samples were thus normalized by dividing read counts by the respective normalization factors derived from median spike abundance.

scRNA-seq analysis: derivation of reads from the soluble fraction The number of reads in the soluble scRNA fraction that mapped within gene bodies prompted us to investigate further their localization and distribution. At the most highly expressed 1-3% of genes, these reads trailed well beyond the promoter-proximal pause region and across the gene body, indicative of degradation products. We note that a small amount of contamination of our scRNA samples with uncapped RNAs is inevitable, given that the Terminator enzyme used to degrade uncapped RNAs cannot be 100% efficient. As a result, very abundant transcripts, including rRNA, tRNA and the most highly expressed mRNAs are present in this sample, with reads peppered across exons (but absent from introns) suggesting that these are degradation intermediates of fully mature mRNA species. Two examples of this phenomenon, are shown below:
scRNA-seq analysis: identification of reads with non-templated 3’-end residues To identify scRNAs with non-templated 3’-end residues, reads that initially failed to align with the above Bowtie parameters were evaluated. Enrichment in oligo-adenylated species (Figure S2D) was calculated by determining the percentage of these reads ending in the indicated number of A residues; counts for U residues are shown for comparison (Figure S2E). The increase in oligo-adenylation upon exosome depletion (Figure 2C) was calculated as the difference in contiguous A counts between the mock-treated and Rrp40-depleted samples. To map these reads, all unaligned reads (using standard Bowtie parameters) were trimmed at the 3’ end to remove terminal A nucleotides. Reads trimmed of at least 3 As with at least 18 nt remaining after trimming were aligned to the genome (reads with >26 nt remaining after trimming were further trimmed at the 5’ end to 26mers) and counted as for uniquely-aligned scRNAs. scRNA-seq analysis: quantification of reads per TSS and statistical analysis To calculate reads per TSS, uniquely mapped scRNA reads were counted in the region from the TSS to +100 nt downstream in a strand-specific manner. Agreement between biological replicates (Supplemental Table S1) was calculated as the correlation between reads per TSS values in 17,116 TSS regions; correlation coefficients (Spearman’s rho) were in the range 0.94 – 0.97. Heat maps (e.g. Figure 1A) depict normalized 3’ scRNA reads at single-nucleotide resolution at the indicated distances with respect to the TSS. Composite metagene
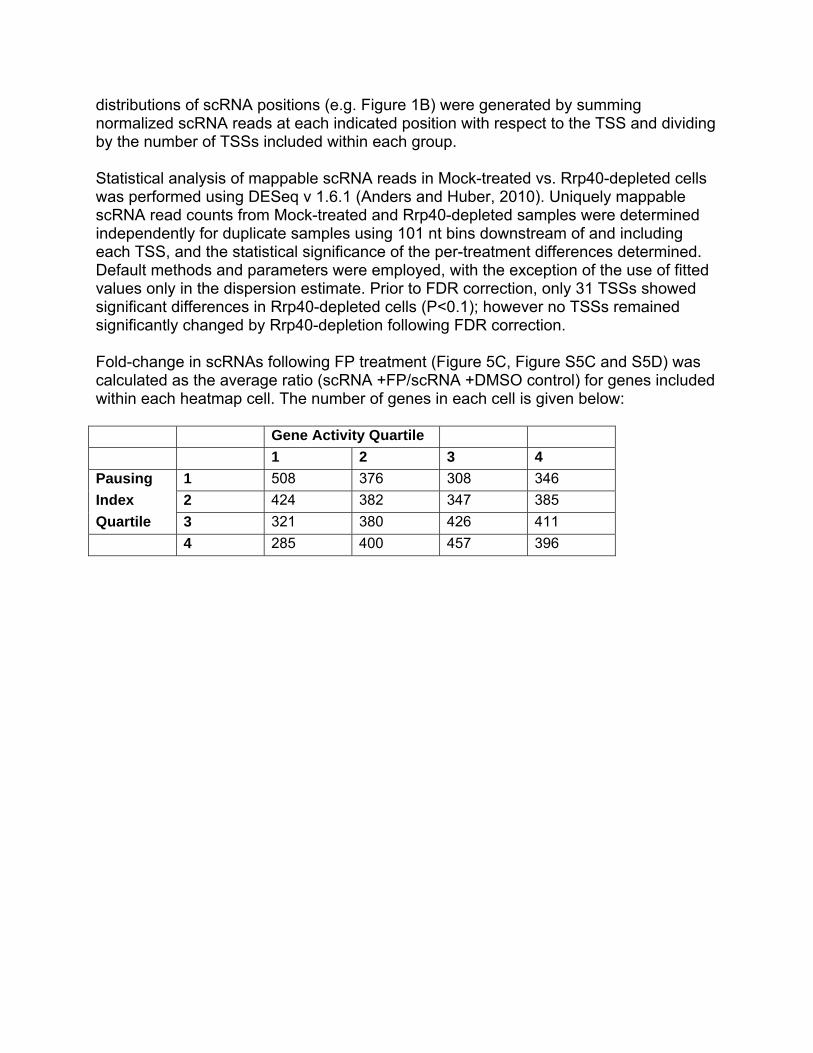
distributions of scRNA positions (e.g. Figure 1B) were generated by summing normalized scRNA reads at each indicated position with respect to the TSS and dividing by the number of TSSs included within each group. Statistical analysis of mappable scRNA reads in Mock-treated vs. Rrp40-depleted cells was performed using DESeq v 1.6.1 (Anders and Huber, 2010). Uniquely mappable scRNA read counts from Mock-treated and Rrp40-depleted samples were determined independently for duplicate samples using 101 nt bins downstream of and including each TSS, and the statistical significance of the per-treatment differences determined. Default methods and parameters were employed, with the exception of the use of fitted values only in the dispersion estimate. Prior to FDR correction, only 31 TSSs showed significant differences in Rrp40-depleted cells (P<0.1); however no TSSs remained significantly changed by Rrp40-depletion following FDR correction. Fold-change in scRNAs following FP treatment (Figure 5C, Figure S5C and S5D) was calculated as the average ratio (scRNA +FP/scRNA +DMSO control) for genes included within each heatmap cell. The number of genes in each cell is given below: Gene Activity Quartile
1 2 3 4
Pausing 1 508 376 308 346
Index 2 424 382 347 385
Quartile 3 321 380 426 411
4 285 400 457 396

SUPPLEMENTAL REFERENCES Anders, S., and Huber, W. (2010). Differential expression analysis for sequence count data. Genome Biol 11, R106. Conrad, T., Cavalli, F.M., Vaquerizas, J.M., Luscombe, N.M., and Akhtar, A. (2012). Drosophila dosage compensation involves enhanced Pol II recruitment to male X-linked promoters. Science 337, 742-746. Langmead, B., Trapnell, C., Pop, M., and Salzberg, S.L. (2009). Ultrafast and memory-efficient alignment of short DNA sequences to the human genome. Genome Biol 10, R25. Pall, G.S., and Hamilton, A.J. (2008). Improved northern blot method for enhanced detection of small RNA. Nature protocols 3, 1077-1084. Zhang, Y., Malone, J.H., Powell, S.K., Periwal, V., Spana, E., Macalpine, D.M., and Oliver, B. (2010). Expression in aneuploid Drosophila S2 cells. PLoS biology 8, e1000320.