Embed Size (px)
Citation preview

Immunity, Volume 41
Supplemental Information
Bacterial Sensor Nod2 Prevents Inflammation
of the Small Intestine by Restricting the Expansion
of the Commensal Bacteroides vulgatus
Deepshika Ramanan, Mei San Tang, Rowann Bowcutt, P’ng Loke, and Ken Cadwell

Inventory of Supplemental Information
Table S1 (related to Figure 1)
Microarray analysis of laser captured crypt base epithelial cells from WT and Nod2-/- mice
Figure S1 (related to Figure 1)
Nod2-/- mice display inflammatory gene expression in the epithelium rather than Paneth cell
granule abnormalities.
Figure S2 (related to Figure 2)
Nod2-deficiency leads to goblet cell abnormalities
Figure S3 (related to Figure 3)
Association between IFN-γ producing lymphocytes and epithelial abnormalities in Nod2-/- mice.
Figure S4 (related to Figure 4)
Intestinal abnormalities are specific to Nod2-deficiency
Figure S5 (related to Figure 5)
Nod2-deficiency in the hematopoietic compartment is responsible for intestinal abnormalities
induced by B. vulgatus.
Figure S6 (related to Figure 6)
Nod2-/- mice are susceptible to B. vulgatus but not B. thetaiotaomicron.
Figure S7 (related to Figure 7)
Nod2-/- mice display exacerbated inflammatory pathologies and dysbiosis following piroxicam
treatment
Supplemental Experimental Procedures
Supplemental References

Table S1, related to Figure 1. Microarray analysis of laser captured crypt base epithelial
cells from WT and Nod2-/- mice.
First tab shows complete gene list where fold change refers to Nod2-/- compared to WT. Second
tab shows list of genes assigned to the pathways from Figure 1 that were found to be enriched
in Nod2-/- samples according to DAVID analysis. Third tab shows list of genes that were
assigned to the pathways from Fig. S2 according to GSEA analysis.

FIGURE S1
A B
WT Nod2-/- Atg16L1HM0
50
100
% P
anet
h ce
llsWT
Atg
16L1
HM
Nod
2-/-
C
Normal Excluded Abnormal
Gene name Gene Symbol Fold increase in Nod2 -/- mice
Small proline-rich protein 2A1 2A2 2A3 Sprr2a1/Sprr2a2/Sprr2a3 20.72
Resistin like beta Retnlb (Relmb) 13.27
Phospholipase A2 Pla2 11.82
Gasdermin C2/C4 Gsdmc4/Gsdmc2 6.9
Defensin beta 1 Defb1 5.98
Chloride channel calcium activated 3 Clca3 4.09
Regenerating islet-derived 3 beta Reg3b 3.68
HF
WT Nod2-/-
G
D
E
J
WT Nod2 -/- Atg16L1HM WT Nod2 -/- Atg16L1HM
Morphology - - - - - +Lysozyme - +/- - - +/- +
Paneth cell-MNV +MNV
WT Nod2-/-0
20
40
60
80
100
% C
rypt
s -++++
WT Nod2-/-0
10
20
30
Reg
3 (M
FI)
cryp
ts
***
KI Colon
WT Nod2-/-0
20
40
60
80
100
Reg
3 (M
FI)
Colon
WT Nod2-/- WT Nod2-/-0
10
20
30
Rel
m-
+ cel
ls
- antibiotics + antibiotics
***ns

Figure S1, related to Figure 1. Nod2-/- mice display inflammatory gene expression in the
epithelium rather than Paneth cell granule abnormalities.
(A-D) Mice with hypomorphic expression of Atg16L1 (Atg16L1HM mice) were previously shown
to develop structural abnormalities in Paneth cells that were dependent on MNV infection
(Cadwell et al., 2010). WT, Nod2-/- and Atg16L1HM mice were either left untreated or infected
with 3x10⁶ plaque forming units (pfu) of MNV CR6, and small intestinal sections were analyzed
by light microscopy (PAS/alcian blue) and lysozyme immuno-fluorescence (IF) to compare
Paneth cells as previously described (Cadwell et al., 2010). Representative images and
quantification of MNV-infected samples are shown in (A) and (C), and the results are
summarized in (D). (A) Only MNV-infected Atg16L1HM mice develop Paneth cells with aberrant
granule morphology by light microscopy. The amount of lysozyme+ structures was decreased
overall in these samples, and those that were present were abnormally large or dysmorphic as
previously described. Although the distribution of lysozyme was not as abnormal, some Paneth
cells from Nod2-/- contained circular regions in which lysozyme was excluded (yellow arrows),
similar to Crohn’s disease patients with Nod2 mutations (Vandussen et al., 2013). This
“excluded” staining pattern was not dependent on MNV. Dotted lines denote crypt unit. (B)
Illustrations depict the different types of lysozyme distribution that were observed. (C)
Quantification of lysozyme distribution from (A). At least 100 Paneth cells from 3 mice were
quantified per group. (D) Table summarizing results from (A) and (C).
(E) GSEA analysis of the microarray data from Figure 1 comparing gene expression in the small
intestinal crypt-base epithelium of Nod2-/- and WT mice. Plots shown are examples of pathways
associated with Nod2-deficiency (inflammatory response, defense response and fatty acid
metabolic process pathways) and independently confirm the DAVID analysis. List of individual
genes from the pathways shown are listed in Table S1.
(F) Genes displaying the highest increase in expression in Nod2-/- samples from the microarray.
(G-I) Additional IF analysis of Reg3β demonstrating that, compared to WT mice (G) almost all

small intestinal crypts in Nod2-/- mice displayed moderate (+) or high (+++) staining, (H) had an
overall higher mean fluorescence intensity (MFI) in the small intestinal crypts and (I) no
differences in MFI in the colon.
(J) Representative IF images of Relm-β+ expression in WT and Nod2-/- small intestine sections.
(K) Quantification of Relm-β+ cells per 40X field in WT and Nod2-/- colon before and after
treatment with antibiotics, confirming that the increase in Relm-β+ and Reg3β expression is
limited to the small intestine, and overall expression of Relm-β is reduced in both WT and Nod2-
/- colon treated with antibiotics, consistent with previous studies (Hill et al., 2010).
n ≥ 3 mice per genotype, *p<0.05, **p<0.01 and ***p<0.001 by unpaired two-tailed t test in (H)
and Holm- Sidak multiple comparisons test in (K). Scale bar = 10µm in (A) and 100µm in (J).
Data are represented as mean ± SEM in (H), (I) and (K).
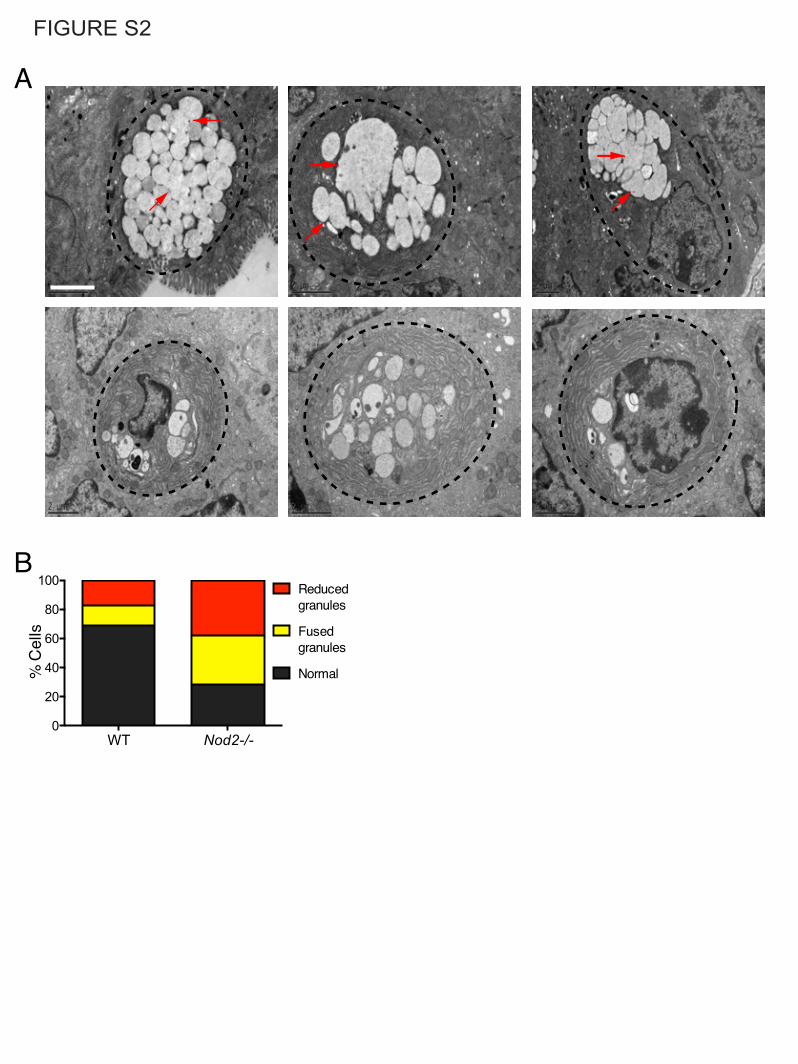
FIGURE S2
A
B
WT Nod2-/-0
20
40
60
80
100
% C
ells
Normal
Fused granules
Reduced granules

Figure S2, related to Figure 2. Nod2-deficiency leads to goblet cell abnormalities.
(A) Representative images of goblet cells from Nod2-/- mice that display reduced number of
granules or those with a fused appearance (red arrows). Scale bar = 2µm.
(B) Analysis of mucin granule morphology in WT and Nod2-/- goblet cells. Graph represents
proportion of goblet cells in each genotype displaying granules with normal, reduced, or fused
appearance. n = 3 mice per genotype.

Figure S3
A CD8+ T cells
WT KO WT KO WT KO WT KO WT KO0
10
20
30
40
50
IFN
-+
cells
S.I.IEL
**
S.I.LP
Colon P.P. MLN
CD4+ T cells
WT KO WT KO WT KO WT KO WT KO0
20
40
60
IFN
-+
cells
S.I.IEL
ns
S.I.LP
Colon P.P. MLN
C
Rag-/- Nod2-/-Rag-/-0
20
40
60
80
Reg
3 (M
FI) *
B

Figure S3, related to Figure 3. Association between IFN-γ producing lymphocytes and
epithelial abnormalities in Nod2-/- mice.
(A-B) In contrast to the increase in IFN-γ+ intraepithelial lymphocytes (IELs) observed in Nod2-/-
mice, flow cytometry analysis indicates that WT and Nod2-/- mice have a similar proportion of
IFN-γ+ CD8+ T cells (A) and CD4+ T cells (B) in the small intestinal lamina propria (LP), colon,
Peyer’s patches (P.P.), and mesenteric lymph nodes (MLN).
(C) IF analysis of Reg3β indicates a similar amount of staining in the small intestine of Rag-/-
and Nod2-/-Rag-/- mice.
n ≥ 3 mice per genotype. ns = not significant, *p<0.05 and **p<0.01 by unpaired two-tailed t test
in (A), (B), and (C). Data are represented as mean ± SEM in (A), (B), and (C).

Figure S4
A
E
WT Atg16L1HM Nod2-/-102
103
104
105
106
B.vu
lgat
us c
fu
N.D. N.D.
WT Atg16L1HM Nod2-/-0
20
40
60
80
100
Reg
3 (M
FI) **
*** B
WT Atg16L1HM Nod2-/-0
10
20
30
Rel
m+ c
ells
******** C
WT Atg16L1HM0
10
20
30
Muc
2 ex
pres
sion
D
WT Atg16L1HM0
20
40
60
Muc
2 (M
FI)
F
G H I
J
WT Nod2+/- Nod2-/-0
5
10
15
20
25
IFN
-+ c
ells
**
*
WT Nod2+/- Nod2-/-102
103
104
105
106
107
B.vu
lgat
us c
fu *
N.D.
WT Nod2+/- Nod2-/-0
20
40
60
80
100
Reg
3 (M
FI)
**
********
WT Nod2+/- Nod2-/-0
10
20
30
Rel
m+ c
ells
****
*****
L
WT Atg16L1HM0
10
20
30G
oble
t cel
ls / v
illi
13.8 14.0
WT Nod2+/- Nod2-/-0
10
20
30
Gob
let c
ells
/ villi
*******
WT Nod2+/- Nod2-/-0
20
40
60
80
100
% A
bnor
mal
*****
*
K
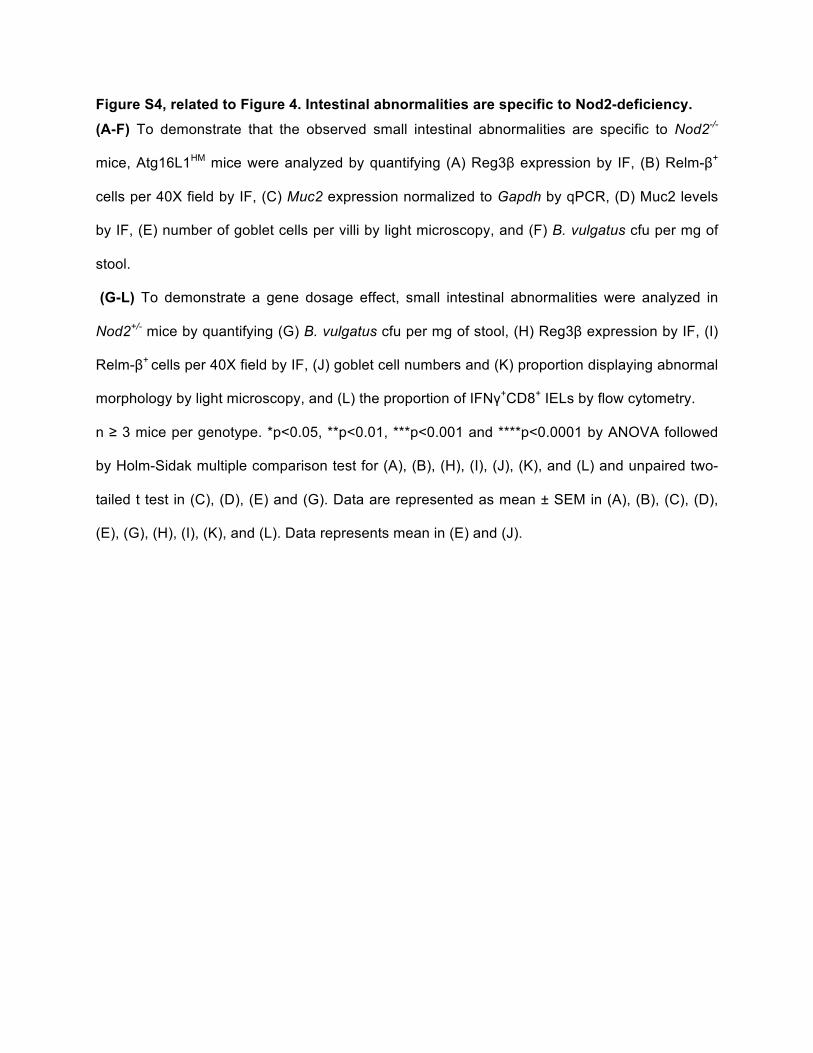
Figure S4, related to Figure 4. Intestinal abnormalities are specific to Nod2-deficiency. (A-F) To demonstrate that the observed small intestinal abnormalities are specific to Nod2-/-
mice, Atg16L1HM mice were analyzed by quantifying (A) Reg3β expression by IF, (B) Relm-β+
cells per 40X field by IF, (C) Muc2 expression normalized to Gapdh by qPCR, (D) Muc2 levels
by IF, (E) number of goblet cells per villi by light microscopy, and (F) B. vulgatus cfu per mg of
stool.
(G-L) To demonstrate a gene dosage effect, small intestinal abnormalities were analyzed in
Nod2+/- mice by quantifying (G) B. vulgatus cfu per mg of stool, (H) Reg3β expression by IF, (I)
Relm-β+ cells per 40X field by IF, (J) goblet cell numbers and (K) proportion displaying abnormal
morphology by light microscopy, and (L) the proportion of IFNγ+CD8+ IELs by flow cytometry.
n ≥ 3 mice per genotype. *p<0.05, **p<0.01, ***p<0.001 and ****p<0.0001 by ANOVA followed
by Holm-Sidak multiple comparison test for (A), (B), (H), (I), (J), (K), and (L) and unpaired two-
tailed t test in (C), (D), (E) and (G). Data are represented as mean ± SEM in (A), (B), (C), (D),
(E), (G), (H), (I), (K), and (L). Data represents mean in (E) and (J).

Figure S5 DAPI Universal 16S B.vulgatus 16S Merge
*
*
A
WT->WT WT->KO KO->WT KO->KO0
10
20
30
Gob
let c
ells
/ villi
***
*****
****
WT->WT WT->KO KO->WT KO->KO0
20
40
60
80
% A
bnor
mal
**
**
**
*
D E F
WT
Nod2-/-
GWT-->WT WT-->KO KO-->WT
0
20
40
60
IFN
-+ c
ells
**
CD8+ T cells
**
S.I. LP
WT-->WT WT-->KO KO-->WT KO-->KO0
20
40
60
80
100
% re
cons
titut
ion
Spleen
WT-->WT WT-->KO KO-->WT KO-->KO0
50
100
% re
cons
titut
ion
BWT Nod2-/-
Bacteroides vulgatus 0 12Bacteroides acidophilus 3 0Bacteroides eggerthii 2 0Parabacteroides goldstenii 3 0No Bacteroides growth 4 0
C

Figure S5, related to Figure 5. Nod2-deficiency in the hematopoietic compartment is
responsible for intestinal abnormalities induced by B. vulgatus.
(A) Small intestine and colon were analyzed by fluorescent in situ hybridization (FISH) using
probes complimentary to either universal (green) or B. vulgatus-specific (red) 16S rRNA. DAPI
is shown in blue. B. vulgatus was only detected in the small intestine and colon of Nod2-/- mice,
and was restricted to the lumen. Representative images of the colon from 3 mice per genotype
are shown. Yellow asterisks refers to non-specific binding of the B.vulgatus 16S probe to
intestinal tissue (Scale bar = 20µm).
(B) Supervised analysis with LEfSe (logarithmic LDA threshold score of 4.8) found
the Bacteroides genus to be differentially enriched in Nod2-/- mice, while the family S24-7 were
differentially enriched in WT mice.
(C) Stool from 12 WT and 12 Nod2-/- mice were plated on BBE agar and the colony forming
species were identified by sequencing of the 16S rRNA gene. Upon co-housing WT and Nod2-/-
mice, we were able to transfer B. vulgatus to WT mice (Figure 5F), but were unable to transfer
other Bacteroides species from WT mice to Nod2-/- mice.
(D-G) Small intestinal abnormalities in bone marrow chimeras from Figure 5F (donor -->
recipient) were analyzed by quantifying (D) goblet cell numbers, (E) proportion of goblet cells
displaying abnormal morphology, (F) the number of IFNγ+CD8+ IELs by flow cytometry. An
insufficient number of viable IELs were harvested from the KOàKO condition to allow flow
cytometric analysis. (G) Chimerism determined by flow cytometry analysis of congenic markers
CD45.1 (WT, Jackson Laboratories) and CD45.2 (Nod2-/-) in small intestinal L.P. and spleen.
Reg3β levels could not be assessed in chimeric mice because the procedure of generating the
mice induced high levels, most likely due to the damage caused by irradiation. n ≥ 9 mice per
group. *p<0.05, **p<0.01, ***p<0.001 and ****p<0.0001 by ANOVA followed by Holm-Sidak
multiple comparison test for (D), (E), and (F). Data are represented as mean ± SEM in (D), (E),
(F) and (G).

Figure S6
A B
C
G
WT Nod2-/-WT Nod2-/-WT Nod2-/-104
105
106
107
B.th
eta
cfu
Day 3 Day 7 Day 12
F H I
J K L M
D E
Stool
WT Nod2-/-102
103
104
105
106
107
B.vu
lgat
us c
fu
Small Intestine
WT Nod2-/-101
102
103
104
B.vu
lgat
us c
fu **
Vancomycin
WT Nod2-/- WT Nod2-/-102
103
104
105
106
107
B.vu
lgat
us c
fu
Day 0 Day 10
N.D N.D
Day 3
WT Nod2-/- 0
10
20
30
Gob
let c
ells
/ villi
+B.thetaiotamicron
Day 3
WT Nod2-/- 0
20
40
60
80
100
% A
bnor
mal
+B.thetaiotamicron
Day 3
WT Nod2-/-0
5
10
15
IFN
-+ c
ells
+ B.thetaiotamicron
Day 3
WT Nod2-/-0
20
40
60
80
100
Reg
3 (M
FI)
+ B.thetaiotaomicron
Day 12
WT Nod2-/- WT Nod2-/- 0
10
20
30
Gob
let c
ells
/ villi
*
+B.thetaiotamicron+ B.vulgatus
Day 12
WT Nod2-/- 0
20
40
60
80
100
% A
bnor
mal
+B.thetaiotamicron
Day 12
WT Nod2-/-0
5
10
15
IFN
-+ c
ells
+ B.thetaiotamicron
WT KO WT KO WT KO WT KO101
102
103
104
105
106
107
B.un
iform
is c
fu
Day 3 Day 5 Day 7
N.D.
Day 10

Figure S6, related to Figure 6. Nod2-/- mice are susceptible to B. vulgatus but not B.
thetaiotamicron.
(A) Supervised analysis with LEfSe showing Bacteroides genus to be differentially enriched in
Nod2-/- mice on Day 0 of metronidazole treatment, while Lactobacillus and Bifidobacteria were
differentially enriched in Nod2-/- mice on Day 10 after metronidazole treatment.
(B) To demonstrate successful reconstitution, B. vulgatus levels were quantified in stool on day
12 post-inoculation from mice that were first depleted of the bacteria by metronidazole-treatment
and then gavaged with 108 cfu.
(C) In contrast to the similar amount of B. vulgatus in the stool of WT and Nod2-/- mice following
reconstitution, there were significantly higher amounts recovered from the of Nod2-/- small
intestinal mucosa. To quantify tissue-associated bacteria in (C), 2 cm of the small intestine
(ileum) was flushed with PBS, homogenized, and serial dilutions were plated on Bacteroides
Bile Esculin agar under anaerobic conditions.
(D) Quantification of B. vulgatus in stool of WT and Nod2-/- mice on day 0 and 10 after
vancomycin treatment demonstrating lack of depletion.
(E) Quantification of goblet cell numbers in WT and Nod2-/- mice, 12 days post gavage with B.
vulgatus or B. thetaiotaomicron following metronidazole treatment.
(F) Quantification of the proportion of goblet cells displaying abnormal morphology in WT and
Nod2-/- mice, 12 days post gavage with B. thetaiotaomicron following metronidazole treatment.
(G) Flow cytometry analysis of the number of IFN-γ+ IELs in WT and Nod2-/- mice, 12 days post
gavage with B. thetaiotaomicron following metronidazole treatment.
(H) WT and Nod2-/- mice were treated with metronidazole and then gavaged with 108 cfu of B.
thetaiotaomicron. Quantification of B. thetaiotaomicron in stool on indicated days indicate that
colonization is sustained.
(I-L) Quantification of Reg3β expression by IF (I), goblet cell numbers (J) and proportion
displaying abnormal morphology (K), and IFN-γ+ IELs in WT and Nod2-/- mice (L), 3 days post

gavage with B. thetaiotaomicron following metronidazole treatment.
(M) WT and Nod2-/- mice were treated with metronidazole and then gavaged with 108 cfu of B.
uniformis. Quantification of B.uniformis cfu in stool indicates that stable colonization is sustained
10 days post gavage in WT mice but not Nod2-/- mice.
n ≥ 3 mice per genotype. *p<0.05 by ANOVA followed by Holm-Sidak multiple comparison test
for (E) and unpaired two-tailed T test for (B), (D), (F), (G), (I), (J), (K) and (L). Data are
represented as mean ± SEM in (B), (C), (D), (F), (G), (H), (I), (K), (L), and (M). Bar represents
mean in (E) and (J).

FIGURE S7
A
*
B
C
D
IEL
A. Presence of Nod2 in small intestine B. Absence of Nod2 in small intestine
B.vulgatus
IFN-γGoblet cell
Mucus
Nod2/Rip2Signaling
MyD88
Nod2 - deficientLeukocytes
WT Nod2-/- WT Nod2-/- WT Nod2-/-
0/5 3/4 0/5 0/5 0/5 3/50% 75% 0% 0% 0% 60%0/5 3/4 0/5 0/5 0/5 3/50% 75% 0% 0% 0% 60%
+Metronidazole+B.vulgatus
Intestinal bleeding
Attachment to cavity
Piroxicam only +Metronidazole
B.vulgatus

Figure S7, related to Figure 7. Nod2-/- mice display exacerbated inflammatory pathologies
and dysbiosis following piroxicam treatment.
(A) Representative image of intestinal bleeding (asterisk) and attachment of the ileal-cecal
junction to the surrounding tissue of the peritoneal cavity (arrow) that was observed only in
Nod2-/- mice harboring B. vulgatus.
(B) Table representing quantification of small intestinal bleeding and attachment of the intestine
to the peritoneal cavity in piroxicam-treated WT and Nod2-/- mice receiving no other treatment
(piroxicam only), metronidazole, or metronidazole followed by gavage with 108 B.vulgatus.
(C) Supervised analysis with LEfSe showing that the intestinal microbiota profile of Nod2-/- mice
on day 0 of piroxicam treatment was dominated by the phylum Bacteroidetes, while the
intestinal microbiota profile of Nod2-/- mice at day 14 of piroxicam treatment was dominated by
the phylum Proteobacteria.
(D) The presence of Nod2 in myeloid or dendritic cell types provides Rip2-mediated gene
expression that favors microbial resistance and immune homeostasis in the small intestine. In
the absence of Nod2, there is decreased microbial resistance to the pro-inflammatory
commensal B. vulgatus, which promotes a Myd88-dependent inflammatory reaction. This
adverse response to B. vulgatus includes excess IFN-γ production by intraepithelial
lymphocytes that causes defects in mucus production by goblet cells, and allows sustained
colonization by B. vulgatus and susceptibility to disease.

Supplemental Experimental Procedures
qRT-PCR. For quantifying gene expression, total RNA was isolated from small intestinal tissue
using Trizol and chloroform and the Protoscript cDNA synthesis kit (NEB) was used to
synthesize and amplify cDNA. Relative expression of muc2 (Fwd 5’-
ATGCCCACCTCCTCAAAGAC-3’, Rev 5’-GTAGTTTCCGTTGGAACAGTGAA-3’) and α-
defensin1 (Fwd 5’-AAGAGACTAAAACTGAGGAGCAGC-3’, Rev 5’-
GGTGATCATCAGACCCCAGCATCAGT-3’) were normalized to GAPDH (Fwd 5’-
TGCCCCCATGTTTGTGATG-3’, Rev 5’-TGTGGTCATGAGCCCTTCC-3’). For quantifying
bacteria, DNA was isolated from tissue or stool samples using phenol chloroform. Bacteroides
16S (Fwd 5’-GAGAGGAAGGTCCCCCAC-3’, Rev 5’-CGCTACTTGGCTGGTTCAG-3’) was
normalized to total 16S using universal primers (Fwd 5’- ACTCCTACGGGAGGCAGCAGT-3’,
Rev 5’-ATTACCGCGGCTGCTGGC-3’). qRT-PCR was done using SyBr Green master mix
(Roche) and Light Cycler 480 (Roche).
Transmission electron microscopy (TEM). Small intestinal sections from WT and Nod2-/-
mice were fixed in 2.5% glutaraldehyde, and 2% paraformaldehyde in 0.1M sodium cacodylate
buffer (pH 7.2) for 2 hours and post-fixed with 1% osmium tetroxide for 1.5 hours at room
temperature, then processed in a standard manner and embedded in EMbed 812 (Electron
Microscopy Sciences, Hatfield, PA). Semi-thin sections were cut at 500nm and stained with 1%
toluidine blue to evaluate the quality of preservation. Ultrathin sections (60 nm) were cut,
mounted on copper grids and stained with uranyl acetate and lead citrate by standard methods.
Stained grids were examined under Philips CM-12 electron microscope (FEI; Eindhoven, The
Netherlands) and photographed with a Gatan (4k x2.7k) digital camera (Gatan, Inc., Pleasanton,
CA).
Fluorescent in situ hybridization (FISH). Small intestine and colonic sections were prepared
by fixing whole tissue including the lumen in methacarn at 4oC followed by paraffin embedding.
5µm thick sections were hybridized to a universal bacterial probe EUB 338 (FITC -
GCTGCCTCCCGTAGGAGT) and a probe specific for B.vulgatus 16S rRNA (Alexa 594 -
AGATGCCTTGCGGCTTACGGC) in 10% formamide, 2X sodium saline citrate and 10% SDS at
37oC overnight. Non-specific probes were designed and used as controls for both probes.
Sections were imaged using the Applied Precision personal DV system.

Flow cytometry. To obtain lymphocytes from Peyer’s patches and MLNs, the tissue was
collected and homogenized using a 40µm filter and washed with RPMI. Lymphocytes were
stimulated for 4 hours with a cell stimulation cocktail of PMA, ionomycin, brefeldin A and
monensin from eBioscience. Stimulated cells were stained with anti-CD3ε PerCP, anti-TCRβ
PE-Cy5, anti-CD8α PE-Cy7, anti CD4 APC-Cy7, anti-IFNγ APC and their respective isotype
controls from Biolegend, and, anti-IL-17 PE, anti-TCRδ FITC and their respective isotype
controls from BD. Fixation and permeabilization buffers from Biolegend were used for
intracellular cytokine staining, and a fixable live/dead stain from BD was used to exclude dead
cells. Flow cytometric analysis was performed on an LSR II (BD biosciences) and analyzed
using FlowJo software from TreeStar.
16S rRNA sequencing, QIIME, and LEfSe analyses. DNA isolation from stool samples was
done using the NucleospinSoil Kit (Macherey-Nagel). Bacterial 16S rRNA gene was amplified at
the V4 region using a modified protocol from Kuczyniski et al (Kuczynski et al., 2011) and
paired-end amplicon sequencing was performed on the Illumina MiSeq system. Sequencing
reads were processed using the Quantitative Insights Into Microbial Ecology (QIIME) software
package. Operational taxonomic units (OTUs) were identified using a combination of closed-
reference and de novo clustering methods. Beta diversity was calculated using unweighted
UniFrac distance (Chen et al., 2012; Lozupone et al., 2011) on an uneven OTU table. Principle
Coordinate Analysis (PCoA) was performed on the unweighted UniFrac distance matrix and
visualized with the KiNG graphics program. Alpha diversity was calculated using the metrics
Shannon index [ref] and observed species. The LDA Effect Size (LEfSe) algorithm
(http://huttenhower.sph.harvard.edu/galaxy/) was used to identify taxa that were differentially
abundant in different biological groups (Segata and Huttenhower, 2011).

Supplemental References Cadwell, K., Patel, K.K., Maloney, N.S., Liu, T.C., Ng, A.C., Storer, C.E., Head, R.D., Xavier, R., Stappenbeck, T.S., and Virgin, H.W. (2010). Virus-plus-susceptibility gene interaction determines Crohn's disease gene Atg16L1 phenotypes in intestine. Cell 141, 1135-1145. Chen, J., Bittinger, K., Charlson, E.S., Hoffmann, C., Lewis, J., Wu, G.D., Collman, R.G., Bushman, F.D., and Li, H. (2012). Associating microbiome composition with environmental covariates using generalized UniFrac distances. Bioinformatics 28, 2106-2113. Hill, D.A., Hoffmann, C., Abt, M.C., Du, Y., Kobuley, D., Kirn, T.J., Bushman, F.D., and Artis, D. (2010). Metagenomic analyses reveal antibiotic-induced temporal and spatial changes in intestinal microbiota with associated alterations in immune cell homeostasis. Mucosal immunology 3, 148-158. Kuczynski, J., Stombaugh, J., Walters, W.A., Gonzalez, A., Caporaso, J.G., and Knight, R. (2011). Using QIIME to analyze 16S rRNA gene sequences from microbial communities. Current protocols in bioinformatics / editoral board, Andreas D Baxevanis [et al] Chapter 10, Unit 10 17. Lozupone, C., Lladser, M.E., Knights, D., Stombaugh, J., and Knight, R. (2011). UniFrac: an effective distance metric for microbial community comparison. The ISME journal 5, 169-172. Segata, N., and Huttenhower, C. (2011). Toward an efficient method of identifying core genes for evolutionary and functional microbial phylogenies. PLoS One 6, e24704. Vandussen, K.L., Liu, T.C., Li, D., Towfic, F., Modiano, N., Winter, R., Haritunians, T., Taylor, K.D., Dhall, D., Targan, S.R., et al. (2013). Genetic Variants Synthesize to Produce Paneth Cell Phenotypes That Define Subtypes of Crohn's Disease. Gastroenterology.