Embed Size (px)
Citation preview

DMD #63495
TITLE: Metabolite profiling and pharmacokinetic evaluation of hydrocortisone in a perfused
3D human liver bioreactor
Ujjal Sarkar, Dinelia Rivera-Burgos, Emma M. Large, David J. Hughes, Kodihalli C. Ravindra,
Rachel L. Dyer, Mohammed Ebrahimkhani, John S. Wishnok, Linda G. Griffith, and Steven R.
Tannenbaum.
Submitted to Drug Metabolism and Depostition: DMD Manuscript #63495

DMD #63495
SUPPLEMENTAL METHOD
An RP-UHPLC-QTOF-MS/MS method was developed which enabled simultaneous
determination of total and free hydrocortisone having a good separation and resolution of
the chromatographic peaks. Reliability, extraction simplicity, good recovery of this RP-
UHPLC-MS/MS method gives it an advantage over to the other reported methods for
measuring hydrocortisone and its metabolites from hepatocytes culture media.
Method development and validation
The applicability and scope of the analytical method, e.g., the reagents, solvents,
sample, standards, concentration range, equipment to be used, chromatographic conditions
and calculations, were defined before validation. These included linearity, accuracy,
precision, selectivity, limit of detection (LOD), limit of quantification (LOQ) and
robustness.
Linearity: The linearity of the method was assessed by a series of three injections of
six different concentrations of hydrocortisone (5, 10, 50, 75, 100 and 200 nM). Peak areas of
the calibration LC-MS standards were plotted against their nominal concentrations (nM),
yielding a linear relationship with a correlation coefficient (r2) ≥ 0.999 (Supplemental Fig.
15).
Accuracy: The accuracy was evaluated by analyzing hydrocortisone at three
different concentrations. Three replicates were made for each concentration (10, 75 and 100
nM). For this, a 50 µL aliquot of each LC-MS standard was spiked with 2 µL of the 1.25
µM d4-HC internal standard solution and the peak areas corresponding to HC and d4-HC

DMD #63495
Page |
3
were obtained using Agilent QTOF 6530 mass spectrometer and Mass Hunter software. The
percent of error obtained with this method was less than 5 % (Supplemental Table 4).
Precision: The intra-assay precision was measured by one operator using
exclusively the Agilent QTOF over the course of one day. The experimental conditions were
maintained as constant as possible and precision was expressed as the percent relative
standard deviation of six replicates. The relative standard deviation for peak areas was 3.86,
corresponding to less than 5 % variation (Supplemental Fig. 16). Also, the variation of
retention times for overlapping chromatograms corresponding to these six samples was less
than 2 %.
Selectivity: The selectivity was determined by comparing results from analyses of
hydrocortisone samples containing impurities and degradation products with those obtained
from analyses of a pure sample. A variation of less than 2 % was obtained after comparing
peak heights and retention times for six replicates.
Limit of detection and limit of quantitation: The LOD of an analytical procedure is
the lowest concentration of an analyte that can be detected but not necessarily quantitated;
the LOQ is the lowest amount of the analyte that can be measured with suitable precision
and accuracy {Armbruster, 2008 #57}. These values were determined by comparing
measured signals from samples with known low concentrations of hydrocortisone with those
of blank samples, and assessing the minimum concentration at which hydrocortisone could
be reliably detected and measured. A S/N ratio of 3:1 was considered acceptable for
estimating LOD; for LOQ a S/N ratio of 10:1 was considered appropriate. The LOD for HC
was 1.4 nmol/L (1.4 femtomoles on-column for a 1 µL injection); the LOQ was 4.5 nmol/L
(4.5 femtomoles on-column for a 1 µL injection).

DMD #63495
Page |
4
Robustness: Robustness is the resistance of a method to modest changes in
conditions {Garcia-Campana, 2000 #58}. For our assessment, we varied a number of
chromatographic parameters including flow rate, column temperature, injection volume, and
mobile phase. The overall influence of these variables on the peak areas and retention times
was less than 10 %.
Also, as part of the validation process, the chromatographic reproducibility was
assessed. Supplemental Fig. 17 shows that the method is highly reproducible based on
retention time (min) and peak height.
Carryover is one of the biggest limitations of an analytical procedure and can have
consequential effects in many areas where separation science is used. The issue is that
unless the entire sample is removed from the analytical system the subsequent analysis will
have residual compound from the previous injection, which could potentially lead to
inaccurate data being produced. Supplemental Fig. 18 shows representatives chromatograms
showing that the HC peak is absent in the blank runs, proving that there is no residual.

DMD #63495
Page |
5
LEGENDS FOR FIGURES
Supplemental Figure 1: Quality control. A) CYP3A, B) total protein levels, C) albumin and D)
urea were measured at day 7. n=3 replicates, single donor. Results are reported as mean ± SD.
Supplemental Figure 2: Anti-inflammatory effects of hydrocortisone on 10:1 cocultures in
LiverChip. Cocultures were carried out in the presence of increasing concentrations of
hydrocortisone for up to 8 days in culture. TNFα and IL6 were measured in coculture after 24 h
stimulation with 1 µg/mL LPS. n=3 replicates, single donor. Results are reported as mean ± SD.
Supplemental Figure 3: Anti-inflammatory effects of glucocorticoids with varying potency on
10:1 cocultures in LiverChip. Cocultures were carried out in the presence of no glucocorticoid (no
GC), 100 nM hydrocortisone (HC) and 100 nM dexamethasone (Dex) for up to 8 days in culture.
TNFα and IL6 were measured in coculture after 24 h stimulation with 1 µg/ml LPS. n=3 replicates,
single donor. Results are reported as mean ± SD.
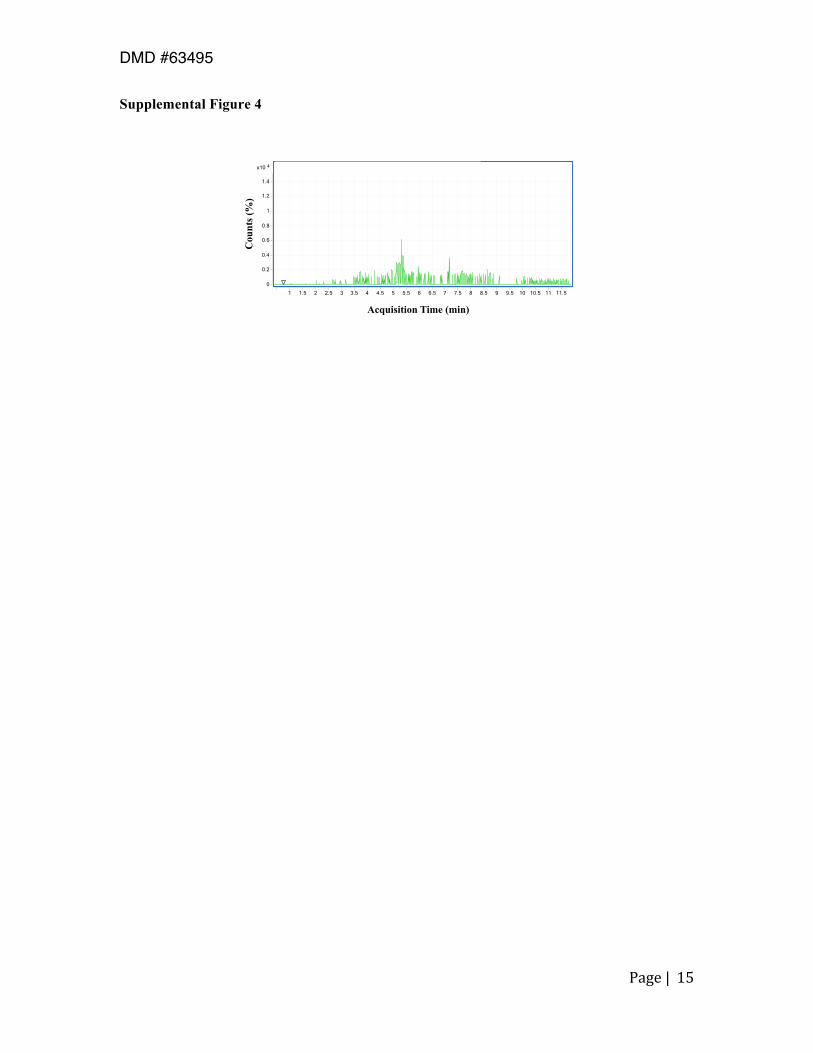
Supplemental Figure 4: Representative chromatogram of the aqueous layer after liquid
extraction. Hydrocortisone was not found which confirms that there is no loss of the analyte during
the extraction process.
Supplemental Figure 5: Experimental workflow used for the analysis of glucuronides. The
method consists of spiking with internal standard, solid phase extraction (SPE) and mass
spectrometry analysis in negative ion mode.

DMD #63495
Page |
6
Supplemental Figure 6: Sample Preparation. For technical variation assessment, each well was
extracted two times and each extraction was run twice consecutively in positive ion mode in RP-
UHPLC-QTOF-MS.
Supplemental Figure 7: Non-specific binding assessment. The cell-free bioreactor was exposed to
100 nM hydrocortisone for 4 hours. There was no detectable adsorption of HC to the materials of the
bioreactor.
Supplemental Figure 8: Kinetics of hydrocortisone release. 𝑙𝑛 !"!"!
vs time post-dosing. HC
clearance follows first order kinetics.
Supplemental Figure 9: Clearance rate of three donors. Donor-to-donor variability was assessed
and the %RSD was ≤ 15%.
Supplemental Figure 10: Effect of LPS induced inflammation in HC clearance over time.
Different concentrations of LPS were used to simulate inflammation in hepatocytes.
Supplemental Figure 11: Representative MS/MS spectra using 20 eV as the collision induced
dissociation energy. A) hydrocortisone and B) cortisone.
Supplemental Figure 12: Characterization of metabolites using human urine as a model.
Chromatogram comparison of tetrahydrocortisone found in LiverChip and in human urine.
Comparison based on retention time.

DMD #63495
Page |
7
Supplemental Figure 13: Characterization of metabolites using human urine as a model.
Spectra comparison of tetrahydrocortisone found in bioreactor medium and in human urine.
Comparison based on MS/MS pattern.
Supplemental Figure 14: Potential interconversion of tri- and tetra-deuterated hydrocortisone
via labeled cortisone by 11β-HSD pathways.
Supplemental Figure 15: Regression plot. The linearity of the method was assessed by a series of
three injections of six different concentration of hydrocortisone (5, 10, 75, 100 and 200 nM). n=3
replicates. Results are reported as mean ± SD.
Supplemental Figure 16: Precision of the HPLC-MS method used in the quantification of
hydrocortisone. The intra-assay precision was measured by one operator using exclusively the
Agilent QTOF over the course of one day. The precision was expressed as the percent relative
standard deviation of six replicates.
Supplemental Figure 17: Chromatographic reproducibility of the LC/MS system (Agilent 1200
Infinity LC interfaced with a 6530 Quadrupole-Time-of-Flight (QTOF) mass spectrometer.
Ten overlayed extracted ion chromatograms of hydrocortisone.
Supplemental Figure 18: Chromatograms of blank runs extracted for hydrocortisone. A) Blank
1, B) Blank 2 and C) Blank 3. There is no residual hydrocortisone being carrying from run to run.

DMD #63495
TABLES
Supplemental Table 1: Number of seeded hepatocytes and Kupffer cells in cocultures in LiverChip.
Cell Type Ratio Hepatocytes (x 106) Kupffers (x 106)
Co- 2.5:1 0.6 0.24
Co- 10:1 0.6 0.06
Co- 15:1 0.6 0.04

DMD #63495
Supplemental Table 2: Hepatocytes and Kupffer cells from three different donor pairs were plated as cocultures under non-inflammed conditions and treated with 100 nM hydrocortisone.
Pair 1 Hepatocyte Kupffer
Vendor Life Technologies Life Technologies
Lot Number Hu8150 HK8160
Age (Year) 21 69
Gender Female Male
BMI 25 23
Pair 2
Hepatocyte
Kupffer
Vendor Life Technologies Life Technologies
Lot Number Hu1583 HK8180
58 58 62
Gender Female Female
BMI 22 20
Pair 3
Hepatocyte
Kupffer
Vendor Life Technologies Life Technologies
Lot Number Hu8179 HK8202
58 55 58
Gender Female Female
BMI 24 31
DMD #63495
Page |
10
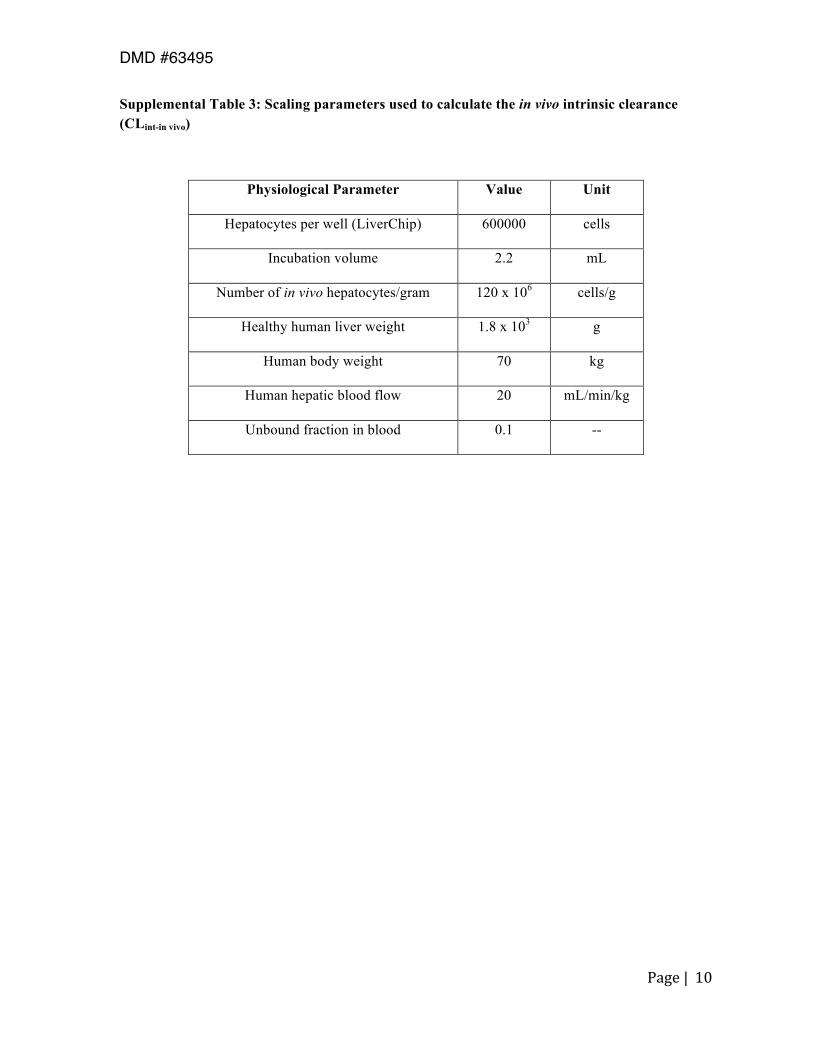
Supplemental Table 3: Scaling parameters used to calculate the in vivo intrinsic clearance (CLint-in vivo)
Physiological Parameter Value Unit
Hepatocytes per well (LiverChip) 600000 cells
Incubation volume 2.2 mL
Number of in vivo hepatocytes/gram 120 x 106 cells/g
Healthy human liver weight 1.8 x 10³ g
Human body weight 70 kg
Human hepatic blood flow 20 mL/min/kg
Unbound fraction in blood 0.1 --

DMD #63495
Supplemental Table 4: Accuracy assessment of the method for hydrocortisone quantification.
Experimental Concentration (nM)
Calculated Concentration (nM)
Percentage Error (%)
10 9.51 4.9
75 75.20 0.27
100 101.14 1.14

DMD #63495
Page |
12
FIGURES Supplemental Figure 1
0
1
2
3
4
5
6
Co 2.5:1 Co 10:1 Co 15:1 Mono
CY
P3A
(pm
ol/m
in/m
g)
Culture Condition
0
20
40
60
80
100
120
140
Co 2.5:1 Co 10:1 Co 15:1 Mono
Ure
a (µ
g/da
y/m
g)
Culture Condition
0.00
0.05
0.10
0.15
0.20
0.25
0.30
0.35
Co 2.5:1 Co 10:1 Co 15:1 Mono
Tota
l Pro
tein
Lev
el (m
g)
Culture Condition
0
10
20
30
40
50
60
70
80
90
Co 2.5:1 Co 10:1 Co 15:1 Mono
Alb
umin
(µg/
day/
mg)
Culture Condition
A)
C)
B)
D)

DMD #63495
Page |
13
Supplemental Figure 2
0
500
1000
1500
2000
0 100 500
TN
Fα (p
g)
Hydrocortisone Concentration (nM)
0 µg/mL LPS 1 µg/mL LPS
0
500
1000
1500
0 100 500
IL6
(pg)
Hydrocortisone Concentration (nM)
0 µg/mL LPS 1 µg/mL LPS

DMD #63495
Page |
14
Supplemental Figure 3
0
500
1000
1500
No GC HC Dex
TN
Fα (p
g)
Glucocorticoid (100 nM)
0 µg/mL LPS 1 µg/mL LPS
0
500
1000
1500
2000
No GC HC Dex
IL6
(pg)
Glucocorticoid (100 nM)
0 µg/mL LPS 1 µg/mL LPS
DMD #63495
Page |
15
Supplemental Figure 4
Acquisition Time (min)
Cou
nts
(%)

DMD #63495
Page |
16
Supplemental Figure 5
Co-culture (Hepatocytes:Kupffers)
100 nM HC
Sample collection
SpeedVac® Dry Resuspension in
2% ACN, 0.1% FA
Injection in QTOF-06530
Extracted Ion Chromatograms
Calculate concentrations & plot graphs
O
O
HOH
OH
OH
HH
50 µL sample + 100 µL ammonium acetate buffer;
spike with glucuronide internal standard
1 mL MeOH 1mL H2O
Load sample 1 mL H2O
Elution: 1 mL MeOH

DMD #63495
Page |
17
Supplemental Figure 6
Technical Rep 1
Technical Rep 2
MS Rep 1
MS Rep 2
MS Rep 1
MS Rep 2
Well 1
4 LC-MS Runs
Technical Rep 1
Technical Rep 2
MS Rep 1
MS Rep 2
MS Rep 1
MS Rep 2
4 LC-MS Runs
Well 2

DMD #63495
Page |
18
Supplemental Figure 7
0 1/4 0.5 1 40
50
100
150
200 Well Rep 1Well Rep 2
Time post-dosing (hr)
HC
Con
cent
ratio
n (n
M)

DMD #63495
Page |
19
Supplemental Figure 8
0 20 40 60-1.5
-1.0
-0.5
0.0
Linearregression
y = -0.0242X-0.0203R2 = 0.9929
Time post-dosing (hr)
ln H
C/H
C z
ero

DMD #63495
Page |
20
Supplemental Figure 9
0 24 480
20406080
100120
Donor 1Donor 2Donor 3Average
Time post-dosing (hr)
HC
Con
cent
ratio
n (n
M)

DMD #63495
Page |
21
Supplemental Figure 10
0 24 480
20406080
100120
-LPS+LPS (1 µg/mL)+LPS (0.1 µg/mL)
Time post-dosing (hr)
HC
Con
cent
ratio
n (n
M)

DMD #63495
Page |
22
Supplemental Figure 11
4 x10
0
0.1
0.2
0.3
0.4
0.5
0.6
0.7
0.8
0.9
1
1.1
1.2
+ESI Product Ion (3.426-3.460 min, 3 Scans) Frag=160.0V [email protected] (363.2171[z=1] -> **) human urine_MSMS_posmode
121.0649
363.2169
327.1958
309.1851 267.1745
97.0652 297.1843 345.2064
187.1123 241.1595 281.1884 145.1001 209.1314 225.1299
69.0344 81.0697
4 x10
0
0.1
0.2
0.3
0.4
0.5
0.6
0.7
0.8
0.9
1
1.1
1.2
+ESI Product Ion (3.495-3.512 min, 2 Scans) Frag=160.0V [email protected] (361.2015[z=1] -> **) DRB_urine_MSMS_posmode_iv5_002.d 361.2010
163.1116
343.1902 121.0646
301.1812 145.1011 283.1694 267.1742 325.1796
107.0850 241.1529 171.1151 81.0698 187.1119 225.1279 67.0541
Counts vs. Mass-to-Charge (m/z) 30 40 50 60 70 80 90 100 110 120 130 140 150 160 170 180 190 200 210 220 230 240 250 260 270 280 290 300 310 320 330 340 350 360 370 380
Cou
nts
(%)
A)
B)
O
O
HOH
OH
OH
HH
O
O
OH
OH
OH
HH
Mass-to-Charge (m/z)

DMD #63495
Page |
23
Supplemental Figure 12
Acquisition Time (min)
Cou
nts (
%)
x104
Human urine
1
2
1
2
x104
LiverChip

DMD #63495
Page |
24
Supplemental Figure 13
100 269.1908
365.2356
121.0644
147.1160 185.1325 293.1886 329.2129 311.2011 251.1794 161.1331 97.0643 61.0285 223.1465 347.2197 83.0492
100
(3.136-3.170 min
365.2324
269.1896
121.0643
149.1294 251.1760 168.1396 329.2095 347.1722 293.1914 135.1139 95.0859 230.0475 71.0484 185.1329
(m/z) 60 70 80 90 100 110 120 130 140 150 160 170 180 190 200 210 220 230 240 250 260 270 280 290 300 310 320 330 340 350 360 370 380 390 400
Cou
nts (
%)
1
2
x104
1
2
x104
Human urine
LiverChip
Mass-to-Charge (m/z)

DMD #63495
Page |
25
Supplemental Figure 14
O
OH
OHHO
O
H
D H
D DD O
OH
OH
O
H
D H
ODD O
OH
OHHO
O
H
D H
DD
11β-HSD2
Exact Mass: 366.23 D4-cortisol
Exact Mass: 363.21 D3-cortisone
Exact Mass: 365.23 D4-cortisol
11β-HSD1

DMD #63495
Page |
26
Supplemental Figure 15
y = 0.0239x + 0.0628 R² = 0.99991
0
1
2
3
4
5
6
0 50 100 150 200 250
HC
/D4H
C
HC Concentration (nM)

DMD #63495
Page |
27
Supplemental Figure 16
Second Set
80
100
120
Replicates
HC
Con
cent
ratio
n (n
M)

DMD #63495
Page |
28
Supplemental Figure 17
5 x10
0
1
2
3
4
5
6
7
+ESI EIC (363.2171) Scan Frag=160.0V 100nMHC_ …
2.7 2.8 2.9 3 3.1 3.2 3.3 3.4 3.5 3.6 3.7 3.8 3.9 4 4.1
Acquisition Time (min)
Cou
nts
(%)

DMD #63495
Page |
29
Supplemental Fig. 18
Acquisition Time (min)
Cou
nts
(%)
A)
B)
C)