Embed Size (px)
Citation preview

1
Supplemental Handout Day 2

2
Agenda: Day 2 ................................................................................................................................. 3
Activity: Defining Problem Behaviors ............................................................................................. 4
Activity: Considerations for Classifying Behaviors ......................................................................... 4
Activity: Discipline Referral Process ............................................................................................... 4
Basic Example of a Discipline Referral Process ............................................................................... 5
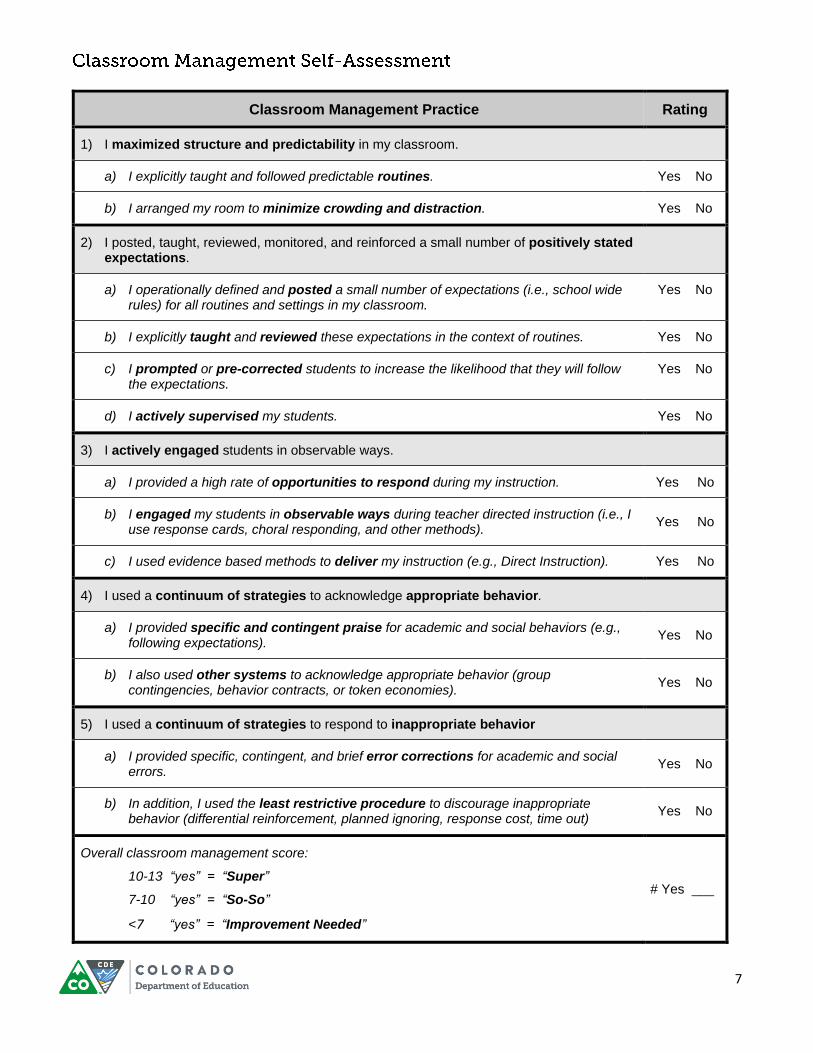
Activity: Self-Assessment Guides ................................................................................................... 5
Active Supervision Self-Assessment ............................................................................................... 6
Classroom Management Self-Assessment ...................................................................................... 7
Activity: Scripting Responses to Common Misbehavior ................................................................ 8
Activity: Data-Based Problem Solving (Impact) .............................................................................. 8
Optional Activity: Data-Based Problem Solving (Impact) ............................................................ 12
Graphic for Problem Solving Example (Implementation) ............................................................. 13
Activity: Data-Based Problem Solving (Implementation) ............................................................. 14
5 Whys Worksheet ........................................................................................................................ 15
Activity: Implementation Stages .................................................................................................. 17
Activity: Enabling Change ............................................................................................................. 18
Hexagon Tool ................................................................................................................................ 19
Designing Intervention Strategies ................................................................................................ 20

3
A two-day training provided by the Office of Learning Supports
8:00 to 8:30 am Registration and Display Preparation
8:30 to 8:40 Finish Display
8:40 to 9:10 Welcome and Gallery Walk
9:15 to 10:30 Discipline System
10:30 to 10:45 Break
10:45 to 11:15 Discipline System (cont)
11:15 to 11:45 Data-Based Decision Making: Impact
11:45 to 1:00 Lunch
1:00 to 1:30 Data-Based Decision Making: Impact (cont)
1:30: to 1:45 Kahoot Quiz
1:45 to 2:15 Data-Based Decision Making: Implementation
2:15 to 2:30 Break
2:30 to 3:20 Using Implementation Science to Inform Next Steps
3:20 to 3:30 Kahoot Quiz
Wrap-Up/Questions
Examples of content can be found at https://www.cde.state.co.us/pbis/universalpbis.

4
1. Thinking of student behavior, in your own words, what is a definition of “disrespect?”
2. After sharing with your neighbor, what were similarities and differences in your definition?
1. What is disrespectful behavior that would be teacher-managed?
2. What is disrespectful behavior that would be considered office-managed?
3. How will your systems ensure cultural responsiveness?
1. For this activity, your team will draft or revise their discipline referral process. We have included
a basic example here, but additional examples can be found on our website at https://www.cde.state.co.us/pbis/universalpbis
2. Spend the allotted time working with your team to determine a process for the staff to use when dealing with student behavior. Consider:
a. What is a major vs minor vs crisis behavior? b. What is the first response when a teacher sees a minor behavior? What is the first
response when a teacher sees a major behavior? c. How many instances of a minor behavior are considered a major behavior? Within a
certain time frame? What others information should be considered? d. When/how does the staff member gather date (i.e., complete the office referral form)? e. When will follow-up be with a student? f. What data can your school team gather to evaluate the impact and implementation of
the referral process? i. Data to show it’s working
ii. Data to show it’s being implemented as intended

5
1. Choose to focus on either common settings (Active Supervision Self-Assessment) or classroom
practices (Classroom Self-Assessment). 2. Examine the tool that corresponds to your selection. 3. Discuss as a team how you can use these tools to ensure effective practices in either your school
or your district. Write down what you discussed.
Complete Discipline Referral Form
Verbal Redirection
Determine Consequence
Complete remainder of referral form
Escort to office
Determine Consequence
Follow through with consequence
File necessary consequences
Files necessary documentation
Send written referral to office
Does student have 3-5 referrals?
Follow-up with student within
a week
Is behavior Major?
Observe Problem Behavior

6
Name _____________________________ Date ______________
Setting: □ Classroom □ Entrance □ Cafeteria
□ Playground □ Other ________________
Time Start:
Time End:
Tally each positive student contacts
Total #
Ratio of Positives to Negatives: _______ : 1 Tally each negative student contacts
Total #
1. Did I have at least 4 positive for 1 negative student contacts? Yes No
2. Did I move throughout the area I as supervising? Yes No
3. Did I frequently scan the area I was supervising? Yes No
4. Did I positively interact with most of the students in the area? Yes No
5. Did I handle most minor rule violations quickly and quietly? Yes No
6. Did I follow school procedures for handling major rule violations? Yes No
7. Do I know our schoolwide expectations? Yes No
8. Did I positively acknowledge at least 5 different students for displaying our schoolwide expectations?
Yes No
Overall active supervision score:
7-8 “yes” = Great Supervision
5-6 “yes” = So-so Supervision # Yes ______
< 5 “yes” = Improvement needed
Adapted from Sugai, 2004
7
Classroom Management Practice Rating
1) I maximized structure and predictability in my classroom.
a) I explicitly taught and followed predictable routines. Yes No
b) I arranged my room to minimize crowding and distraction. Yes No
2) I posted, taught, reviewed, monitored, and reinforced a small number of positively stated expectations.
a) I operationally defined and posted a small number of expectations (i.e., school wide rules) for all routines and settings in my classroom.
Yes No
b) I explicitly taught and reviewed these expectations in the context of routines. Yes No
c) I prompted or pre-corrected students to increase the likelihood that they will follow the expectations.
Yes No
d) I actively supervised my students. Yes No
3) I actively engaged students in observable ways.
a) I provided a high rate of opportunities to respond during my instruction. Yes No
b) I engaged my students in observable ways during teacher directed instruction (i.e., I use response cards, choral responding, and other methods).
Yes No
c) I used evidence based methods to deliver my instruction (e.g., Direct Instruction). Yes No
4) I used a continuum of strategies to acknowledge appropriate behavior.
a) I provided specific and contingent praise for academic and social behaviors (e.g., following expectations).
Yes No
b) I also used other systems to acknowledge appropriate behavior (group contingencies, behavior contracts, or token economies).
Yes No
5) I used a continuum of strategies to respond to inappropriate behavior
a) I provided specific, contingent, and brief error corrections for academic and social errors.
Yes No
b) In addition, I used the least restrictive procedure to discourage inappropriate behavior (differential reinforcement, planned ignoring, response cost, time out)
Yes No
Overall classroom management score:
10-13 “yes” = “Super”
7-10 “yes” = “So-So”
<7 “yes” = “Improvement Needed”
# Yes ___

8
• Consider the following scenario. You have given assignment in class. You go over to a student
and ask them to get to work. They respond with, “You can’t make me!” • What is your next move? What do you do? Say?
• Come up with more student responses that may warrant scripts.
1. Generate your school’s Average Referral Per Day Per Month graph for either Major Referrals or Minor Referrals.
2. Compare your rate of ODRs to the SWIS database by calculating the Absolute Value/50th percentile for your school. Be mindful of if you’re examining major vs. minor referrals.
Grade Range Median/50th Percentile ODRs
per 100 per school day 25th Percentile ODRs
per 100 per school day 75th Percentile ODRs per
100 per school day
K-6 .26 .10 .57
6-9 .36 .14 .73
9-12 .22 .05 .50
PreK-8 .27 .08 .67
PreK-12 .42 .20 .88
Grade Range Median/50th Percentile ODRs
per 100 per school day 25th Percentile ODRs
per 100 per school day 75th Percentile ODRs per
100 per school day
K-6 .20 .09 .39
6-9 .31 .16 .60
9-12 .33 .17 .62
PreK-8 .28 .12 .51
PreK-12 .29 .15 .50
Enrollment: __________ ÷ 100 = ___________
_________ X _______ (Median ODRs per 100)
= _______ (Absolute Standard; Use throughout year for Problem Solving)

9
3. Calculate the 25th and 75th absolute standard using the same formula.
_________ X _______ (25th percentile ODRs per 100) = _______________
_________ X _______ (75th percentile ODRs per 100) = _______________
4. Draw a line across your graph to represent the absolute standard or compare the absolute
standard to your current rate of average ODRs per day per month. How does your school look compared to the SWIS database? (This is Step 1 of the Problem Solving Process) Write a primary problem statement based on your graph.
a. Consider: Does this seem like an issue for our school, given our context? Consider the severity, frequency, and trend of the problem.
5. Explore the primary problem by examining additional data/graphs. After reviewing the graphs,
write a precise problem statement (This is Step 2 of the Problem Solving Process).
What
Where
When
Who
Why
Precise Problem Statement:
Note: Your team may identify more than one problem. If that is the case, you will need separate problem statements for each one identified.

10
6. What is the solution to fix the identified problem? Ensure all components of a solution are included (This is Step 3 of the Problem Solving Process).
Goal
Prevention
Teaching
Recognition
Extinction
Corrective Consequences
Evaluation: Impact
Evaluation: Implementation
7. What date will your team examine the impact and implementation data in order to evaluate and
monitor the solution? (This is Step 4 of the Problem Solving Process).
Date: ________________
11
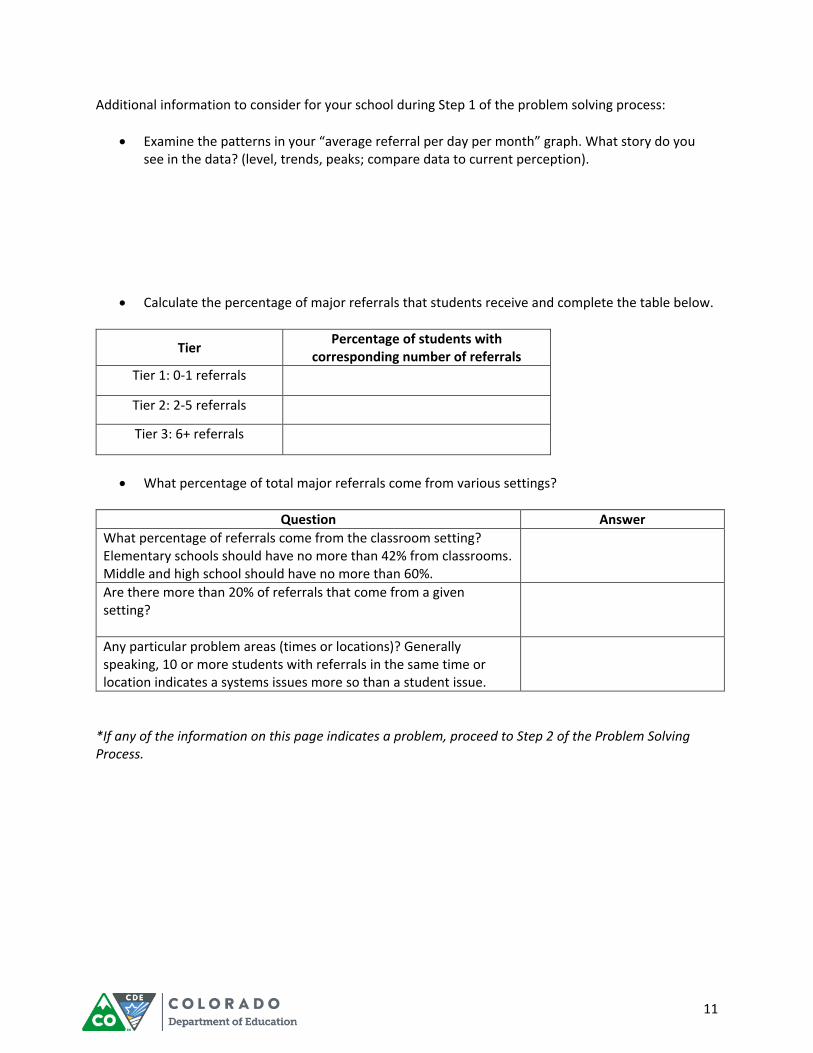
Additional information to consider for your school during Step 1 of the problem solving process:
Examine the patterns in your “average referral per day per month” graph. What story do you see in the data? (level, trends, peaks; compare data to current perception).
Calculate the percentage of major referrals that students receive and complete the table below.
Tier Percentage of students with
corresponding number of referrals
Tier 1: 0-1 referrals
Tier 2: 2-5 referrals
Tier 3: 6+ referrals
What percentage of total major referrals come from various settings?
Question Answer
What percentage of referrals come from the classroom setting? Elementary schools should have no more than 42% from classrooms. Middle and high school should have no more than 60%.
Are there more than 20% of referrals that come from a given setting?
Any particular problem areas (times or locations)? Generally speaking, 10 or more students with referrals in the same time or location indicates a systems issues more so than a student issue.
*If any of the information on this page indicates a problem, proceed to Step 2 of the Problem Solving Process.

12
Evaluating Tier 1 using major referrals
How do we look compared to SWIS national database?
What do our patterns (peaks, trends) look like?
Do we have at least 80% of students with 0-1 Major ODRs?
Do we have problem areas?
Other considerations (e.g., truancy, suspension, subgroups, etc)? Please review the table below and answer the questions below.
School Grades Enrollment Avg referrals per day per month
% of referrals from classroom
% of referrals from common area
% of students with 2-5 referrals
A K-5 450 0.7 35 25 32
B K-6 600 1.9 45 50 12
C 6-8 750 2.1 50 25 65
D 9-12 1200 7.6 73 9 20
1. Which schools may need whole school adjustments?
a. Whole school system improvement is likely indicated when the average number of referrals per day is high (e.g., above national median). Divide enrollment by 100, multiply by the mean ODRs per 100 from the table below to find their absolute standard. Compare this to the average referrals per day per month.
School National Median Major ODRs per 100 students
K-6 .20
6-9 .31
9-12 .33
b. Which schools are indicated?
2. Common area improvement is indicated when 20% or more of all referrals come from a specific setting. Which school(s) have this need and what solutions would you consider?

13
3. Classroom management improvement is indicated when 42% or more major referrals come from elementary classrooms and 60% or more from middle and high school. Or when there are specific classrooms with more referrals compared to similar classrooms.
a. Which school(s) have this need and what solutions would you consider?
4. Improvement in services to individual students is indicated when: a. proportion of students with 0-1 referrals is low, but the proportion of students with 2 to
6 referrals is high (more than 10-15%). b. More than 5% of students have received 6 or more referrals c. When students with the most office referrals account for a high percentage of all
referrals d. High frequency of suspensions and expulsions e. Which school(s) have this need and why?

14
1. Step 1 of Problem Solving Process: Define
a. What is your overall score? _____________
b. What are the scores of the subscales?
Teams ___________
Implementation ___________
Evaluation ___________
c. Examine individual items. Write a primary problem statement.
d. Examine additional information and write a precise problem statement. i. What is the problem?
ii. -How often is the problem happening? iii. -Where is the problem happening? iv. -Who is engaged in the problem? v. -When is the problem most likely to occur?
2. Step 2 of the Problem Solving Process: Analyze
a. Determine the root cause of the problem by conducting a root cause analysis. Complete
the 5 Whys Worksheet (on the next page).
b. What is the main cause for the problem?

15
1.
→ Why is that?
↓
2.
→ Why is that?
↓
3.
→ Why is that?
↓
4.
→ Why is that?
↓
5.
As you process through the “whys,” focus on alterable variables. If the last answer is something that you can’t control, go back up to the previous answer.
16
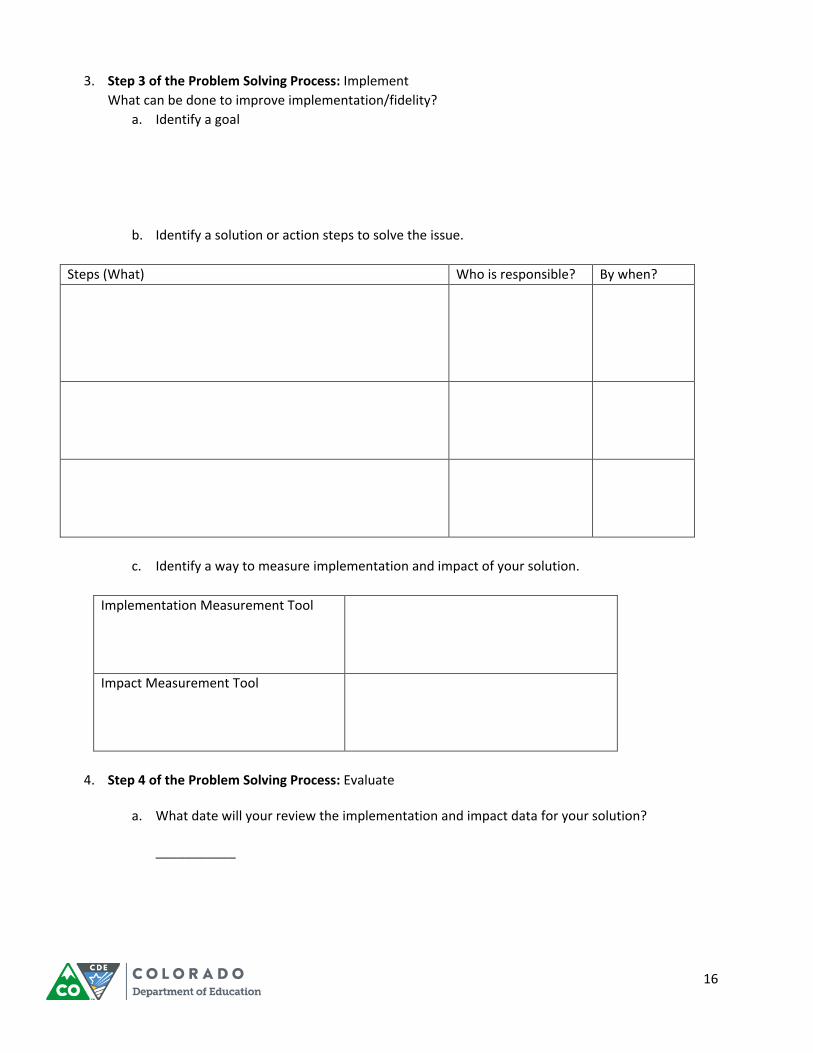
3. Step 3 of the Problem Solving Process: Implement
What can be done to improve implementation/fidelity?
a. Identify a goal
b. Identify a solution or action steps to solve the issue.
Steps (What) Who is responsible? By when?
c. Identify a way to measure implementation and impact of your solution.
Implementation Measurement Tool
Impact Measurement Tool
4. Step 4 of the Problem Solving Process: Evaluate
a. What date will your review the implementation and impact data for your solution? ___________
17
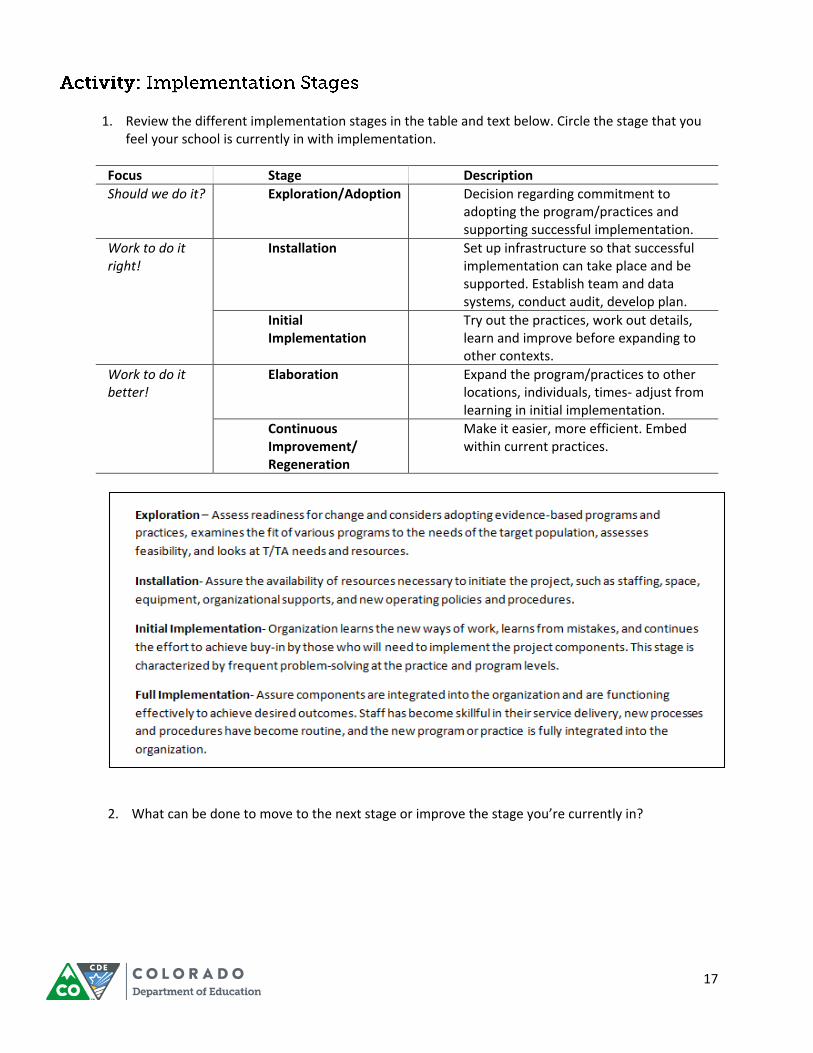
1. Review the different implementation stages in the table and text below. Circle the stage that you
feel your school is currently in with implementation.
Focus Stage Description
Should we do it? Exploration/Adoption Decision regarding commitment to adopting the program/practices and supporting successful implementation.
Work to do it right!
Installation Set up infrastructure so that successful implementation can take place and be supported. Establish team and data systems, conduct audit, develop plan.
Initial Implementation
Try out the practices, work out details, learn and improve before expanding to other contexts.
Work to do it better!
Elaboration Expand the program/practices to other locations, individuals, times- adjust from learning in initial implementation.
Continuous Improvement/ Regeneration
Make it easier, more efficient. Embed within current practices.
2. What can be done to move to the next stage or improve the stage you’re currently in?

18
1. Examine the graphic below. Recall that:
a. Vision: Your purpose and reason for implementing PBIS. b. Skills: The technical skills, knowledge, and expertise needed for the school/staff to
implement PBIS. c. Incentives: The motivation or desired outcome for implementing PBIS, as well as benefits
to staff for implementing. d. Resources: The support and resources needed to implement PBIS. e. Action Plan: The roadmap for how to implement PBIS over time and for ensuring
implementation and impact is evaluated.
2. Which of those pieces (vision, skills, incentives, resources, action plan) is your team missing, if any?
3. How can your team improve, ensure, or initiate one of those pieces?

19

20
(How can we avoid the problem context?)
What strategies will we use to decrease the likelihood that the problem behavior will occur? How will we manipulate the environment to increase the use of the replacement behavior? What pre-correction strategies will we use?
(How can we define, teach, and monitor what we
want?)
What is the replacement behavior? How are we going to teach it? What strategies are we going to use to generalize this learning to the natural setting?
(How can we build in systematic reward for
desired behavior)
How are we going to artificially elevate the ratio of positive to negative feedback. How are we going to ensure the replacement behavior is effective and efficient at getting the same function? What strategies are we going to use to ensure the problem behavior becomes inefficient and ineffective at getting needs met?