Embed Size (px)
Citation preview
1
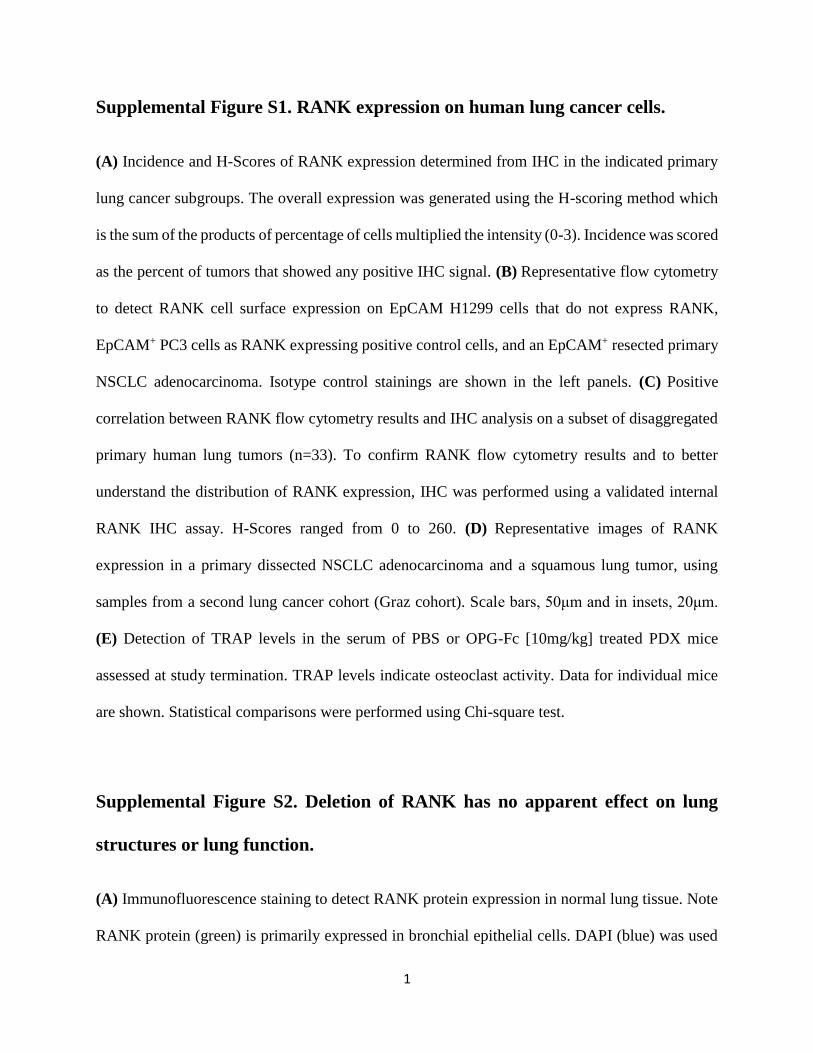
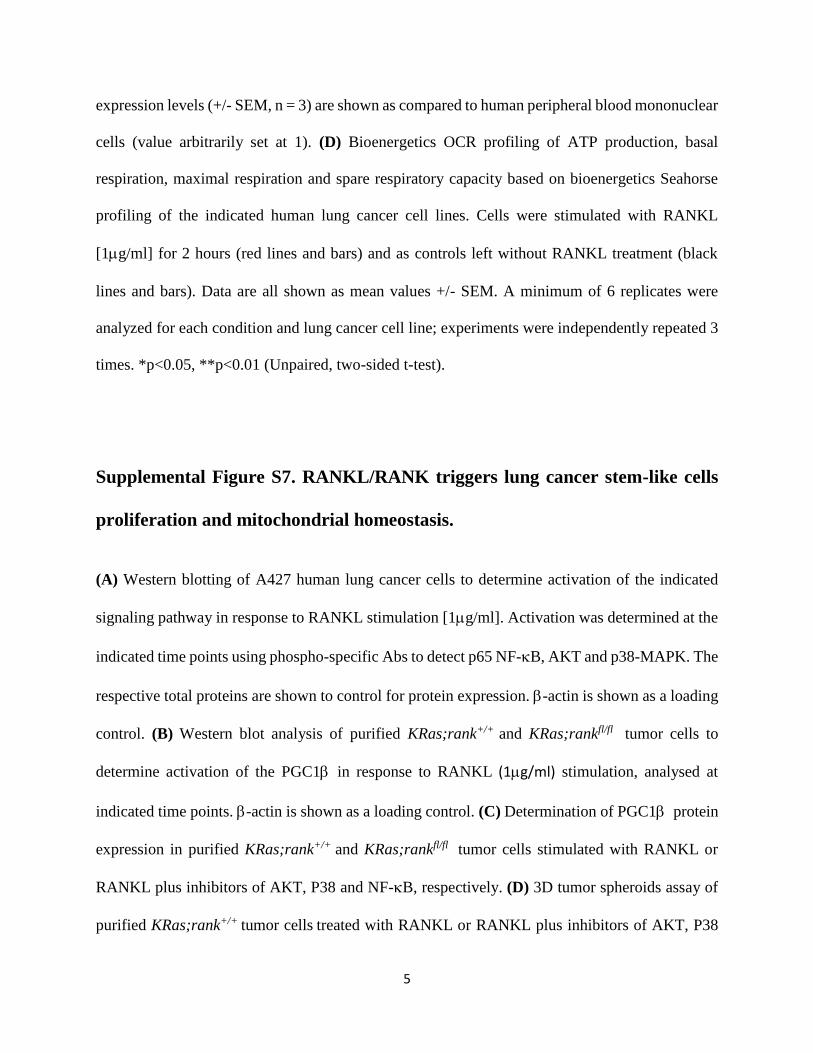
Supplemental Figure S1. RANK expression on human lung cancer cells.
(A) Incidence and H-Scores of RANK expression determined from IHC in the indicated primary
lung cancer subgroups. The overall expression was generated using the H-scoring method which
is the sum of the products of percentage of cells multiplied the intensity (0-3). Incidence was scored
as the percent of tumors that showed any positive IHC signal. (B) Representative flow cytometry
to detect RANK cell surface expression on EpCAM H1299 cells that do not express RANK,
EpCAM+ PC3 cells as RANK expressing positive control cells, and an EpCAM+ resected primary
NSCLC adenocarcinoma. Isotype control stainings are shown in the left panels. (C) Positive
correlation between RANK flow cytometry results and IHC analysis on a subset of disaggregated
primary human lung tumors (n=33). To confirm RANK flow cytometry results and to better
understand the distribution of RANK expression, IHC was performed using a validated internal
RANK IHC assay. H-Scores ranged from 0 to 260. (D) Representative images of RANK
expression in a primary dissected NSCLC adenocarcinoma and a squamous lung tumor, using
samples from a second lung cancer cohort (Graz cohort). Scale bars, 50μm and in insets, 20μm.
(E) Detection of TRAP levels in the serum of PBS or OPG-Fc [10mg/kg] treated PDX mice
assessed at study termination. TRAP levels indicate osteoclast activity. Data for individual mice
are shown. Statistical comparisons were performed using Chi-square test.
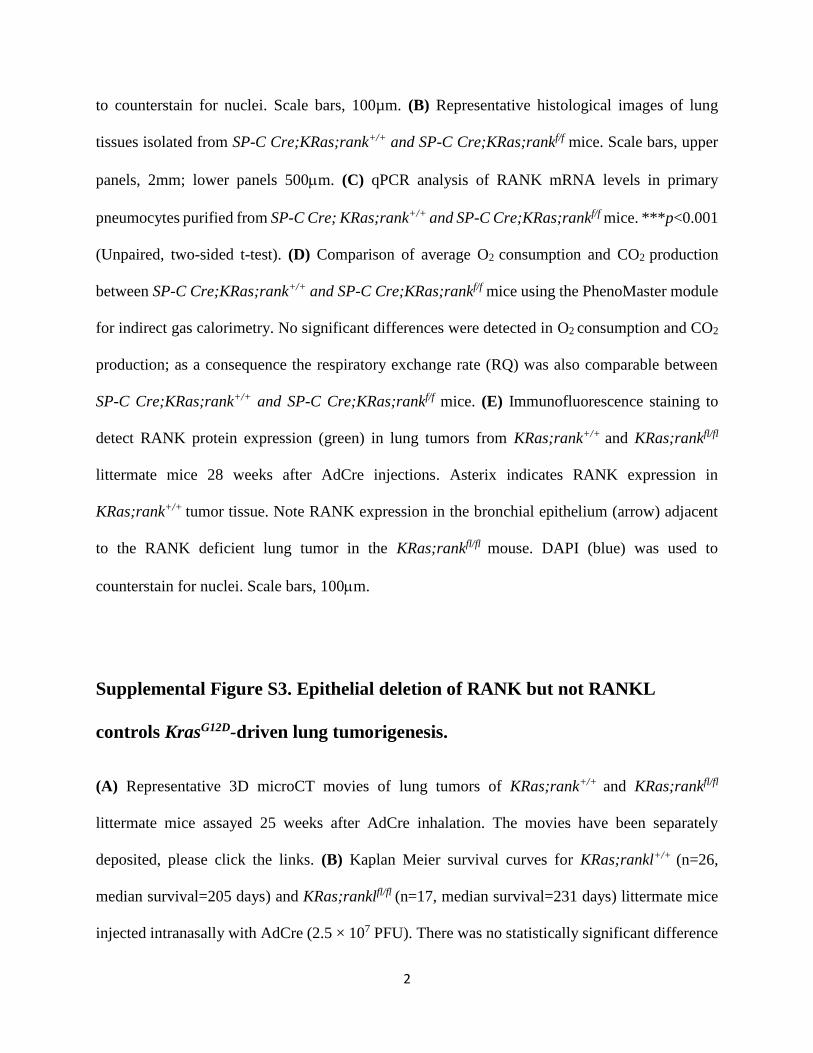
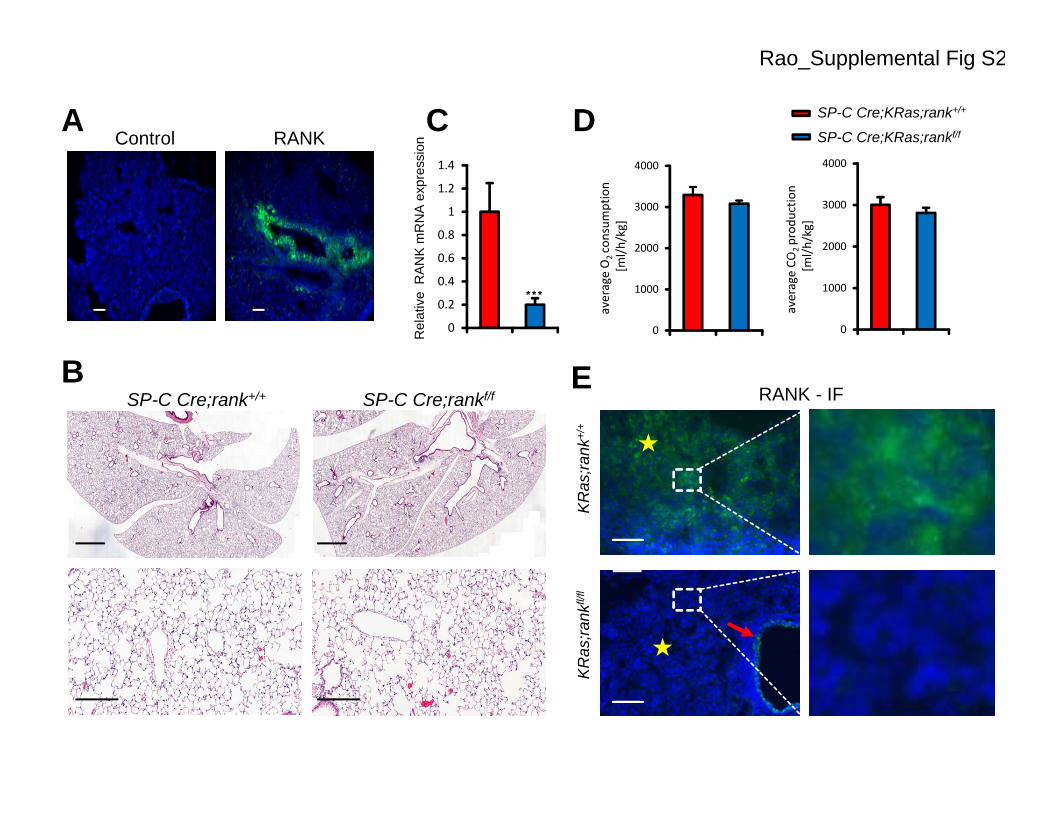
Supplemental Figure S2. Deletion of RANK has no apparent effect on lung
structures or lung function.
(A) Immunofluorescence staining to detect RANK protein expression in normal lung tissue. Note
RANK protein (green) is primarily expressed in bronchial epithelial cells. DAPI (blue) was used
2
to counterstain for nuclei. Scale bars, 100µm. (B) Representative histological images of lung
tissues isolated from SP-C Cre;KRas;rank+/+ and SP-C Cre;KRas;rankf/f mice. Scale bars, upper
panels, 2mm; lower panels 500m. (C) qPCR analysis of RANK mRNA levels in primary
pneumocytes purified from SP-C Cre; KRas;rank+/+ and SP-C Cre;KRas;rankf/f mice. ***p<0.001
(Unpaired, two-sided t-test). (D) Comparison of average O2 consumption and CO2 production
between SP-C Cre;KRas;rank+/+ and SP-C Cre;KRas;rankf/f mice using the PhenoMaster module
for indirect gas calorimetry. No significant differences were detected in O2 consumption and CO2
production; as a consequence the respiratory exchange rate (RQ) was also comparable between
SP-C Cre;KRas;rank+/+ and SP-C Cre;KRas;rankf/f mice. (E) Immunofluorescence staining to
detect RANK protein expression (green) in lung tumors from KRas;rank+/+ and KRas;rankfl/fl
littermate mice 28 weeks after AdCre injections. Asterix indicates RANK expression in
KRas;rank+/+ tumor tissue. Note RANK expression in the bronchial epithelium (arrow) adjacent
to the RANK deficient lung tumor in the KRas;rankfl/fl mouse. DAPI (blue) was used to
counterstain for nuclei. Scale bars, 100m.
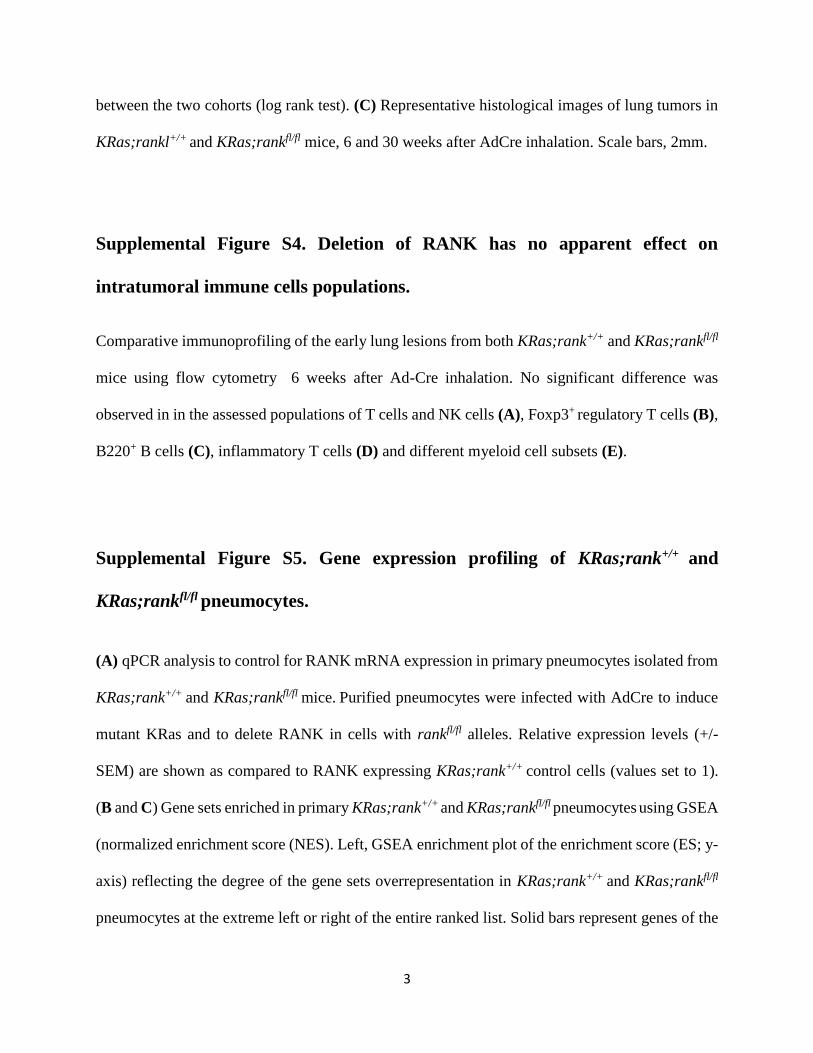
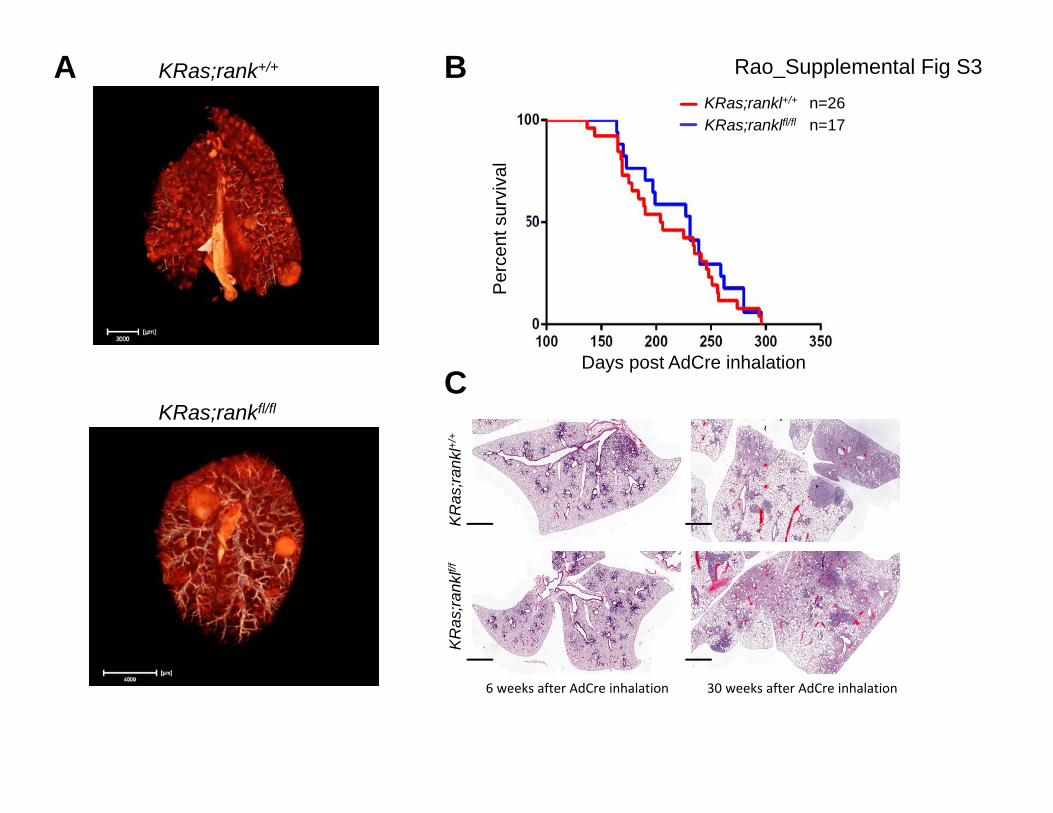
Supplemental Figure S3. Epithelial deletion of RANK but not RANKL
controls KrasG12D-driven lung tumorigenesis.
(A) Representative 3D microCT movies of lung tumors of KRas;rank+/+ and KRas;rankfl/fl
littermate mice assayed 25 weeks after AdCre inhalation. The movies have been separately
deposited, please click the links. (B) Kaplan Meier survival curves for KRas;rankl+/+ (n=26,
median survival=205 days) and KRas;ranklfl/fl (n=17, median survival=231 days) littermate mice
injected intranasally with AdCre (2.5 × 10⁷ PFU). There was no statistically significant difference
3
between the two cohorts (log rank test). (C) Representative histological images of lung tumors in
KRas;rankl+/+ and KRas;rankfl/fl mice, 6 and 30 weeks after AdCre inhalation. Scale bars, 2mm.
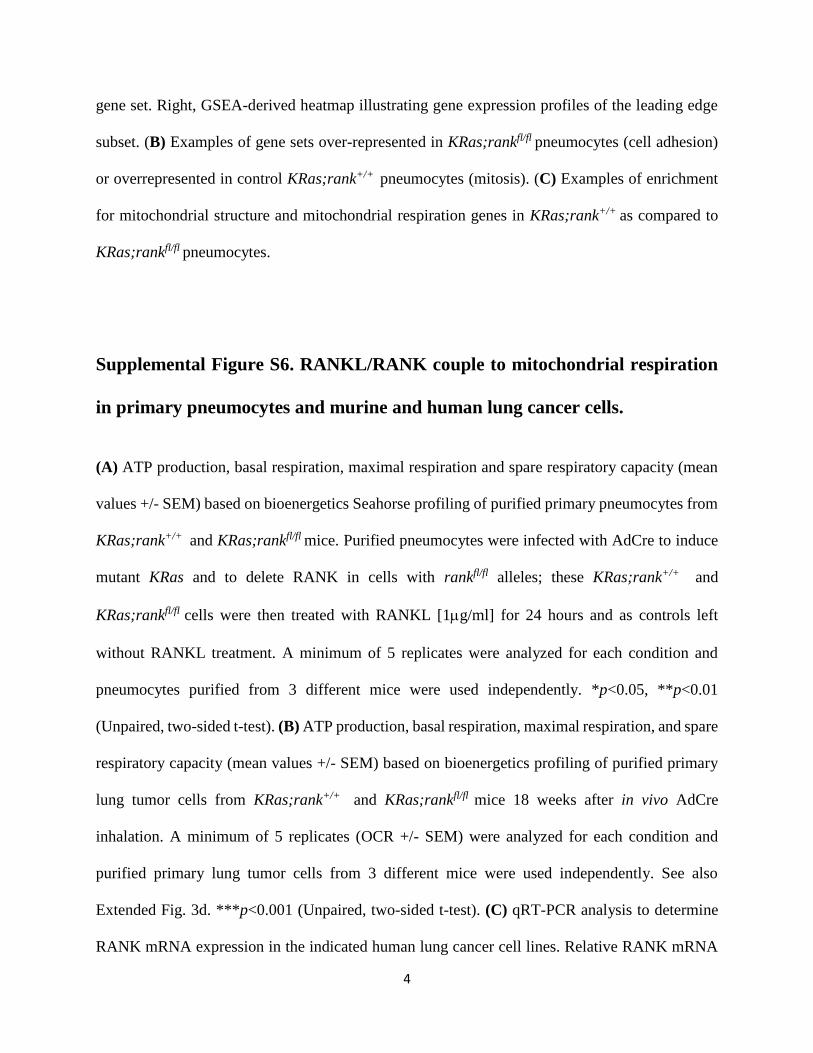
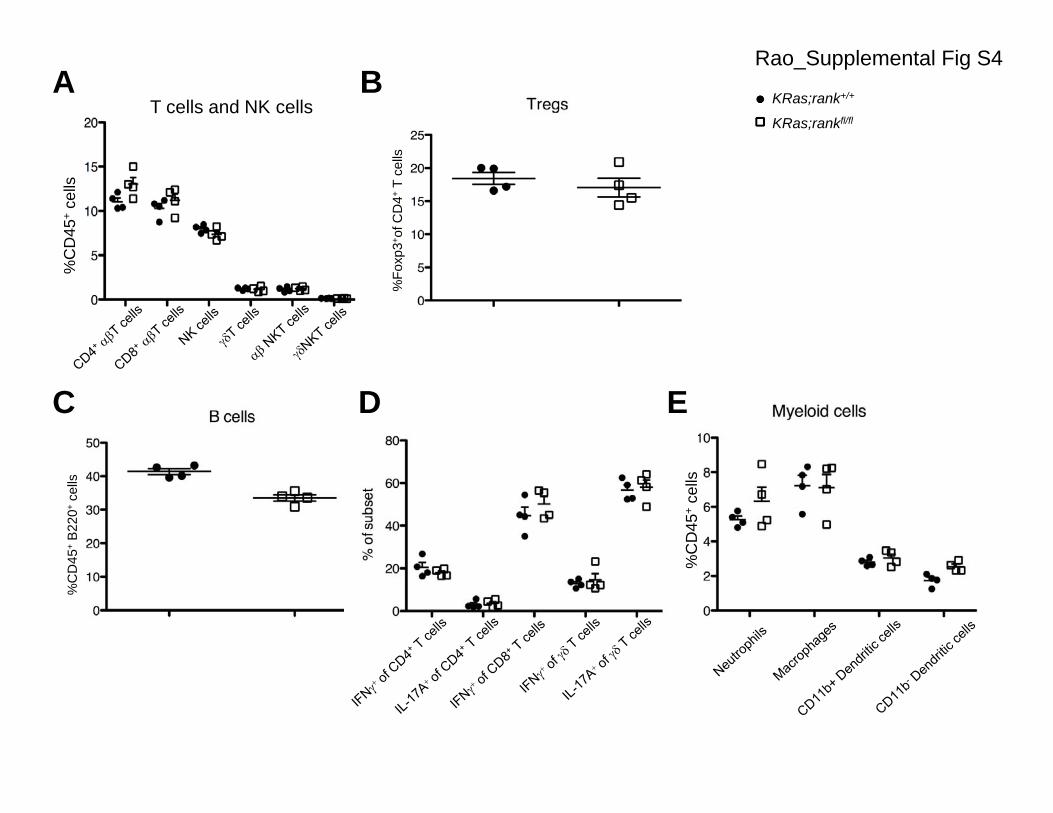
Supplemental Figure S4. Deletion of RANK has no apparent effect on
intratumoral immune cells populations.
Comparative immunoprofiling of the early lung lesions from both KRas;rank+/+ and KRas;rankfl/fl
mice using flow cytometry 6 weeks after Ad-Cre inhalation. No significant difference was
observed in in the assessed populations of T cells and NK cells (A), Foxp3+ regulatory T cells (B),
B220+ B cells (C), inflammatory T cells (D) and different myeloid cell subsets (E).
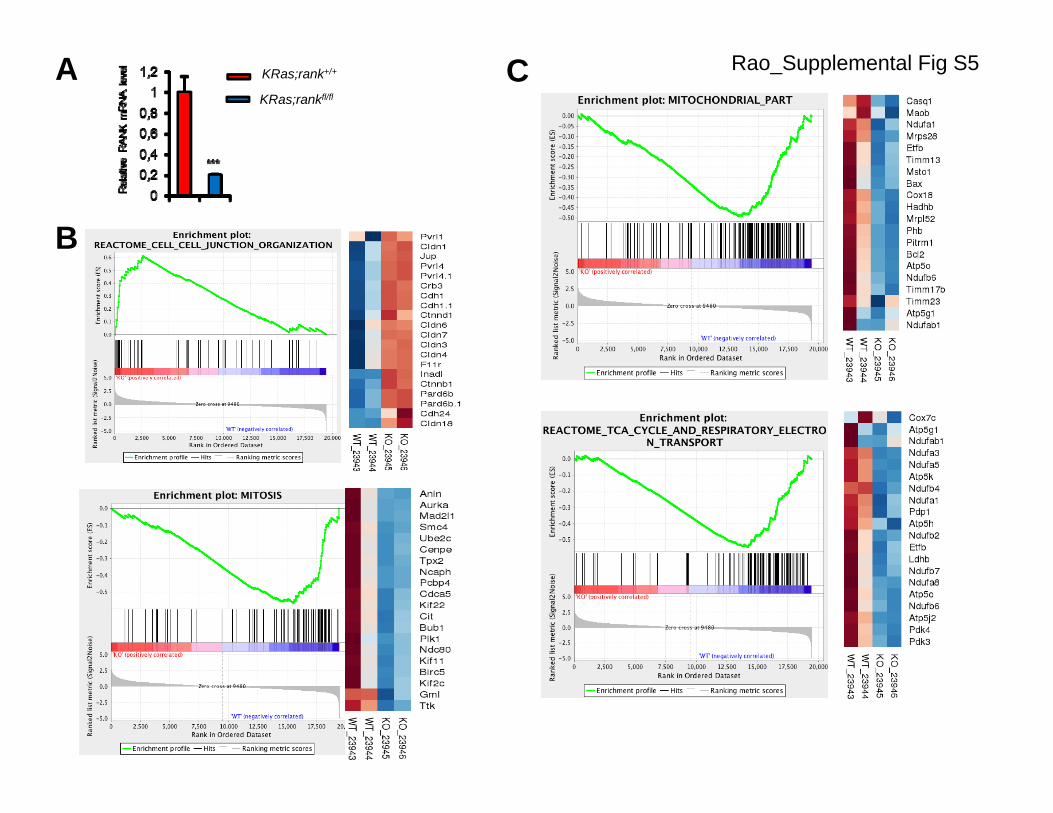
Supplemental Figure S5. Gene expression profiling of KRas;rank+/+ and
KRas;rankfl/fl pneumocytes.
(A) qPCR analysis to control for RANK mRNA expression in primary pneumocytes isolated from
KRas;rank+/+ and KRas;rankfl/fl mice. Purified pneumocytes were infected with AdCre to induce
mutant KRas and to delete RANK in cells with rankfl/fl alleles. Relative expression levels (+/-
SEM) are shown as compared to RANK expressing KRas;rank+/+ control cells (values set to 1).
(B and C) Gene sets enriched in primary KRas;rank+/+ and KRas;rankfl/fl pneumocytes using GSEA
(normalized enrichment score (NES). Left, GSEA enrichment plot of the enrichment score (ES; y-
axis) reflecting the degree of the gene sets overrepresentation in KRas;rank+/+ and KRas;rankfl/fl
pneumocytes at the extreme left or right of the entire ranked list. Solid bars represent genes of the
4
gene set. Right, GSEA-derived heatmap illustrating gene expression profiles of the leading edge
subset. (B) Examples of gene sets over-represented in KRas;rankfl/fl pneumocytes (cell adhesion)
or overrepresented in control KRas;rank+/+ pneumocytes (mitosis). (C) Examples of enrichment
for mitochondrial structure and mitochondrial respiration genes in KRas;rank+/+ as compared to
KRas;rankfl/fl pneumocytes.
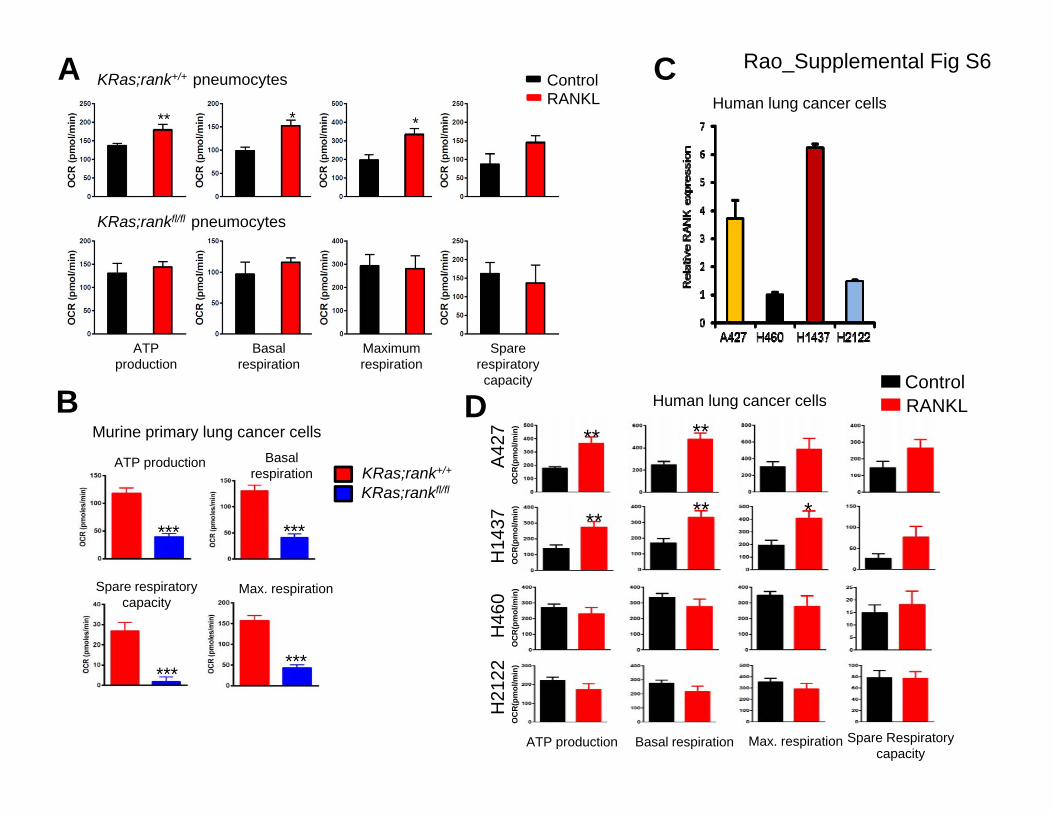
Supplemental Figure S6. RANKL/RANK couple to mitochondrial respiration
in primary pneumocytes and murine and human lung cancer cells.
(A) ATP production, basal respiration, maximal respiration and spare respiratory capacity (mean
values +/- SEM) based on bioenergetics Seahorse profiling of purified primary pneumocytes from
KRas;rank+/+ and KRas;rankfl/fl mice. Purified pneumocytes were infected with AdCre to induce
mutant KRas and to delete RANK in cells with rankfl/fl alleles; these KRas;rank+/+ and
KRas;rankfl/fl cells were then treated with RANKL [1g/ml] for 24 hours and as controls left
without RANKL treatment. A minimum of 5 replicates were analyzed for each condition and
pneumocytes purified from 3 different mice were used independently. *p<0.05, **p<0.01
(Unpaired, two-sided t-test). (B) ATP production, basal respiration, maximal respiration, and spare
respiratory capacity (mean values +/- SEM) based on bioenergetics profiling of purified primary
lung tumor cells from KRas;rank+/+ and KRas;rankfl/fl mice 18 weeks after in vivo AdCre
inhalation. A minimum of 5 replicates (OCR +/- SEM) were analyzed for each condition and
purified primary lung tumor cells from 3 different mice were used independently. See also
Extended Fig. 3d. ***p<0.001 (Unpaired, two-sided t-test). (C) qRT-PCR analysis to determine
RANK mRNA expression in the indicated human lung cancer cell lines. Relative RANK mRNA
5
expression levels (+/- SEM, n = 3) are shown as compared to human peripheral blood mononuclear
cells (value arbitrarily set at 1). (D) Bioenergetics OCR profiling of ATP production, basal
respiration, maximal respiration and spare respiratory capacity based on bioenergetics Seahorse
profiling of the indicated human lung cancer cell lines. Cells were stimulated with RANKL
[1g/ml] for 2 hours (red lines and bars) and as controls left without RANKL treatment (black
lines and bars). Data are all shown as mean values +/- SEM. A minimum of 6 replicates were
analyzed for each condition and lung cancer cell line; experiments were independently repeated 3
times. *p<0.05, **p<0.01 (Unpaired, two-sided t-test).
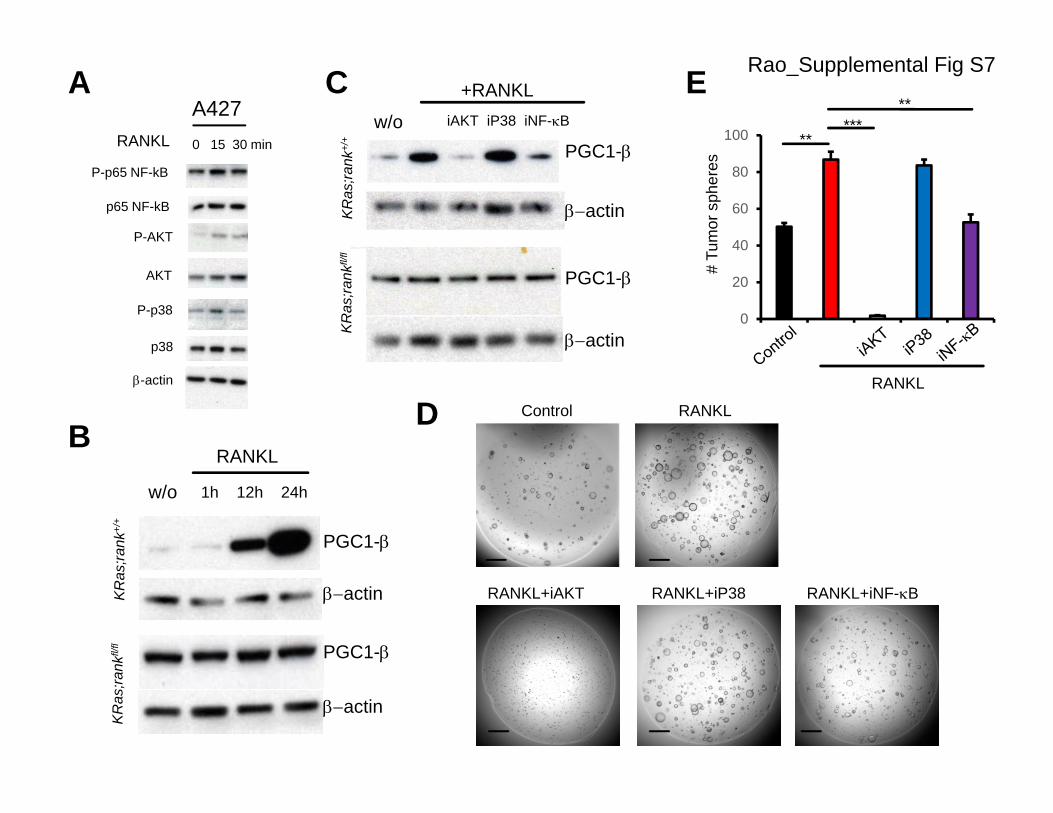
Supplemental Figure S7. RANKL/RANK triggers lung cancer stem-like cells
proliferation and mitochondrial homeostasis.
(A) Western blotting of A427 human lung cancer cells to determine activation of the indicated
signaling pathway in response to RANKL stimulation [1g/ml]. Activation was determined at the
indicated time points using phospho-specific Abs to detect p65 NF-B, AKT and p38-MAPK. The
respective total proteins are shown to control for protein expression. -actin is shown as a loading
control. (B) Western blot analysis of purified KRas;rank+/+ and KRas;rankfl/fl tumor cells to
determine activation of the PGC1in response to RANKL (1g/ml) stimulation, analysed at
indicated time points. -actin is shown as a loading control. (C) Determination of PGC1protein
expression in purified KRas;rank+/+ and KRas;rankfl/fl tumor cells stimulated with RANKL or
RANKL plus inhibitors of AKT, P38 and NF-B, respectively. (D) 3D tumor spheroids assay of
purified KRas;rank+/+ tumor cells treated with RANKL or RANKL plus inhibitors of AKT, P38
6
and NF-B, respectively. 5000 primary tumor cells were seeded. Experiments were performed
with 6 replicates for each condition and repeated with 3 different KRas;rank+/+ mice. Scale bars,
1mm. (E) Quantification (mean values +/- SEM) of tumor spheroids numbers as shown in the
representative images in (D). **p<0.01, ***p<0.001 (Unpaired, two-sided t-test).
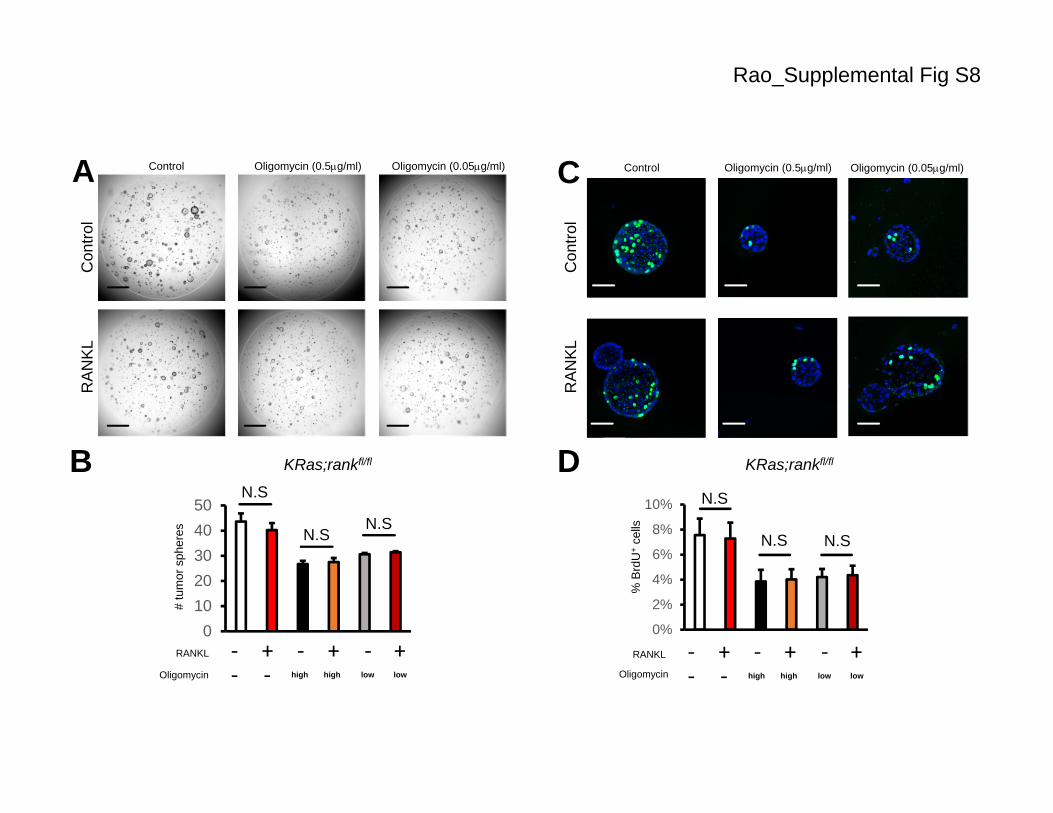
Supplemental Figure S8. RANKL stimulation does not induce enhanced tumor
sphere formation in KRas;rankfl/fl mutant tumor cells.
(A) 3D tumor spheroids assay of purified KRas;rankfl/fl tumor cells treated with RANKL [1g/ml]
or oligomycin alone [low dose is 0.05g/ml, high dose is 0.5g/ml] or RANKL plus different
oligomycin concentrations. 5000 primary tumor cells were seeded. Experiments were performed
with 6 replicates for each condition and repeated with 3 different KRas;rankfl/fl mice. Scale bars,
1mm. (B) Quantifications (mean +/- SEM) of tumor spheroids numbers of (A) N.S, not significant
(Unpaired, two-sided t-test). (C) Representative images for BrdU staining of tumor spheroids
derived from KRas;rankfl/fl primary lung tumor cells, which received no treatment, or were treated
with RANKL alone [1g/ml], oligomycin alone [low dose is 0.05g/ml, high dose is 0.5g/ml]
and RANKL plus different oligomycin concentrations. 5000 primary tumor cells were seeded.
BrdU labelling [10 M/ml] was performed for 2 hours. Experiments were performed with 6
replicates for each condition and repeated with 3 different KRas;rankfl/fl mice. Sections were
counter-stained with DAPI. (D) Quantifications (mean +/- SEM) BrdU+ cells within tumor
spheroids as shown in (C). N.S, not significant (Unpaired, two-sided t-test). Scale bars, 50m.
7
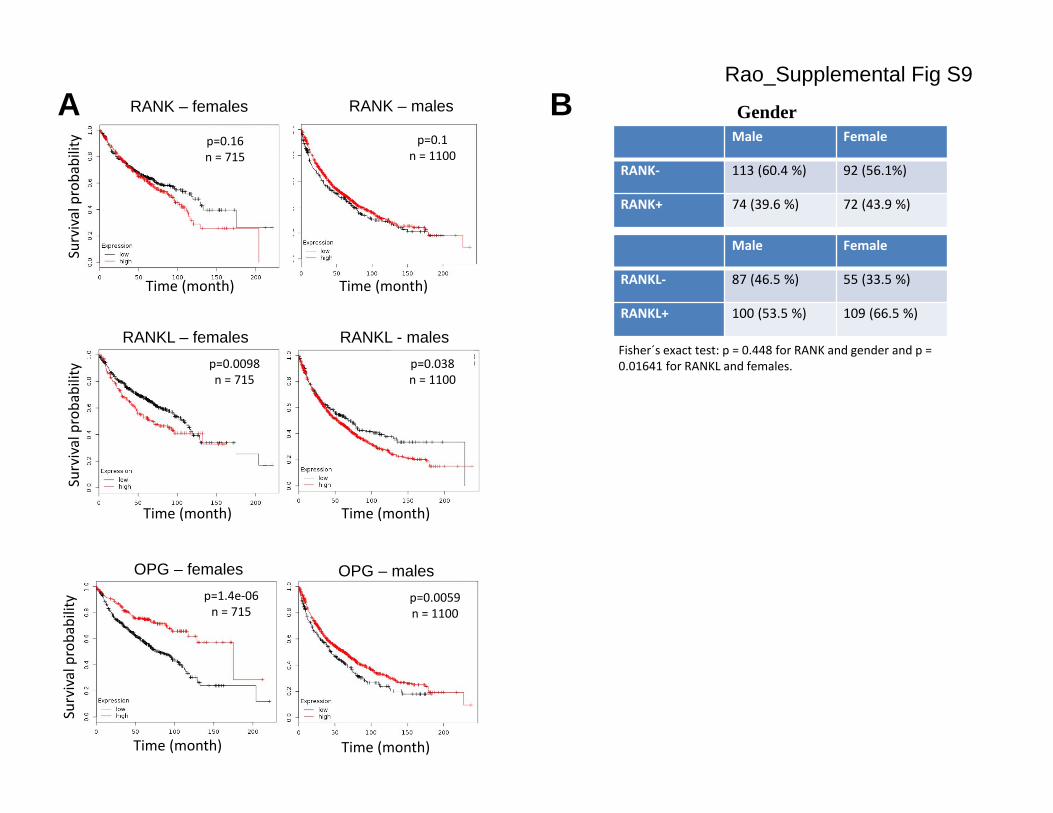
Supplemental Figure S9. RANKL, RANK, and OPG expression in human lung
cancer.
(A) Prediction of overall survival probability in males versus females in the human Affymetrix
lung adenocarcinoma dataset stratified for high (red lines) and low (black lines) RANK, RANKL,
and OPG mRNA expression based on the best fit algorithm for. Data presented were obtained
using KM plotter. P values (log rank test) and total numbers of patients with either low (black
lines) or high (red lines) RANK, RANKL and OPG expression, respectively, are indicated. (B)
Cross-correlation matrixes to compare RANKL and RANK protein expression (determined by
IHC) on human lung tumors with gender. n = 364, ”Uppsala” cohort with early stage treatment-
naïve resected lung cancer, including SCC, AC, SCLC and LCC. P values are indicated, calculated
using the Fisher’s Exact test.
Supplemental Table S1. Significantly enriched c5/GO gene sets (FDR <0.1)
from a GSEA analysis of KRas;rankfl/fl versus KRas;rank+/+ pneumocytes.
P<0.0001
TRAP
U/L
Non-small Cell Lung CancerSmall Cell CarcinomaAdenocarcinoma Squamous Cell Carcinoma
# of samples
% positive
Mean H-score
# of samples
% positive
Mean H-score
# of samples
% positive
Mean H-score
RANK 58 72 60 62 61 20 29 65 63
0.8 1.0 1.2 1.4 1.6 1.80
100
200
300
RANK Flow Cytometry Measurement(Fold Change Over Isotype)
RANK
IHC
HSc
ore
B
Cel
l cou
nts
RANK Isotype
H12
99
nega
tive
cont
rol
PC3
posi
tive
cont
rol
RAN
K+
hum
anlu
ng tu
mor
A
D
C
RA
NK
-IH
CAdenocarcinoma Squamous tumor
E
Rao_Supplemental Fig S1
BSP-C Cre;rank+/+ SP-C Cre;rankf/f
ARANK Control
C D
0
1000
2000
3000
4000
average O2 consum
ption
[ml/h
/kg]
0
1000
2000
3000
4000
average CO
2 prod
uctio
n [m
l/h/kg]
SP-C Cre;KRas;rank+/+
SP-C Cre;KRas;rankf/f
***
0
0.2
0.4
0.6
0.8
1
1.2
1.4
E RANK - IF
KR
as;ra
nkfl/
flK
Ras
;rank
+/+
Rao_Supplemental Fig S2
Rel
ativ
e R
AN
K m
RN
A e
xpre
ssio
n
KRas;rankl+/+ n=26KRas;ranklfl/fl n=17
24.15%
4.93%
A KRas;rank+/+
KRas;rankfl/flC
KR
as;ra
nkl+/
+K
Ras
;rank
lf/f
6 weeks after AdCre inhalation 30 weeks after AdCre inhalation
B Rao_Supplemental Fig S3
Days post AdCre inhalation
Per
cent
sur
viva
l
KRas;rank+/+
KRas;rankfl/fl
BA
C D E
%C
D45
+ce
lls
%Fo
xp3+
of C
D4+
T ce
lls
%C
D45
+B
220+
cells
T cells and NK cells
%C
D45
+ce
lls
Rao_Supplemental Fig S4
A
B
KRas;rankfl/fl
KRas;rank+/+ C Rao_Supplemental Fig S5
KRas;rank+/+ pneumocytes
** * *
KRas;rankfl/fl pneumocytes
RANKLControl
ATP production
Basal respiration
Maximum respiration
Spare respiratory capacity
A
BATP production Basal
respiration
Max. respirationSpare respiratory capacity
*** ***
******
Murine primary lung cancer cells
KRas;rankfl/flKRas;rank+/+
C
** **
** ** *
ControlRANKL
ATP production Basal respiration Max. respiration Spare Respiratory capacity
A42
7H
1437
H46
0H
2122
OC
R(p
mol
/min
)O
CR
(pm
ol/m
in)
OC
R(p
mol
/min
)O
CR
(pm
ol/m
in)
D Human lung cancer cells
Human lung cancer cells
Rao_Supplemental Fig S6
A C
B
P-AKT
AKT
p38
P-p38
-actin
A427RANKL 0 15 30 min
P-p65 NF-kB
p65 NF-kB KR
as;ra
nk+/
+K
Ras
;rank
fl/fl
w/o
+RANKL iAKT iP38 iNF-B
Control RANKL
RANKL+iAKT RANKL+iP38 RANKL+iNF-B
D
0
20
40
60
80
100
actin
PGC1-
actin
PGC1-
E
# Tu
mor
sph
eres
RANKL
*****
**
w/o
RANKL
1h 12h 24h
KR
as;ra
nk+/
+
actin
PGC1-
actin
PGC1-
KR
as;ra
nkfl/
fl
Rao_Supplemental Fig S7
Oligomycin (0.05g/ml)Oligomycin (0.5g/ml)Control
RAN
KLC
ontro
l
Oligomycin (0.05g/ml)Oligomycin (0.5g/ml)Control
RAN
KLC
ontro
l
A
B
C
D
Oligomycin
01020304050
# tu
mor
sph
eres
RANKL + + +‐‐ ‐‐ ‐ lowhigh high low
KRas;rankfl/fl KRas;rankfl/fl
0%
2%
4%
6%
8%
10%
RANKL + + +‐‐ ‐‐ ‐ lowhigh high lowOligomycin
% B
rdU
+ce
lls
Rao_Supplemental Fig S8
N.S
N.SN.S
N.S
N.S N.S
A
RANKL – females RANKL - males
Time (month)
Survival probability p=0.0098
n = 715p=0.038n = 1100
Time (month)
OPG – females
Time (month)
Survival probability p=1.4e‐06n = 715
OPG – males p=0.0059n = 1100
Time (month)
Time (month) Time (month)
RANK – females RANK – males
p=0.16n = 715
p=0.1n = 1100
Survival probability
BRao_Supplemental Fig S9
Male Female
RANK‐ 113 (60.4 %) 92 (56.1%)
RANK+ 74 (39.6 %) 72 (43.9 %)
Male Female
RANKL‐ 87 (46.5 %) 55 (33.5 %)
RANKL+ 100 (53.5 %) 109 (66.5 %)
Fisher´s exact test: p = 0.448 for RANK and gender and p = 0.01641 for RANKL and females.
Gender