Embed Size (px)
Citation preview
0%
10%
20%
30%
40%
50%
60%
Lotus japonicus*
Medicago truncatula*
Glycine max* Malus domestica*
Fragaria vesca*
Manihot esculenta*
Ricinus communis*
Populus trichocarpa*
Arabidopsis lyrata
Carica papaya*
Theobroma cacao*
Vitis vinifera*
Pe
rc
en
tag
e o
f o
rth
olo
gs
wit
h c
on
se
rv
ed
co
nte
xt
Species
Complete
Upstream
Downstream
Supplemental Figure 1. Overview of synteny conservation between Arabidopsis and other dicot
species. This figure shows the percentage of orthologous genes for each Arabidopsis gene for which the flanking genes were conserved by collinearity. Criteria to score collinearity conservation were: 1) whether the genes upstream and/or downstream of the ortholog in the comparator species were orthologous to the genes upstream and/or downstream of the Arabidopsis test gene and 2) whether these orthologs maintained the same relative orientation. In the figure complete (both upstream and downstream)(white box), upstream (grey box) and downstream (black box) conservation is shown. Asterisks indicate species included for phylogenetic footprinting (Arabidopsis lyrata was excluded due to a non-saturated substitution pattern).
Supplemental Data. Van de Velde et al. Plant Cell (2014) 10.1105/tpc.114.127001

Supplemental Figure 2. Distribution of genes that have orthologs in the dicot comparator species for each orthology detection method.The number of Arabidopsis genes with orthologs in different comparator dicot species is depicted for the
integrative orthology (purple boxes) and BHIF method (blue boxes), respectively (left y-axis). A cumulative
overview is also shown for both methods (purple and blue line, respectively) showing the total percentage
of genes for which orthologs could be delineated (right y-axis).
0%
10%
20%
30%
40%
50%
60%
70%
80%
90%
100%
0
2000
4000
6000
8000
10000
12000
14000
16000
18000
20000
0 1 2 3 4 5 6 7 8 9 10 11
Perc
enta
ge o
f gen
es
Num
ber o
f gen
es
Number of species
integrative orthology
BHIF
integrative orthology cumulative
BHIF cumulative
Supplemental Data. Van de Velde et al. Plant Cell (2014) 10.1105/tpc.114.127001
0%
5%
10%
15%
20%
25%
30%
CMM Sigma ACANA Seaweeds 60 Seaweeds 30 Dialign-tx
Rec
over
ed A
tPro
be in
stan
ces
Method
Supplemental Figure 3. Recovery of experimental AtProbe elements using different phylogenetic footprinting approaches.A) For the different phylogenetic footprinting approaches developed in this study, the recovery of AtProbe elements was determined. Black boxes show the percentage of recovered elements while white boxes show the percentage of uniquely recovered elements. The black line shows the cumulative recovery over all methods. B) A venn diagram was constructed for the four methods that recovered AtProbe elements. The number of recovered elements for Sigma are displayed in black, for ACANA in green, for Seaweeds 60 in yellow and for CMM in purple.
0 11
0
0
0 51
1 0
3 0
8
126
CMMSeaweeds 60
Sigma
ACANA
A
B
Supplemental Data. Van de Velde et al. Plant Cell (2014) 10.1105/tpc.114.127001

A B
Supplemental Figure 4. Recovery of AtProbe elements for the CNSs described in this paper (A)
and by Haudry et al. (2013)(B). Black lines denote upstream sequences, colored boxes depict AtProbe elements, and black boxes show significant CNSs.
Supplemental Data. Van de Velde et al. Plant Cell (2014) 10.1105/tpc.114.127001

0%
10%
20%
30%
40%
50%
60%
0
0.5
1
1.5
2
2.5
3
3.5
4
4.5
H3K4me3 H3K4me2 H3K9ac DNase I hypersensitive
sites flower
DNase I hypersensitive
sites leaf
Perc
enta
ge o
verla
p
Fold
enr
ichm
ent
Profiled modification
Supplemental Figure 5. Enrichment and overlap of in vivo functional regions with CNSs.Grey boxes show the fold enrichment of different histone marks and DH sites. Black diamonds show
the percentages of CNSs that overlap with each in vivo functional region dataset.
Supplemental Data. Van de Velde et al. Plant Cell (2014) 10.1105/tpc.114.127001

0
10
20
30
40
50
60
LFY PIF4 FUS3 AP2 BES1 AP1 FLC PRR5 AGL15 PI PIF3 FHY3 SOC1 PIF5 AP3
Fold
enr
ichm
ent
Supplemental Figure 6. Comparison of fold enrichment for in vivo functional binding site regions.Fold enrichment for in vivo functional binding sites is shown for our CNSs dataset (white boxes),
simple motif mapping (grey boxes) and motif mapping within DH sites (black boxes).
Supplemental Data. Van de Velde et al. Plant Cell (2014) 10.1105/tpc.114.127001

Respo
nse t
o extr
acell
ular s
timulu
s
Catabo
lic pr
oces
s
Gener
ation
of pr
ecur
sor m
etabo
lites a
nd en
ergy
Photos
ynthe
sis
Respo
nse t
o stre
ss
Respo
nse t
o abio
tic st
imulu
s
Cellula
r hom
eosta
sis
Secon
dary
metabo
lic pr
oces
s
Trop
ismCell
death
Death
Anatom
ical s
tructu
re m
orph
ogen
esis
Multice
llular
orga
nismal
deve
lopmen
t
Repro
ducti
onPos
t-embr
yonic
deve
lopmen
t
Flower
deve
lopmen
t
Cell di
ffere
ntiati
on
Lipid
metabo
lic pr
oces
s
Respo
nse t
o exte
rnal
stimulu
s
Respo
nse t
o biot
ic sti
mulus
Cell co
mmunica
tion
Signal
trans
ducti
on
Respo
nse t
o end
ogen
ous s
timulu
s
Cell gr
owth
Growth
Carbo
hydr
ate m
etabo
lic pr
oces
s
Tran
slatio
nTr
ansp
ort
Embryo
deve
lopmen
t
Cellula
r com
pone
nt or
ganiz
ation
Cell cy
clePro
tein m
etabo
lic pr
oces
s
Regula
tion o
f gen
e exp
ress
ion, e
pigen
etic
AT1G22640 MYB3 (48)AT5G02030 HB-6,LSN,RPL,BLH9,PNY (437)AT2G41070 EEL,BZIP12,DPBF4 (4)AT3G09230 MYB1 (64)AT5G12870 MYB46 (902)AT4G38620 MYB4 (752)AT3G08500 MYB83 (659)AT5G62380 ANAC101,VND6 (462)AT1G71930 ANAC030,VND7 (449)AT3G61910 ANAC066,NST2 (449)AT1G32770 ANAC012,SND1,NST3 (449)AT2G46770 ANAC043,NST1 (449)AT1G28300 LEC2 (42)AT4G18960 AG (25)AT2G45660 AGL20,SOC1 (158)AT3G54340 AP3,ATAP3 (2041)AT1G20980 SPL14,SPL1R2,FBR6 (31)AT4G37750 CKC,DRG,CKC1,ANT (30)AT5G15800 AGL2,SEP1 (35)AT2G03710 AGL3,SEP4 (15) AT5G61850 LFY3,LFY (1483)AT3G26790 FUS3 (1298)AT4G36990 HSF4,HSFB1 (931)AT3G23240 ERF1 (231)AT5G20240 PI (1382)AT4G36920 FLO2,AP2,FL1 (1714)AT3G44460 ATBZIP67,DPBF2 (812)AT3G45150 TCP16 (85)AT5G39610 ANAC092,ORE1 (281)AT3G24650 SIS10,ABI3 (226)AT1G32640 MYC2,JIN1,JAI1,ZBF1 (650)AT5G13790 AGL15 (4543)AT1G59750 ARF1 (783)AT5G08790 ANAC081,ATAF2 (859)AT1G13260 EDF4,RAV1 (1130)AT5G22220 E2FB,E2F1 (13)AT1G47870 E2FC,ATE2F2 (59)AT5G14960 E2FD,E2L1,DEL2 (59)AT2G36010 E2FA,E2F3 (146)AT3G01330 E2FF,E2L2,DEL3 (133)AT2G47190 MYB2 (129)AT4G31800 WRKY18 (45)AT3G62420 BZIP53 (218)AT2G18160 BZIP2,GBF5 (218)AT4G34590 GBF6,BZIP11,ATB2 (218)AT1G75390 BZIP44 (218)AT5G65210 TGA1 (222)AT1G45249 ABF2,AREB1(264)AT5G11260 TED 5,HY5 (114)AT4G25470 FTQ4,CBF2,DREB1C (114)AT4G36730 GBF1 (106)AT4G01120 GBF2,ATBZIP54 (106)AT2G46270 GBF3 (106)AT2G36270 ABI5,GIA1 (53)AT1G69490 ANAC029,NAP (2)AT3G27920 MYB0,GL1 (39)AT1G51600 GATA28,TIFY2A,ZML2 (50)AT3G24520 HSFC1 (47)AT5G10140 FLC,FLF,AGL25 (153)AT2G20570 GLK1,ATGLK1,GPRI1 (461)AT1G09530 POC1,PAP3,PIF3 (704)AT5G24470 PRR5 (851)AT3G19290 ABF4,AREB2 (368)AT1G49720 ABF1 (573)AT2G43010 PIF4,SRL2 (1643)AT1G19350 BES1,BZR2 (2121)AT3G59060 PIL6,PIF5 (1155)AT3G22170 FHY3 (1841)AT1G69120 AGL7,AP1 (801)AT5G56110 MYB103,MS188,MYB80 (23)AT4G25480 CBF3,DREB1A (12)AT5G05410 DREB2A,DREB2 (10)AT1G68840 TEM2,RAV2,EDF2,RAP2.8 (142)AT3G50060 MYB77 (17)AT2G04880 WRKY1,ZAP1 (18)AT2G22300 SR1,CAMTA3 (20)AT3G56400 WRKY70 (165)AT4G35040 BZIP19 (8)AT2G16770 BZIP23 (8)AT5G07100 WRKY26 (21)AT2G46130 WRKY43 (20)AT5G22570 WRKY38 (20)AT3G10500 ANAC053 (85)AT1G32870 ANAC013 (85)AT1G34180 ANAC016 (85)AT1G34190 ANAC017 (85)AT5G04410 ANAC078 (85)AT5G65310 HB5,ATHB5 (41)AT4G31550 WRKY11 (7)AT3G01470 HAT5,HD-ZIP-1,HB-1 (21)AT5G11590 TINY2 (6)AT3G54320 WRI1,ASML1,WRI (22)AT1G16490 MYB58 (181)AT1G79180 MYB63 (181)AT3G23250 MYB15,ATY19 (45)AT3G49690 MYB84,RAX3 (103)AT1G73805 SARD1 (9)AT5G26920 CBP60G (9)AT2G46830 CCA1 (213)
1e-701 p-value
0.05
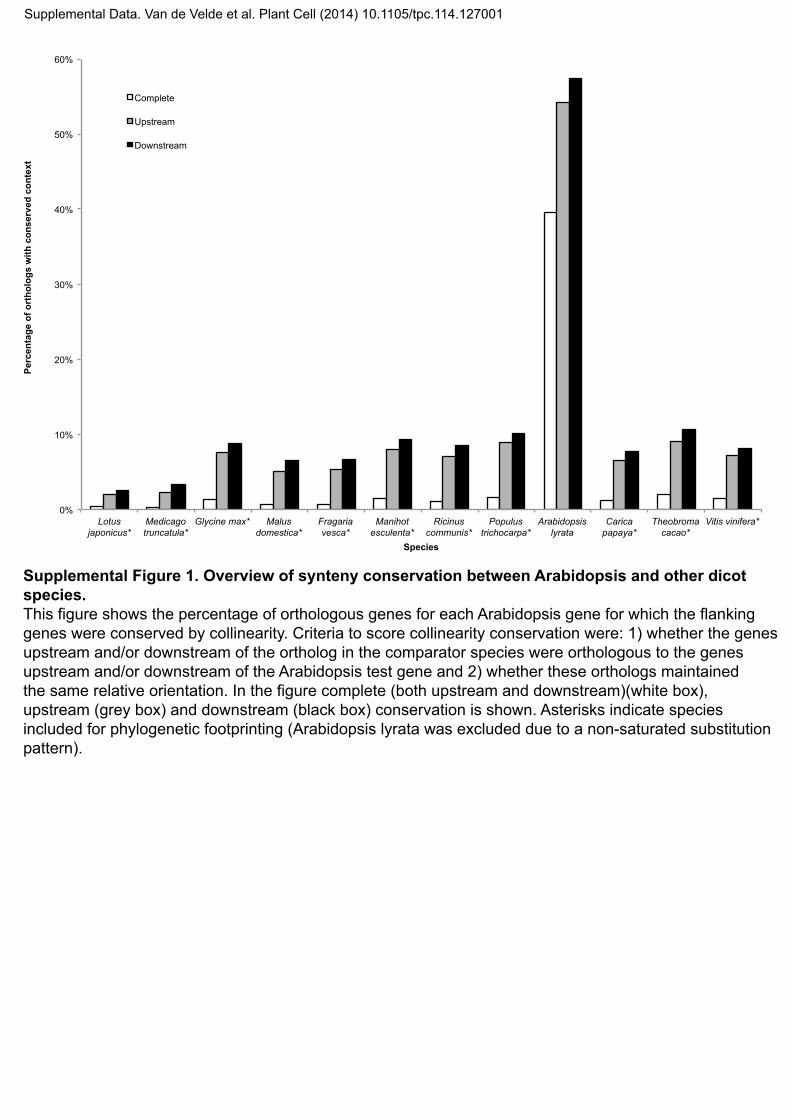
Supplemental Figure 7. GO enrichment for all TF-targets in the predicted GRN.
A heatmap was generated using Genesis that displays, per TF, the enrichment of target genes towardsGO slim annotations (hypergeometric distribution + Bonferroni correction). The number of target genes for each TF is shown in parenthesis. The color gradient shows the p-values of the different enriched gene sets.
Supplemental Data. Van de Velde et al. Plant Cell (2014) 10.1105/tpc.114.127001
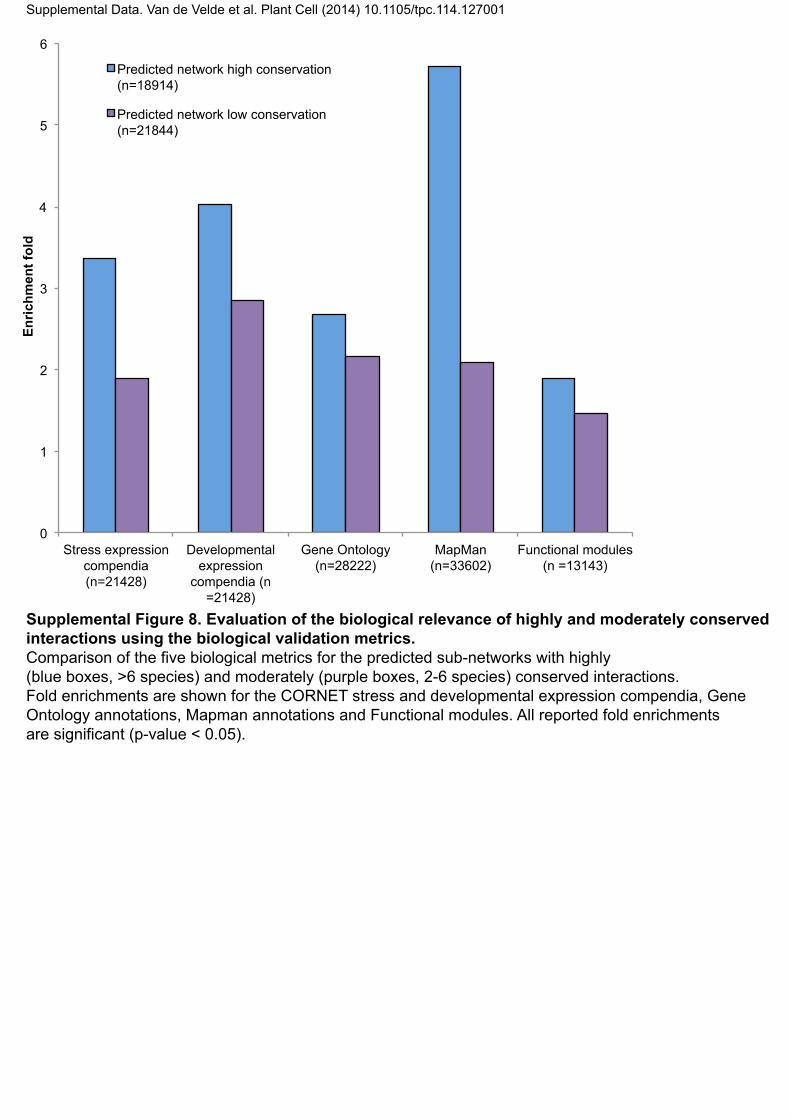
Supplemental Figure 8. Evaluation of the biological relevance of highly and moderately conserved interactions using the biological validation metrics.Comparison of the five biological metrics for the predicted sub-networks with highly
(blue boxes, >6 species) and moderately (purple boxes, 2-6 species) conserved interactions.
Fold enrichments are shown for the CORNET stress and developmental expression compendia, Gene
Ontology annotations, Mapman annotations and Functional modules. All reported fold enrichments
are significant (p-value < 0.05).
0
1
2
3
4
5
6
Stress expression
compendia
(n=21428)
Developmental
expression
compendia (n
=21428)
Gene Ontology
(n=28222)
MapMan
(n=33602)
Functional modules
(n =13143)
Enr
ichm
ent f
old
Predicted network high conservation
(n=18914)
Predicted network low conservation
(n=21844)
Supplemental Data. Van de Velde et al. Plant Cell (2014) 10.1105/tpc.114.127001

TF and type Abiotic Biotic Stress Hormone Development Seed Flower Leaf Root Compendium 2 Whole plant
AT1G16490 MYB58 (34); predicted 0 0.5 0 0.06 0.03 0.03 0.26 0.12 0 0 0AT1G16490 MYB58 (8); experimental 0 0.5 0 0.12 0 0 0.12 0 0 0.25 0AT1G32770 ANAC012 NST3 SND1 (42); experimental 0.02 0.26 0.02 0 0.14 0.12 0.19 0.05 0.07 0.1 0.02AT1G32770 ANAC012 NST3 SND1 (92); predicted 0.11 0.15 0.07 0 0.03 0.05 0.12 0.03 0.37 0.03 0.03AT1G71930 ANAC030 VND7 (146); predicted 0.03 0.15 0.04 0.26 0.01 0.01 0 0.4 0.01 0.07 0.01AT1G71930 ANAC030 VND7 (36); experimental 0.03 0.28 0.06 0.36 0 0 0 0.11 0.06 0.08 0.03AT1G79180 MYB63 (15); experimental 0.13 0.2 0.2 0.2 0 0 0.07 0 0 0.2 0AT1G79180 MYB63 (73); predicted 0.19 0.21 0.23 0.16 0.01 0.01 0.03 0.01 0.01 0.12 0AT2G46770 ANAC043 NST1 (145); predicted 0.03 0.09 0.01 0.11 0.03 0.02 0.07 0.39 0.13 0.12 0AT2G46770 ANAC043 NST1 (8); experimental 0 0.25 0 0 0.12 0.12 0.25 0.12 0.12 0 0AT3G08500 MYB83 (209); predicted 0.01 0.1 0.01 0 0.12 0.15 0.11 0.38 0.11 0 0AT3G08500 MYB83 (8); experimental 0 0.12 0 0 0 0 0.25 0.38 0.12 0.12 0AT3G27920 GL1 MYB0 (7); experimental 0 0.14 0 0 0 0.14 0 0.57 0 0.14 0AT3G27920 GL1 MYB0 (7); predicted 0 0.14 0 0.14 0 0.43 0 0.14 0 0.14 0AT4G36920 AP2 FL1 FLO2 (451); predicted 0.44 0.04 0.45 0.01 0 0.01 0 0 0 0.03 0.01AT4G36920 AP2 FL1 FLO2 (50); experimental 0.44 0 0.46 0.02 0 0 0.04 0 0 0.04 0AT5G11260 HY5 TED 5 (35); experimental 0.23 0.11 0.37 0.17 0 0.03 0 0 0 0.03 0.06AT5G11260 HY5 TED 5 (41); predicted 0.15 0.1 0.44 0.29 0 0 0 0.02 0 0 0AT5G12870 MYB46 (22); experimental 0 0.32 0 0.32 0 0 0.09 0.05 0.05 0.18 0AT5G12870 MYB46 (250); predicted 0.01 0.26 0.01 0.24 0 0.02 0.15 0.22 0 0.07 0.02AT5G13790 AGL15 (9); experimental 0 0.11 0 0.11 0.33 0 0 0.11 0 0.22 0.11AT5G13790 AGL15 (910); predicted 0 0.12 0 0.2 0.07 0.01 0 0.55 0 0.01 0.02AT5G56110 MS188 MYB103 MYB80 (5); predicted 0 0.4 0 0 0.2 0 0 0.2 0 0 0.2AT5G56110 MS188 MYB103 MYB80 (7); experimental 0 0.57 0 0 0.14 0 0 0.14 0 0.14 0AT5G61850 LFY LFY3 (385); predicted 0.01 0 0.01 0.02 0.02 0.48 0.04 0.09 0.22 0.01 0.11AT5G61850 LFY LFY3 (8); experimental 0.12 0 0.25 0 0.12 0 0 0 0.5 0 0AT5G62380 ANAC101 VND6 (161); predicted 0.01 0.19 0 0.19 0.01 0.02 0.11 0.39 0.01 0.06 0.02AT5G62380 ANAC101 VND6 (6); experimental 0 0.67 0 0.17 0 0 0 0.17 0 0 0
Supplemental Figure 9. Comparison between experimental and predicted GRN of
co-expressed target genes in different conditions.
The fraction of target genes showing specific co-expression in each condition is displayed.The color gradient shows the fractions of the target genes. The total number of target genes showing specific co-expression for each TF is shown in parenthesis.
Supplemental Data. Van de Velde et al. Plant Cell (2014) 10.1105/tpc.114.127001

DAN1
QRT3 AGL30
LCB2
MYB101
AP3
VAMP726
NPG1
ANAC055 MYB94
ARAC1
CKX5
TRP1
MPK9
NDL1
MYB32
GA2OX1
AGL11
AGO9
INO
PGP10
SEP1
ATHB9
SEP2
AT4G36600
MAP1A
SLK2
EXO70C2DGK4
AT2G24320
IGI1
AT1G75160
NTT
AT2G40990
GAUT13
GLS2
CPK24AT3G10470
AT5G24940
CDC2C
AT2G22180PERK5
PI
PRK2
DES-1-LIKE
SPL10
EB1B
BP1
FAF2
SPL11
MYB3
EMS1
SPL AMS
NST1
AG
RGL1ARF5
UBP15
ARF8
AT4G33040
WOX3
Hormone ChIP Binding
DE down DE up
Pollen development
Pollen tube development
Meristem development
Hormone response
Anther development
Flower development
Stamen development
Carpel development
Petal development
Transcriptionfactor
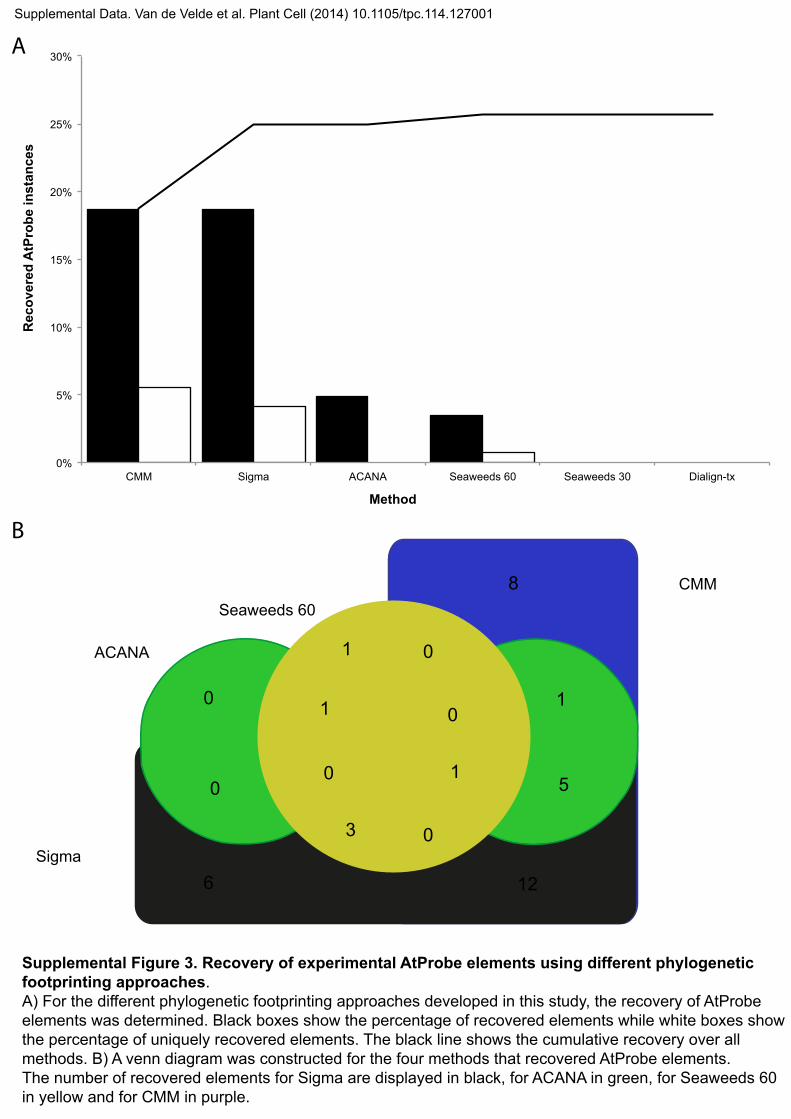
Supplemental Figure 10. A condition-specific GRN for PI and AP3 based on hormone-specific TF-target co-expression edges. Genes that have GO annotations related to flower development are displayed. ChIP-bound regions associated with the target gene are shown as dashed lines while differentially expressed genes are shown by an arrowhead for up-regulation and by a vertical line for down-regulation, respectively. Red diamonds are the source TFs, grey diamonds are target genes that are TFs and rounded rectangles are other targetgenes. Rounded boxes depict different GO biological processes.
Supplemental Data. Van de Velde et al. Plant Cell (2014) 10.1105/tpc.114.127001